-
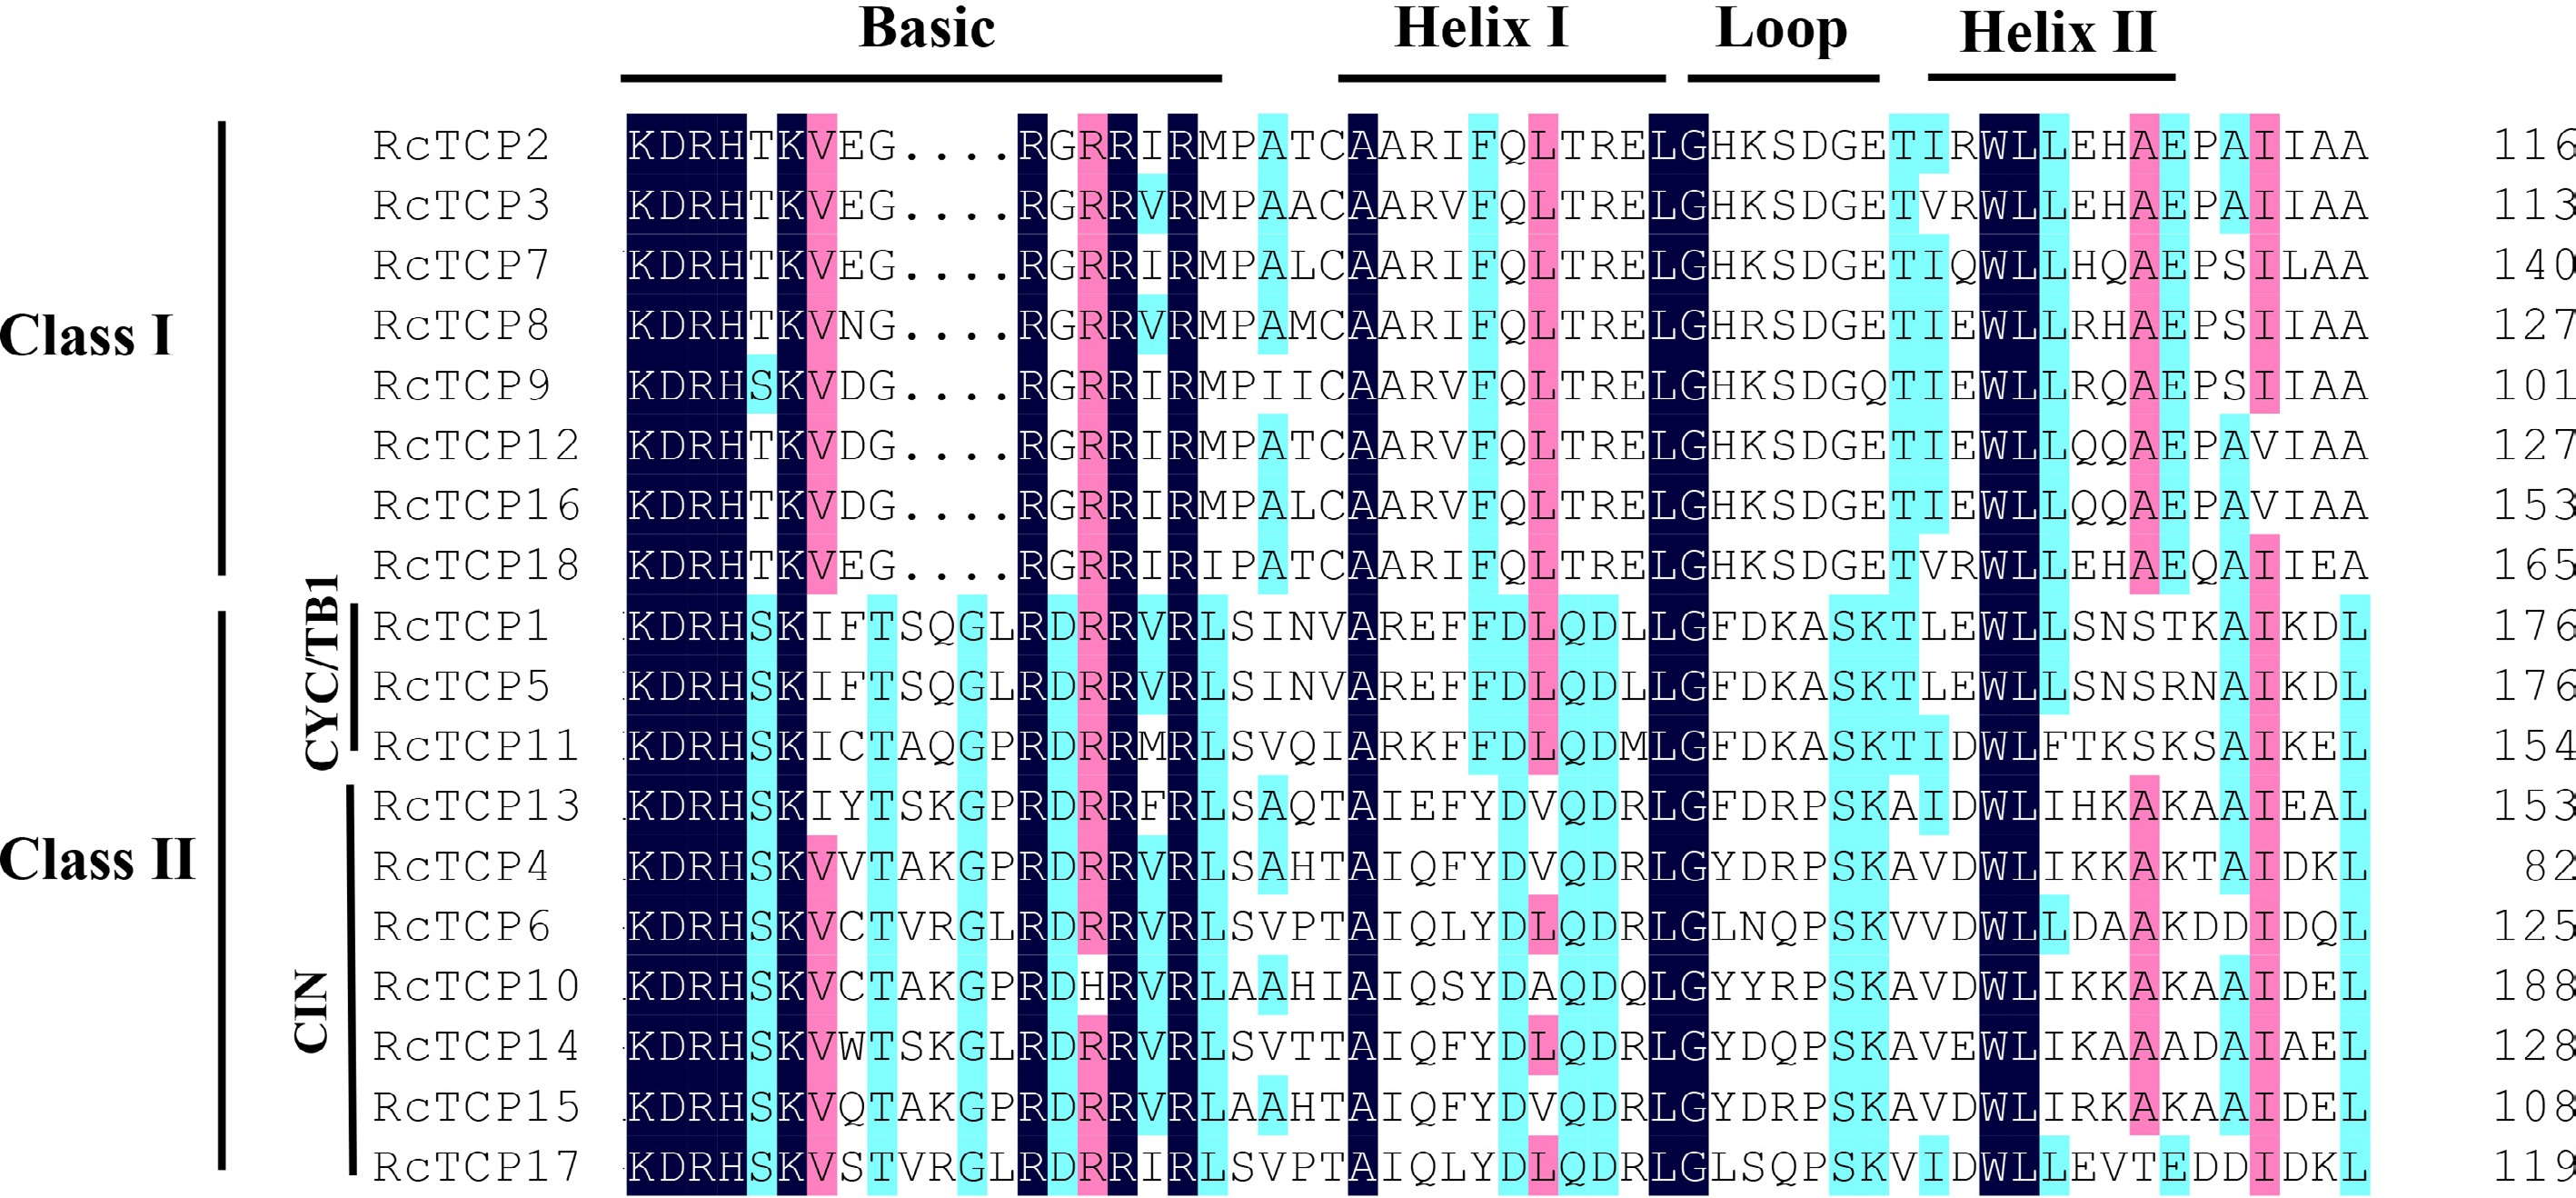
Figure 1.
Protein sequence alignment of the RcTCP family members. Black, red and blue indicate different identities.
-
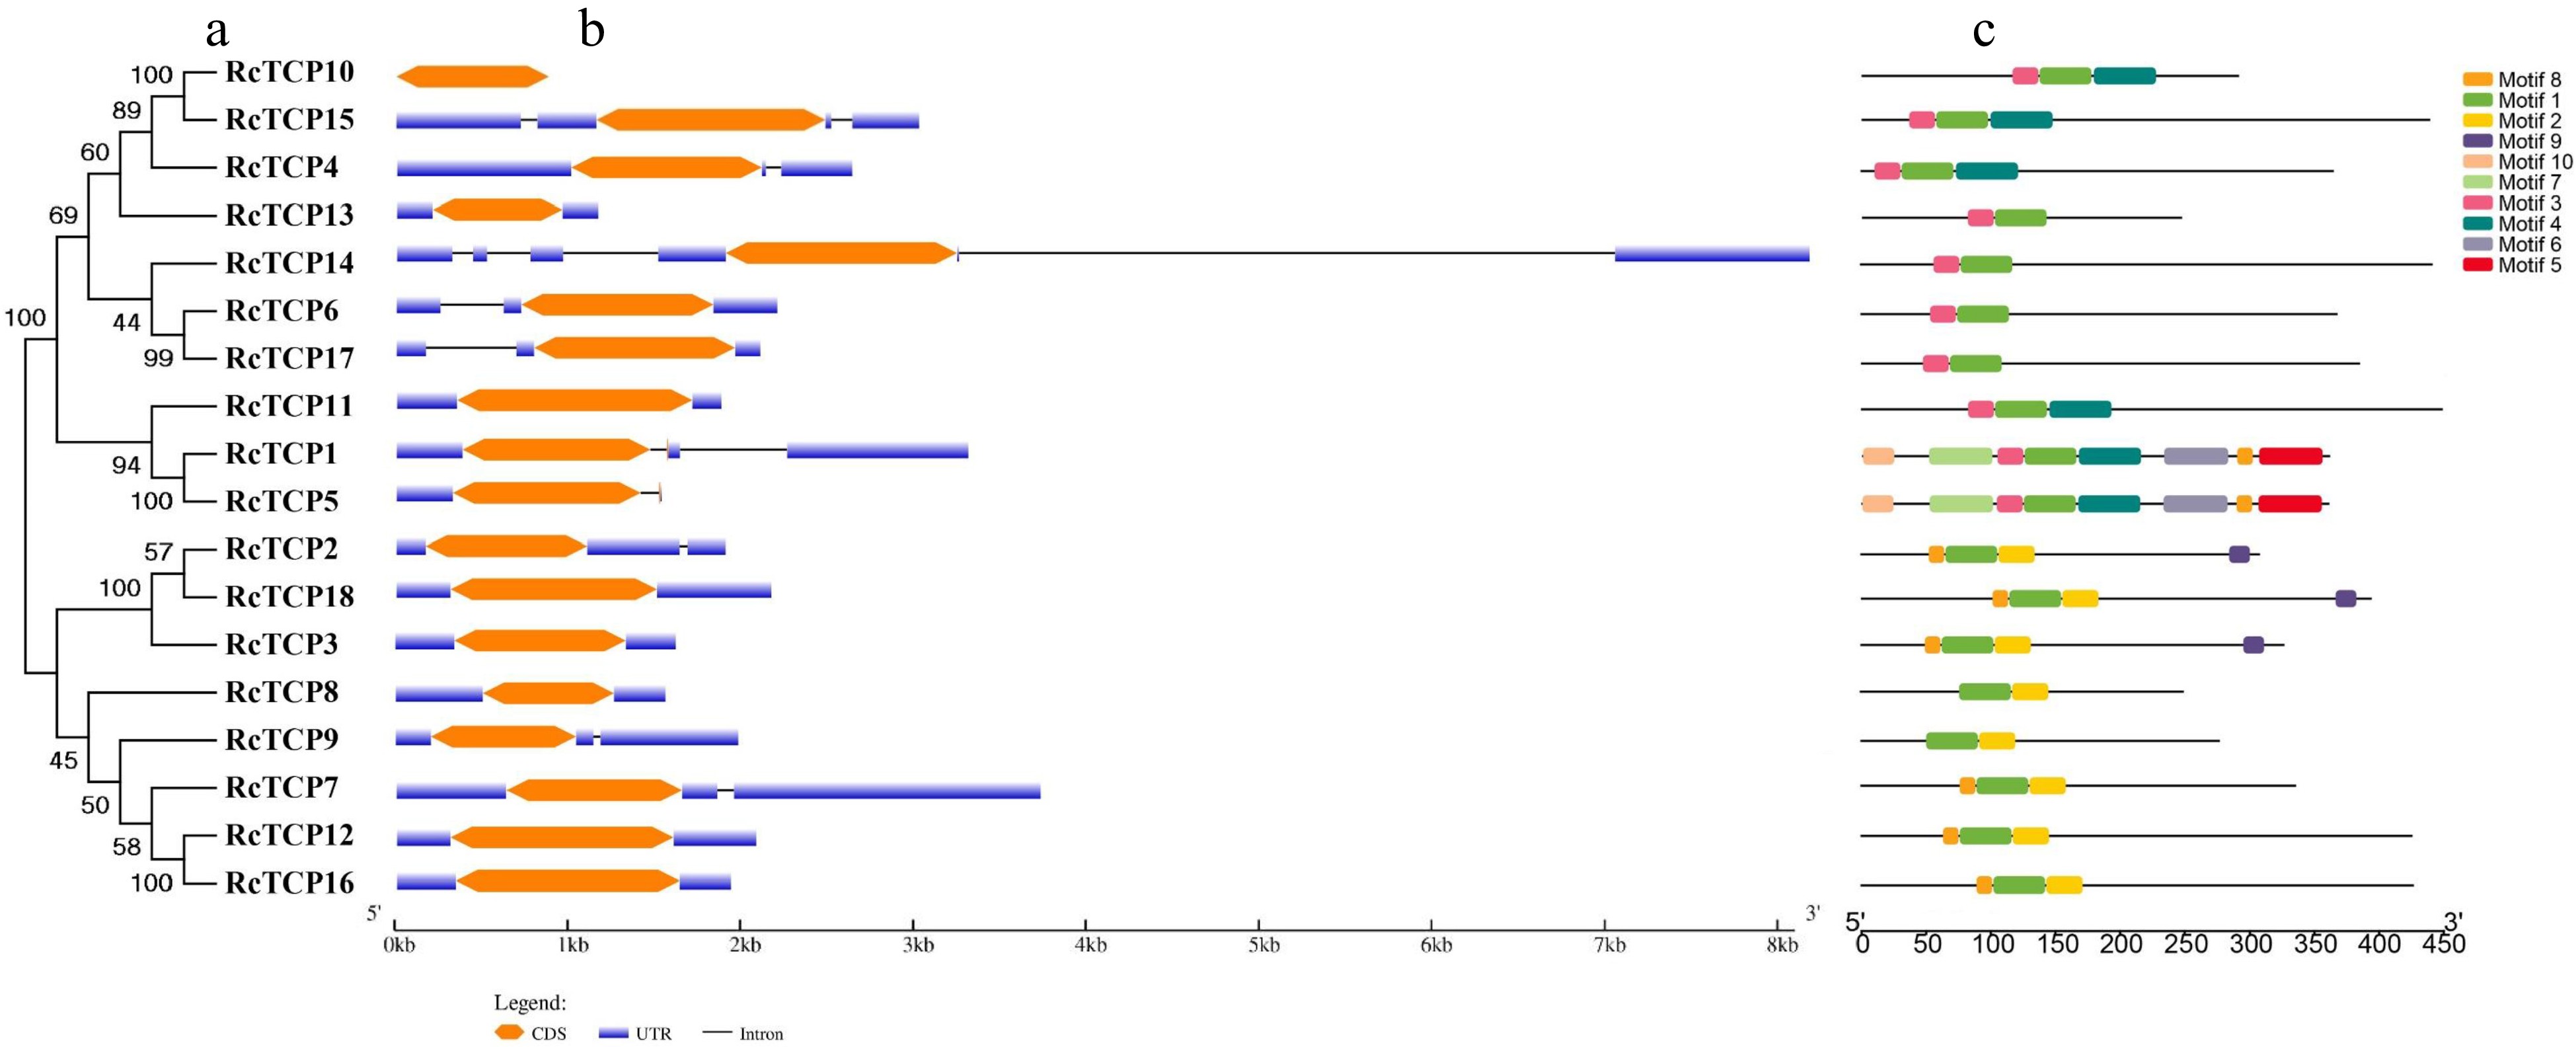
Figure 2.
Phylogenetic tree, conserved motif and gene structure analysis of TCP family members in R. chinensis. (a) A phylogenetic tree comprising RcTCP family proteins was constructed (1,000 replicates of the bootstrap test). (b) Exon–intron structures of RcTCP family members. Blue indicates 5′ and 3′ untranslated regions (UTRs), orange indicates exons, and black indicates introns. (c) Distribution of conserved motifs in RcTCP family members. Different colors and numbers represent different motifs (1 to 10).
-

Figure 3.
Phylogenetic analysis of the TCP transcription factors in R. chinensis, Arabidopsis thaliana, and Pyrus bretschneideri. The phylogenetic tree was constructed according to the Maximum Likelihood method (1,000 replicates of the bootstrap test) using MEGA 6.0. Blue, red, and purple indicate the PCF, CIN, and CYC/TB1 clades, respectively.
-
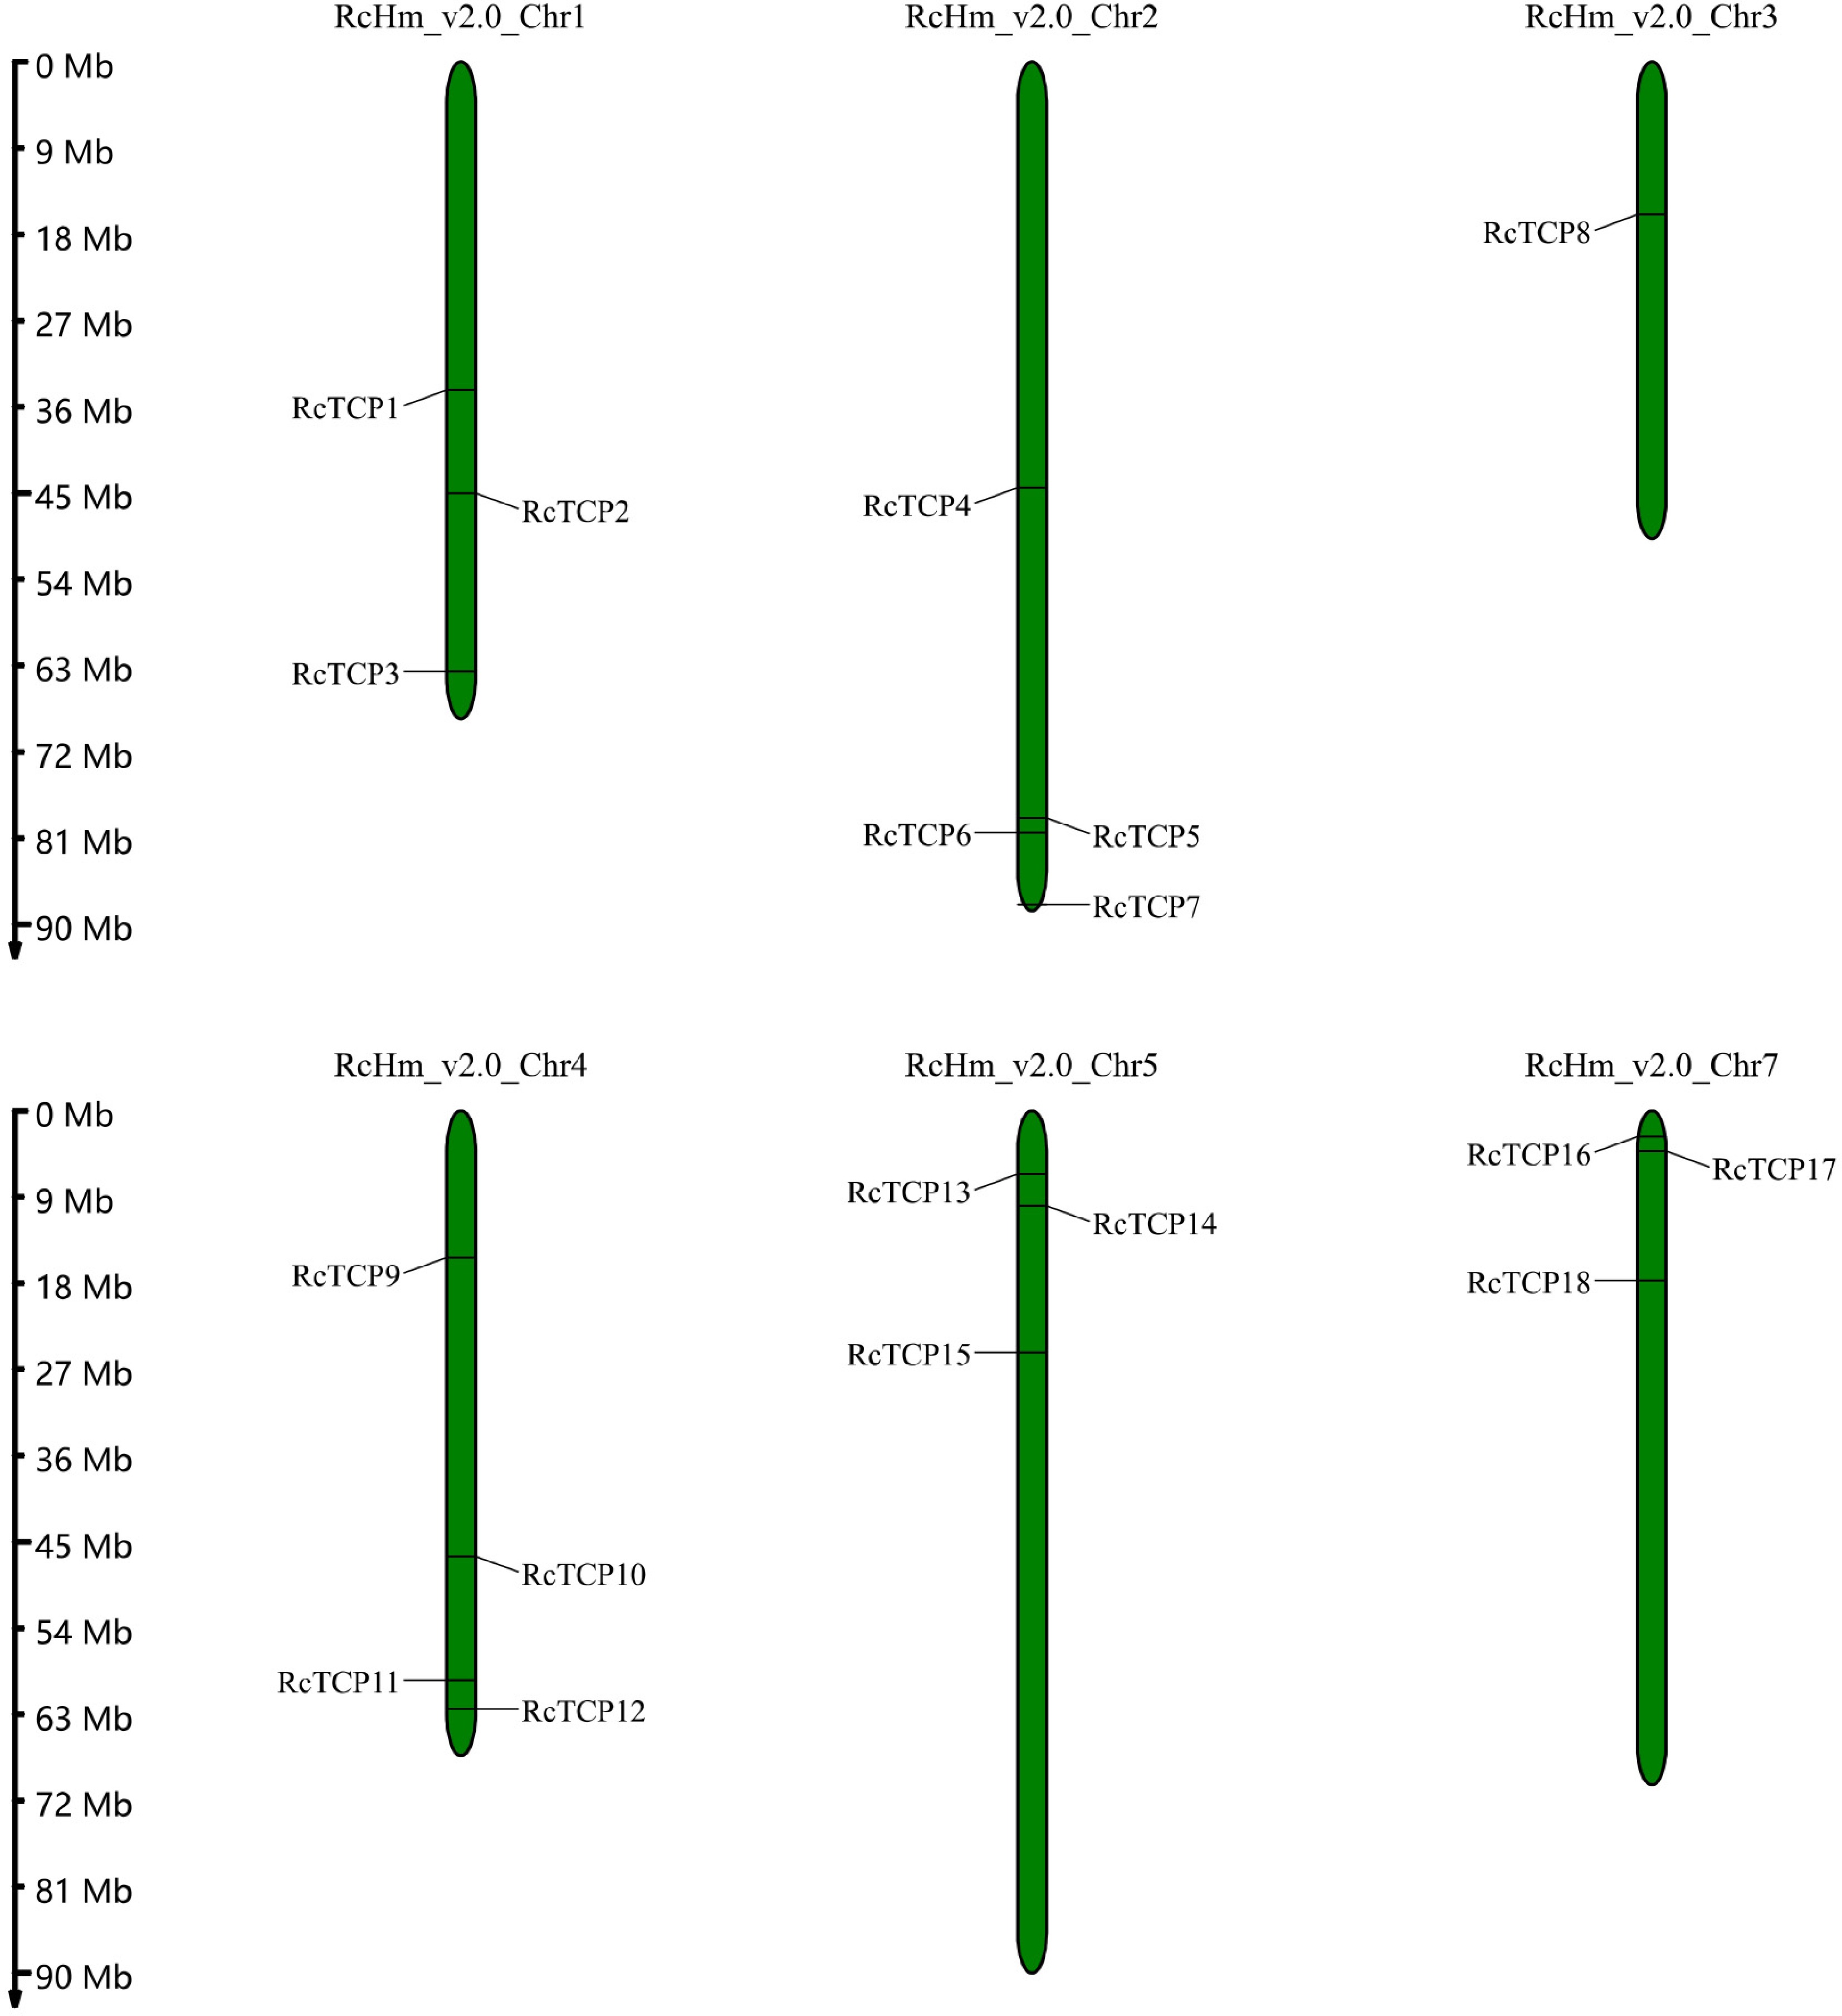
Figure 4.
Chromosomal locations of RcTCP genes. The numbers on the left side of the bars indicate the approximate physical location of the first exon of the corresponding RcTCP gene on rose chromosomes.
-

Figure 5.
Predicted cis-acting elements in RcTCP promoters. Promoter sequences (−2,000 bp) of the 18 RcTCP genes were analyzed using PlantCARE. The scale at the bottom presents the nucleotide positions upstream of the translation start site.
-

Figure 6.
RcTCP expression profiles in response to (a) drought, (b) heat stress and (c) salt stress. The log2-transformed FPKM values for the RcTCP genes were used to construct a heatmap with the HemI software. (a) GH1: 30 d after initiating the drought treatment; GH2: 60 d after initiating the drought treatment. (b) H 0h, H 0.5h, H 2h, H 6h, H 12h: heat treatment for 0, 0.5, 2, 6, 12 h. (c) Salt stress for 0, 2, 24, 48 h.
-

Figure 7.
RcTCP expression profiles in response to (a) powdery mildew and (b) B. cinerea. The log2-transformed FPKM values for the RcTCP genes were used to construct a heatmap with HemI software. (a) RPMR0, RPMR3 represent powdery mildew treatment of resistant genotype 'IIHRR13-4' for 0 and 32 h, respectively. The SCON0, SCON3, SCON7 represent powdery mildew treatment of susceptible cultivar 'Confetti' for 0, 32 and 72 h. (b) CK-30 h, CK-48 h: petal with PDB for 30 and 48 h, TR-30 h, TR-48 h: petal with B. cinerea 30 and 48 hpi.
-
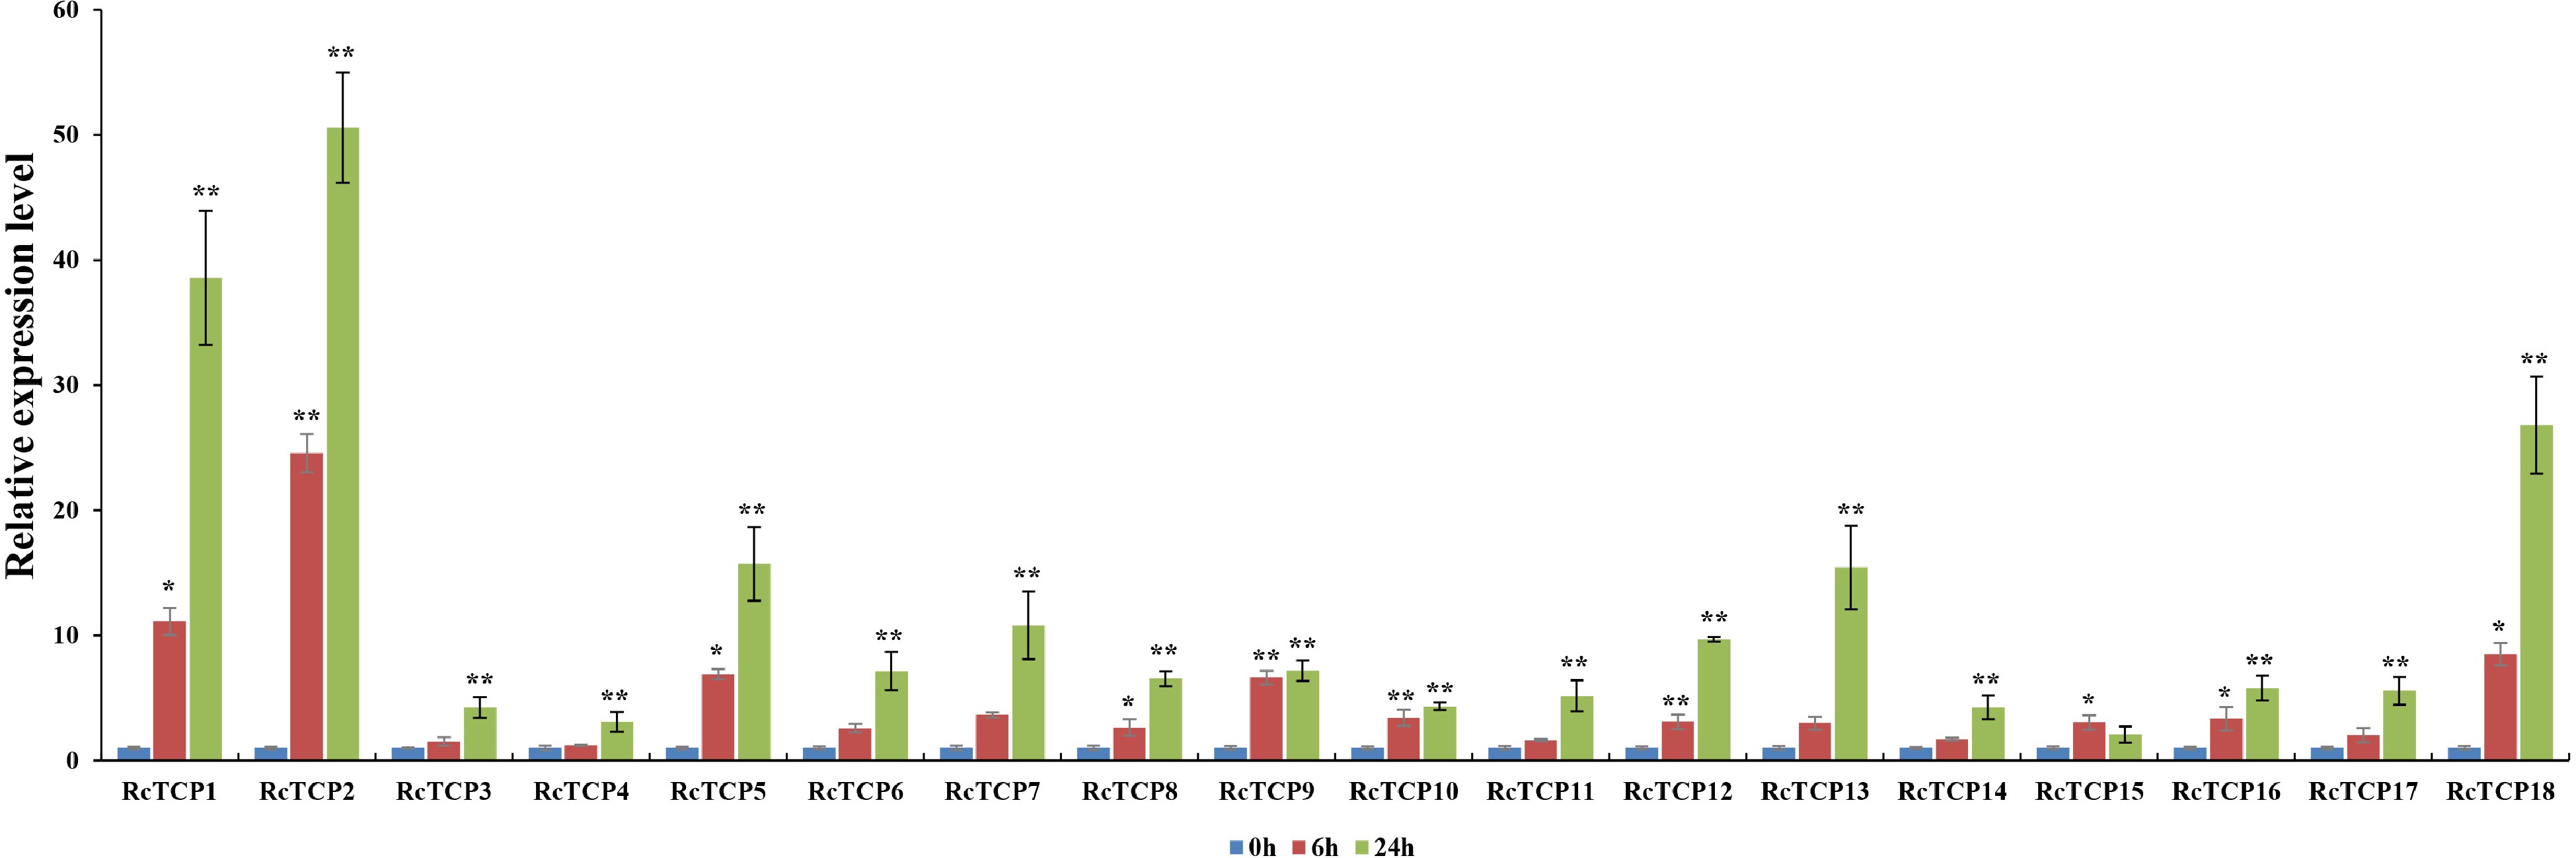
Figure 8.
RcTCP expression profiles in response to an A. alternata infection. 0 h, 6 h, 24 h: A. alternate treatment for 0, 6 and 24 h. The error bars indicate SEs (n = 3). * Significant difference: P < 0.05, ** Significant difference: P < 0.01.
Figures
(8)
Tables
(0)