-
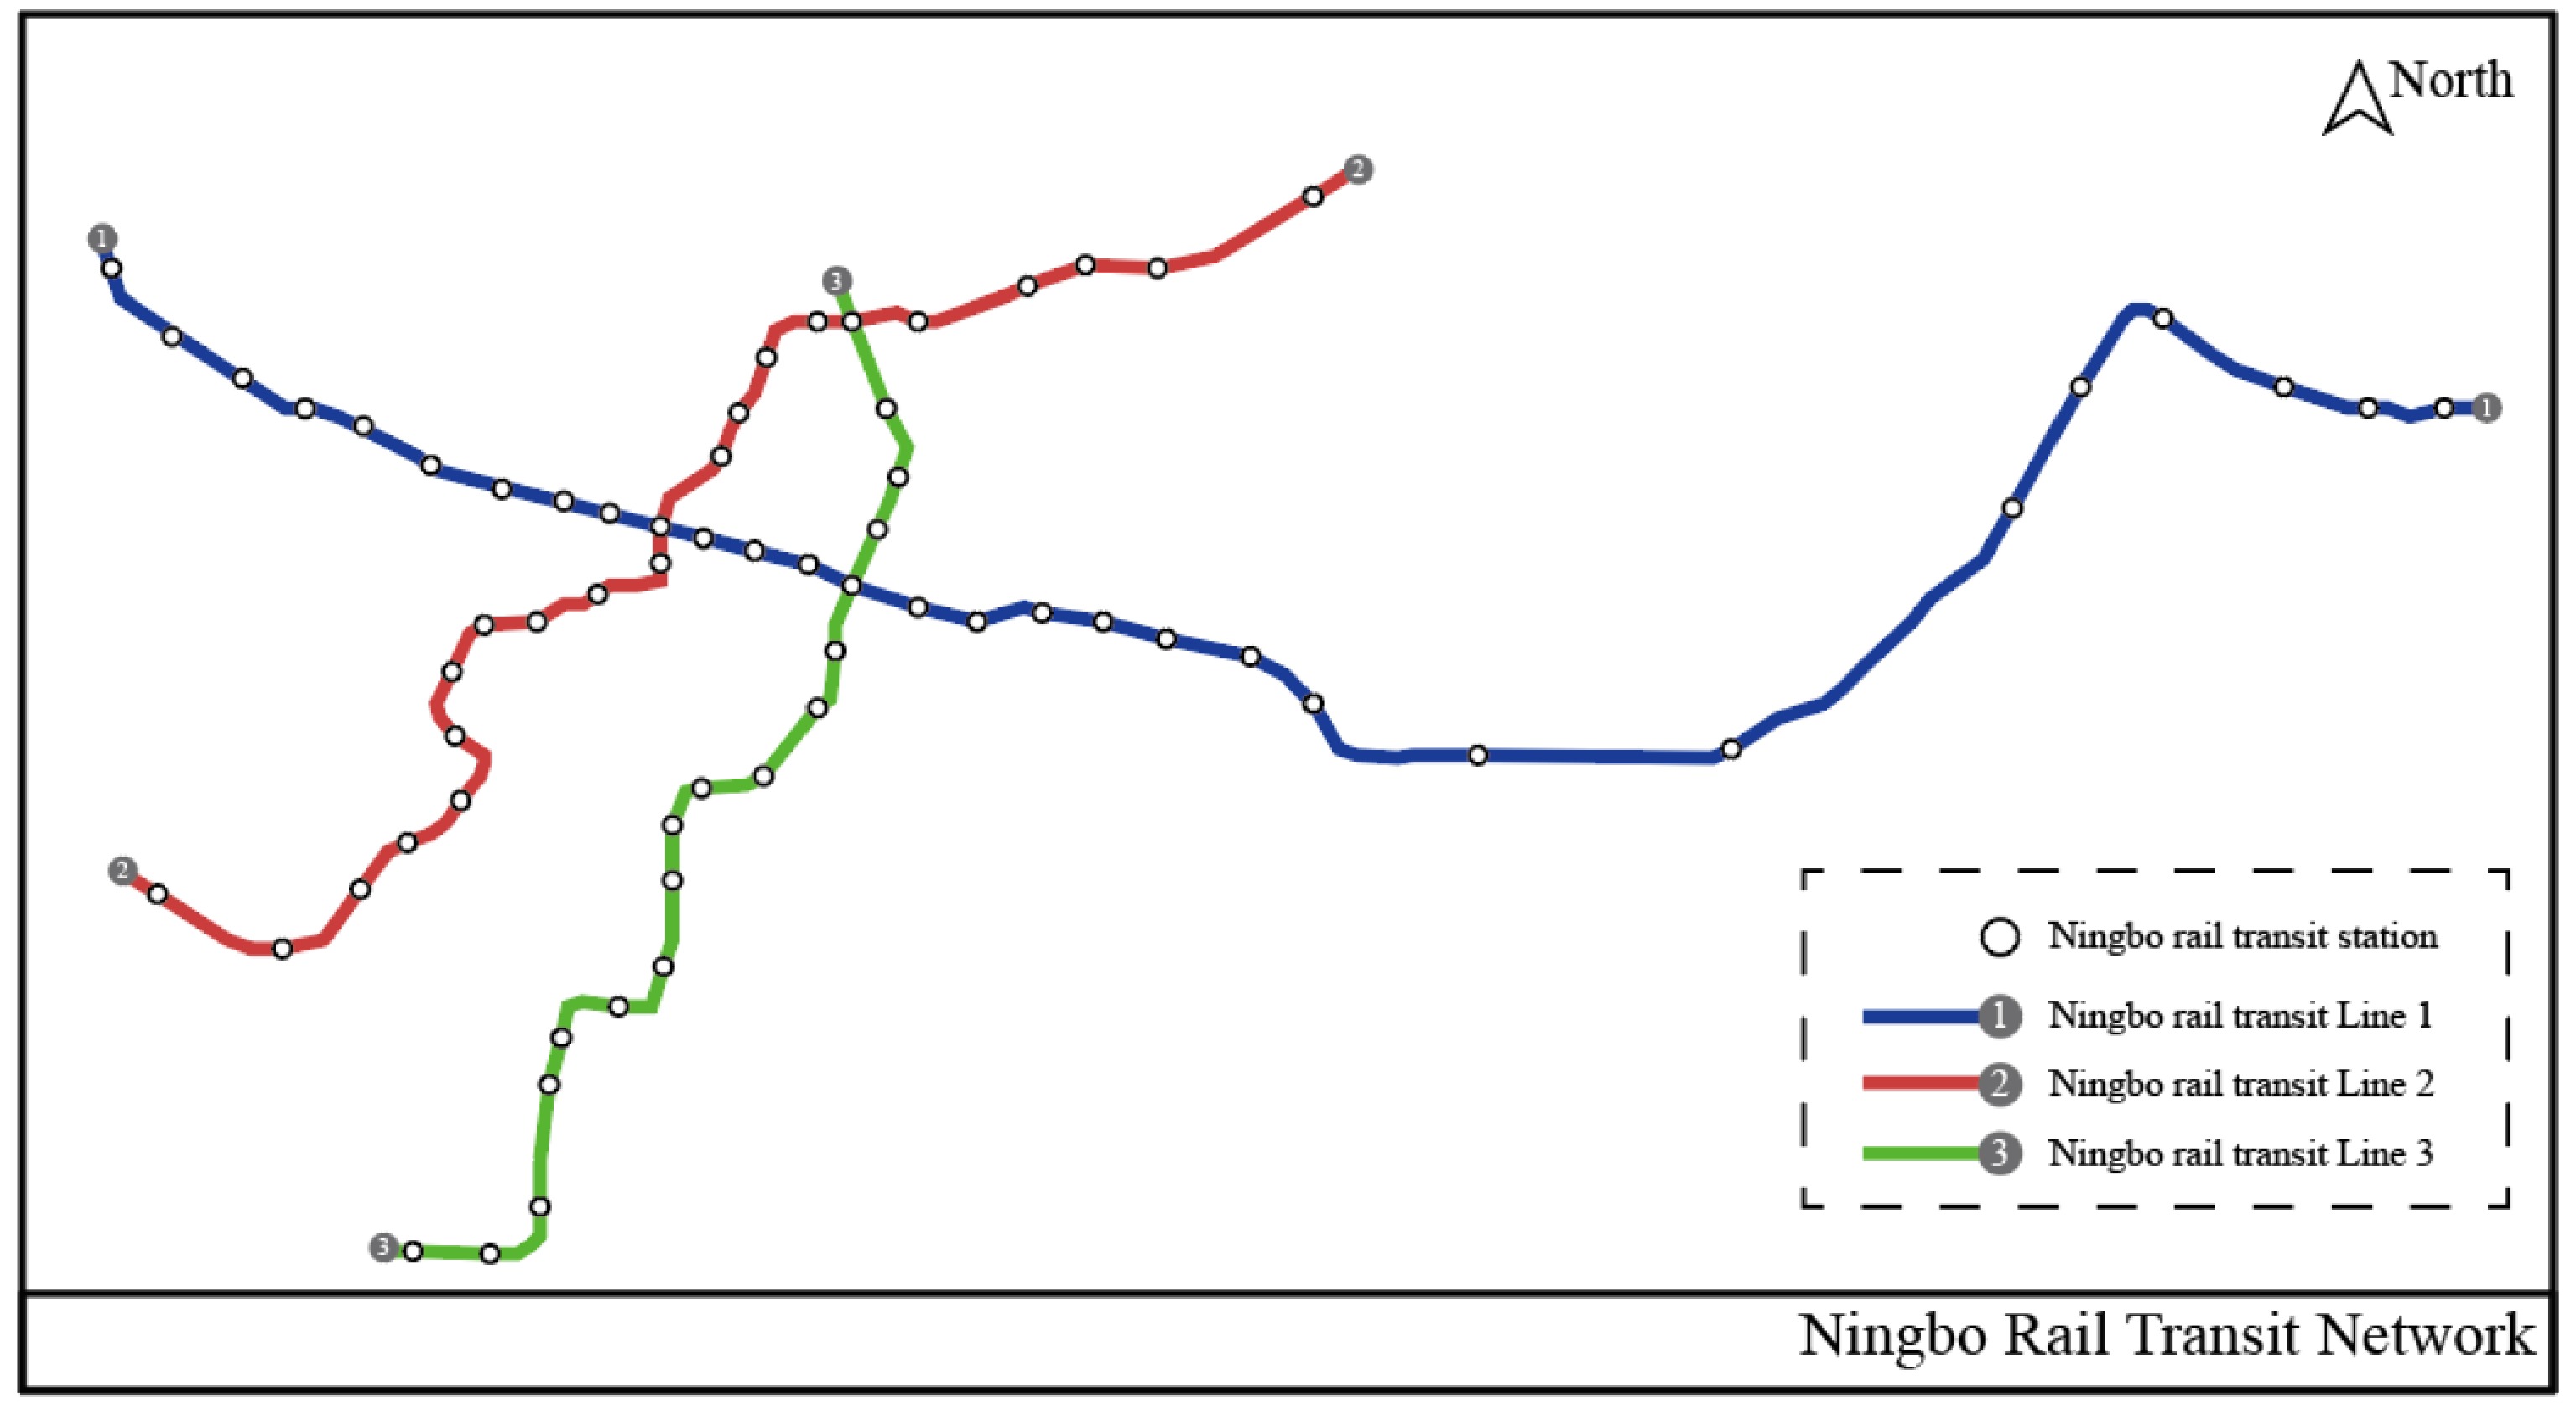
Figure 1.
Line map of Ningbo Rail Transit Line 1, Line 2 and Line 3.
-
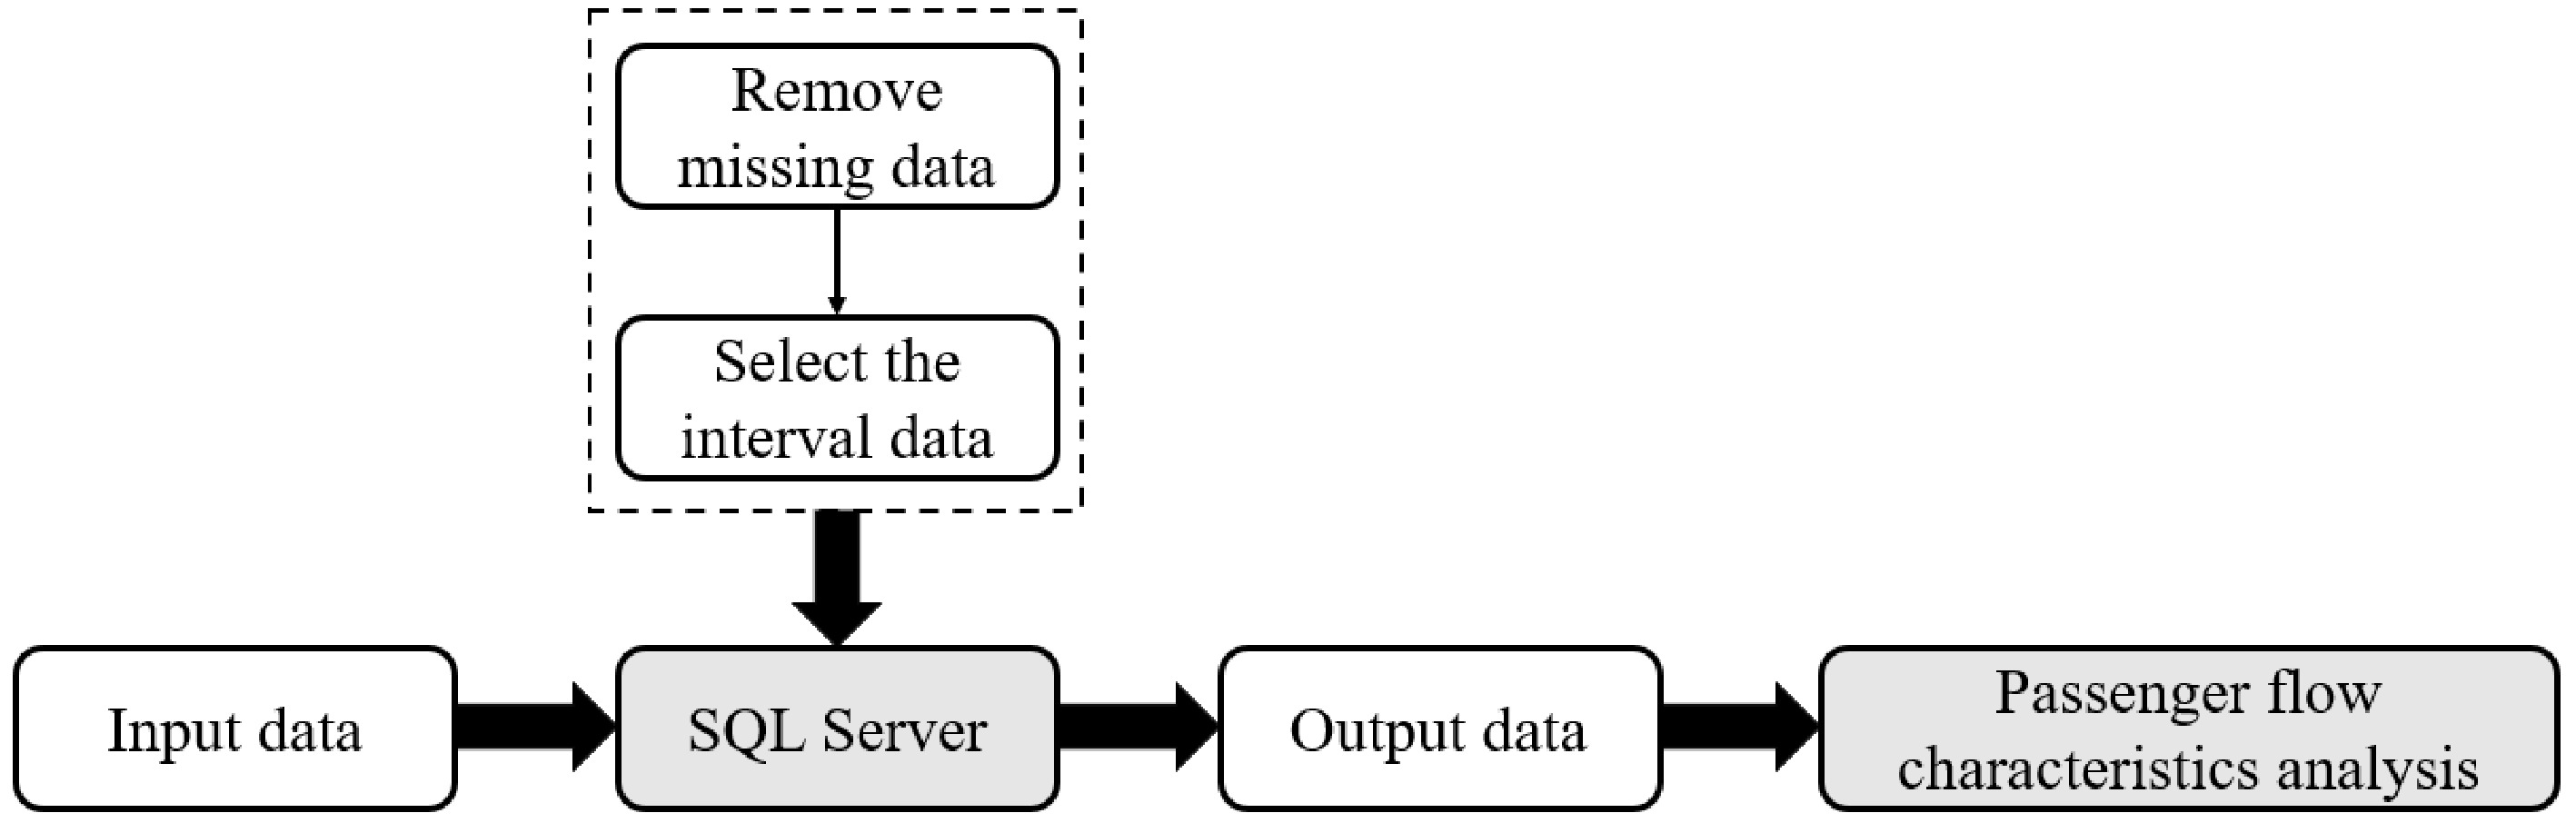
Figure 2.
Data analysis flow chart.
-
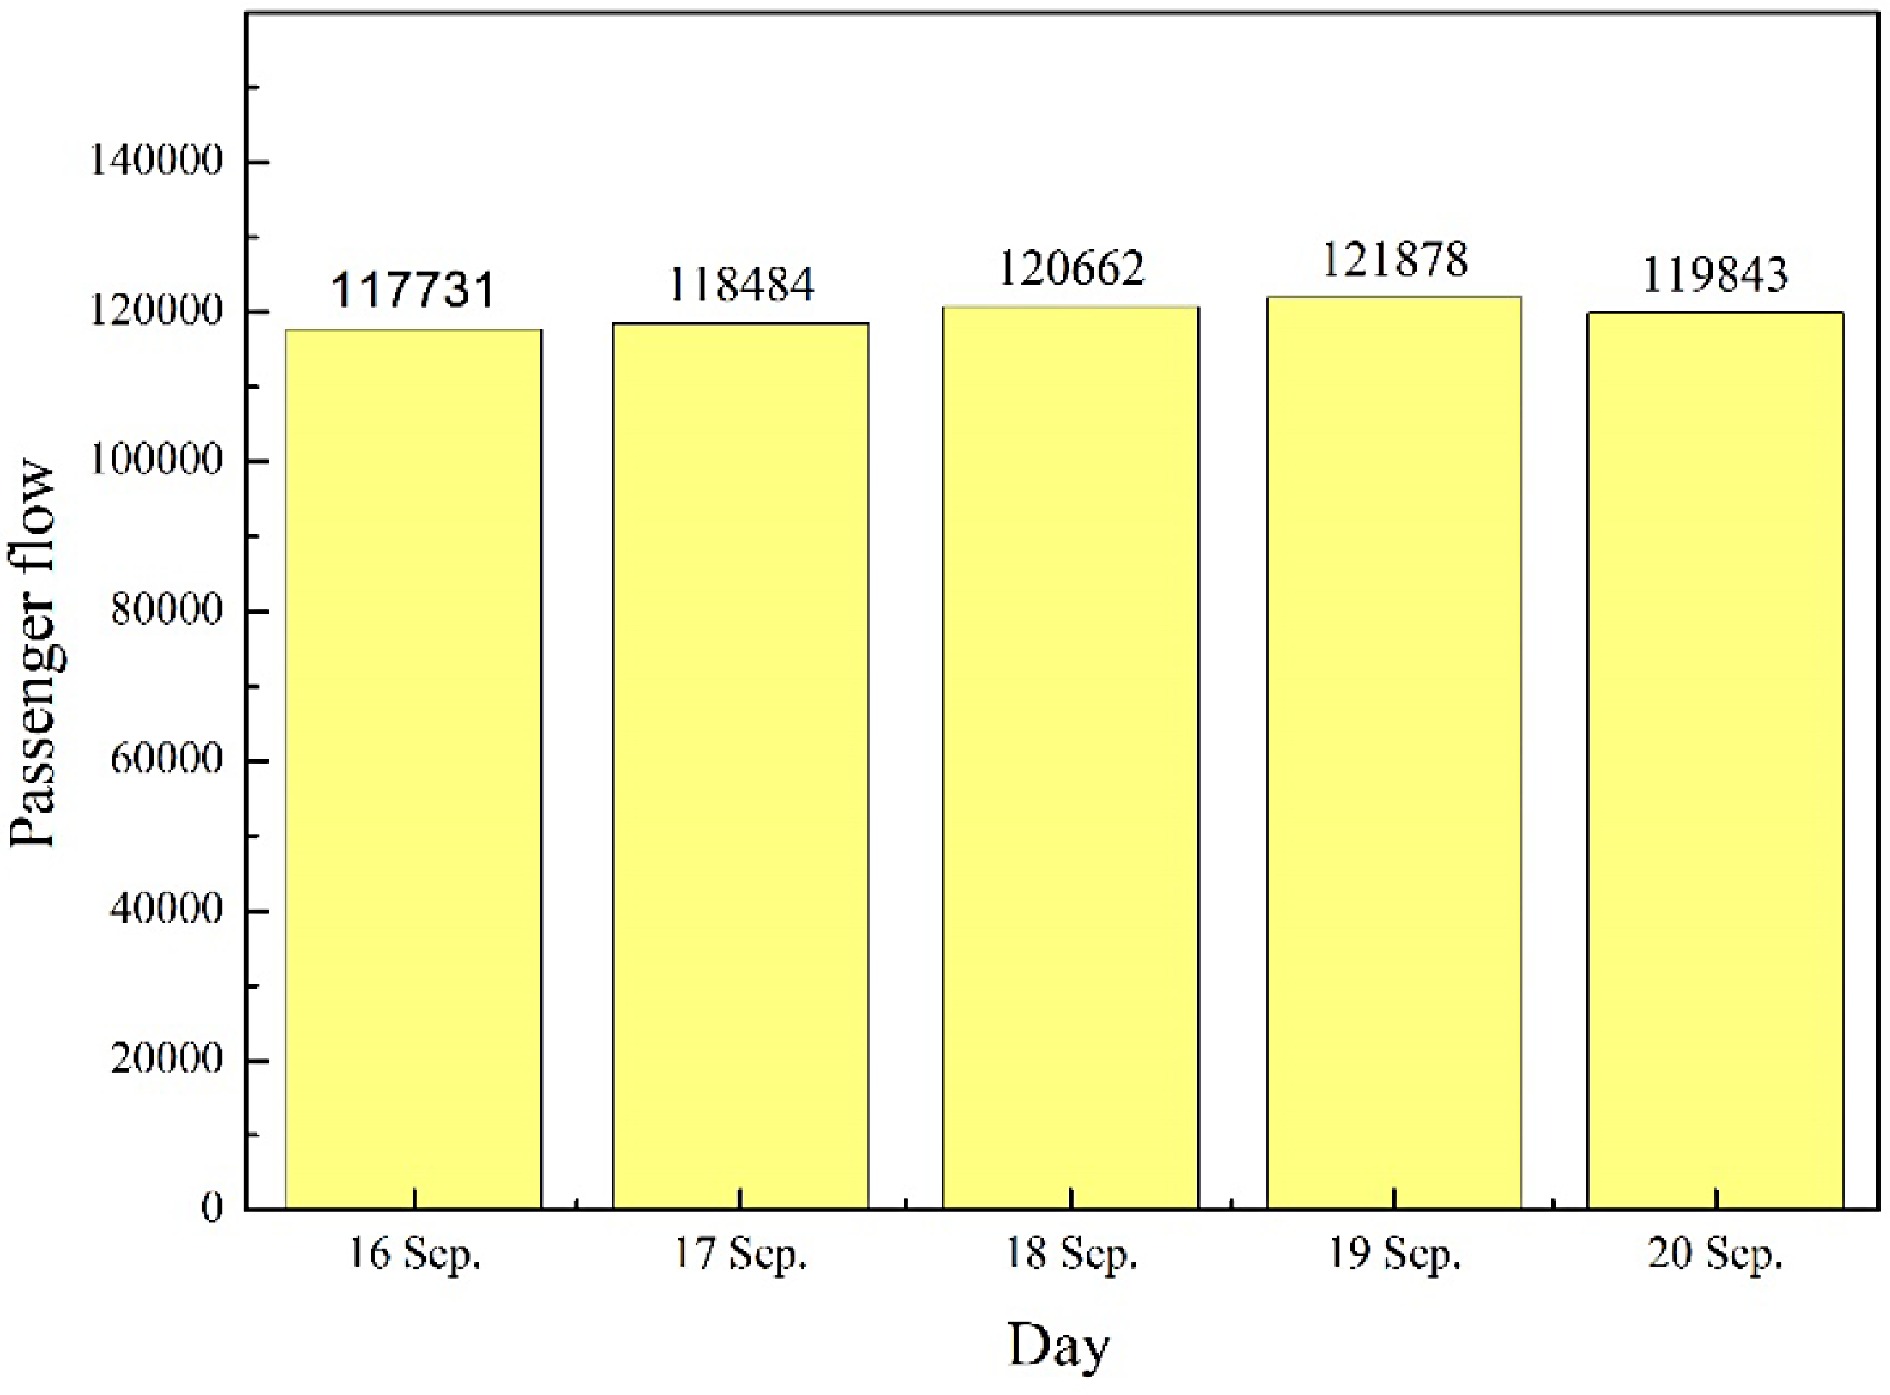
Figure 3.
Five-day total passenger flow histogram of rail transit through Ningbo.
-
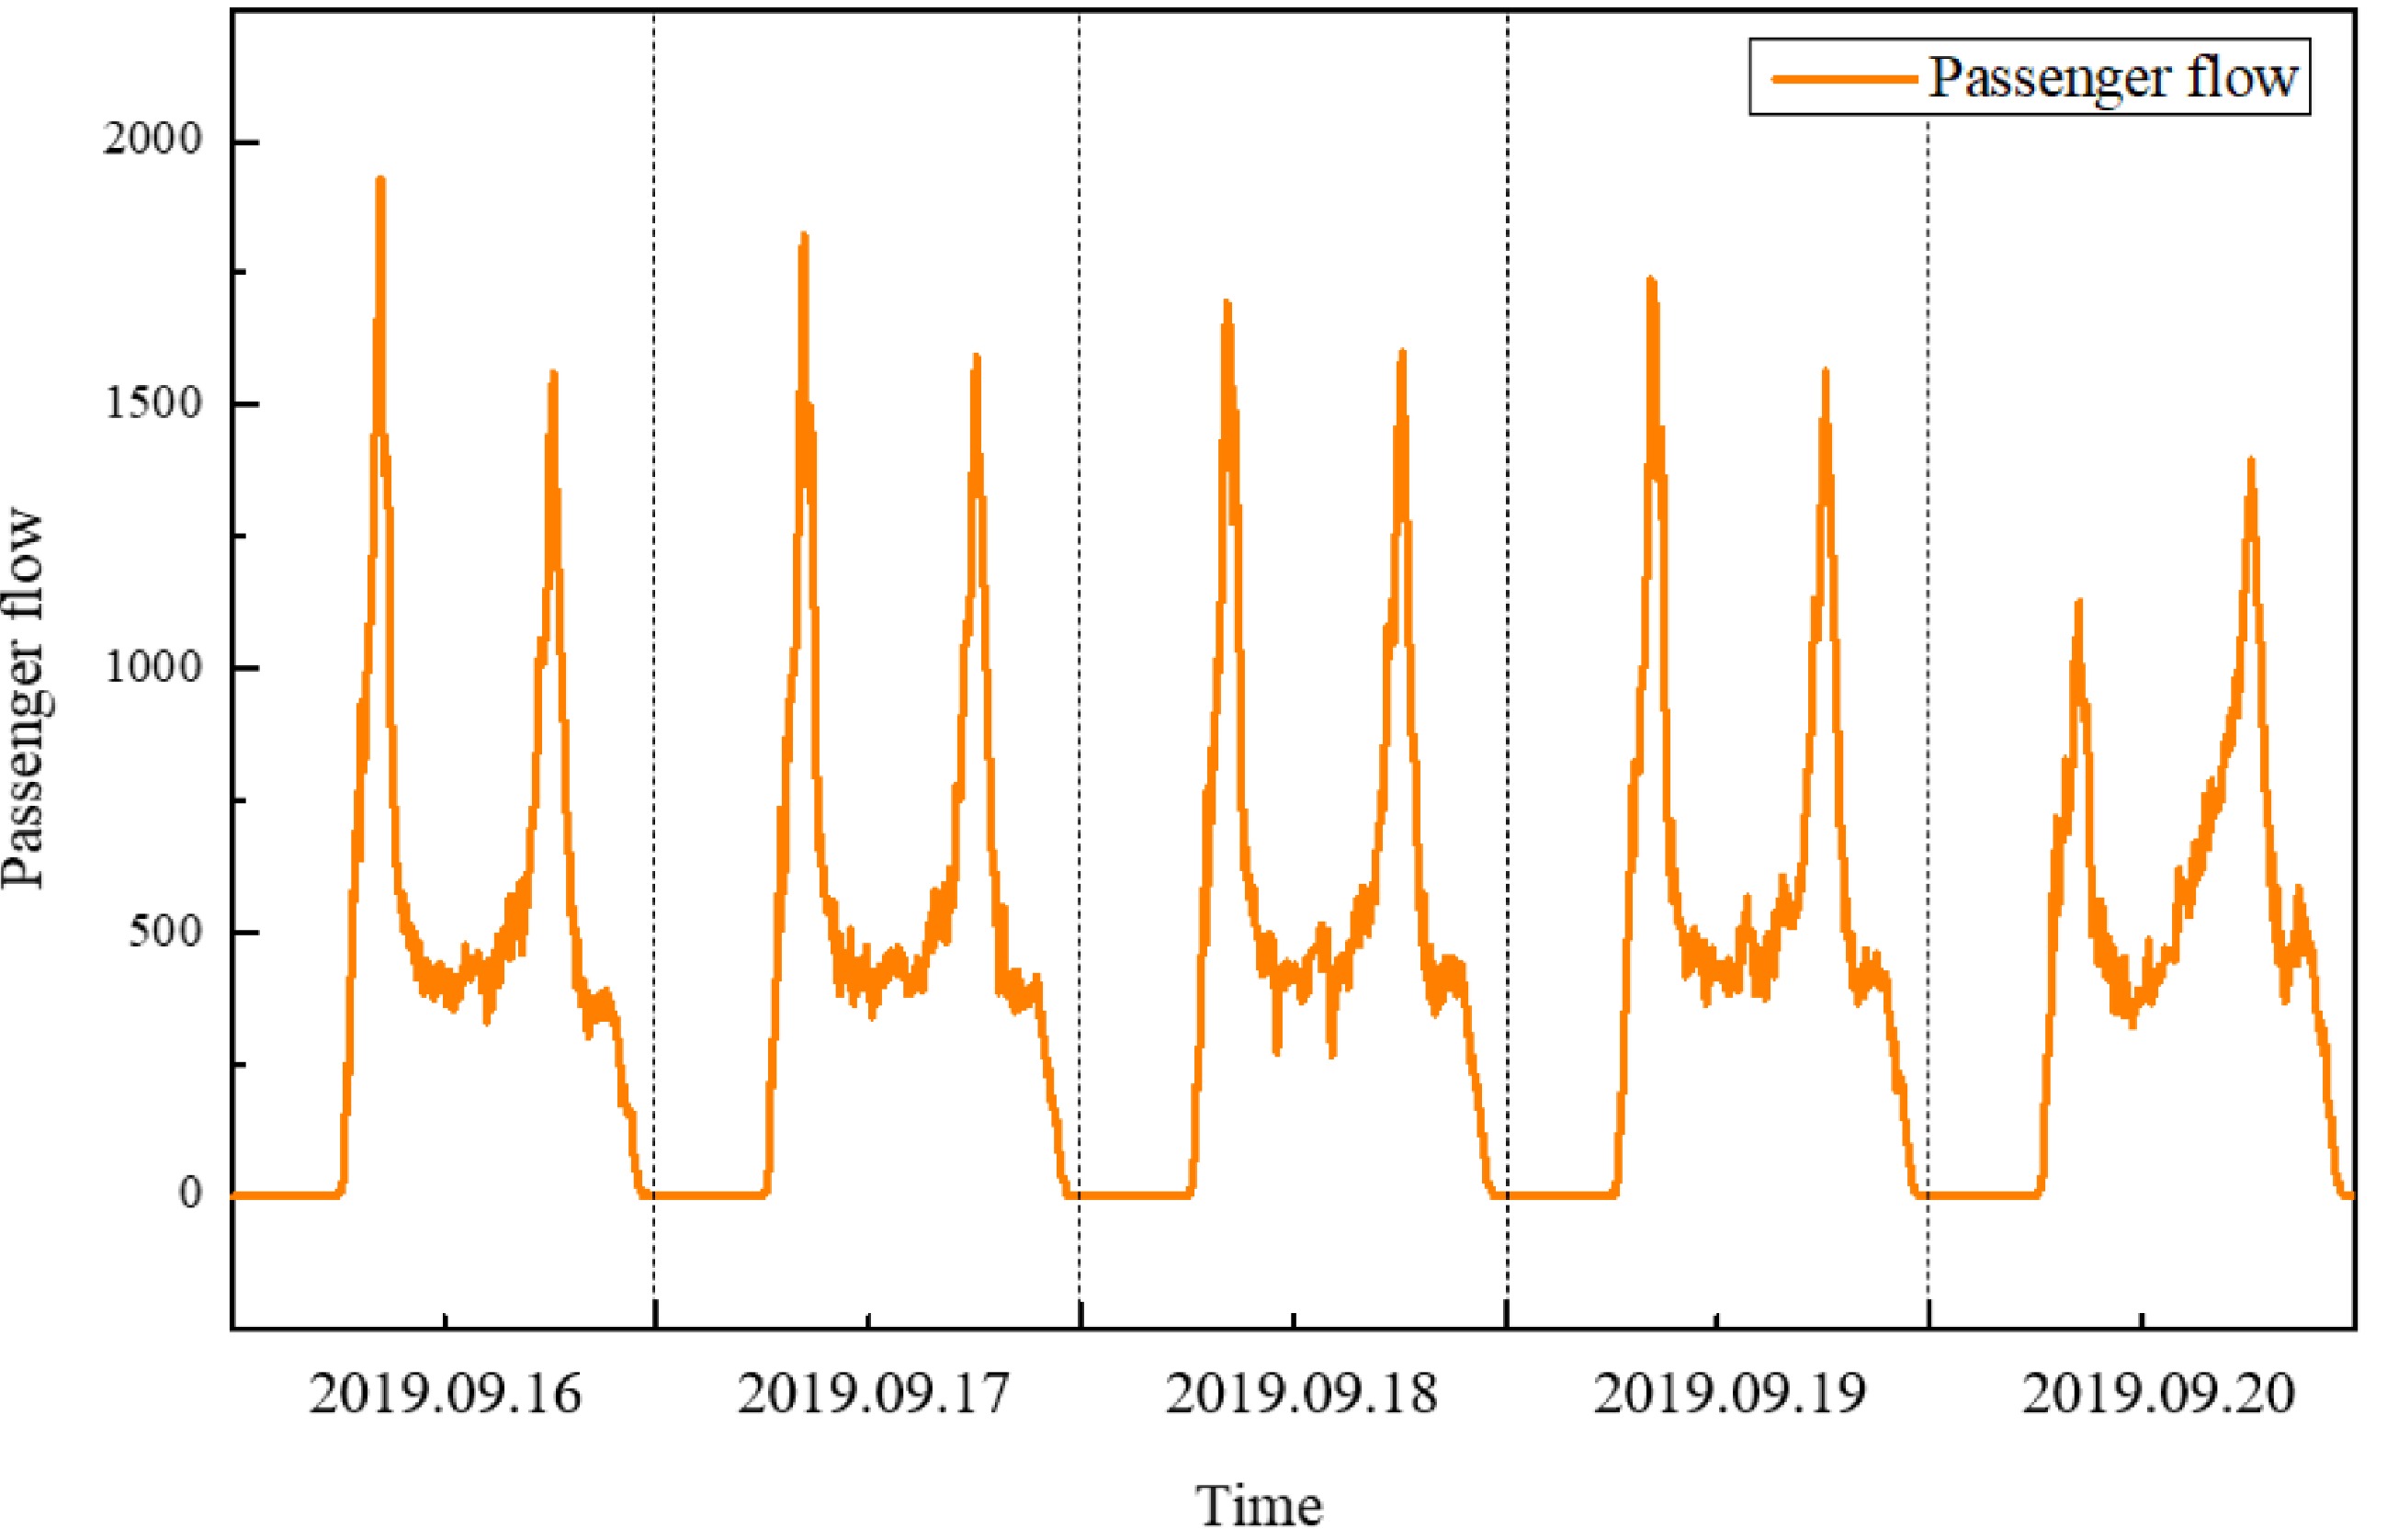
Figure 4.
Characteristic diagram of passenger flow.
-
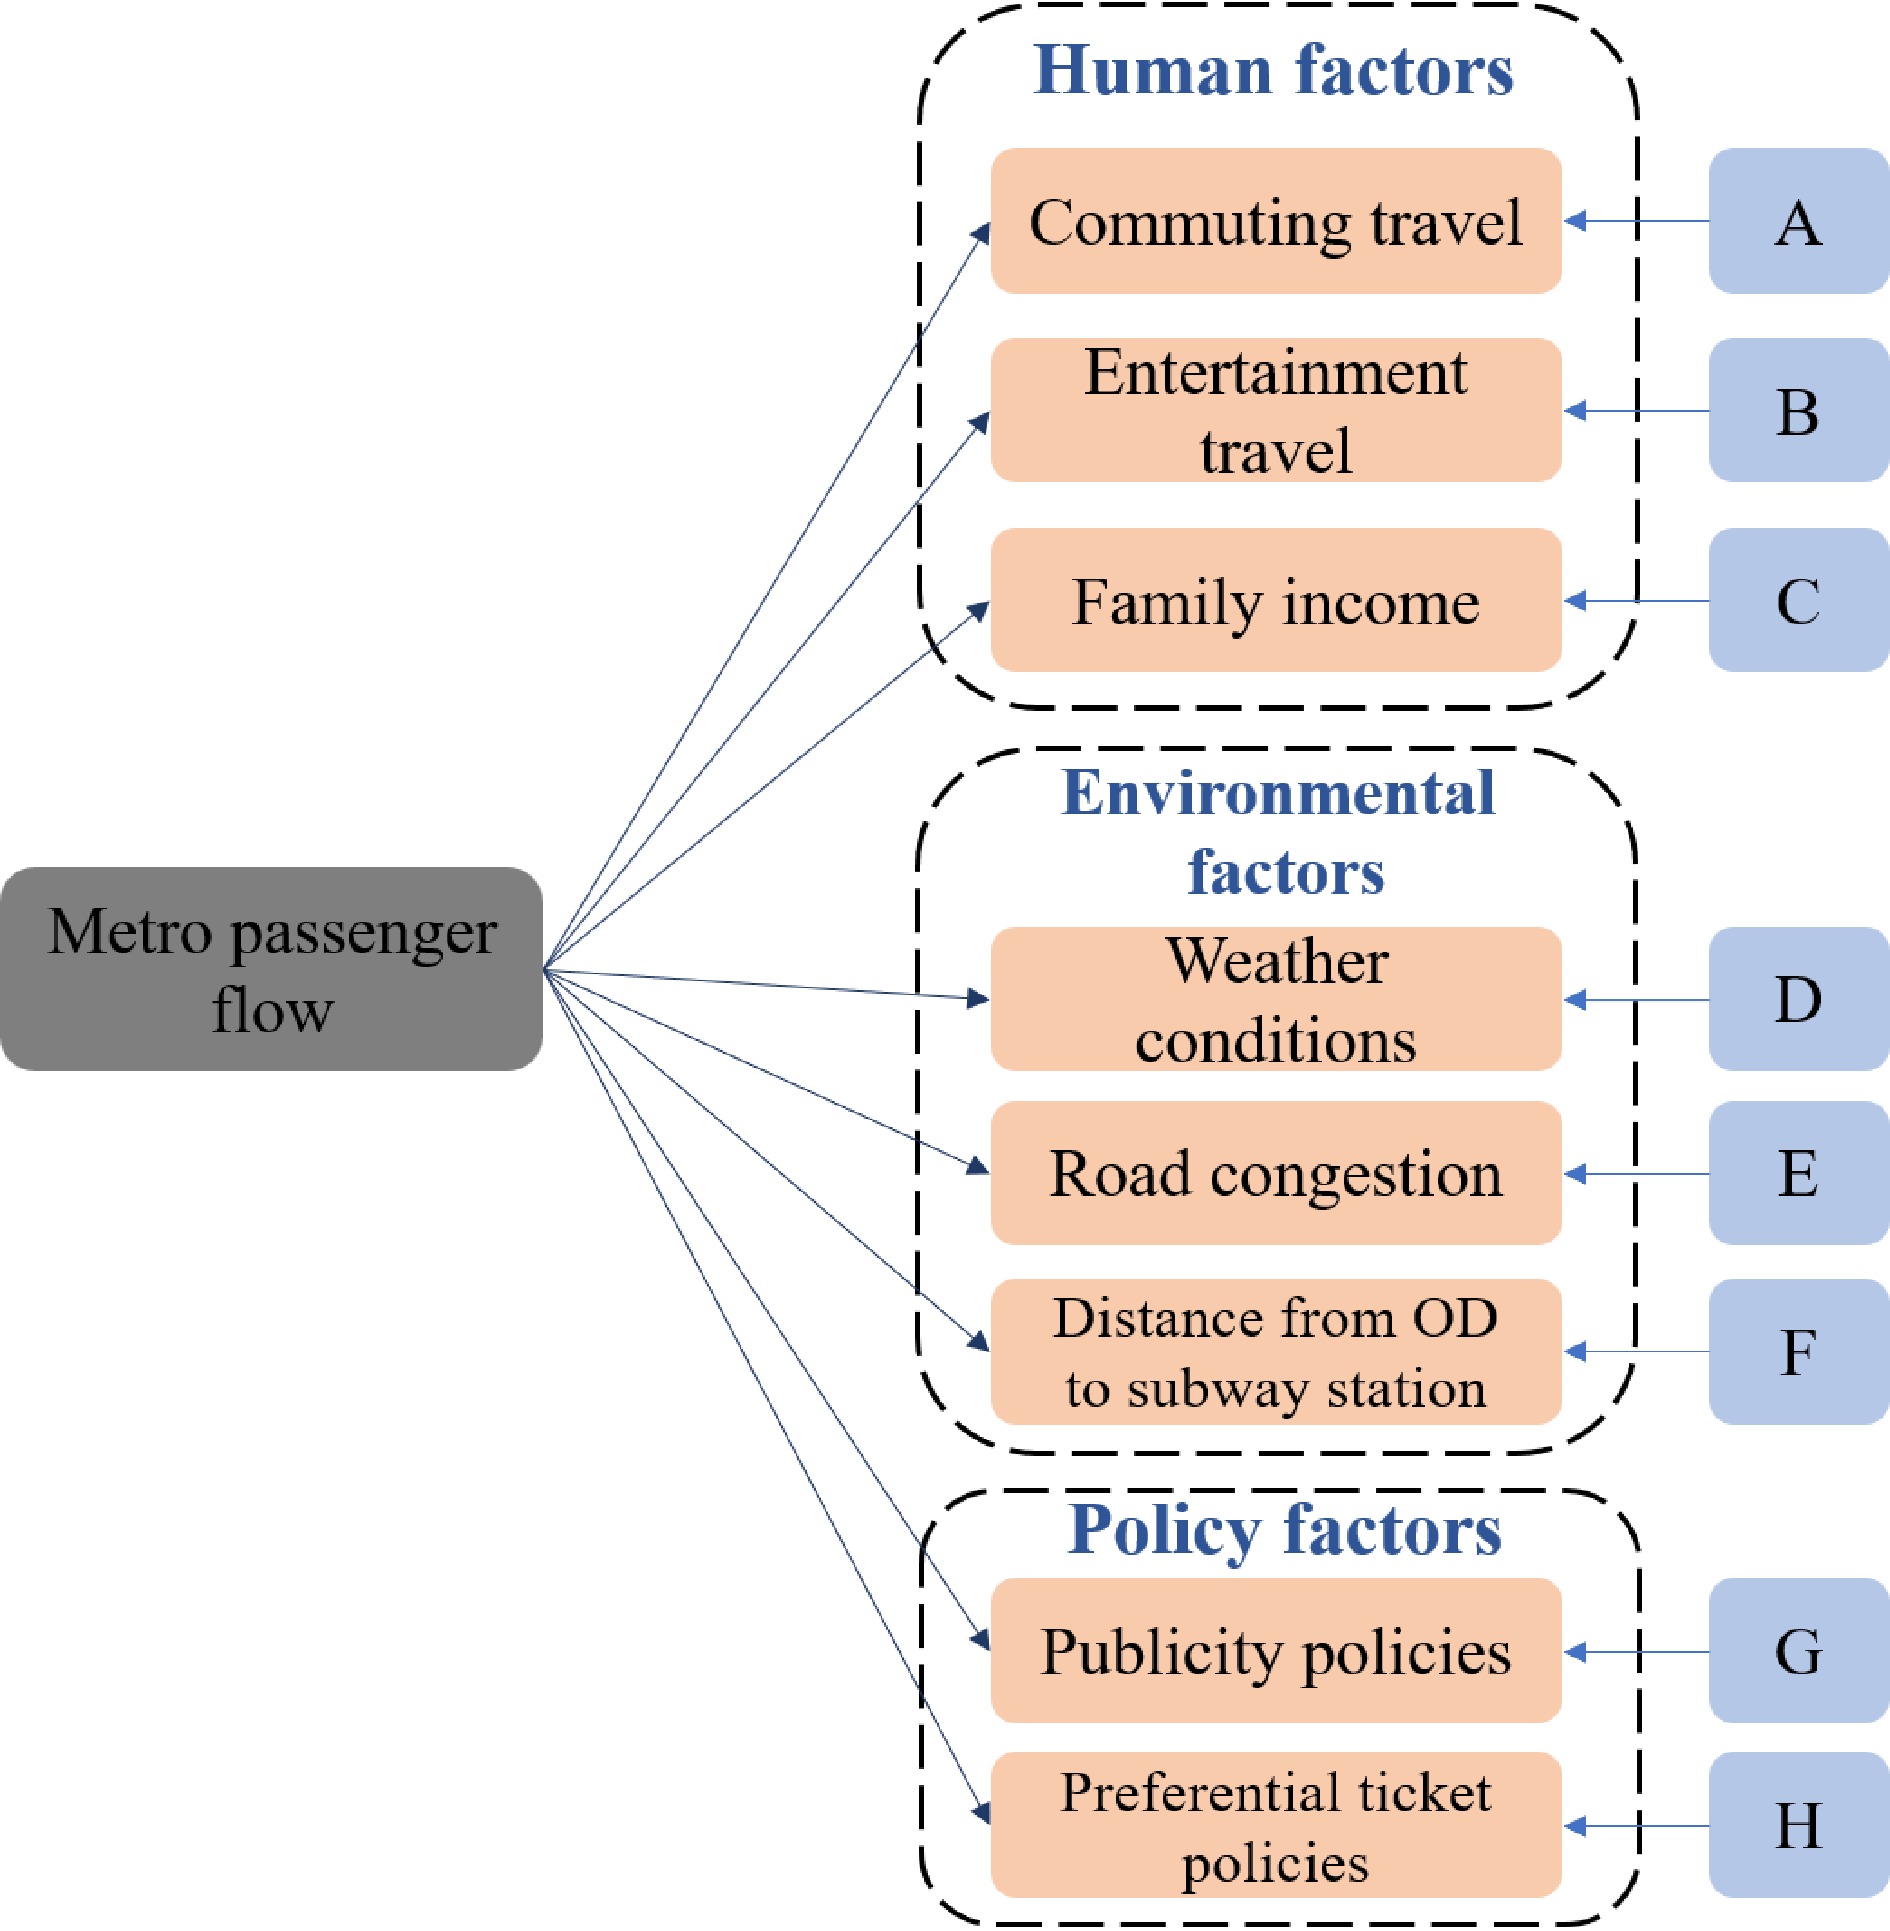
Figure 5.
Influencing factors of rail transit passenger flow.
-
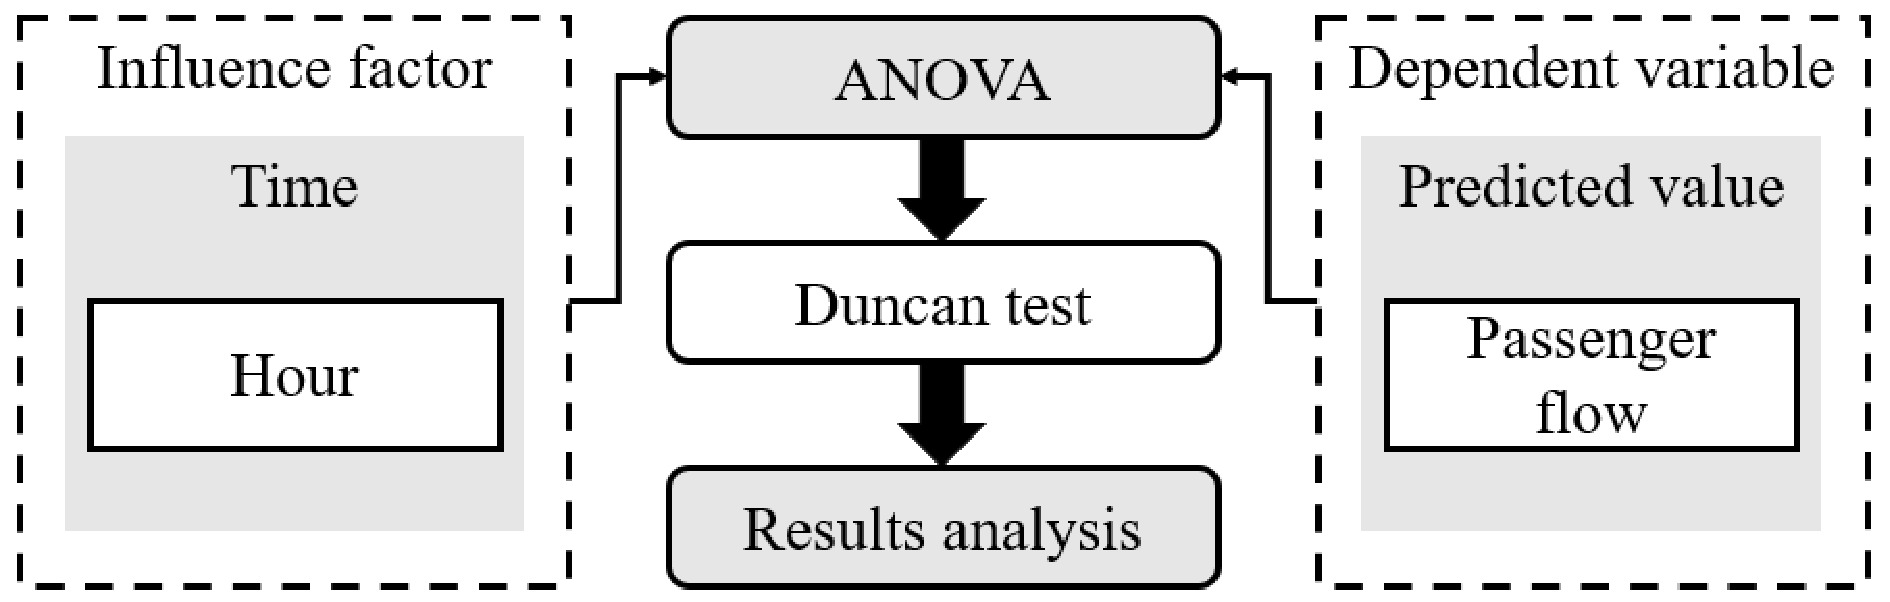
Figure 6.
SPSS analysis flow chart.
-
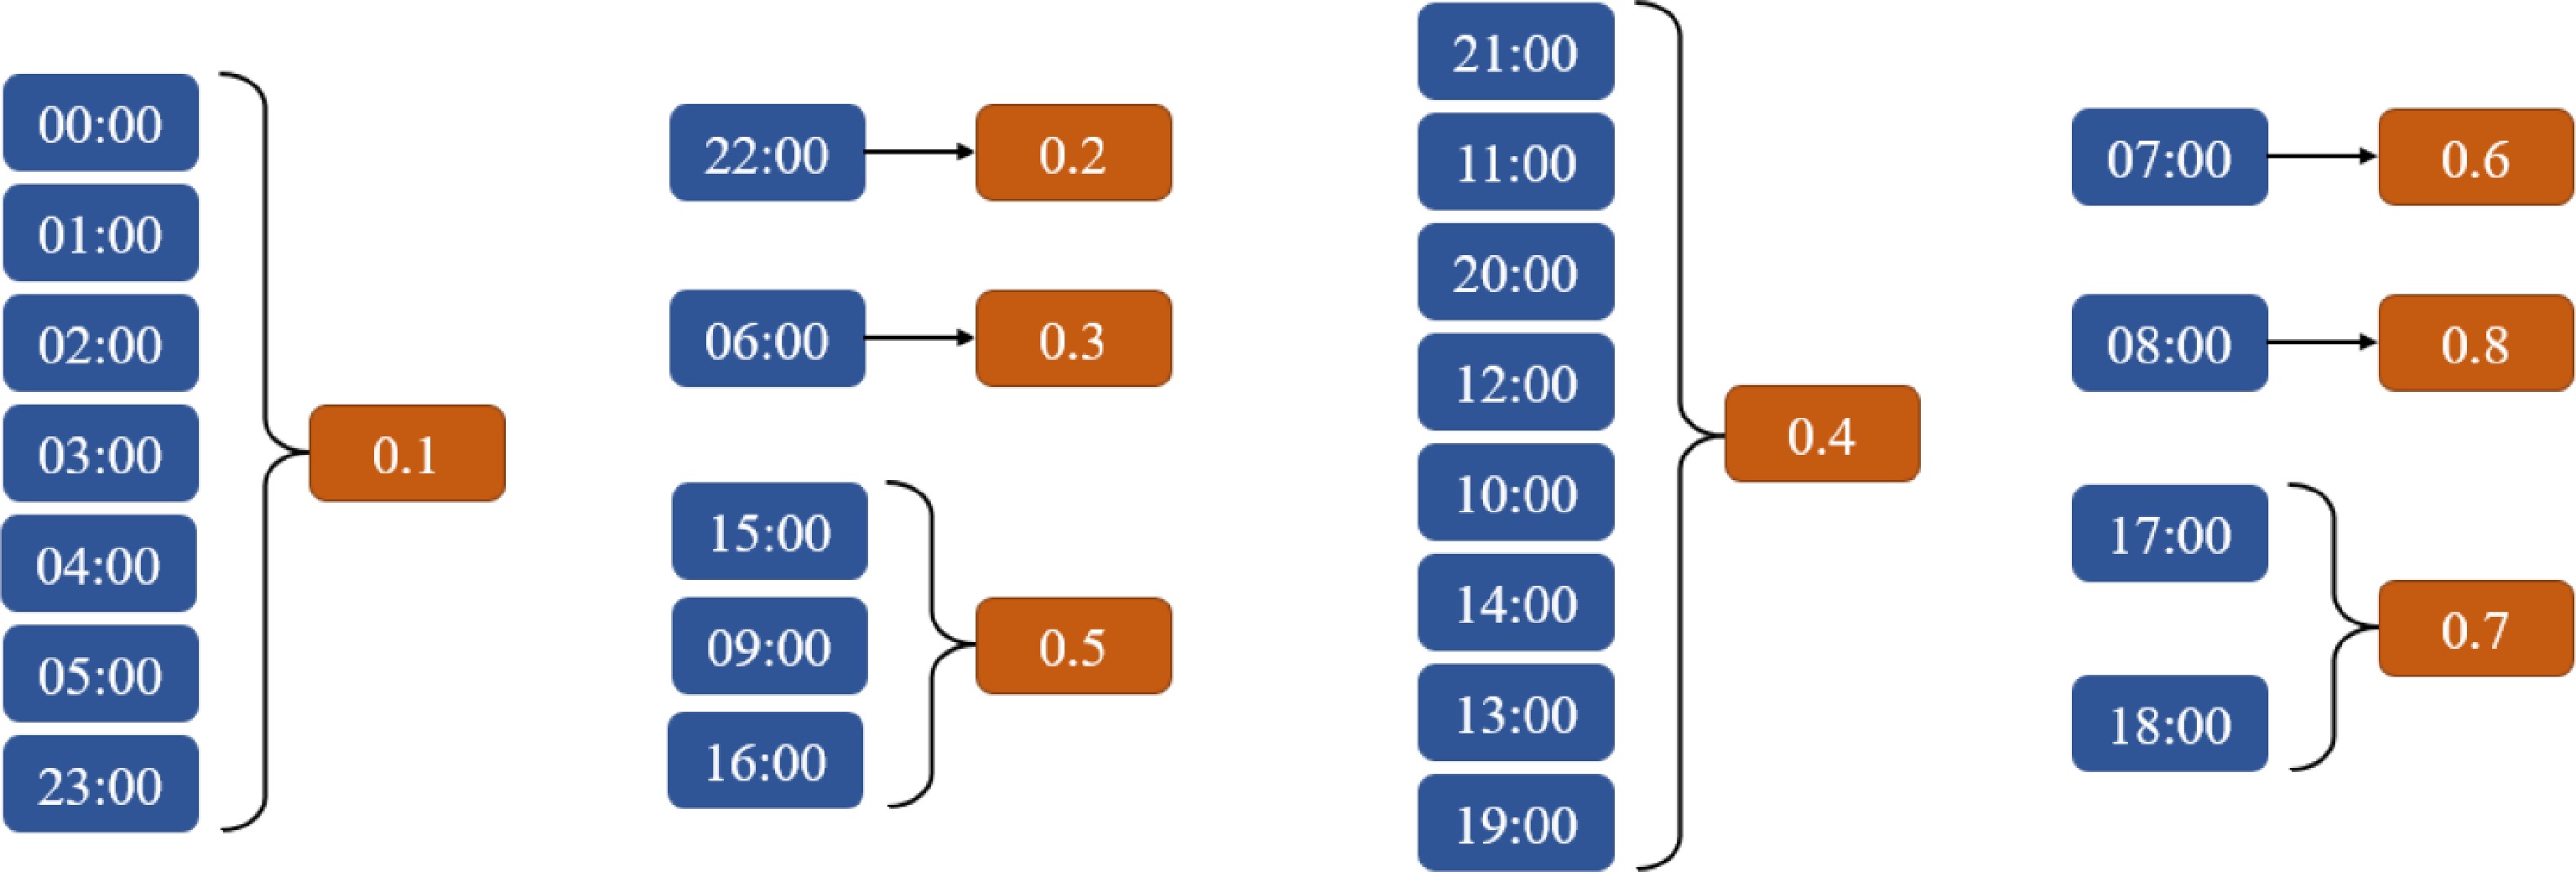
Figure 7.
Hourly weight setting diagram.
-
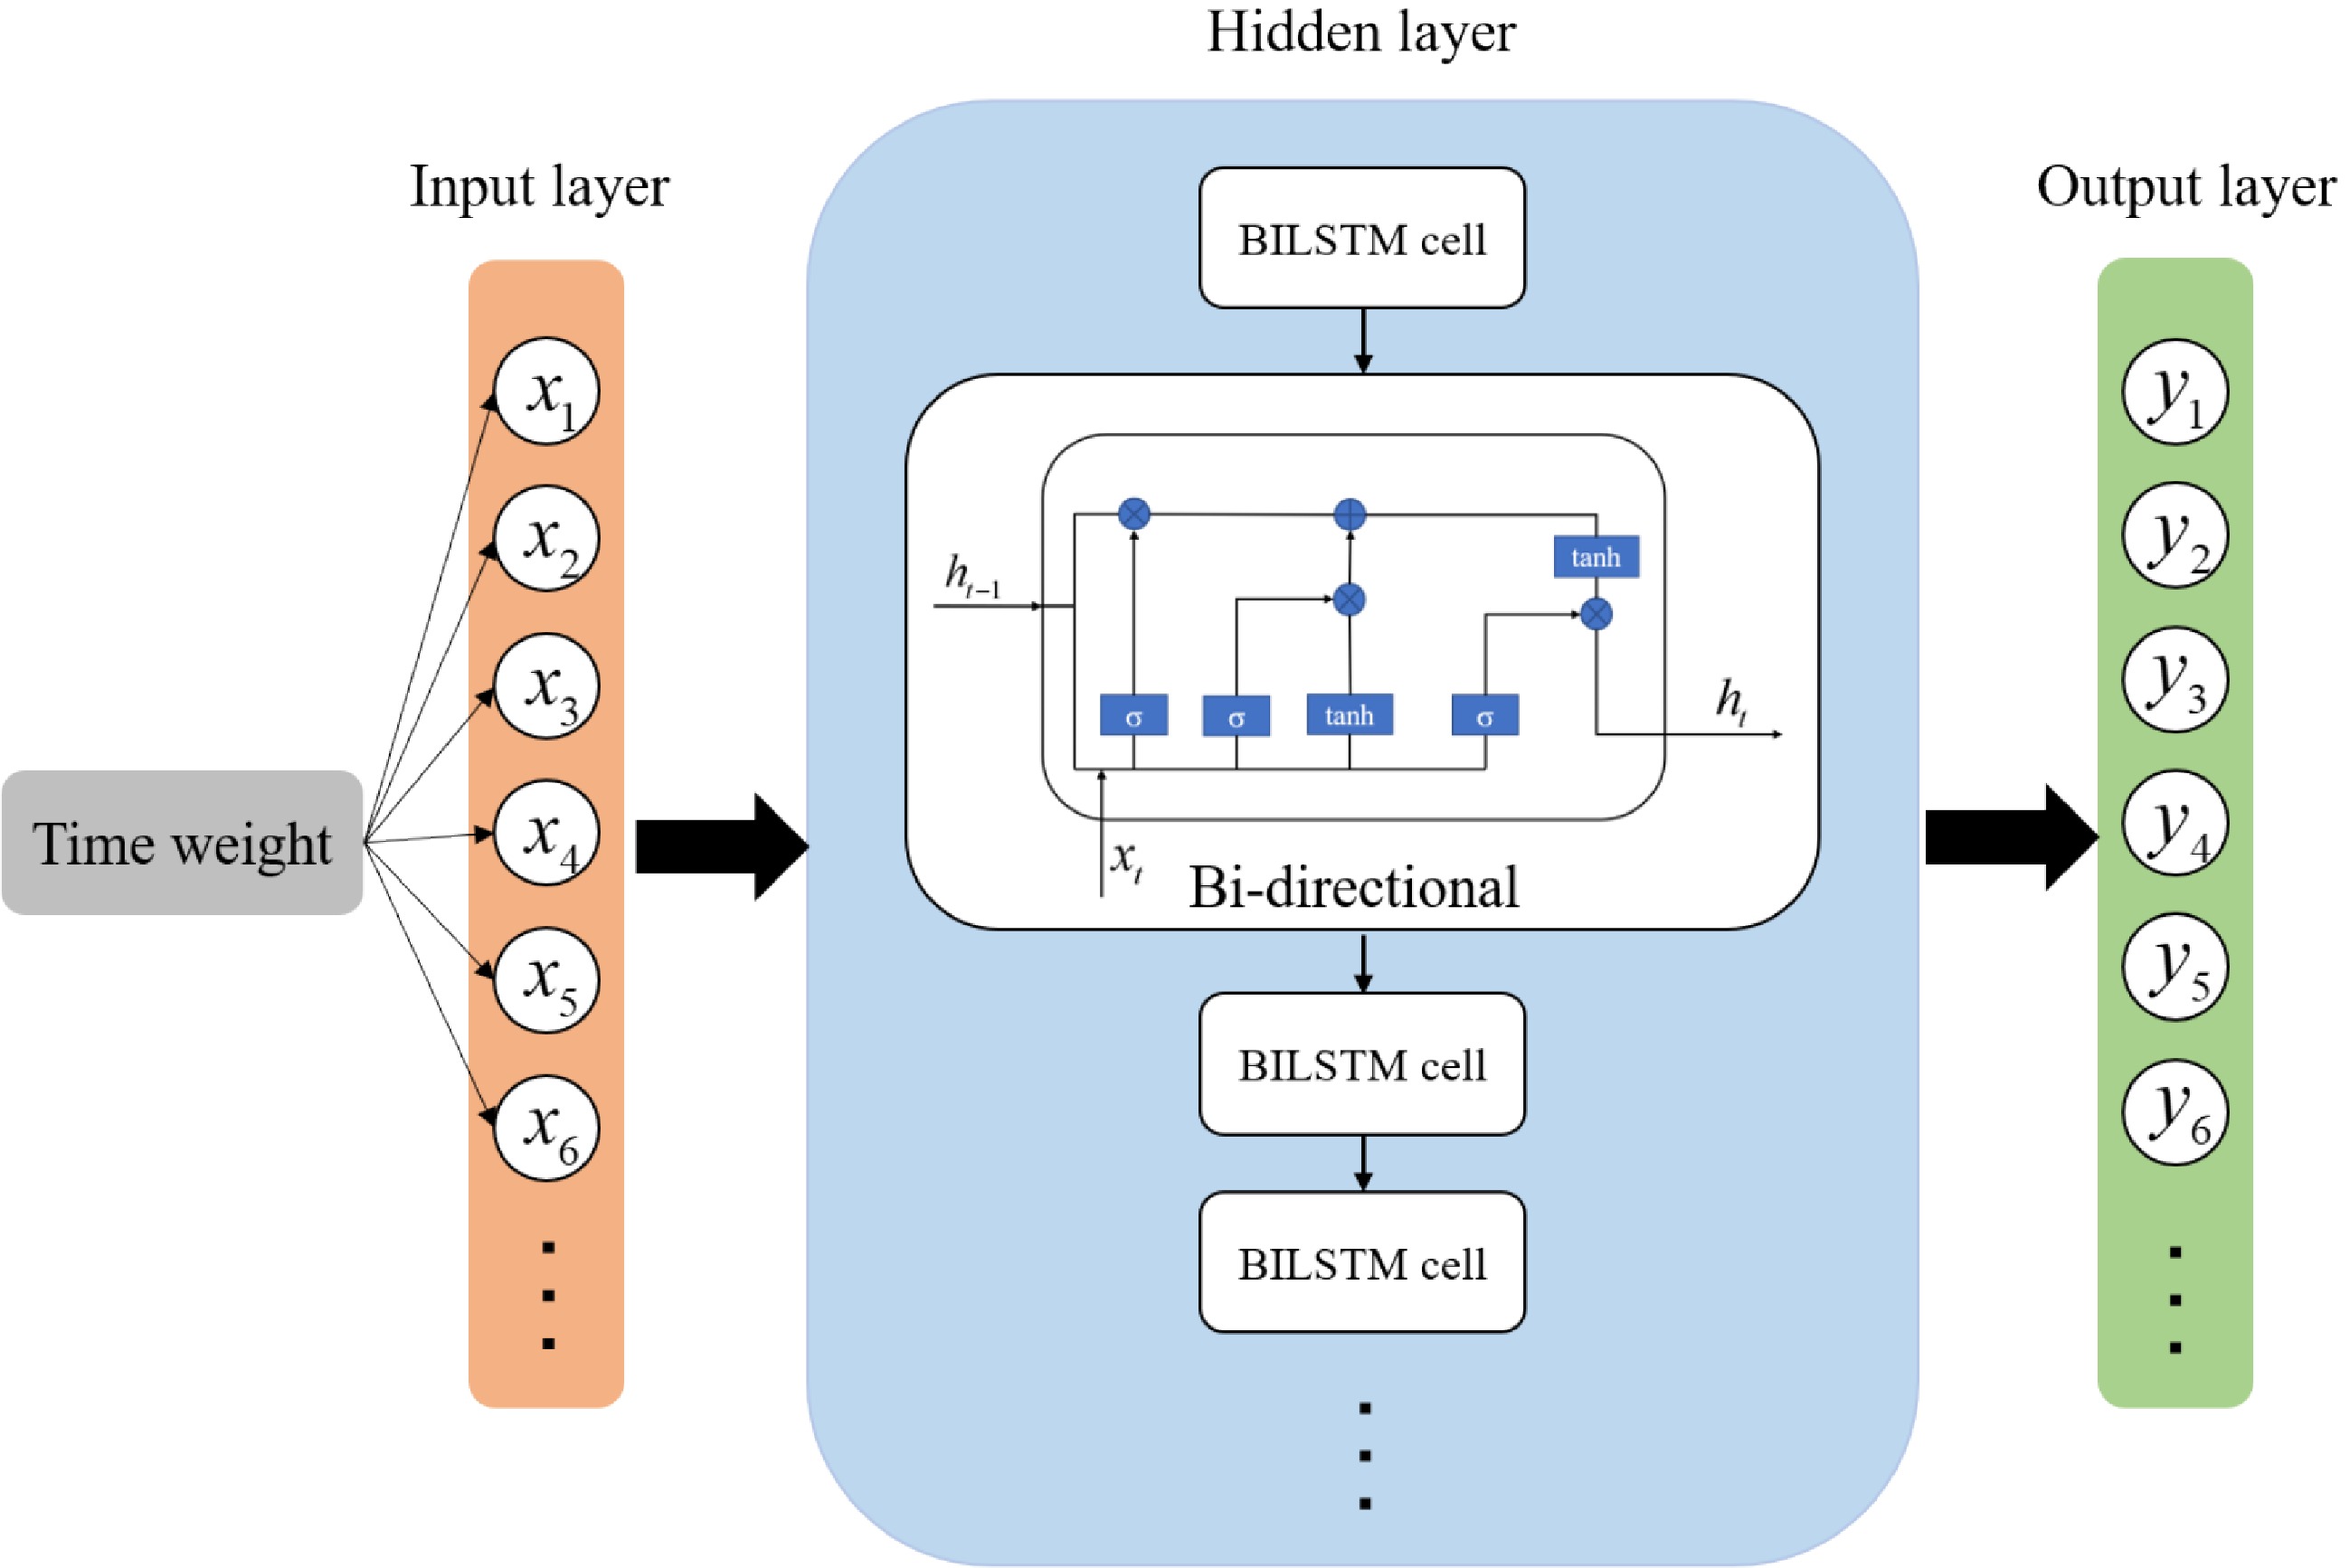
Figure 8.
Improved model structure.
-
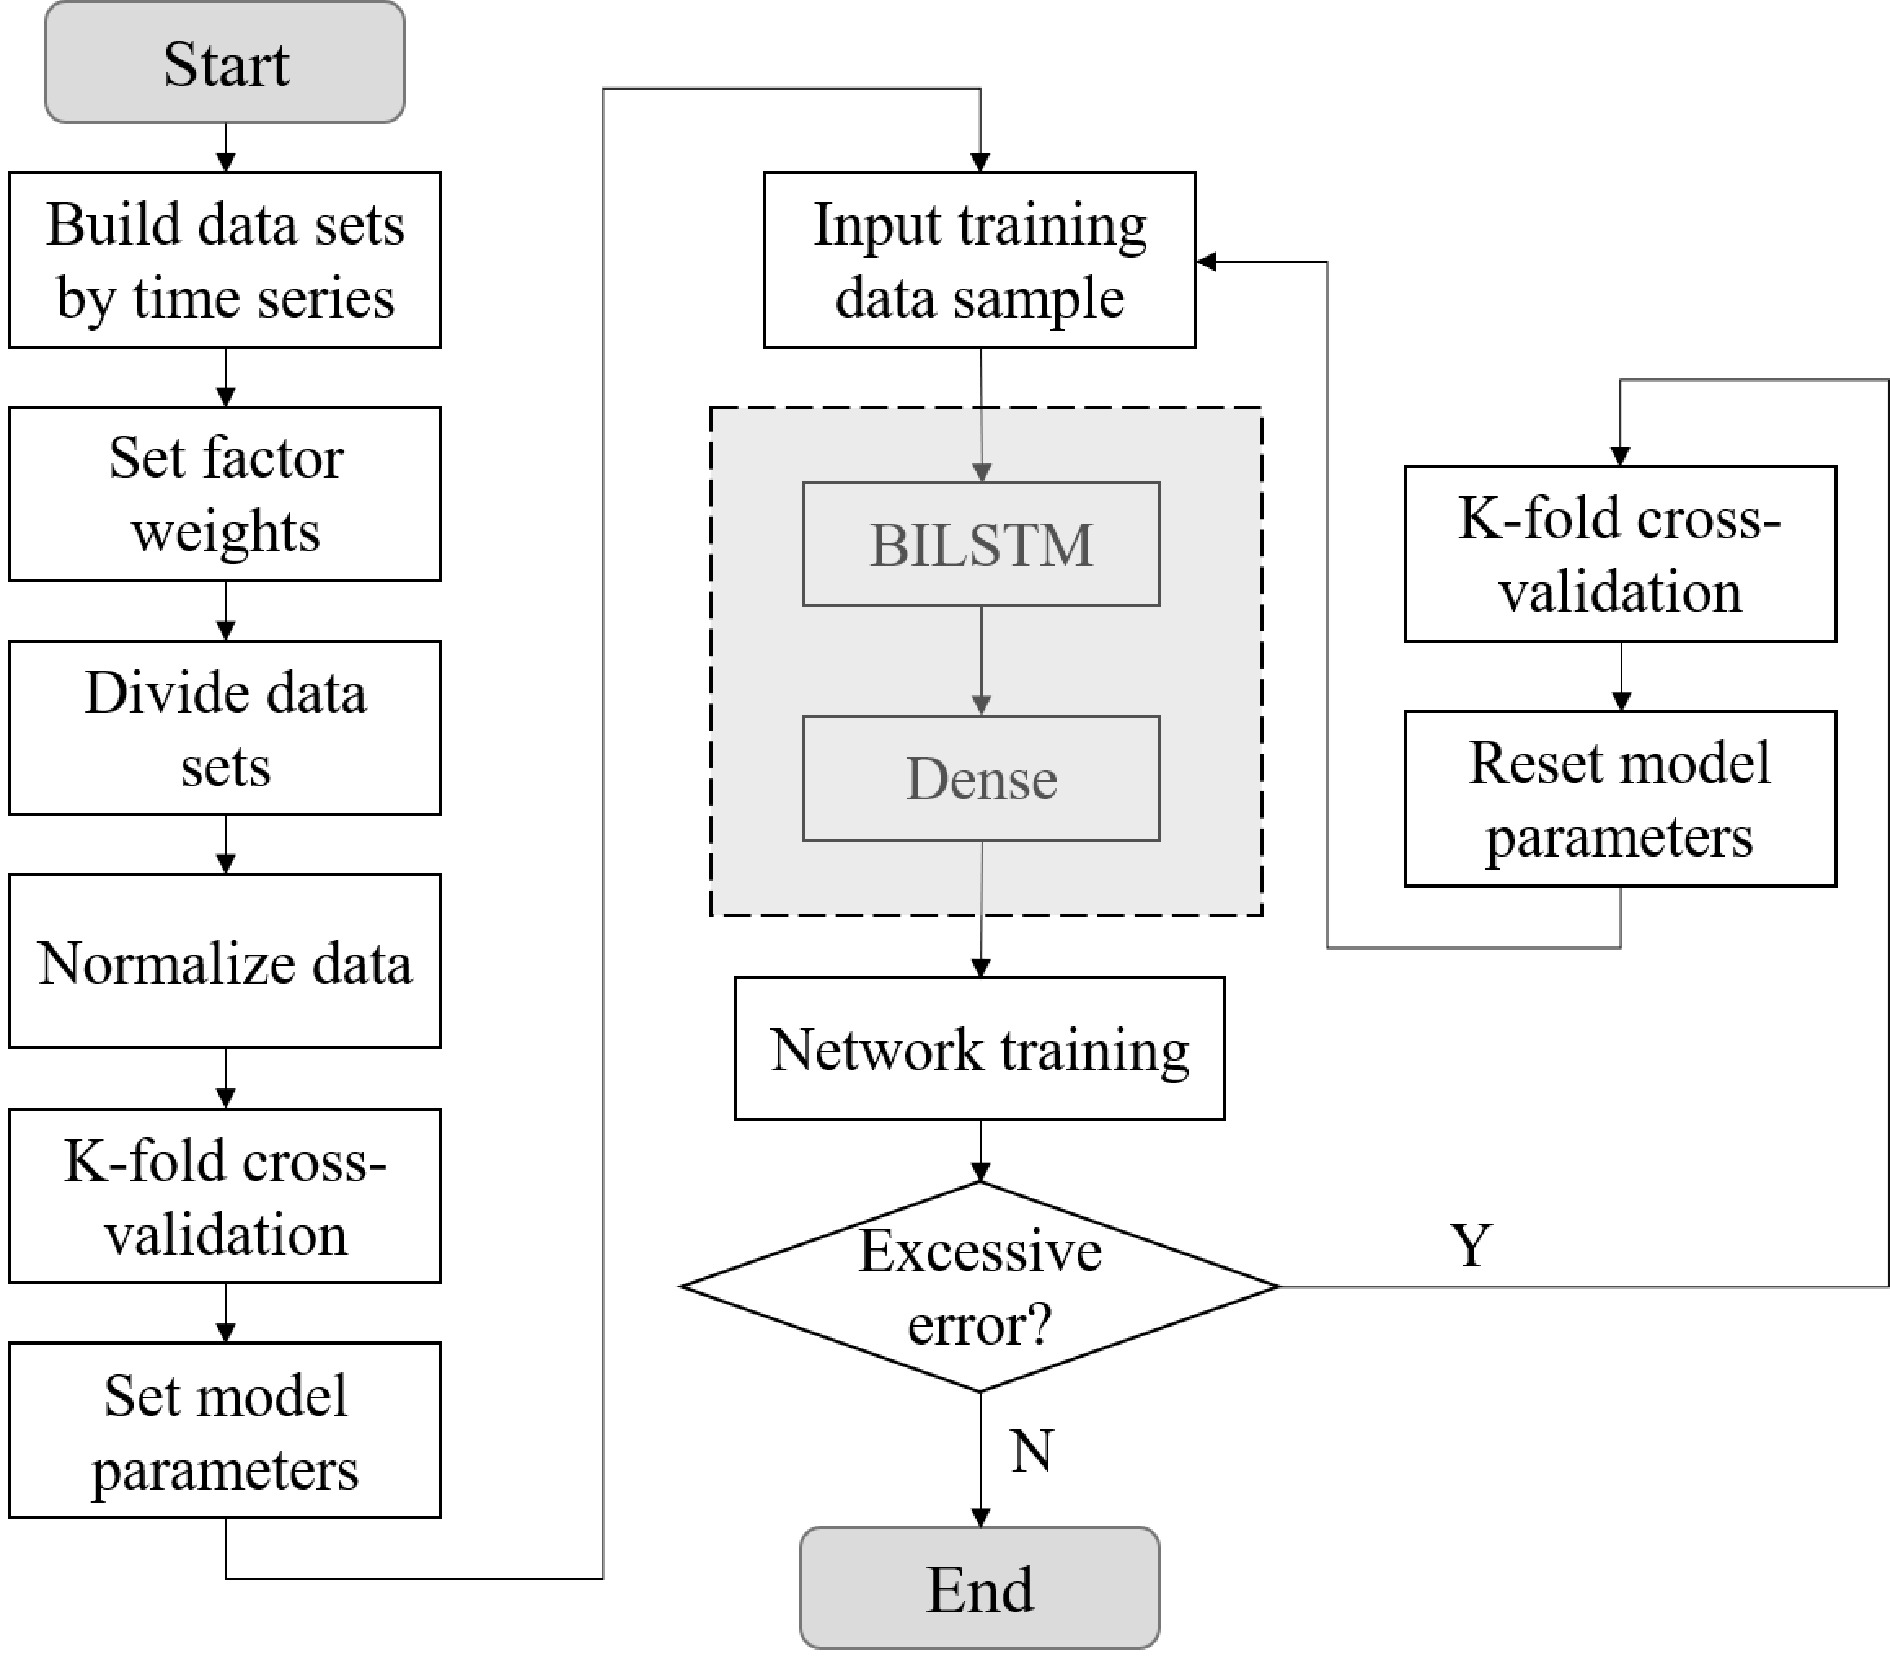
Figure 9.
Model training process.
-
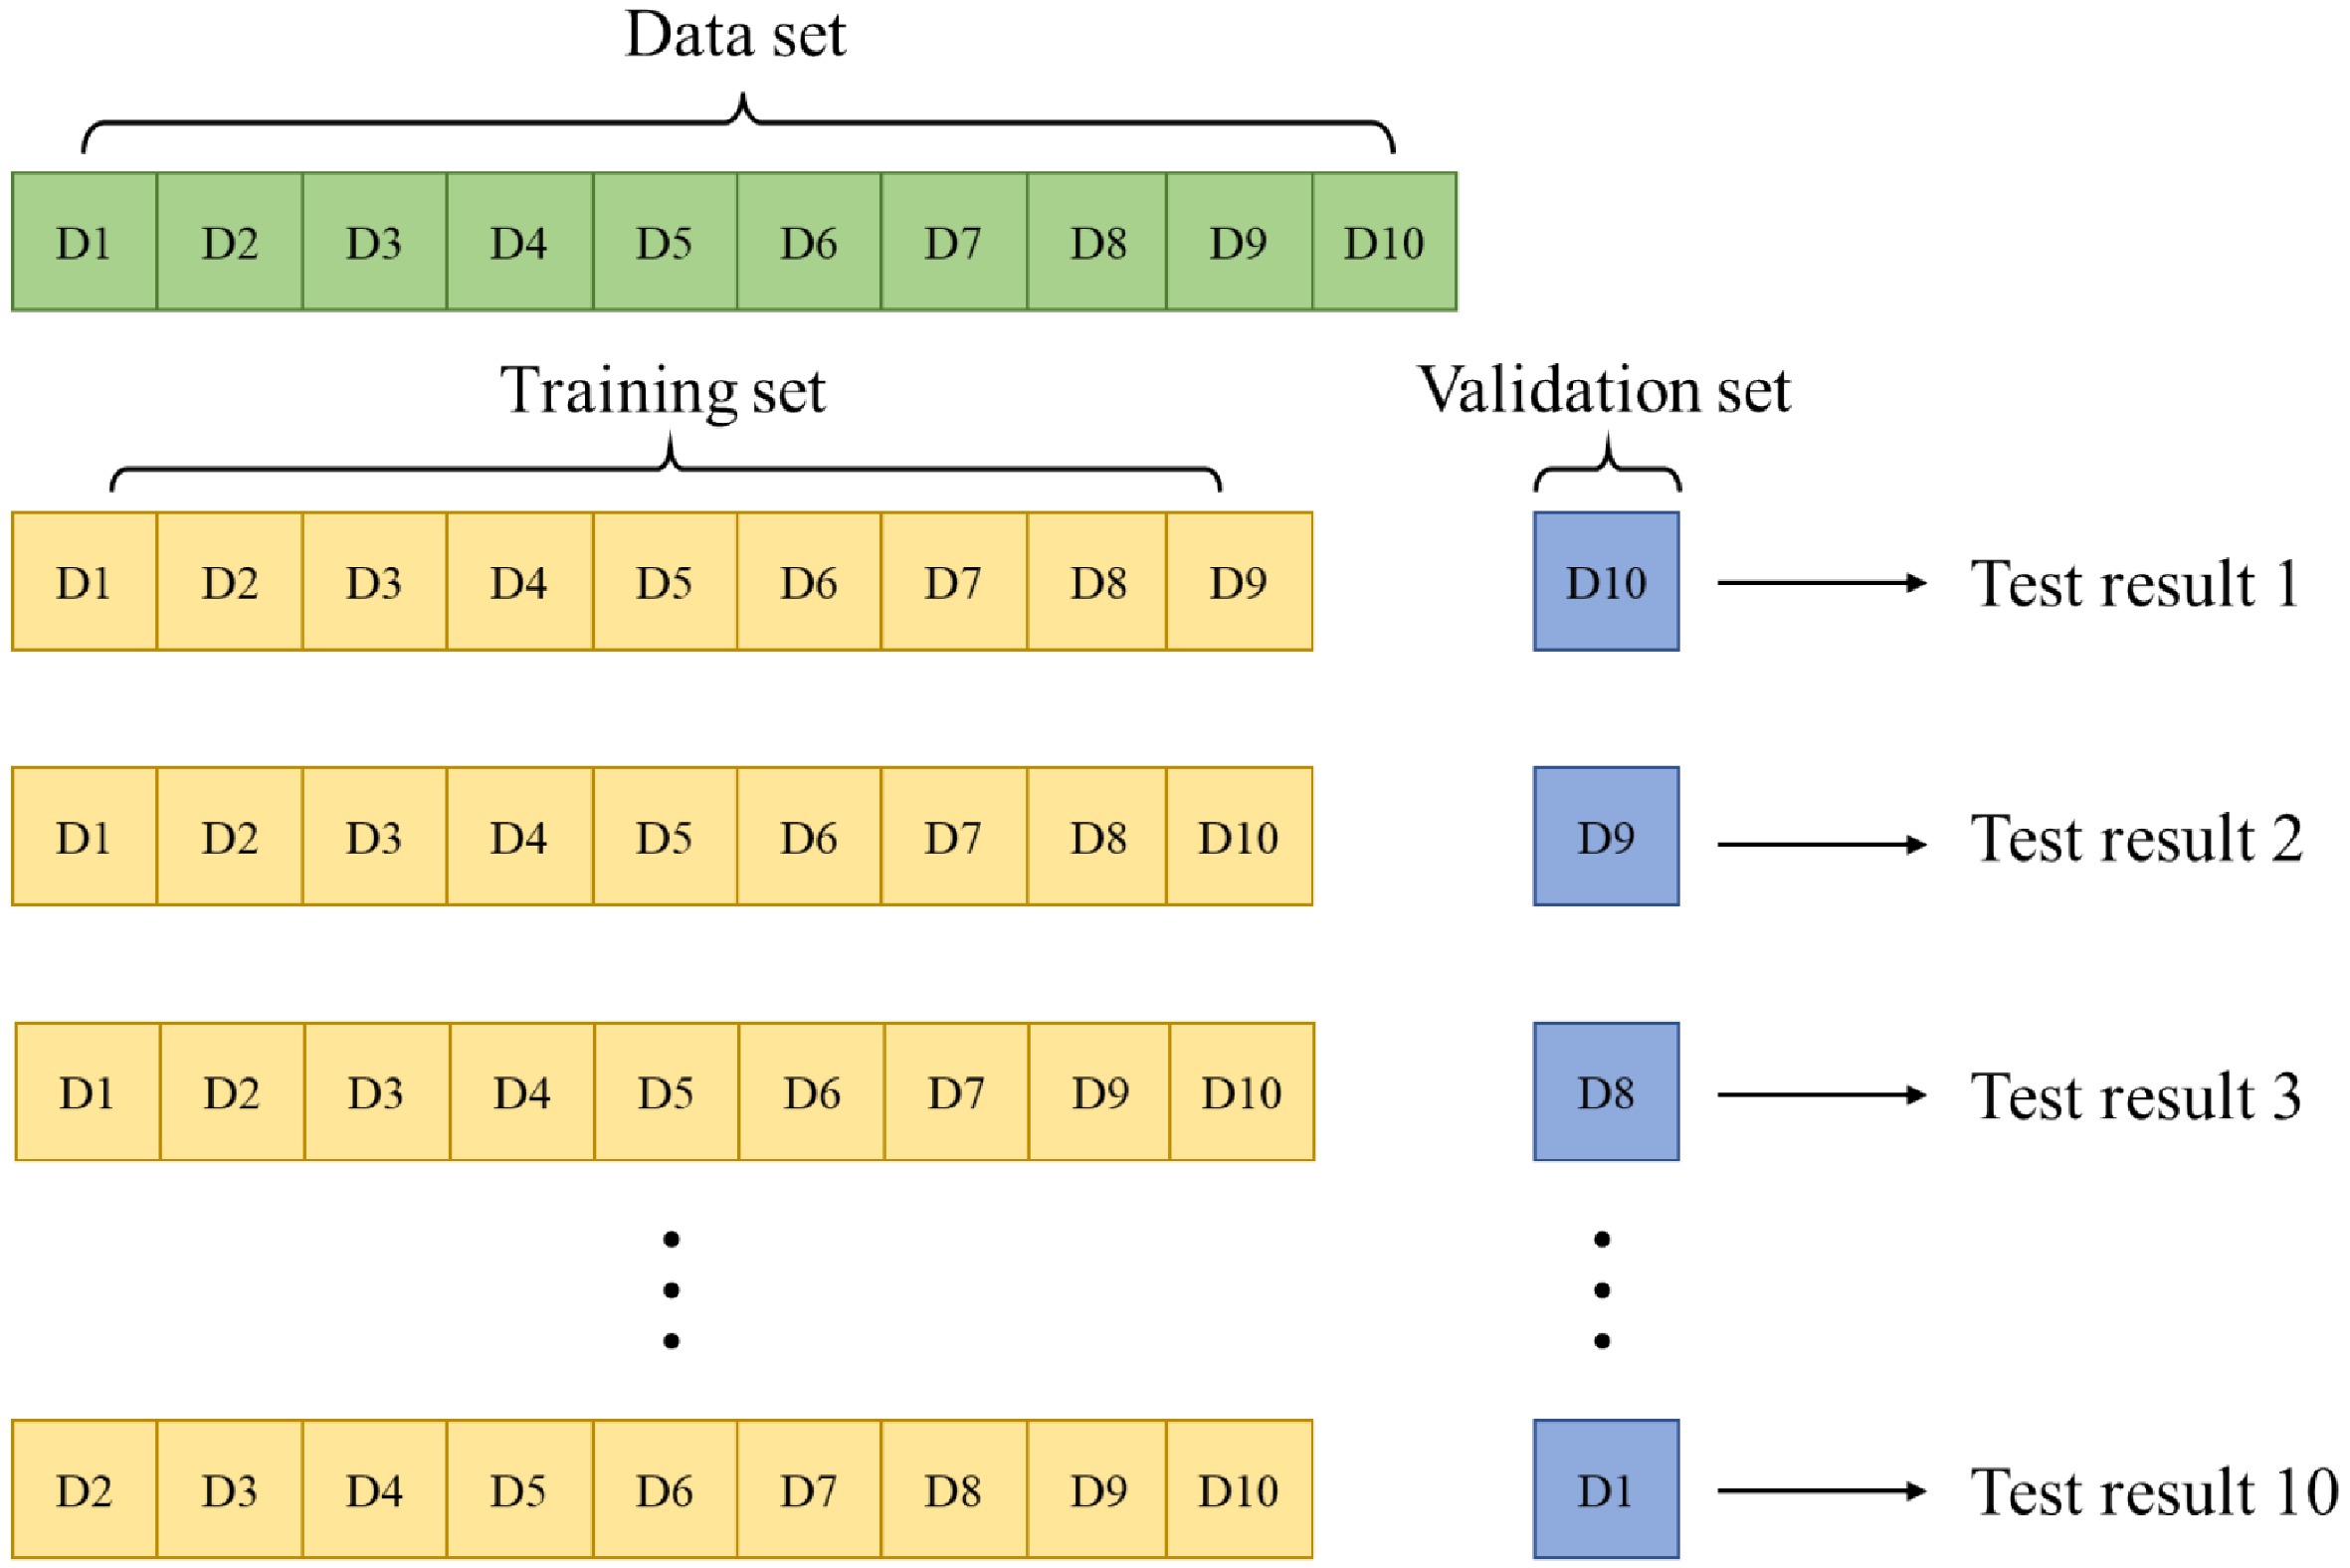
Figure 10.
K-fold cross-validation schematic diagram.
-
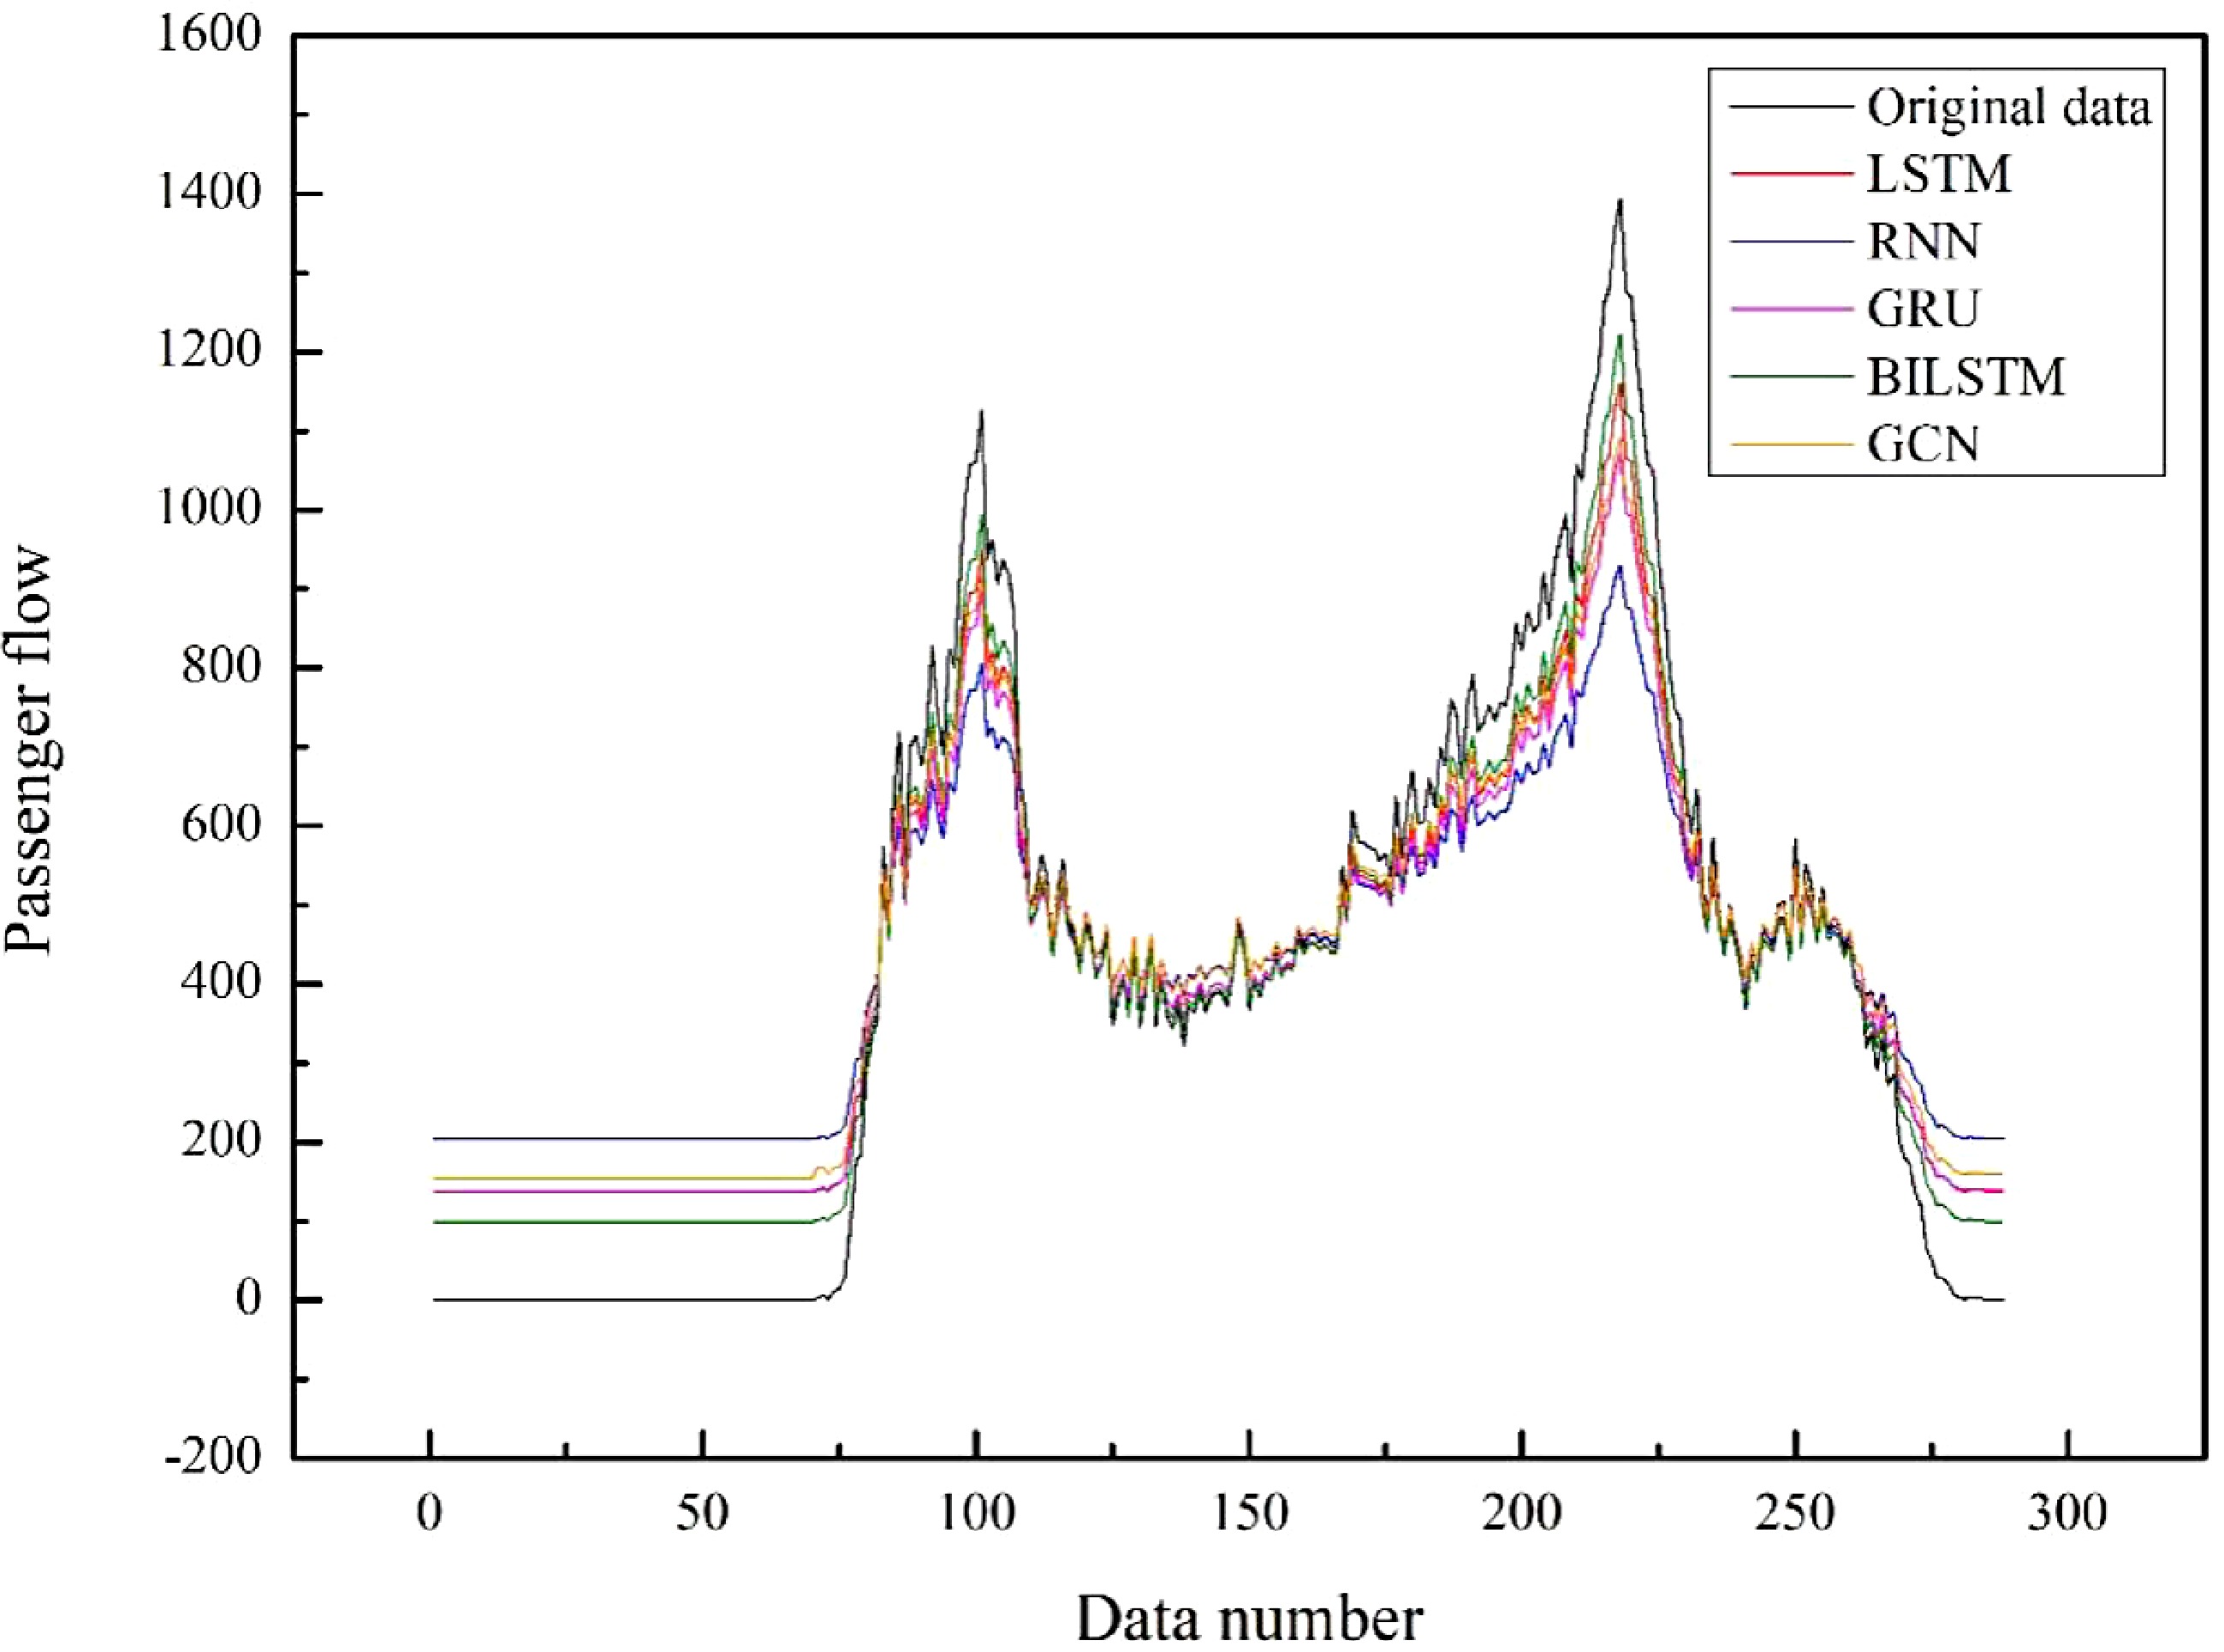
Figure 11.
Prediction results of each model.
-
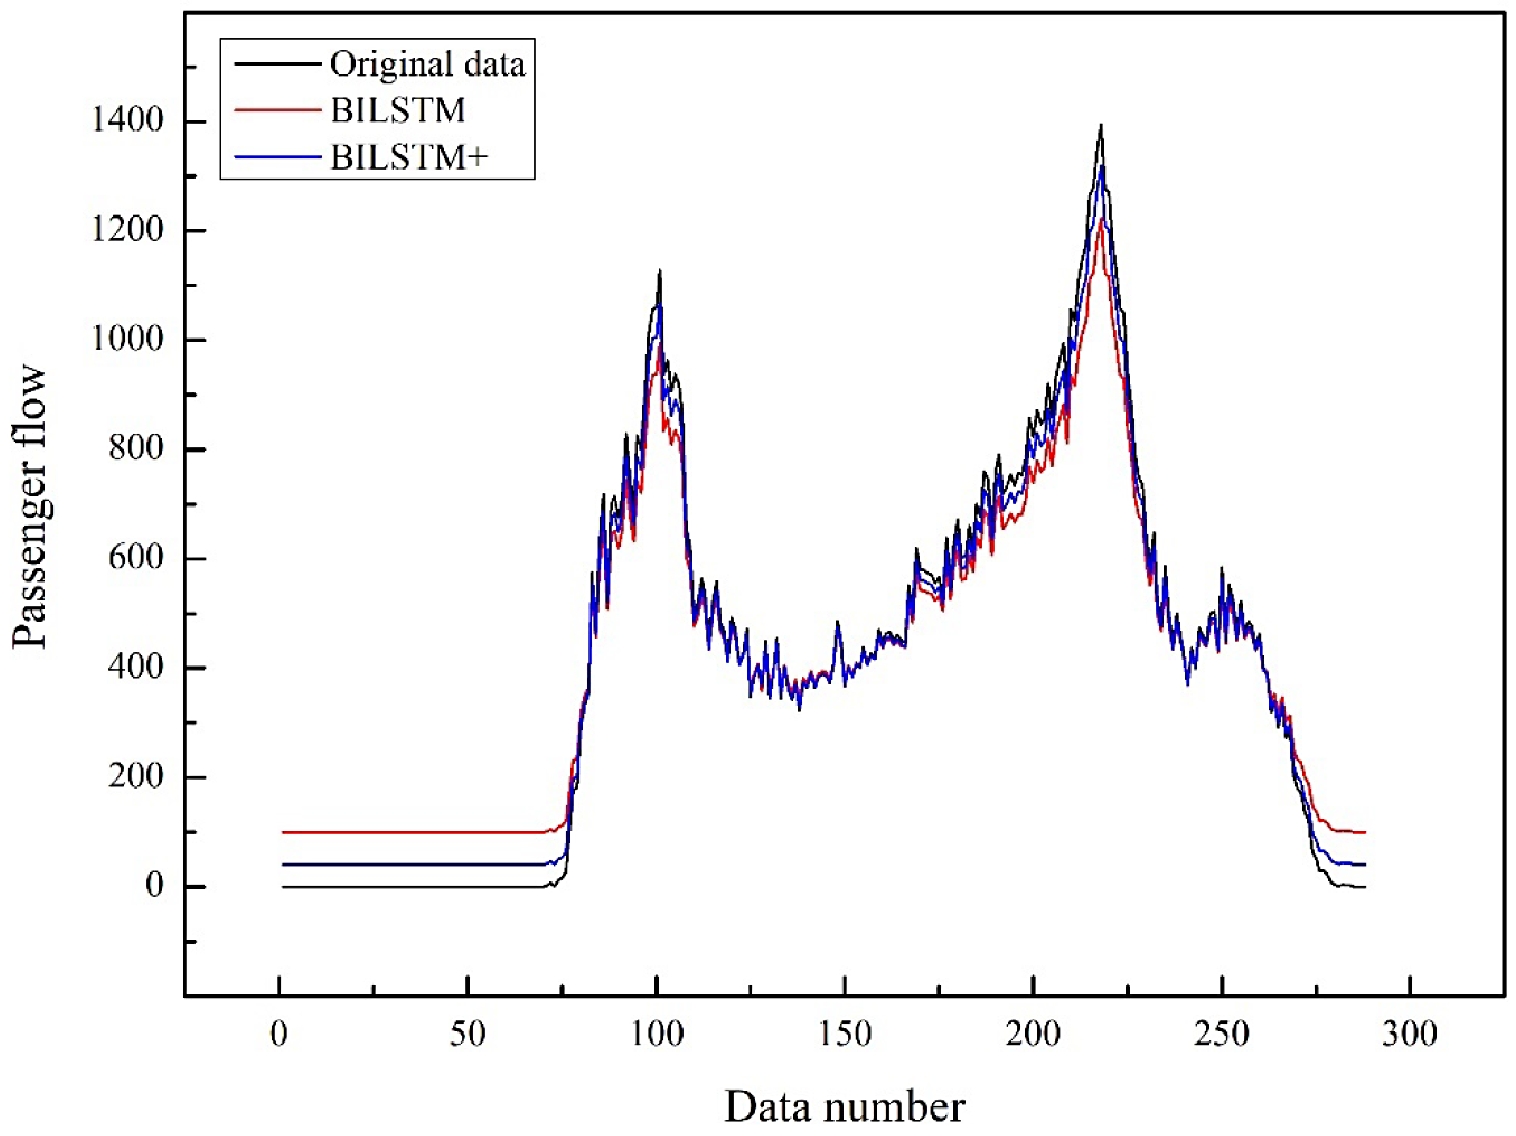
Figure 12.
Comparison chart of prediction results of the BILSTM model.
-
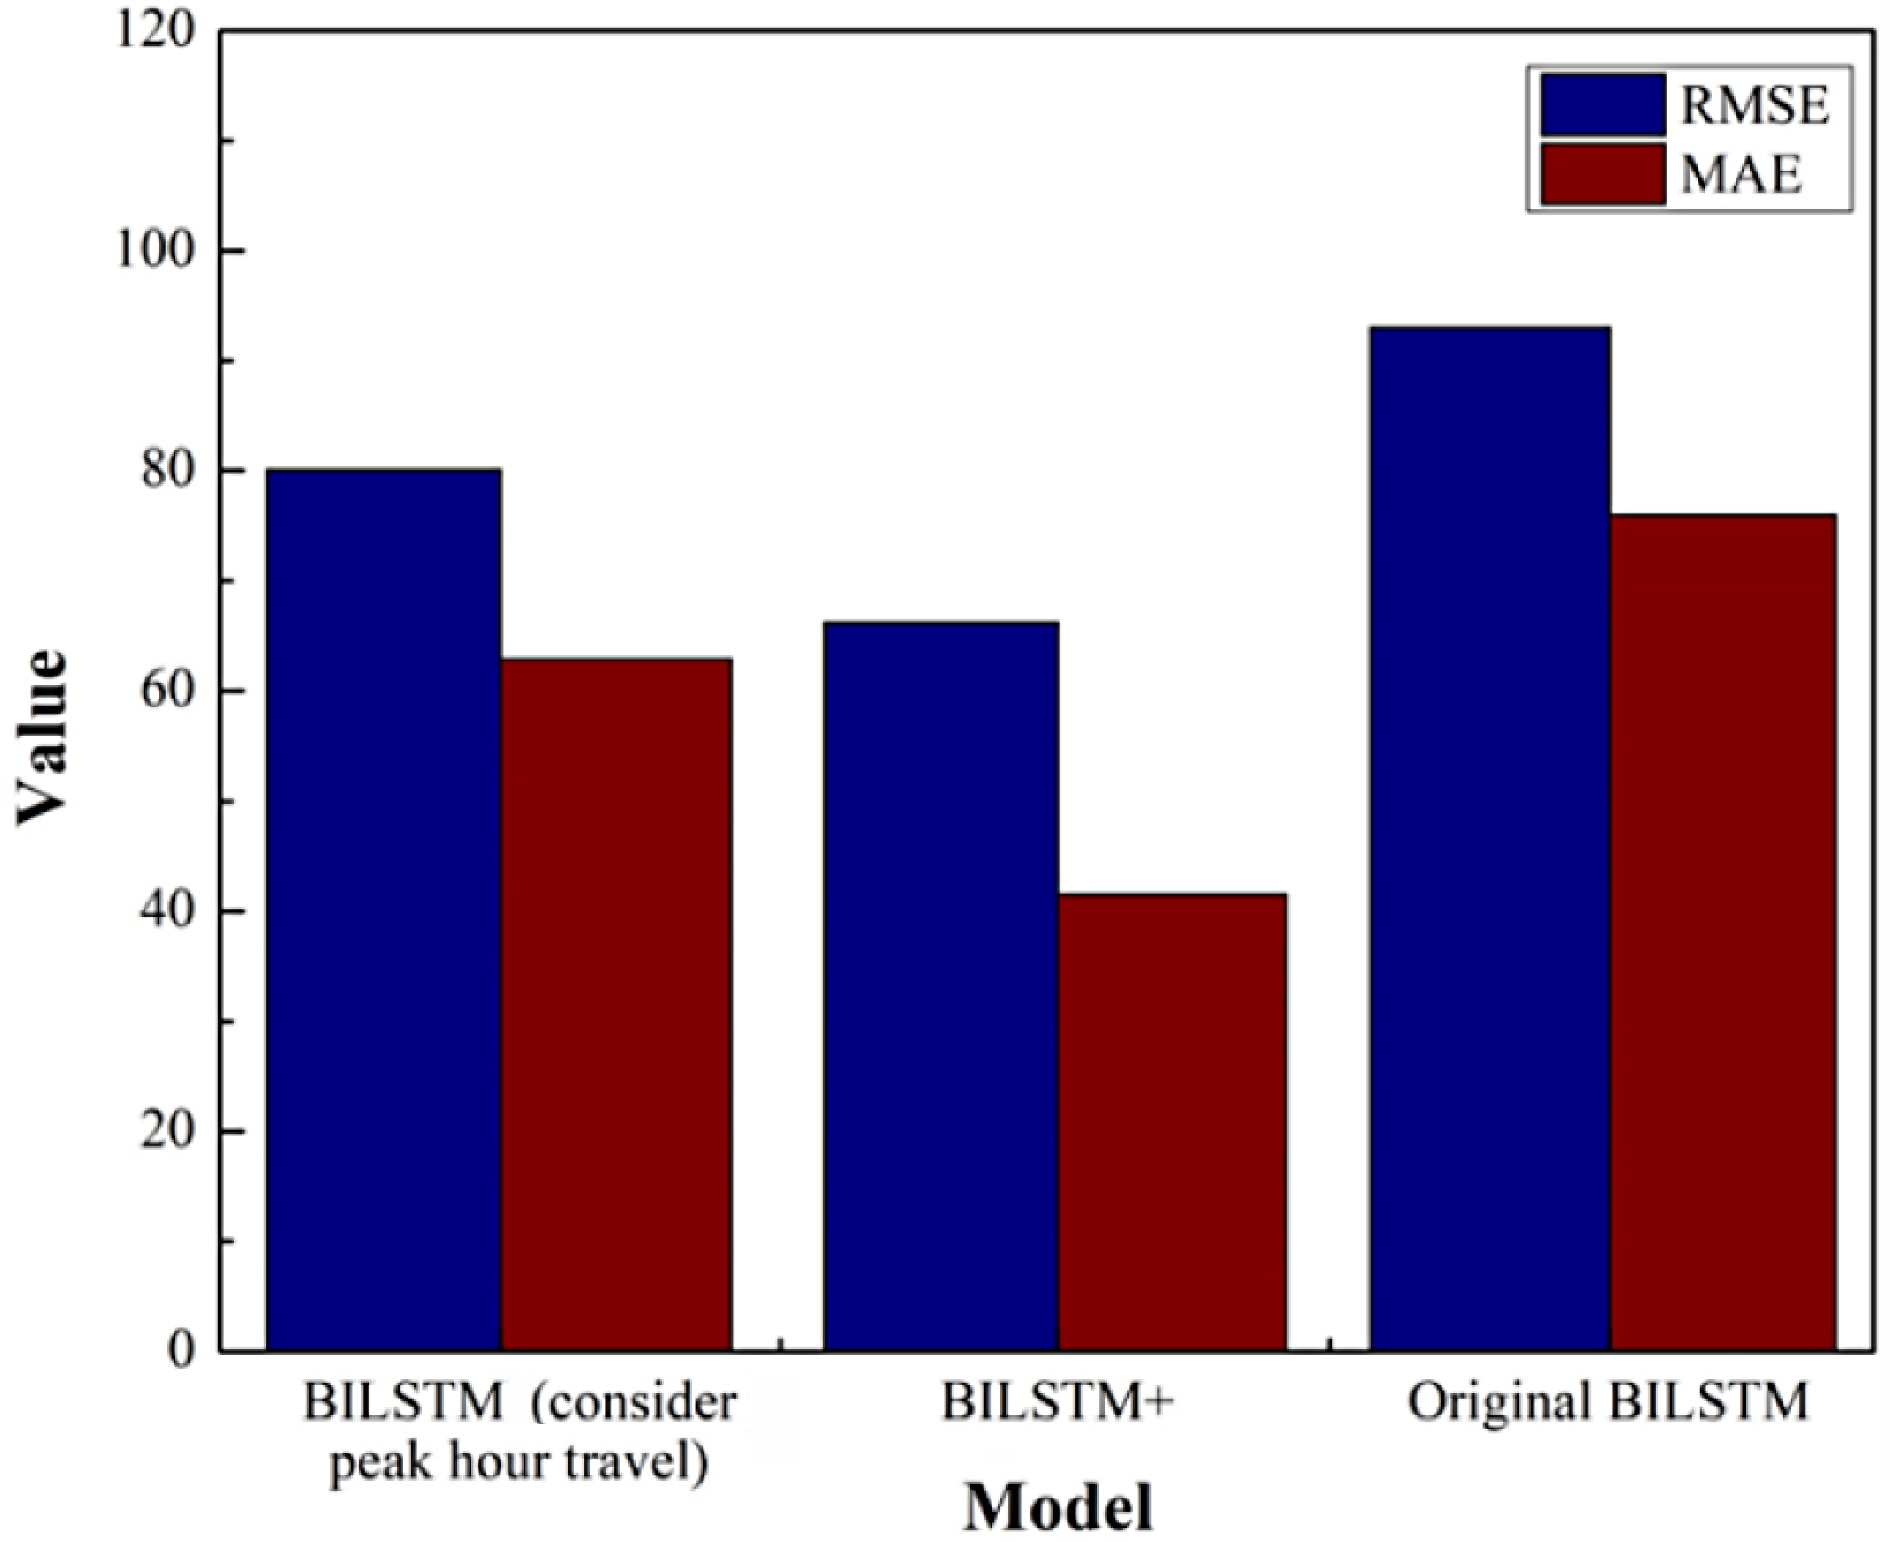
Figure 13.
Comparison of prediction results of different models considering time factors.
-
Author Year Model Considering factors Analyzing influencing factors Zhu et al.[21] 2018 Adam No No Ling et al.[22] 2018 DBSCAN No No Zhang et al.[9] 2019 CB-LSTM No No Zhu et al.[23] 2019 DBN-SVM No No Guo et al. [24] 2019 SVR-LSTM No No Guo et al.[25] 2019 KRR and GPR No No Li et al.[26] 2020 STLSTM No No Zhang & Kabuka[14] 2020 LSTM Yes No Xue et al.[27] 2020 SVR Yes No Liu et al.[28] 2021 MPD No No Jing et al.[29] 2021 LGB-LSTM-DRS No No Liu et al.[30] 2022 DRNN No No He et al.[31] 2022 MGC-RNN No No This paper 2022 BILSTM Yes Yes Table 1.
Literature on passenger flow forecast of rail transit.
-
Card no Time Swipe type Busline Fee Stop no 1057471b906d1eb7 2019-09-16 08:16:32 0 1 1.9 115 c5360d16cf44a600 2019-09-16 08:12:11 1 1 0 125 04b0dbf510ce4d68 2019-09-16 08:14:33 1 1 0 119 8e043c1fcd22c414 2019-09-16 08:17:25 1 1 0 119 987b102a48b2cb3a 2019-09-16 08:16:08 0 1 2.85 115 The first column of the form 'Card no' is the IC card number for rail transit, The second column 'Time' is the card swipe time; and the third column 'Swipe type' is the type of card swipe; The fourth column 'Busline' is the rail transit line; The fifth column 'Fee' is the rail transit fee; and the last column 'Stop no' is the rail transit stop number. Table 2.
Data sample table of rail transit ID cards from Ningbo rail transit.
-
Scale Meaning 1 Indicates that the two factors are of equal importance 3 Indicates that one factor is obviously more important than the other 5 Indicates that one factor is strongly more important than the other 2 and 4 The median value of the above two adjacent judgments Table 3.
Impact classification table[32].
-
A B C D E F G H A 1 3 5 4 4 4 5 4 B 1/3 1 4 1/3 1/3 1/3 2 3 C 1/5 1/4 1 1/2 1/3 1/3 1 1 D 1/4 3 2 1 1 2 3 3 E 1/4 3 3 1 1 1 4 3 F 1/4 3 3 1/2 1 1 3 2 G 1/5 1/2 1 1/3 1/4 1/3 1 1/2 H 1/4 1/3 1 1/3 1/3 1/2 2 1 Table 4.
Expert scoring table.
-
A B C D E F G H A 1 3 4 3 2 2 5 5 B 1/3 1 4 1 1/2 1/2 3 3 C 1/4 1/4 1 1/2 1/3 1/3 1 1 D 1/3 1 2 1 1/2 1 3 3 E 1/4 2 3 2 1 1 5 4 F 1/3 2 3 1 1 1 5 3 G 1/5 1/3 1 1/3 1/5 1/5 1 1 H 1/5 1/3 1 1/3 1/4 1/3 1 1 Table 5.
Expert scoring table.
-
A B C D E F G H A 1 4 4 3 3 2 4 3 B 1/4 1 3 1/2 1/3 1/2 5 4 C 1/4 1/3 1 1/3 1/3 1/3 1 1 D 1/3 2 3 1 1/2 1 4 3 E 1/3 3 3 2 1 1 4 4 F 1/2 2 3 1 1 1 4 4 G 1/4 1/5 1 1/4 1/4 1/4 1 1 H 1/3 1/4 1 1/3 1/4 1/4 1 1 Table 6.
Expert scoring table.
-
Result 1 Result 2 Result 3 Average value Commuting travel 0.345438 0.282882 0.279956 0.3027 Entertainment travel 0.090772 0.117853 0.109588 0.1061 Family income 0.046612 0.050254 0.047959 0.0483 Weather conditions 0.150039 0.115545 0.136994 0.1342 Road congestion 0.145680 0.182969 0.182856 0.1705 Distance from OD to subway station 0.125766 0.163270 0.158760 0.1493 Publicity policies 0.041781 0.041723 0.041390 0.0416 Preferential ticket policies 0.053911 0.045504 0.042497 0.0473 Maximum eigenvalue 8.572622 8.175512 8.296744 8.3483 Consistency index 0.081803 0.025073 0.042392 0.0497 Consistency ratio 0.058016 0.017782 0.030065 0.0353 Table 7.
AHP analysis results table.
-
Sum of squares Degrees
of freedomMean square F Sig Within groups 2430713412 23 390252218.9 199.685 0.000 Between groups 50808048.00 96 4441782.306 Total 2481521460 119 Table 8.
ANOVA analysis results table.
-
Group Number of cases Average value of
passenger flowIntra-group significance 00:00 5 0.00 0.930 01:00 5 0.00 02:00 5 0.00 03:00 5 0.00 04:00 5 0.00 05:00 5 6.20 23:00 5 47.80 22:00 5 1781.40 1.000 06:00 5 2741.40 1.000 21:00 5 4496.00 0.688 11:00 5 4863.20 20:00 5 4889.20 12:00 5 4939.60 10:00 5 5333.60 14:00 5 5387.20 13:00 5 5514.80 19:00 5 5808.00 15:00 5 6490.60 0.237 09:00 5 7002.60 16:00 5 7577.40 7:00 5 10478.80 1.000 17:00 5 12819.20 0.208 18:00 5 13402.00 8:00 5 15960.60 1.000 Table 9.
Hourly passenger flow grouping.
-
Parameter Value Number of hidden layers 2 Number of each hidden layer neurons 15 Training times 50 Activation function of hidden recurrent layers tanh Learning rate 0.02 Backstep 24 Table 10.
Detailed description of parameters.
-
Metric Formula RMSE ${\rm{RMSE}}=\sqrt {\dfrac{1}{n}\displaystyle\sum\limits^n_{i=1}(y_p-y)^2} $ MAE ${\rm{MAE}}=\dfrac{1}{n}\displaystyle\sum\limits^n_1\left|y_p-y\right| $ R2 score ${\rm{R2}}=1-\dfrac{\displaystyle \sum\nolimits^{n-1}_{i=0}\left(y_p-y\right)^2}{\displaystyle\sum\nolimits^{n-1}_{i=0}\left(y-\bar Y\right)} $ $ n $ $ y_{p} $ $ y $ Table 11.
Predictive evaluation index formula.
-
RNN GRU LSTM BILSTM GCN BILSTM+ RMSE 168.382 146.560 113.062 90.894 152.308 62.503 170.353 141.397 119.892 91.684 148.965 60.165 165.936 139.872 110.674 87.541 146.589 63.847 175.364 149.681 107.985 91.983 151.862 65.734 169.872 150.219 115.621 89.548 145.962 62.476 Average 169.981 145.546 113.447 90.330 149.137 62.945 MAE 137.713 120.513 94.716 76.353 130.112 41.621 138.761 115.561 99.061 77.872 128.962 39.592 134.823 113.872 91.691 74.184 131.621 41.932 143.652 123.641 89.549 77.297 127.923 43.291 138.982 124.034 96.082 75.832 125.982 41.095 Average 138.786 119.524 94.220 76.308 128.920 41.506 R2 0.772 0.827 0.897 0.913 0.789 0.969 0.769 0.815 0.881 0.910 0.802 0.973 0.780 0.811 0.902 0.915 0.793 0.968 0.786 0.832 0.909 0.908 0.810 0.961 0.774 0.833 0.885 0.912 0.793 0.970 Average 0.776 0.824 0.895 0.912 0.797 0.968 Table 12.
Model evaluation index value.
Figures
(13)
Tables
(12)