-
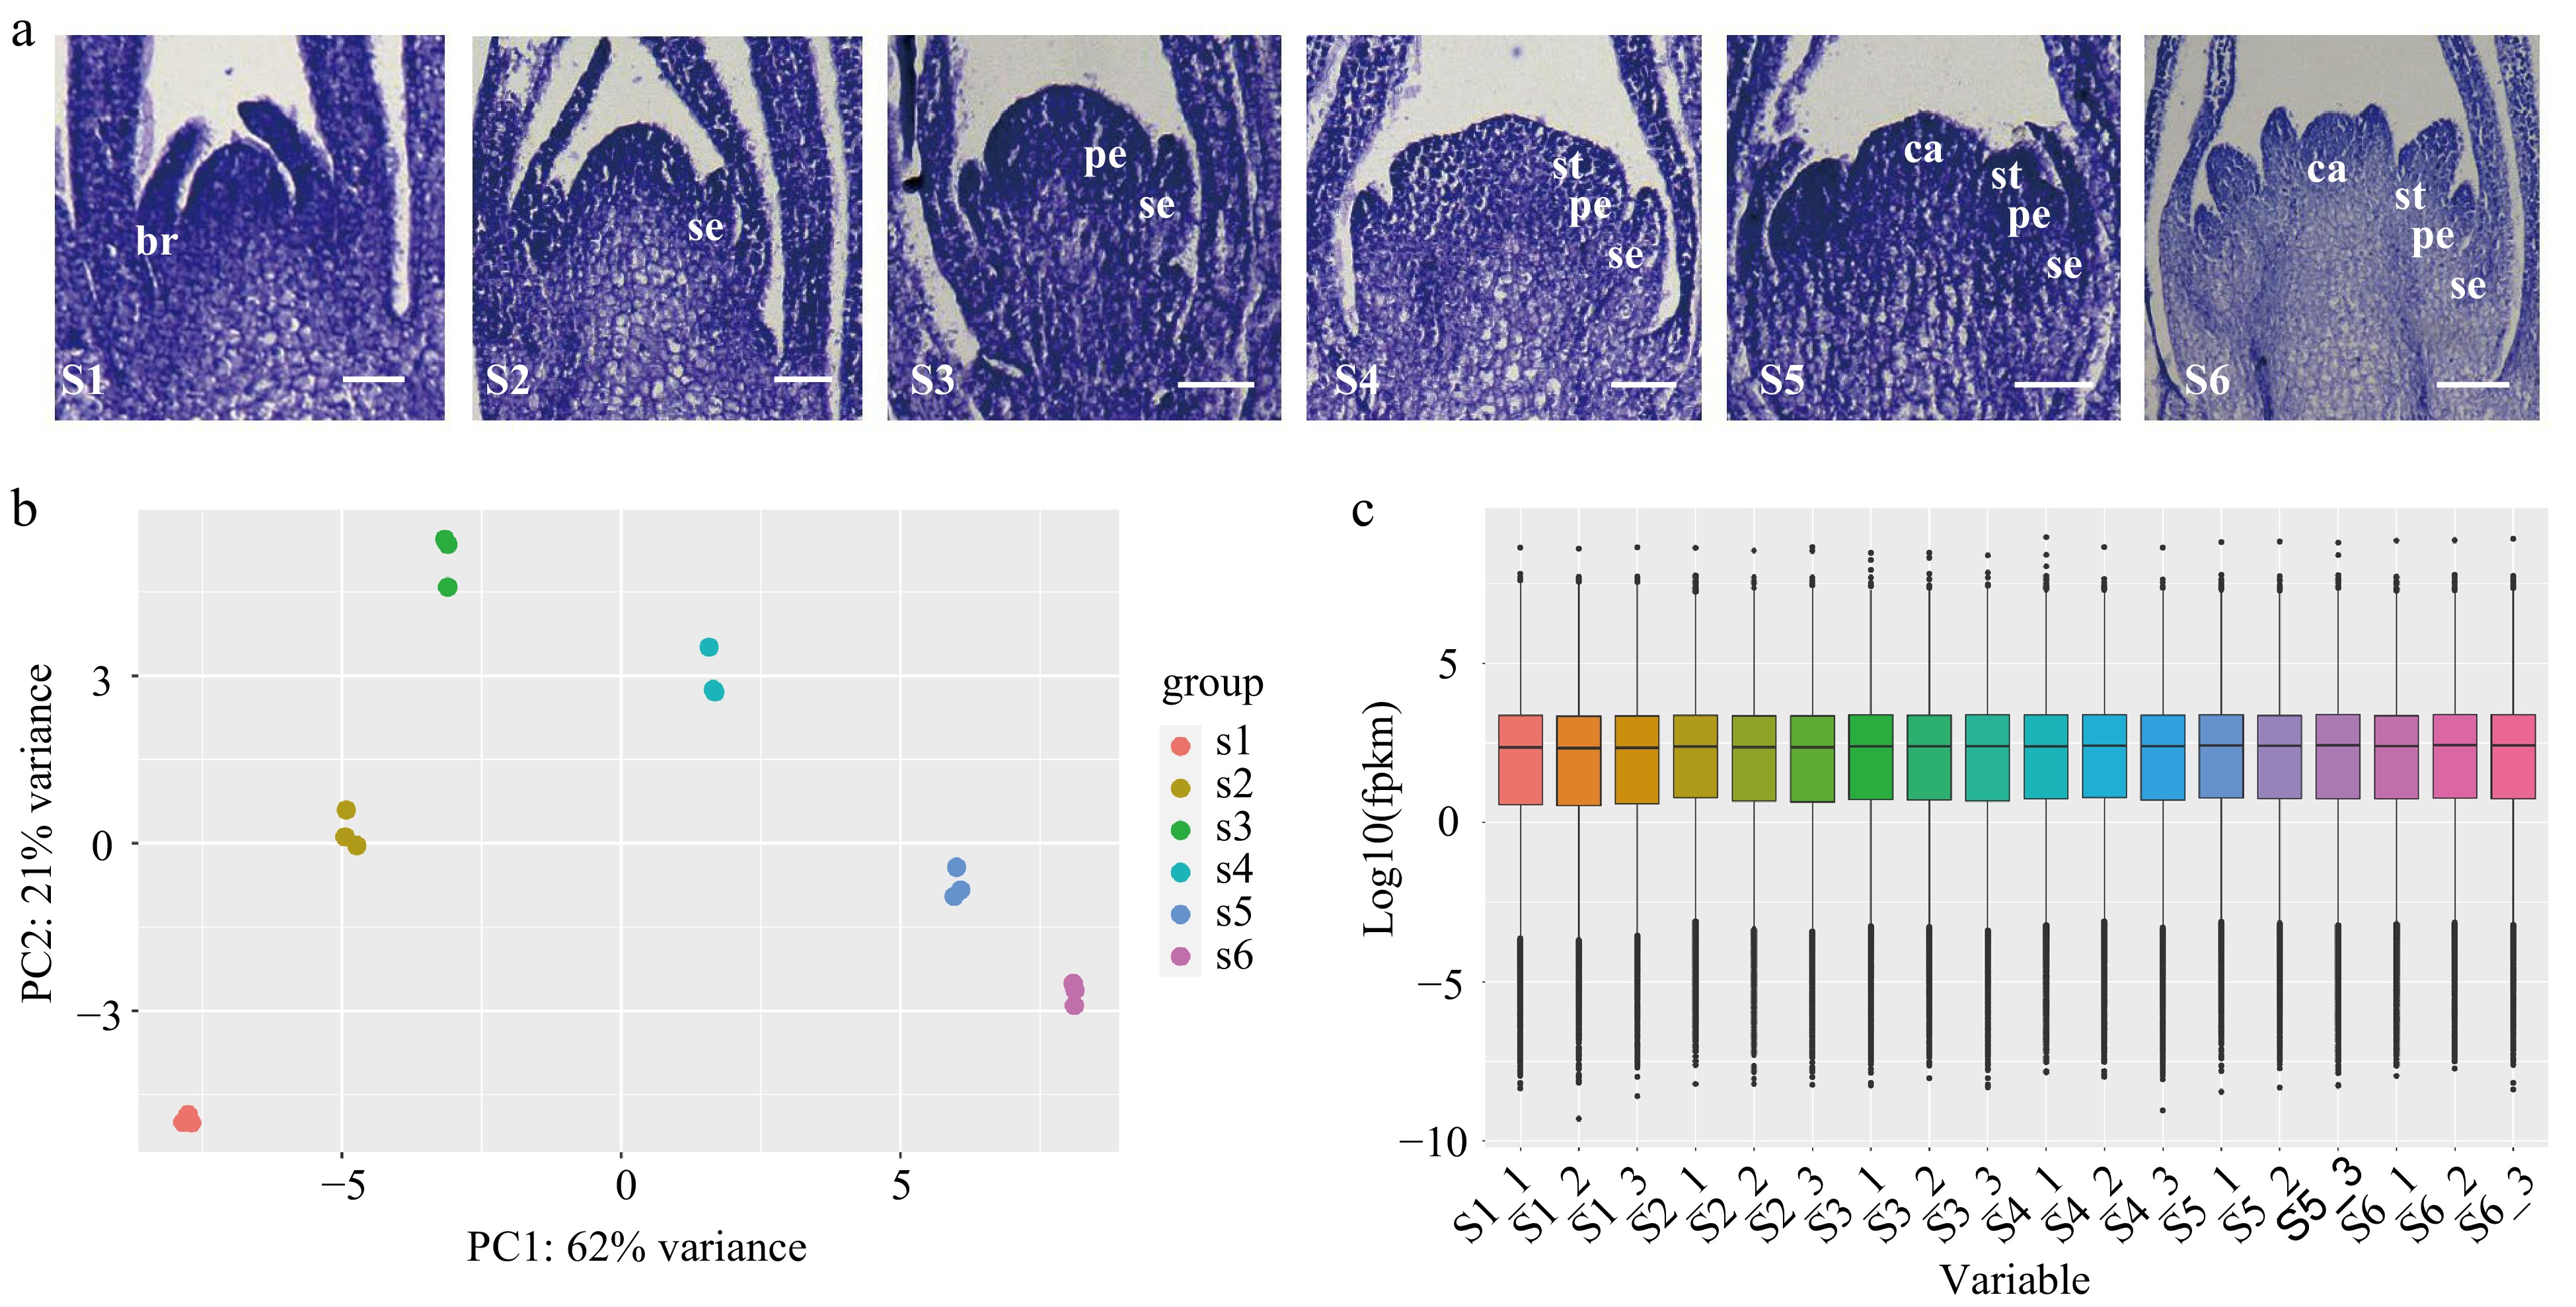
Figure 1.
Transcriptome sequencing of flowers at different floral organ primordium developmental stages in D. chinensis. (a) Floral organ primordium at different developmental stages. (b) Principal component analysis (PCA) analysis of different samples. (c) The expression in floral organ primordium at different stages. S1: the stage of floral initiation. S2: Sepal primordium development stage. S3: Petal primordium development stage. S4: Stamen primordium development stage. S5: Carpel primordium development stage. S6: Late stage of differentiation of floral organ primordium. br. bract; se. sepal; pe. petal; st. stamen; ca. carpel.
-
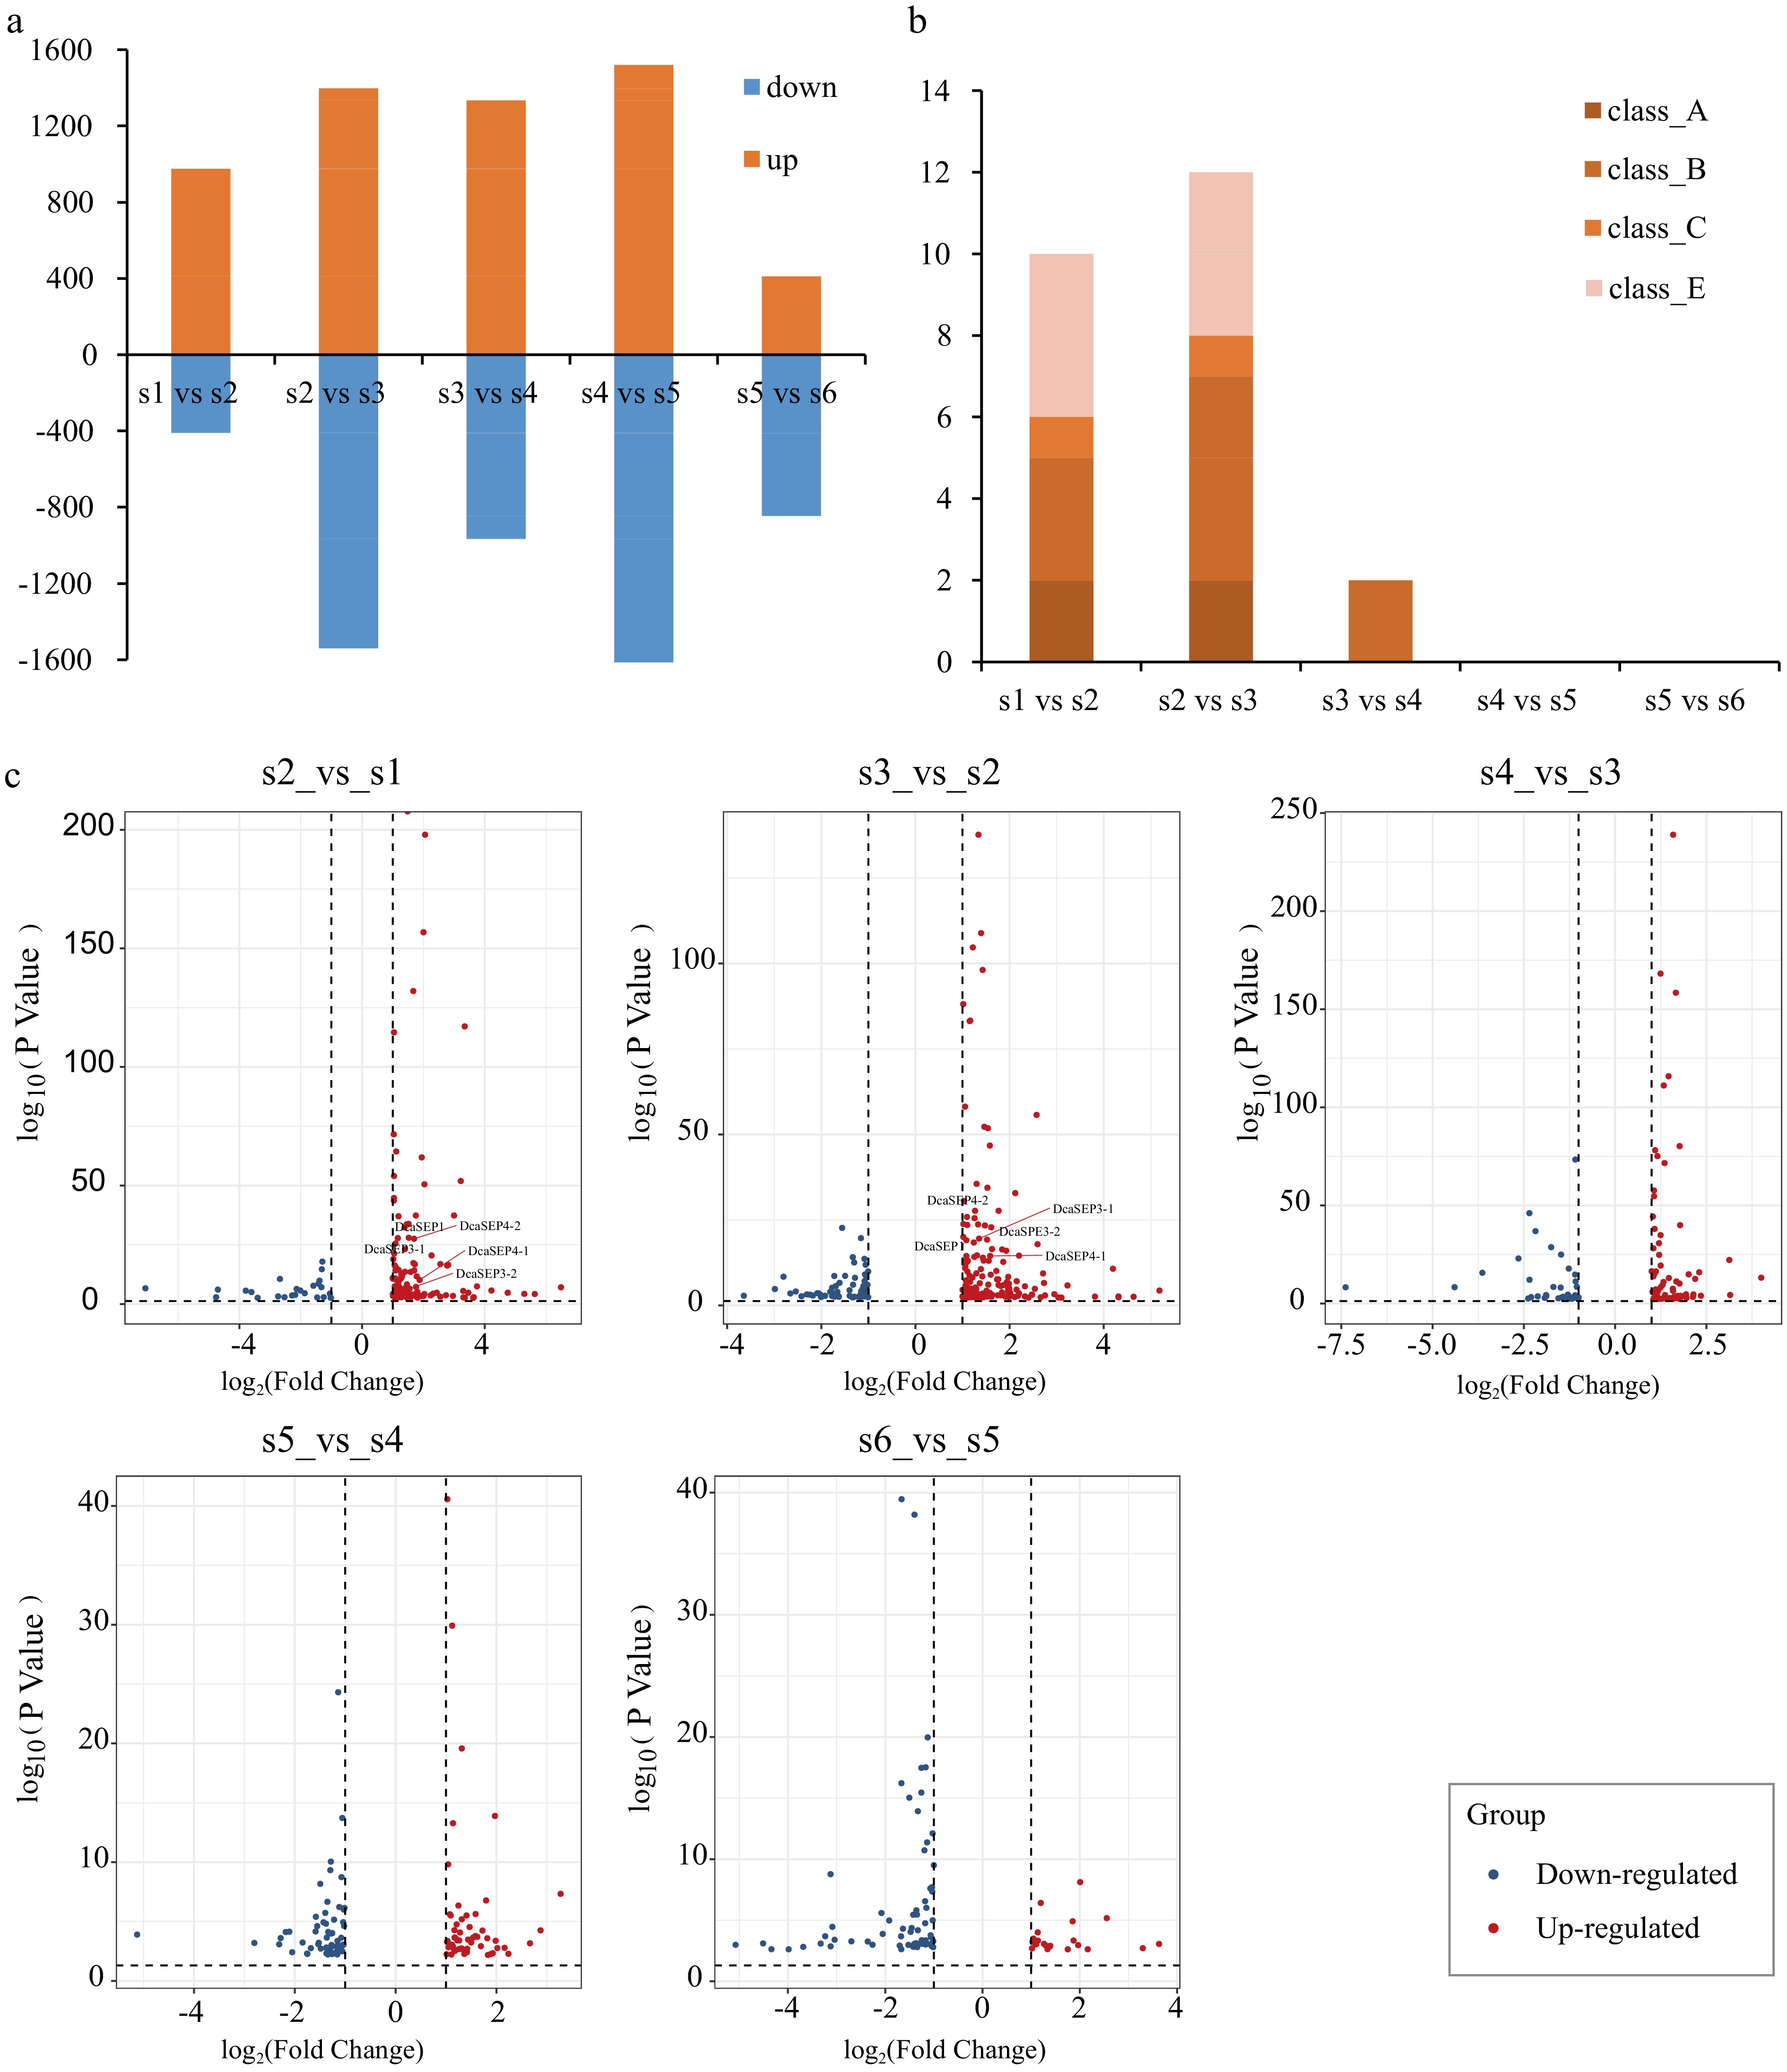
Figure 2.
Analysis of differential expression genes in different floral organs primordium development stages. (a) Bar graph showing differential expression genes (DEG) number of up-regulated and down-regulated in different pair comparisons (S2_vs_S1, S3_vs_S2, S4_vs_S3, S5_vs_S4 and S6_vs_S5). (b) The number of ABCE class MADS-box genes with differentially expressed in different comparison. (c) The DEGs of class E genes in each different comparison are displayed. Red represents up-regulated genes and blue represents down-regulated genes.
-
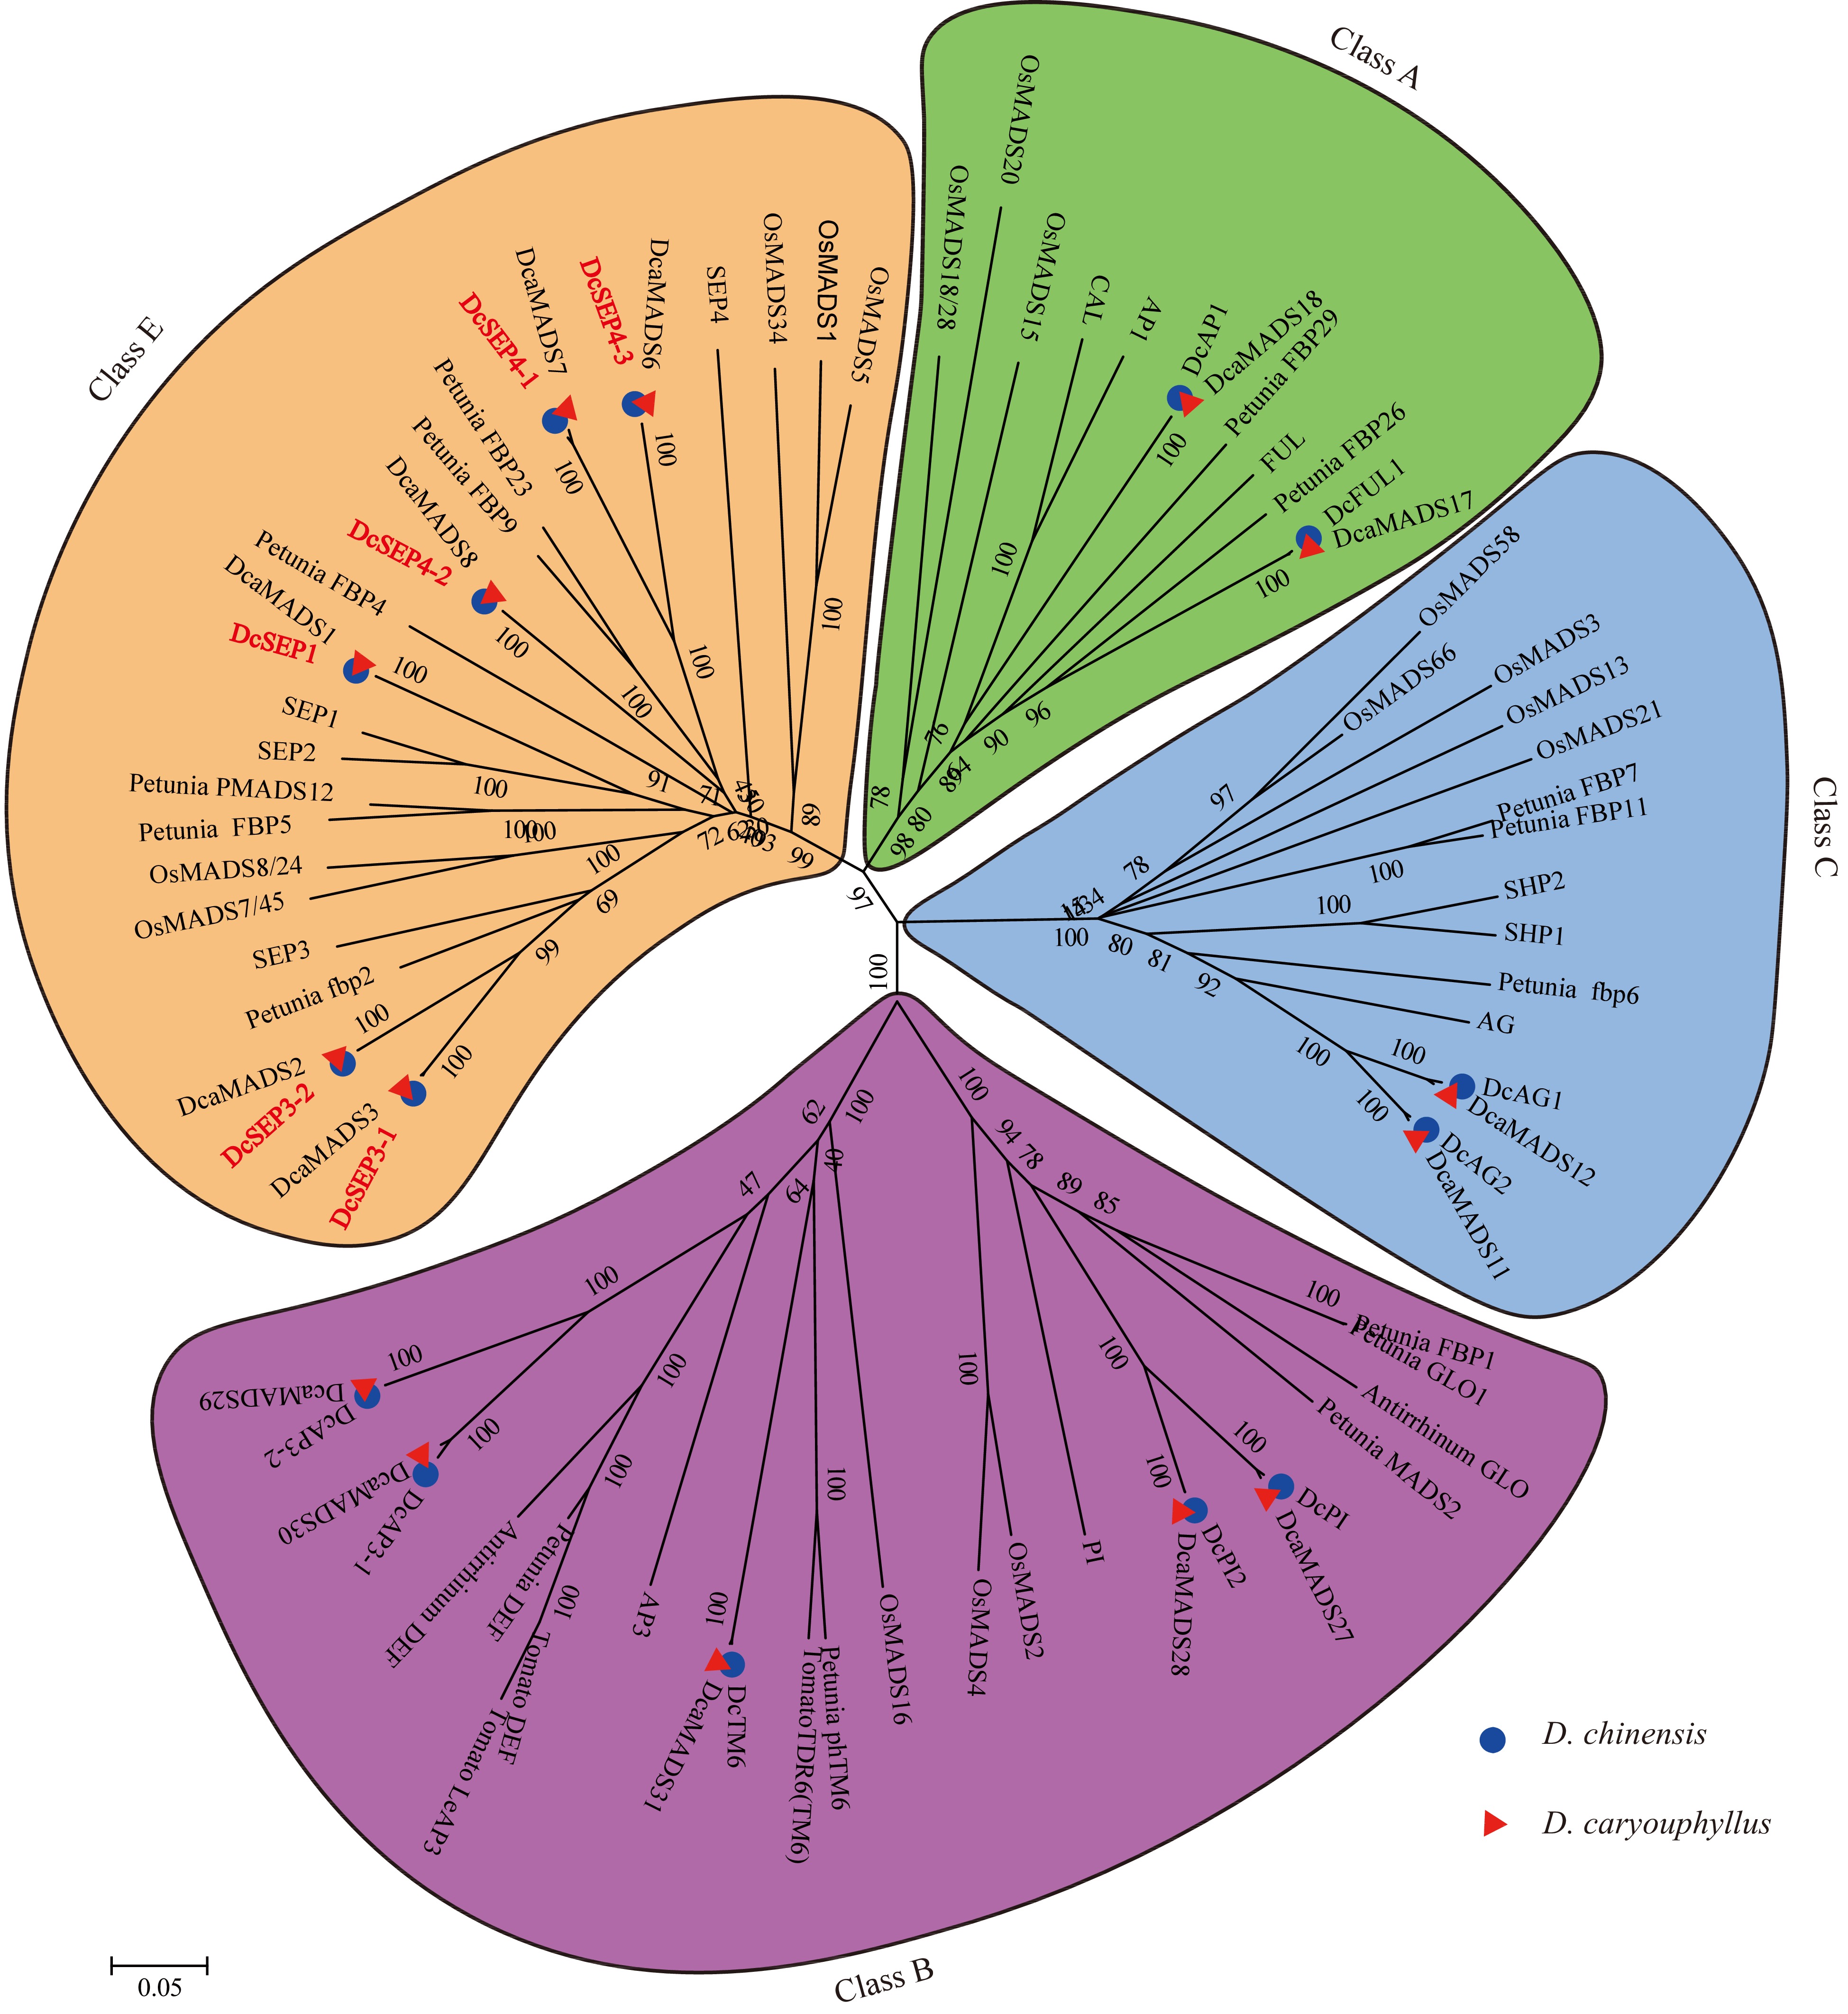
Figure 3.
The phylogenetic tree of the class A-, B-, C- and E- proteins. The subgroups are indicated by different colors.
-
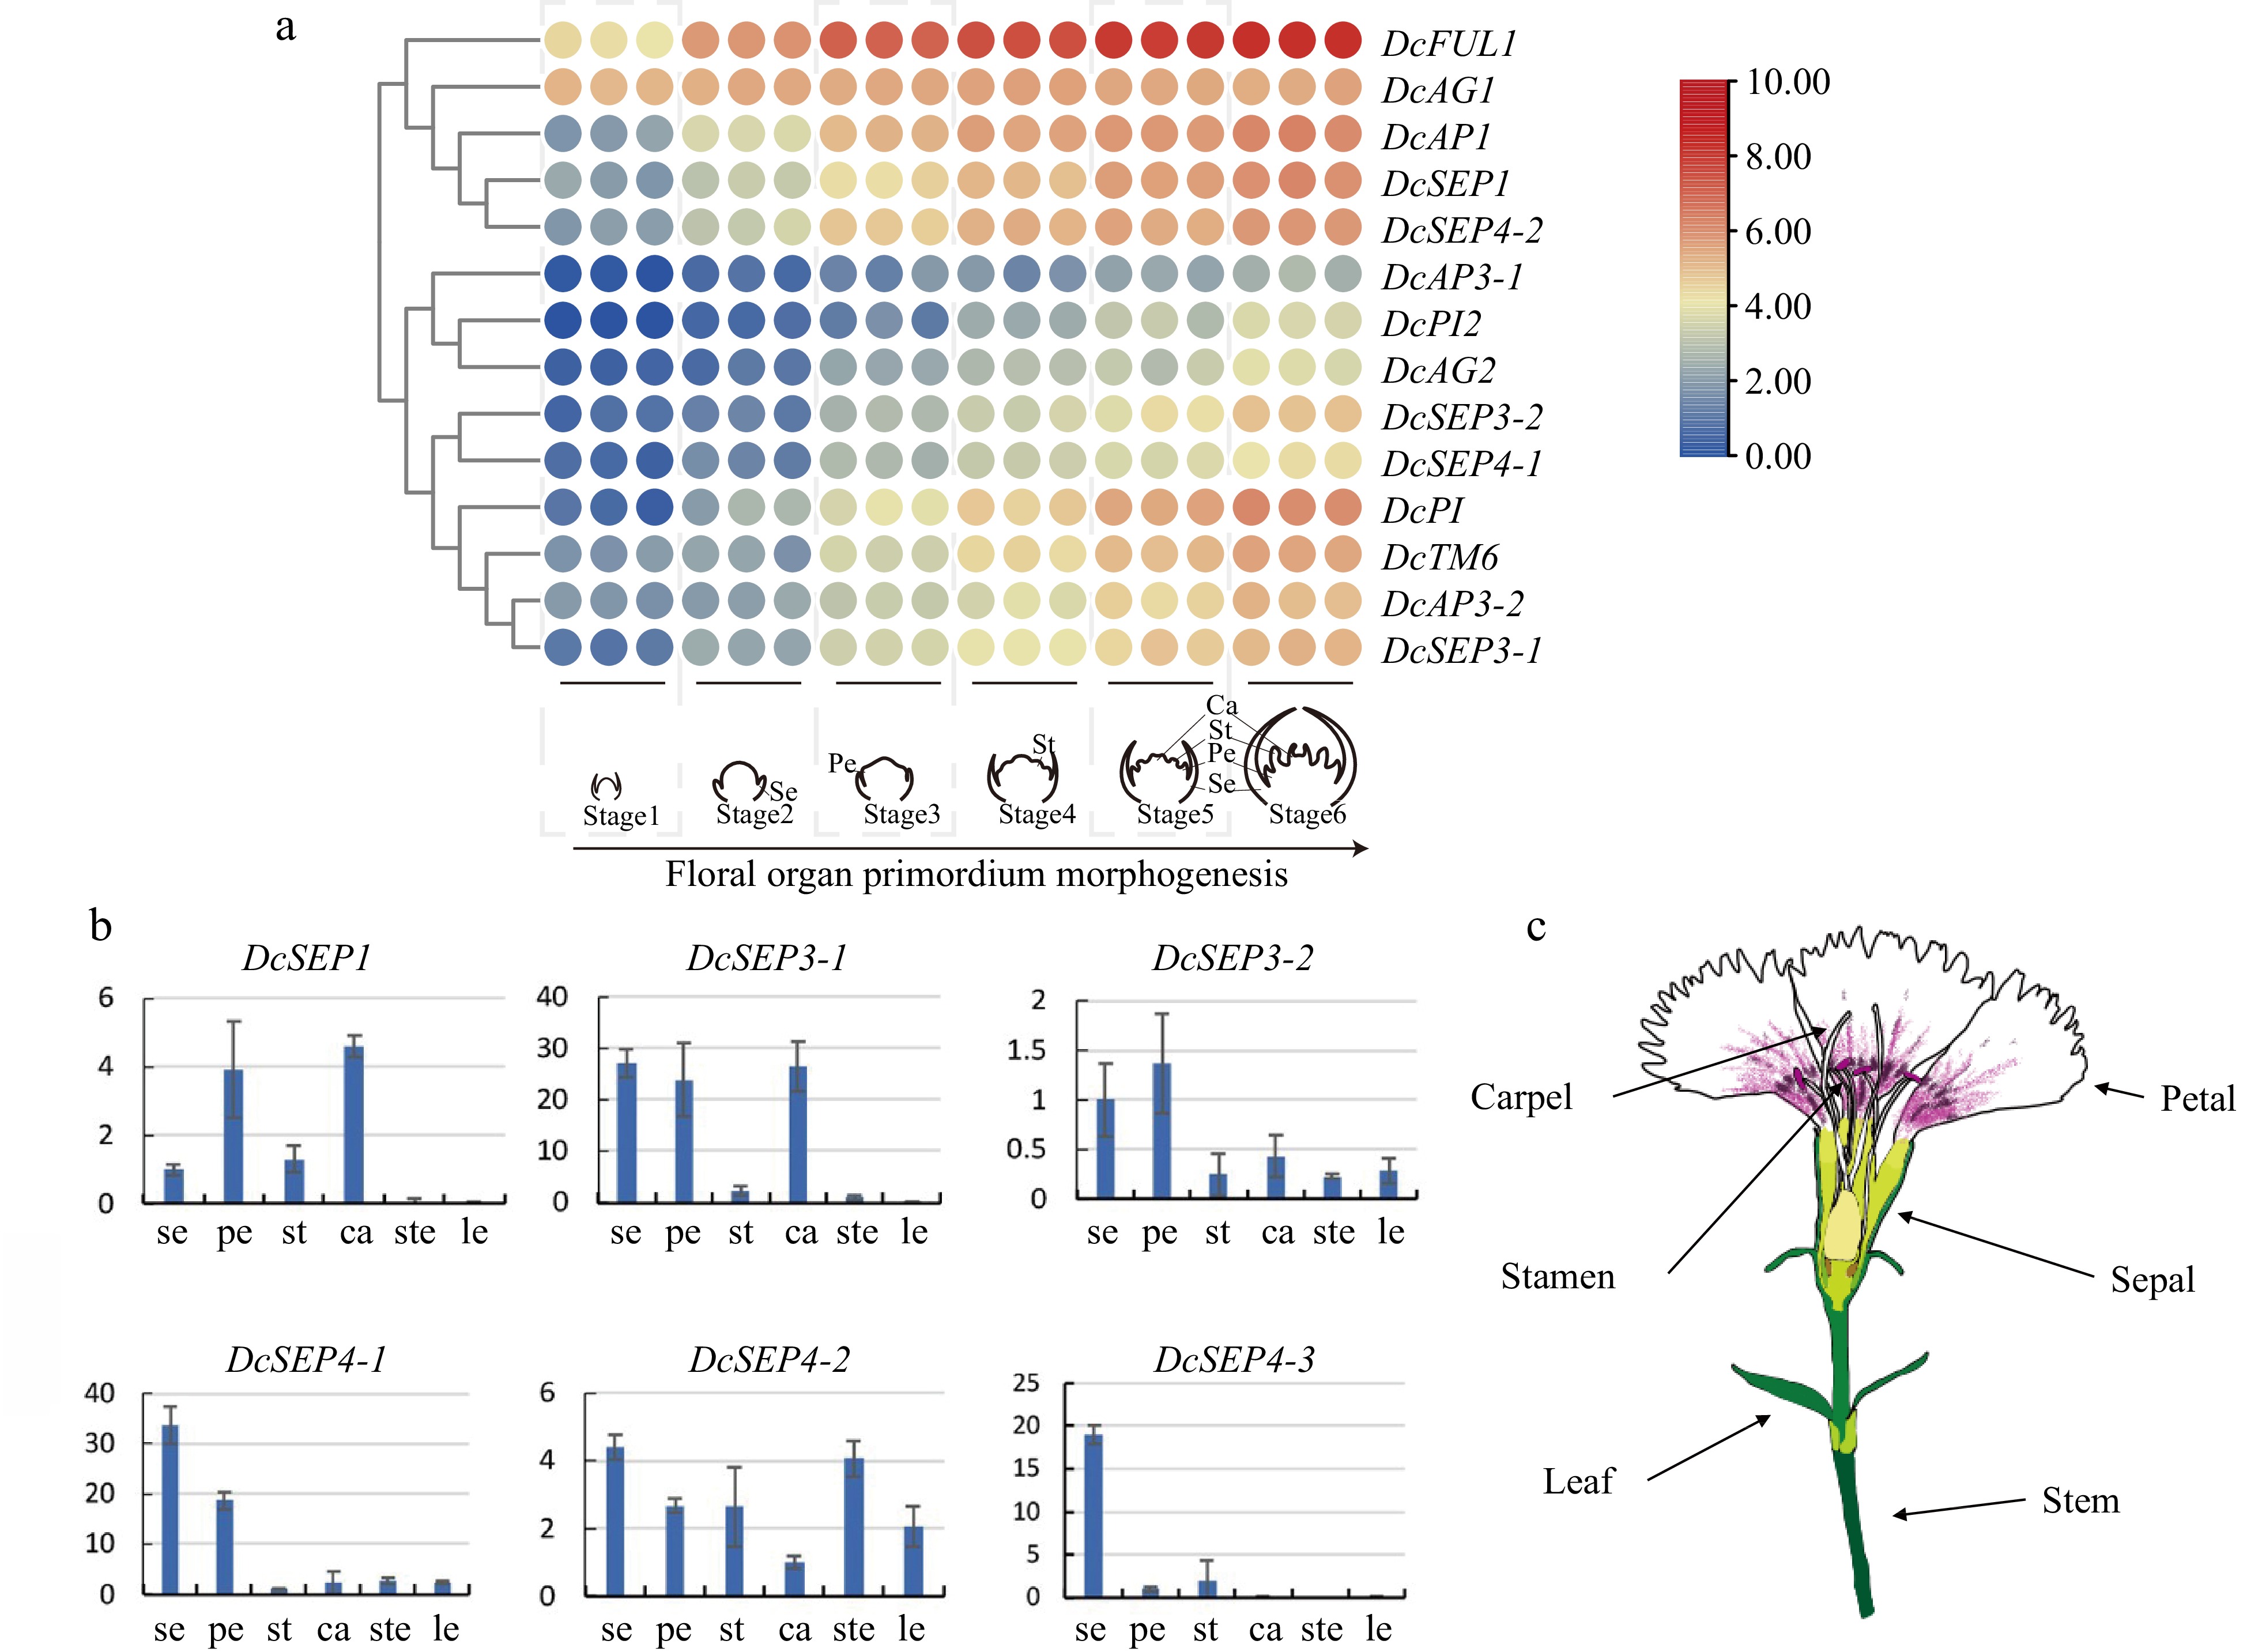
Figure 4.
Analysis of expression in D. chinensis E class genes at different tissues and stages. (a) The spatial expression patterns of class E genes in developing flowers of D. chinensis as revealed by RNA-seq. (b) The expression of six class E genes of D. chinensis in different organs were detected by qRT–PCR. Error bars indicate the collective standard deviations of three biological replicates and three technical replicates. se, sepal. pe, petal. st, stamen. ca, carpel. ste, stem. le, leaf. (c) The different organs of D. chinensis.
-
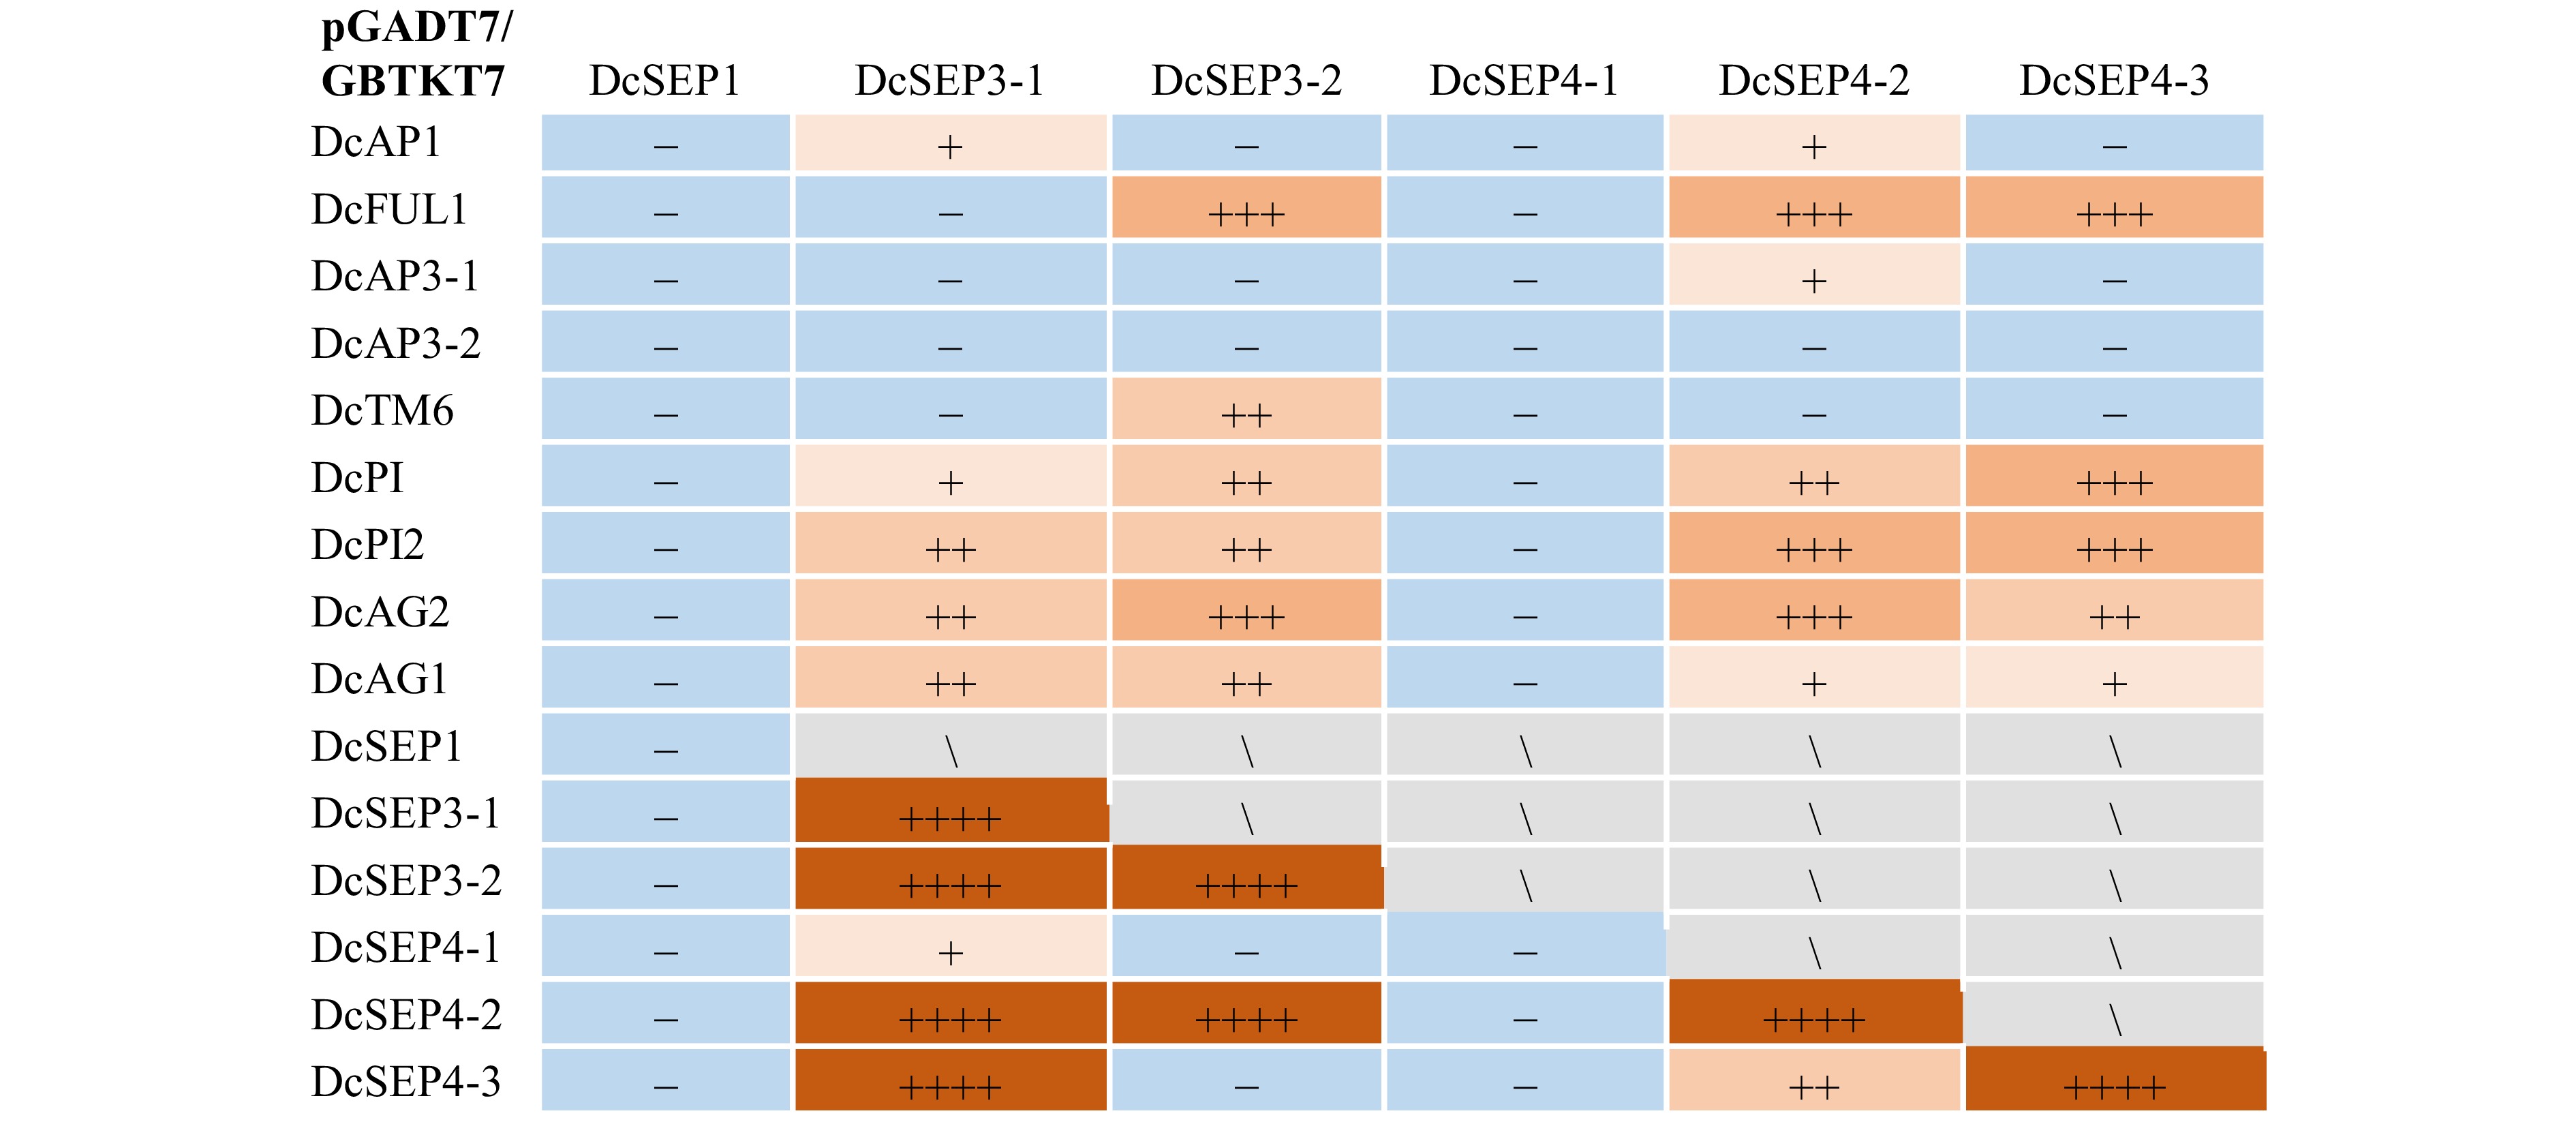
Figure 5.
The interaction statistics of class E proteins with other class A−, B−, C genes in D. chinensis. '+' in light orange represents weak interaction; '++' in orange represents moderate interaction; '+++' in deep orange represents relatively strong interaction; '++++' in brown represents strong interaction; '−' in bule represents that there is no detectable interaction of proteins, '\' in grey represents did not cover in this study.
-
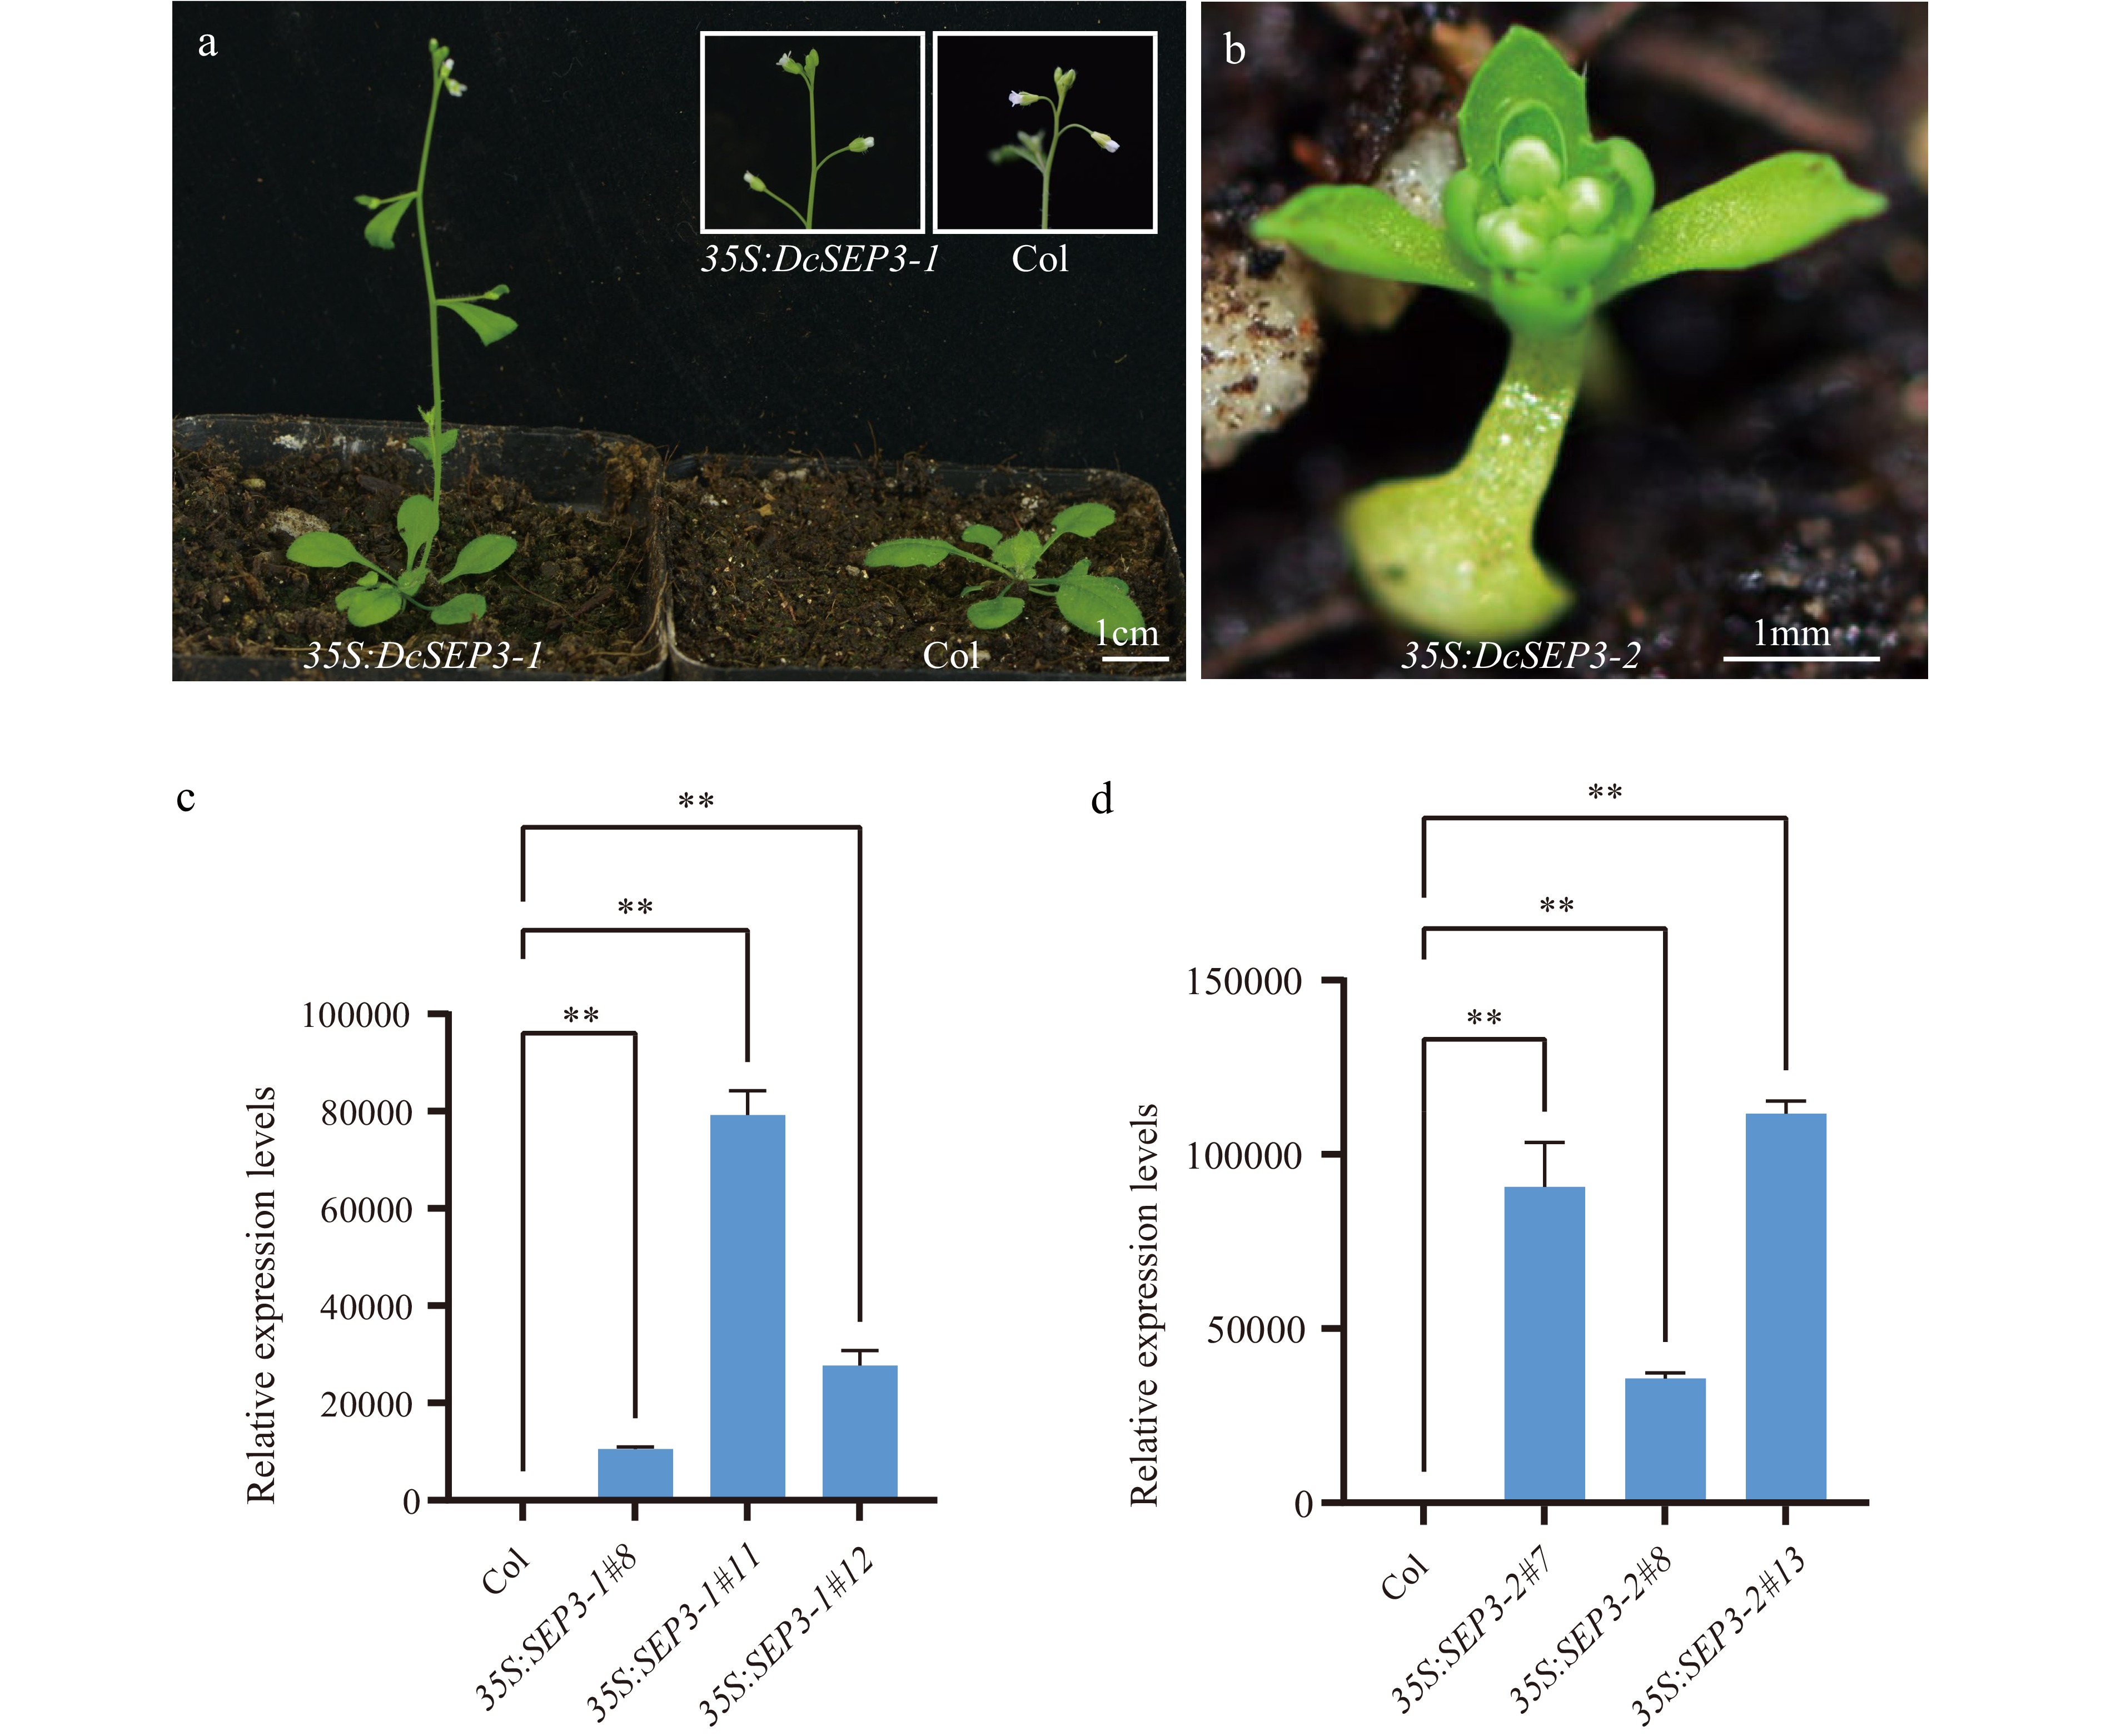
Figure 6.
Phenotype and expression analysis of D. chinensis class E genes overexpression in A. thaliana. (a) Transgenic plant of 35S:DcSEP3-1 (left), Columbia (Col) Arabidopsis (right). (b) Transgenic plant of 35S:DcSEP3-2. (c) Expression of DcSEP3-1 in transgenic lines. (d) Expression of DcSEP3-2 in transgenic lines. Data represent the mean ± SE from three biological replicates, and AtEF1a was used as internal control. Significant difference was shown at p < 0.01 (**).
-
Table 1.
The number and references of class E homologous genes in different species.
Figures
(6)
Tables
(1)