-
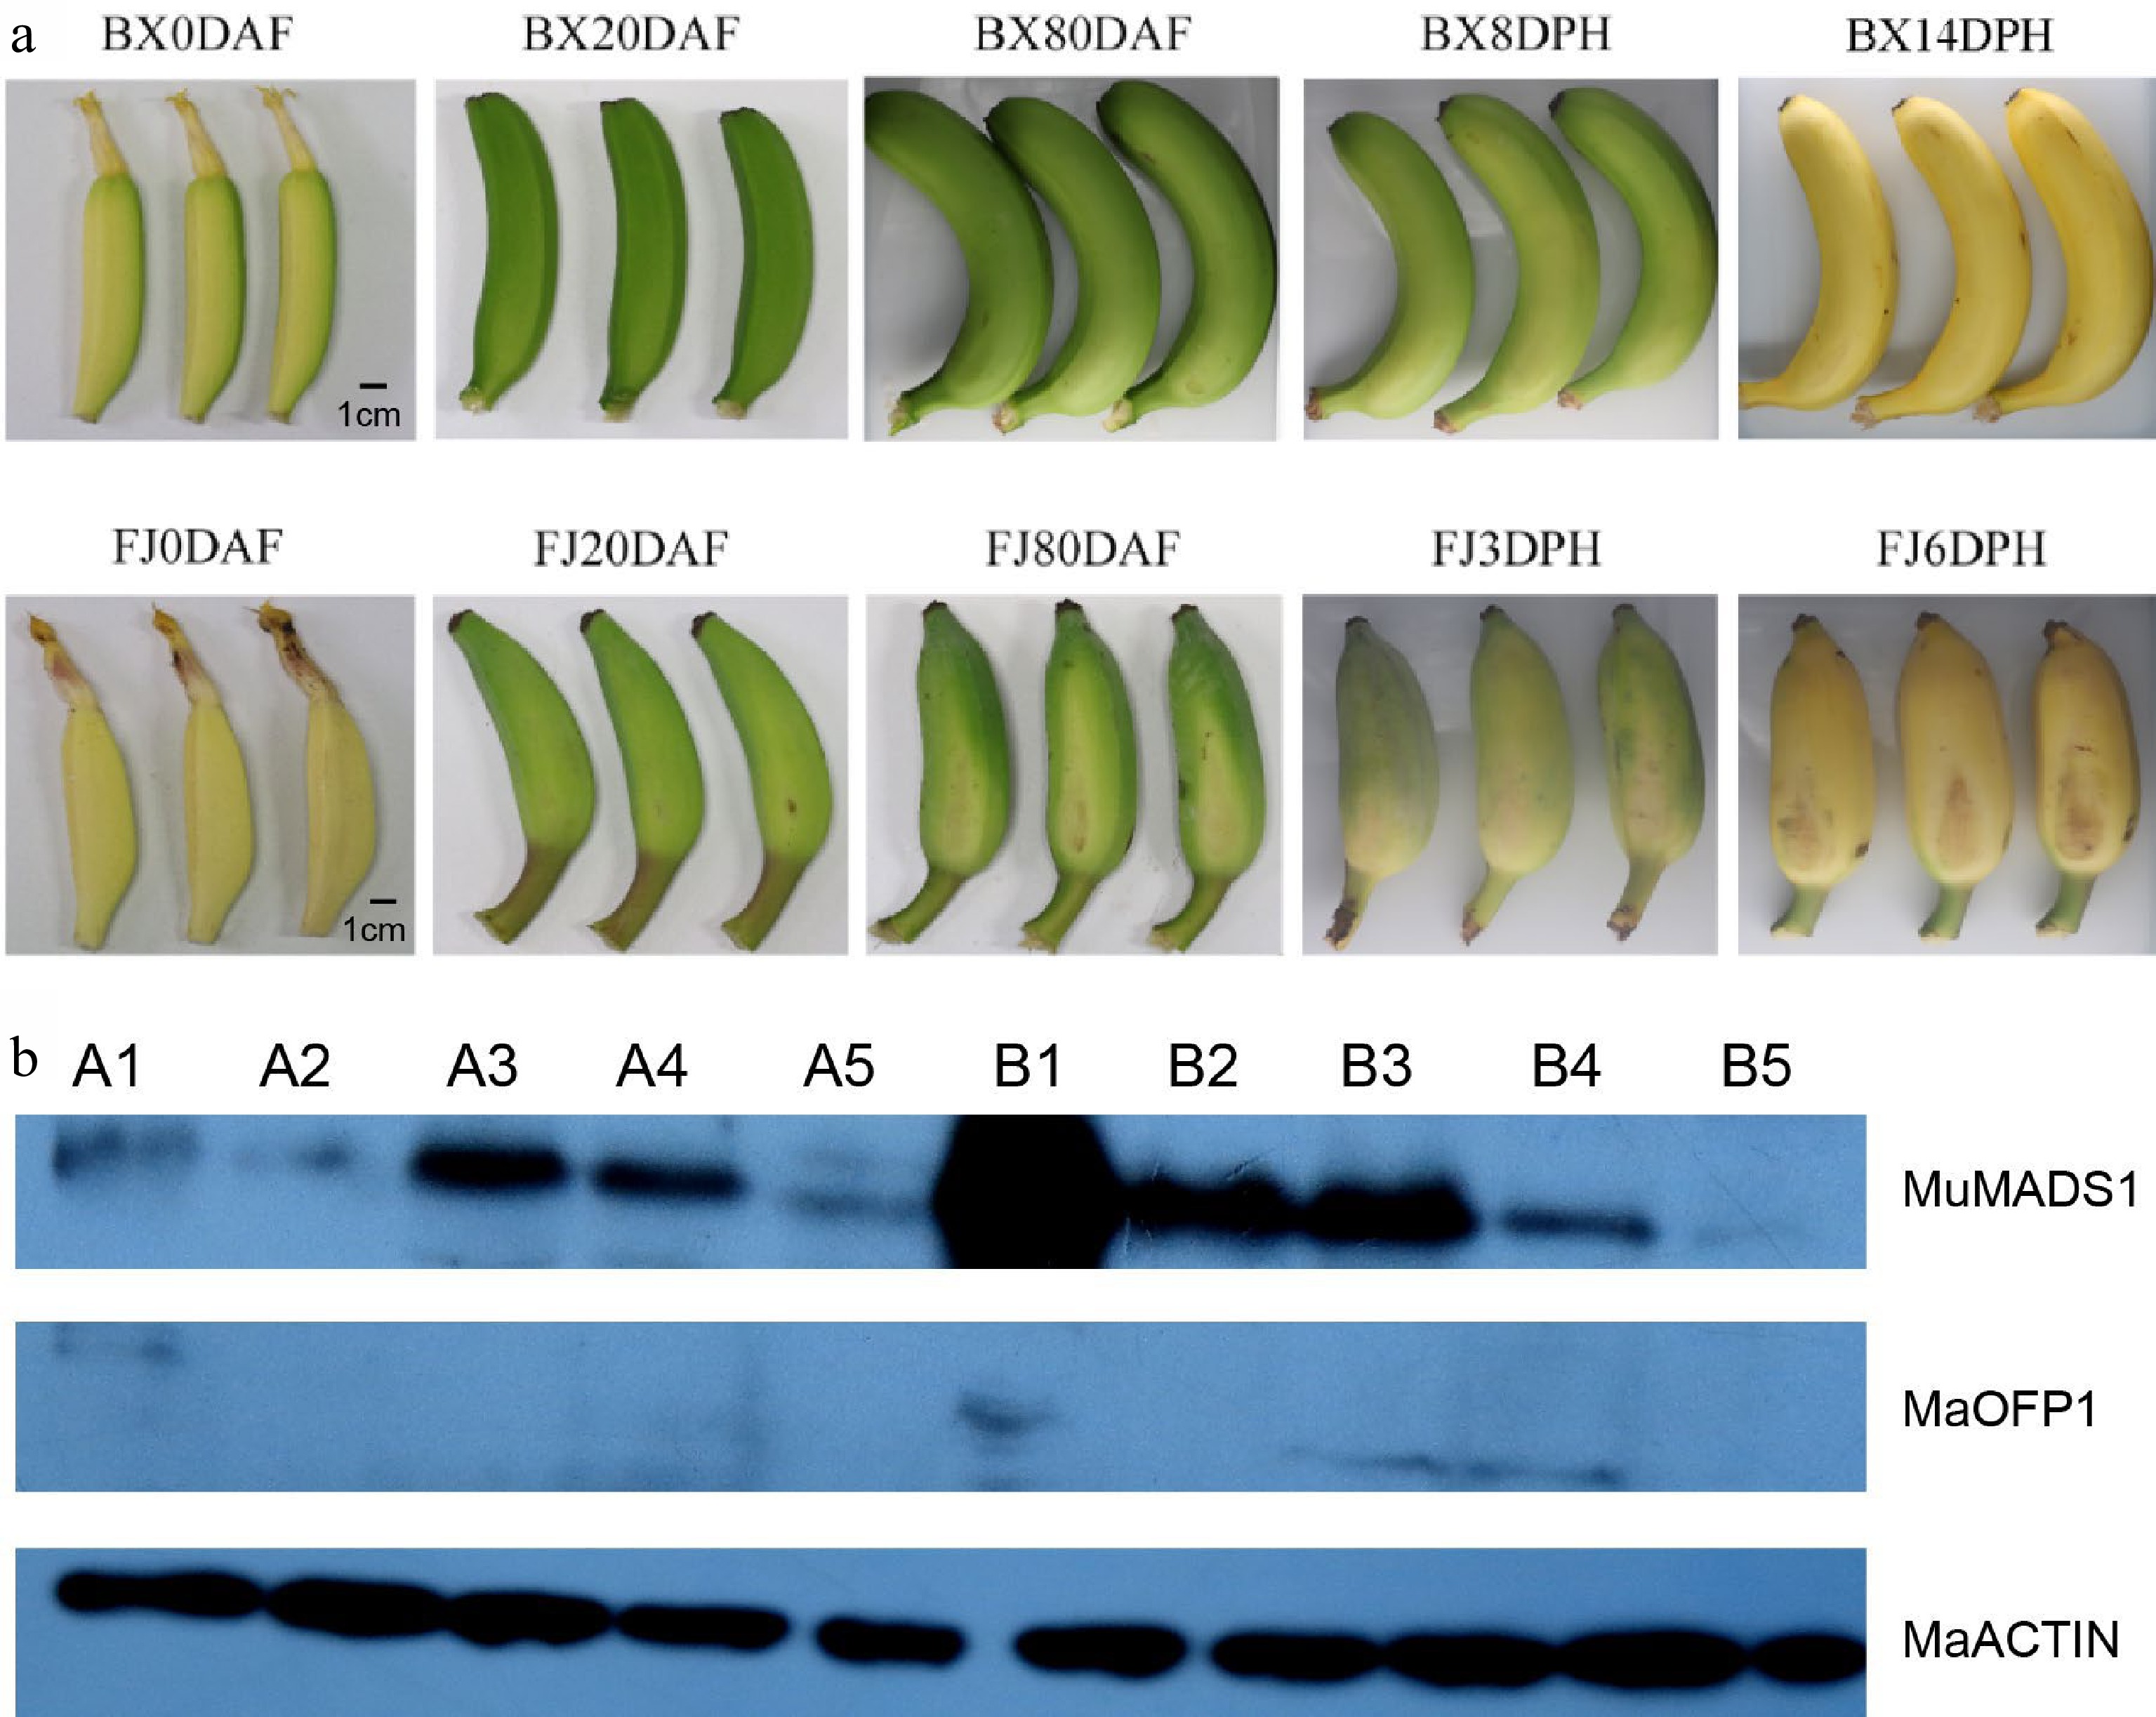
Figure 1.
Differential expression of MuMADS1 and MaOFP1 proteins at banana fruit developing and ripening stages. (a) Phenotype of banana fruit developing and ripening stages. A1−A5 represent 0 DAF, 20 DAF, 80 DAF (0 DPH), 8 DPH and 14 DPH of BX, respectively. (b) Protein expression. B1−B5 represent 0 DAF, 20 DAF, 80 DAF (0 DPH), 3 DPH and 6 DPH of FJ, respectively.
-
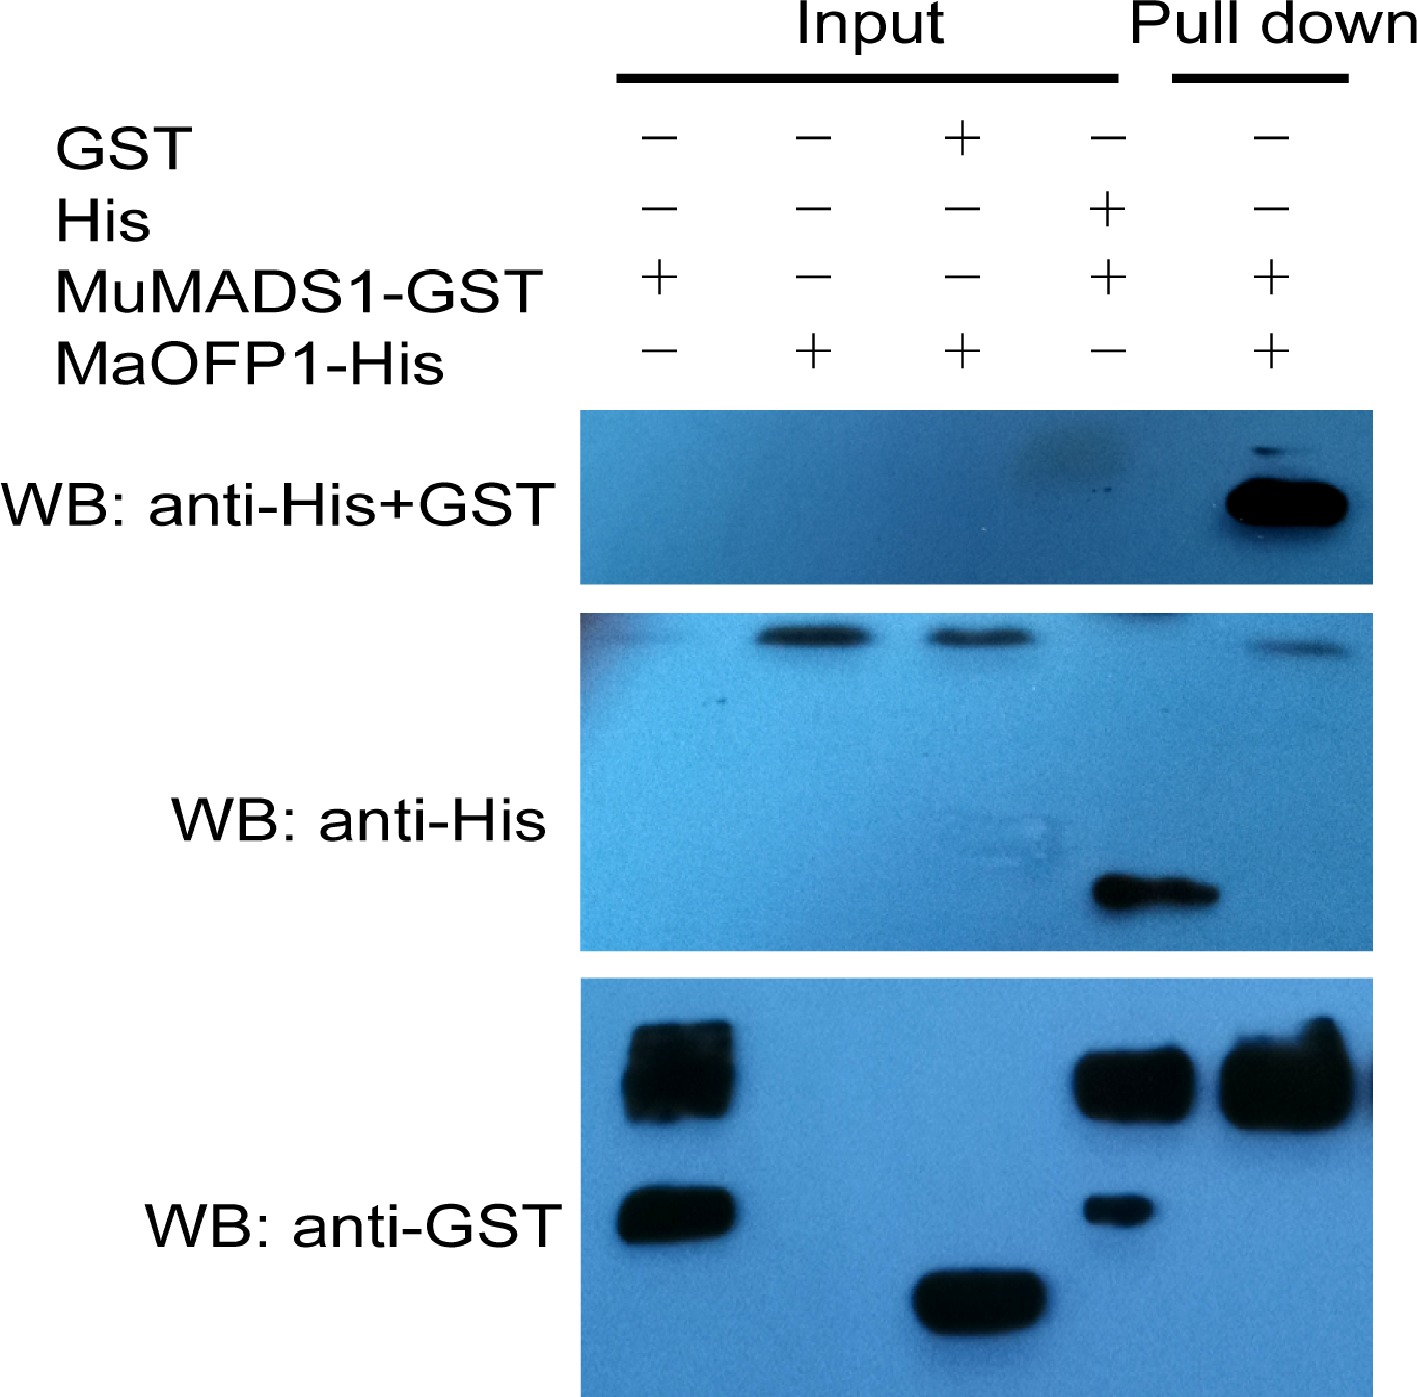
Figure 2.
In vitro GST pull-down assays of the interaction between MuMADS1 and MaOFP1. Anti-His and GST immunoblot shows the amount of MaOFP1-His bound by the indicated MuMADS1-GST protein.
-
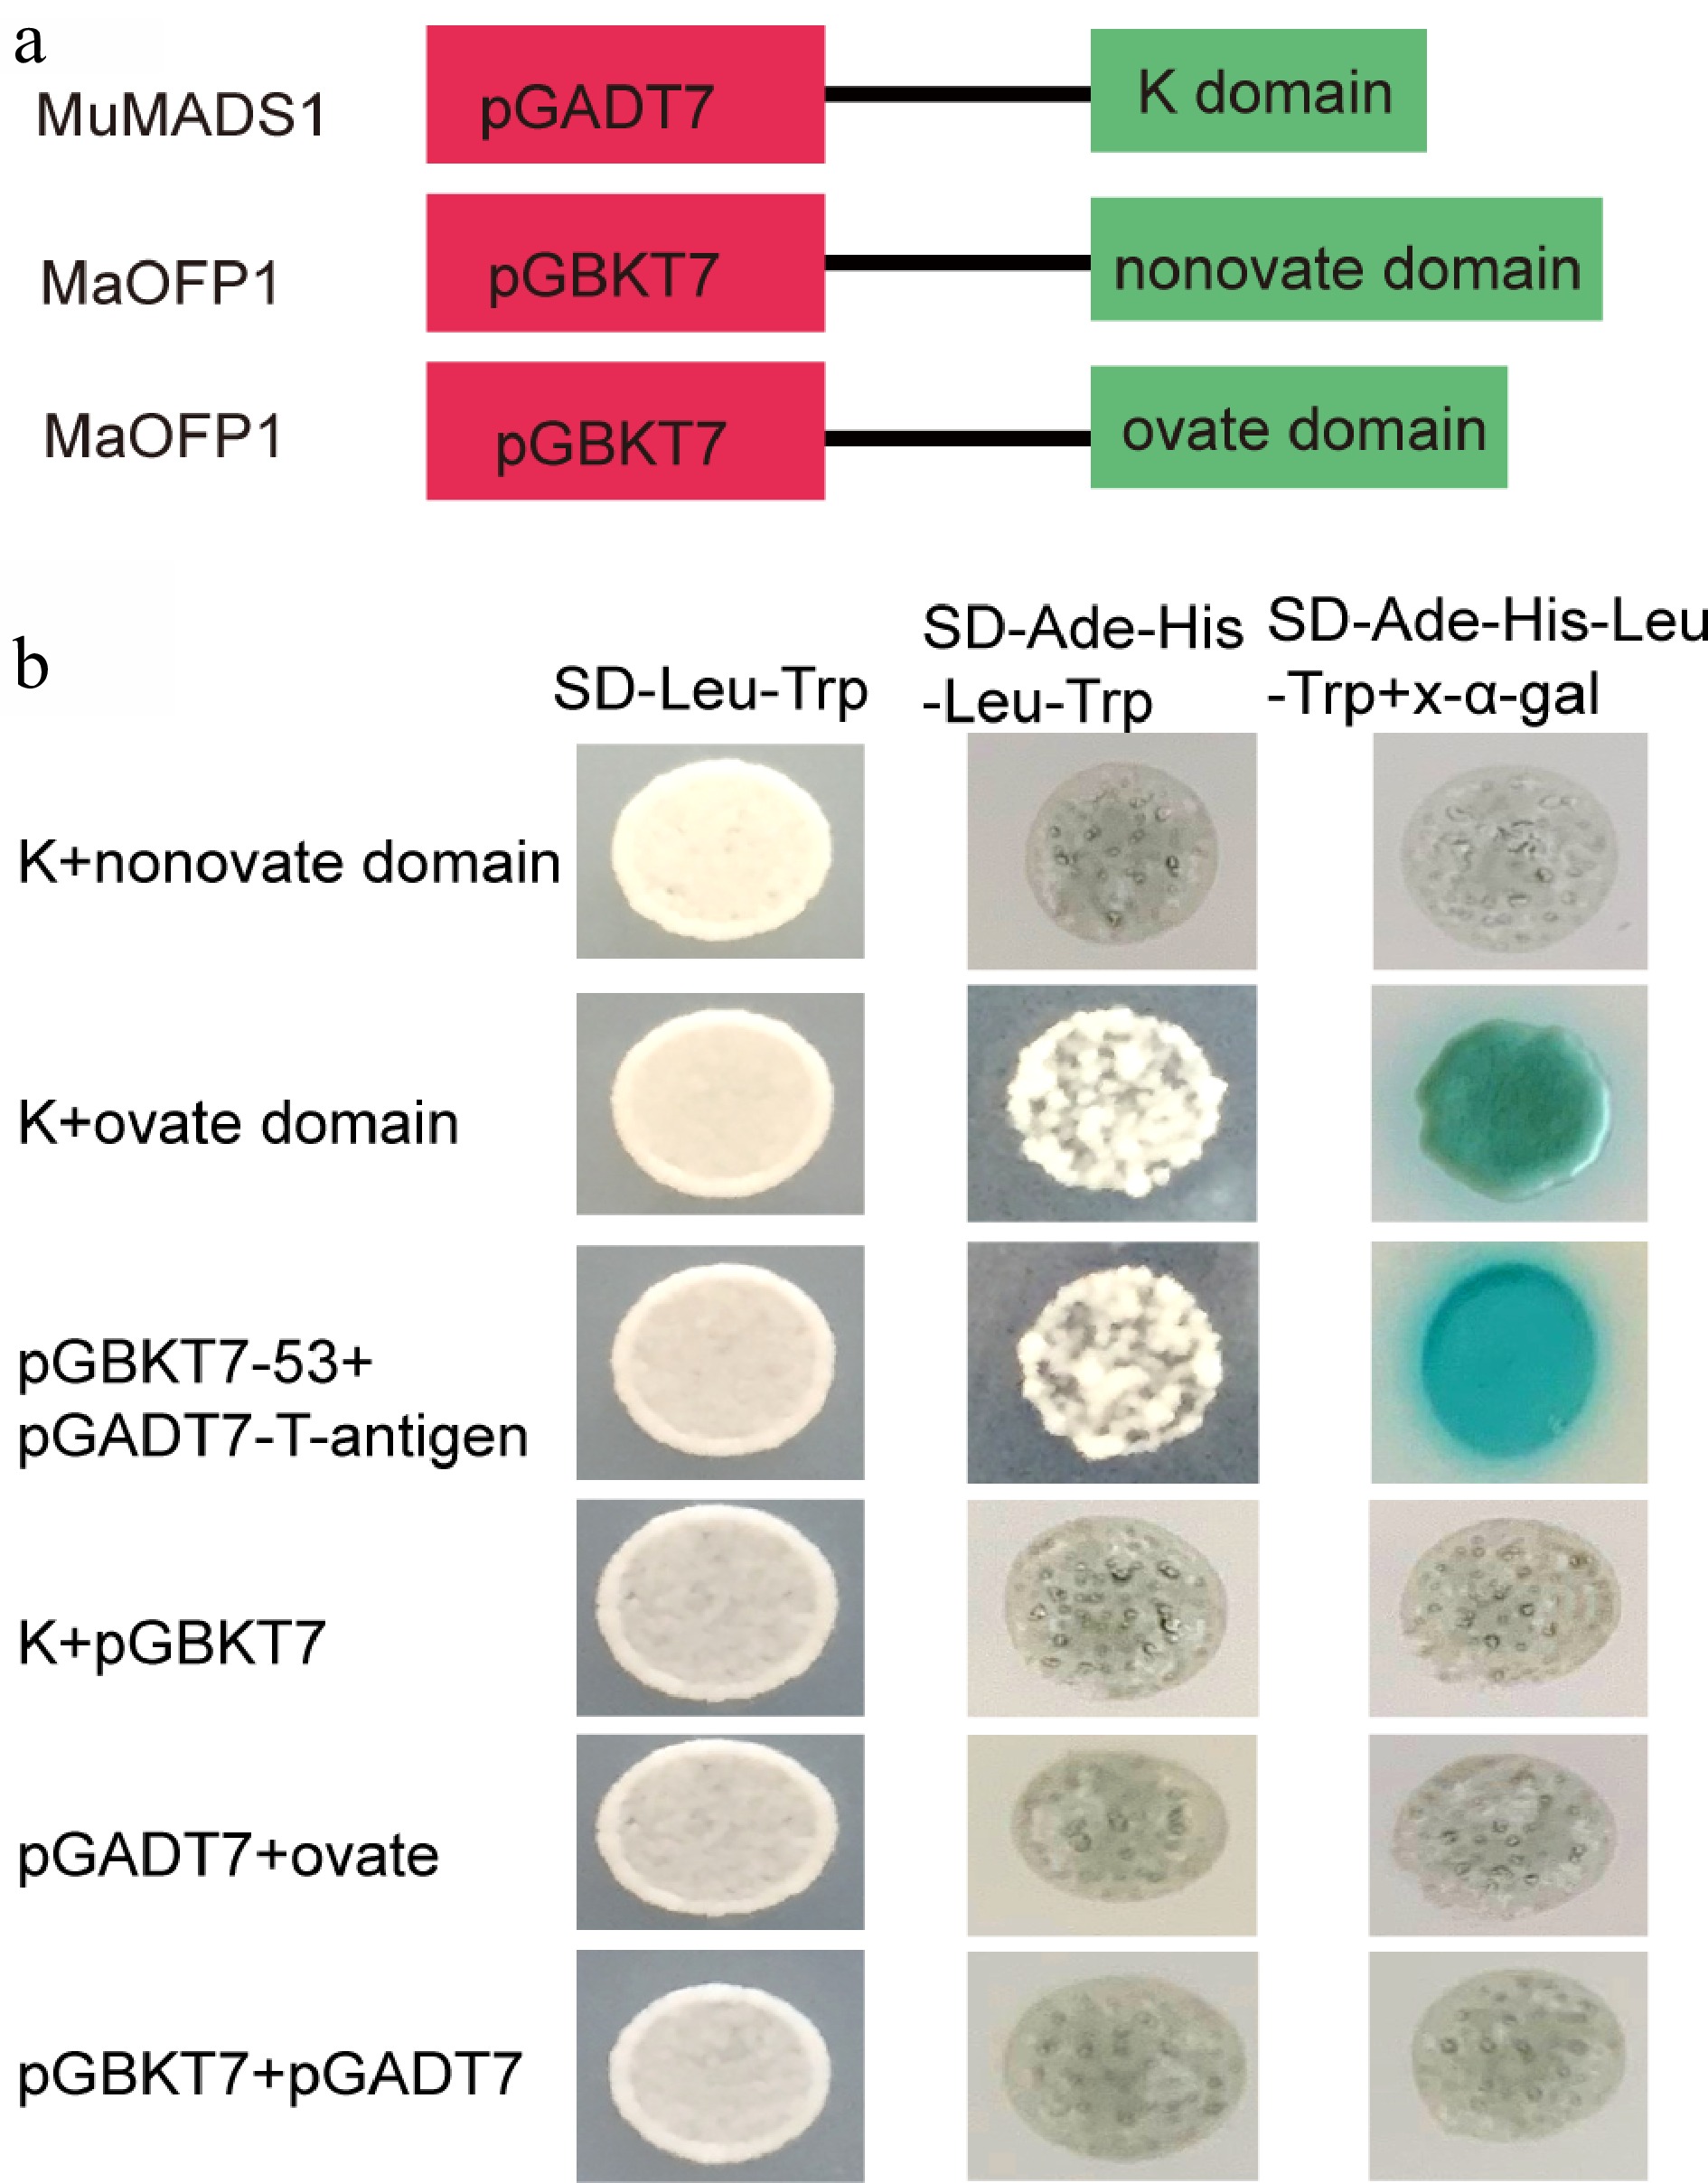
Figure 3.
Interaction analysis of the K-domain of MuMADS1 and MaOFP1 by Y2H. (a) Schematic diagram of vector construction for Y2H. (b) Y2H assay.
-
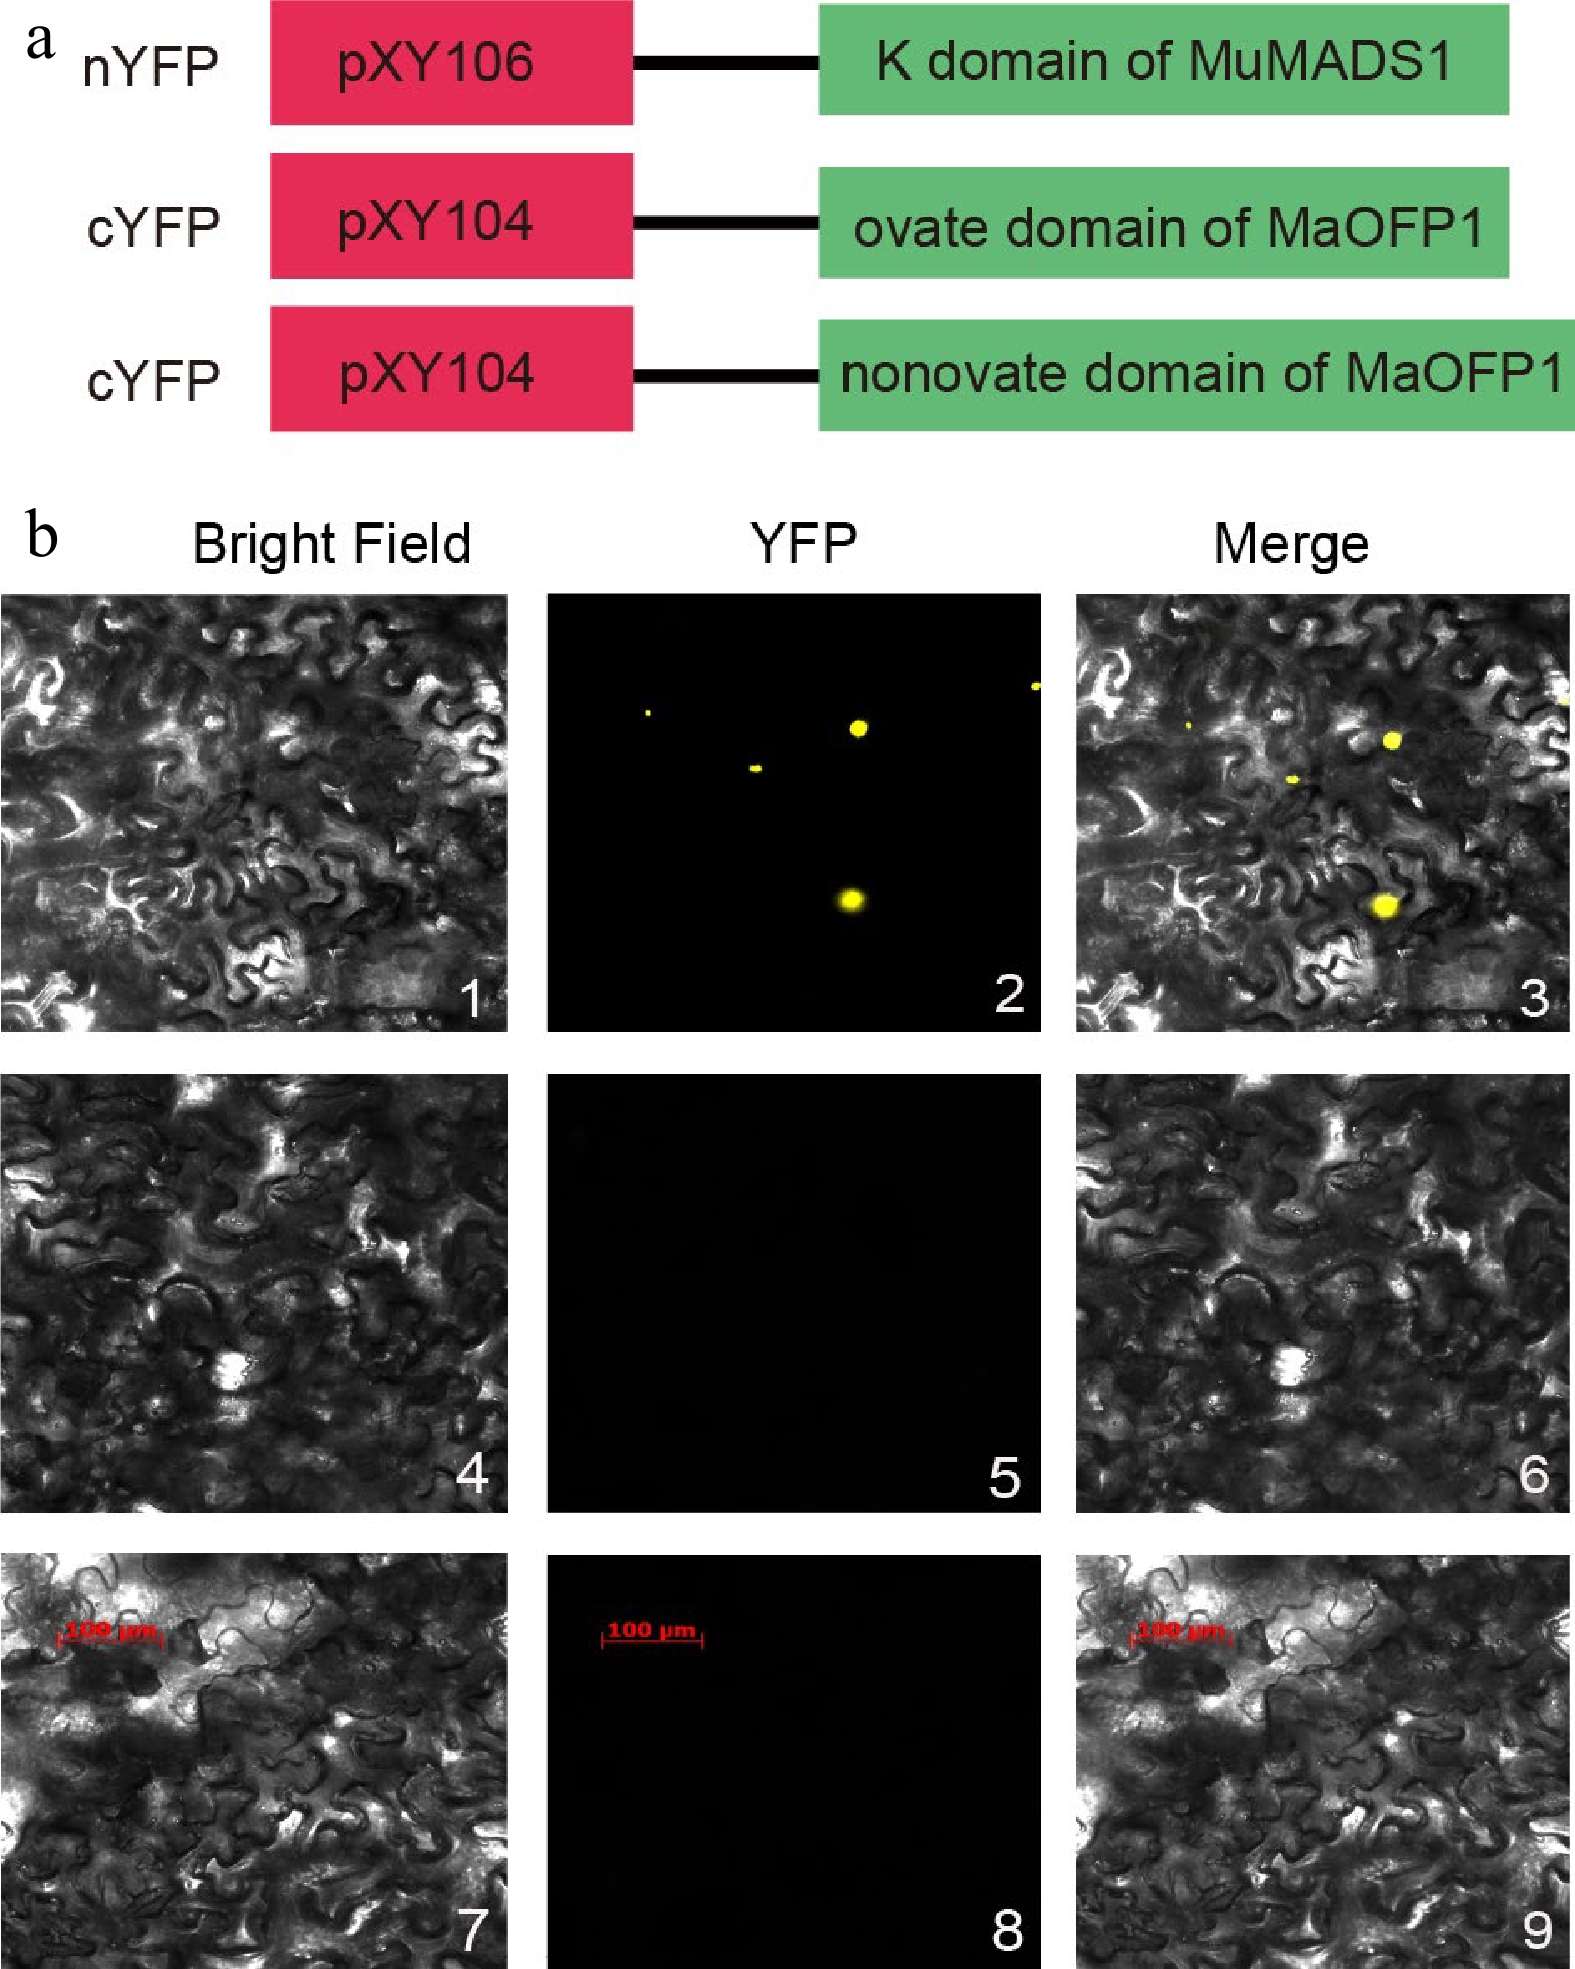
Figure 4.
Interaction identification of the K-domain of MuMADS1 and ovate-domain of MaOFP1 by BiFC. (a) Schematic diagram of vector construction for BiFC. (b) BiFC assay. 1, 2, 3, K-pXY104 + ovate-pXY106; 4, 5, 6, K-pXY104 + nonovate-pXY106; 7, 8, 9, K-pXY104 + pXY106.
Figures
(4)
Tables
(0)