-
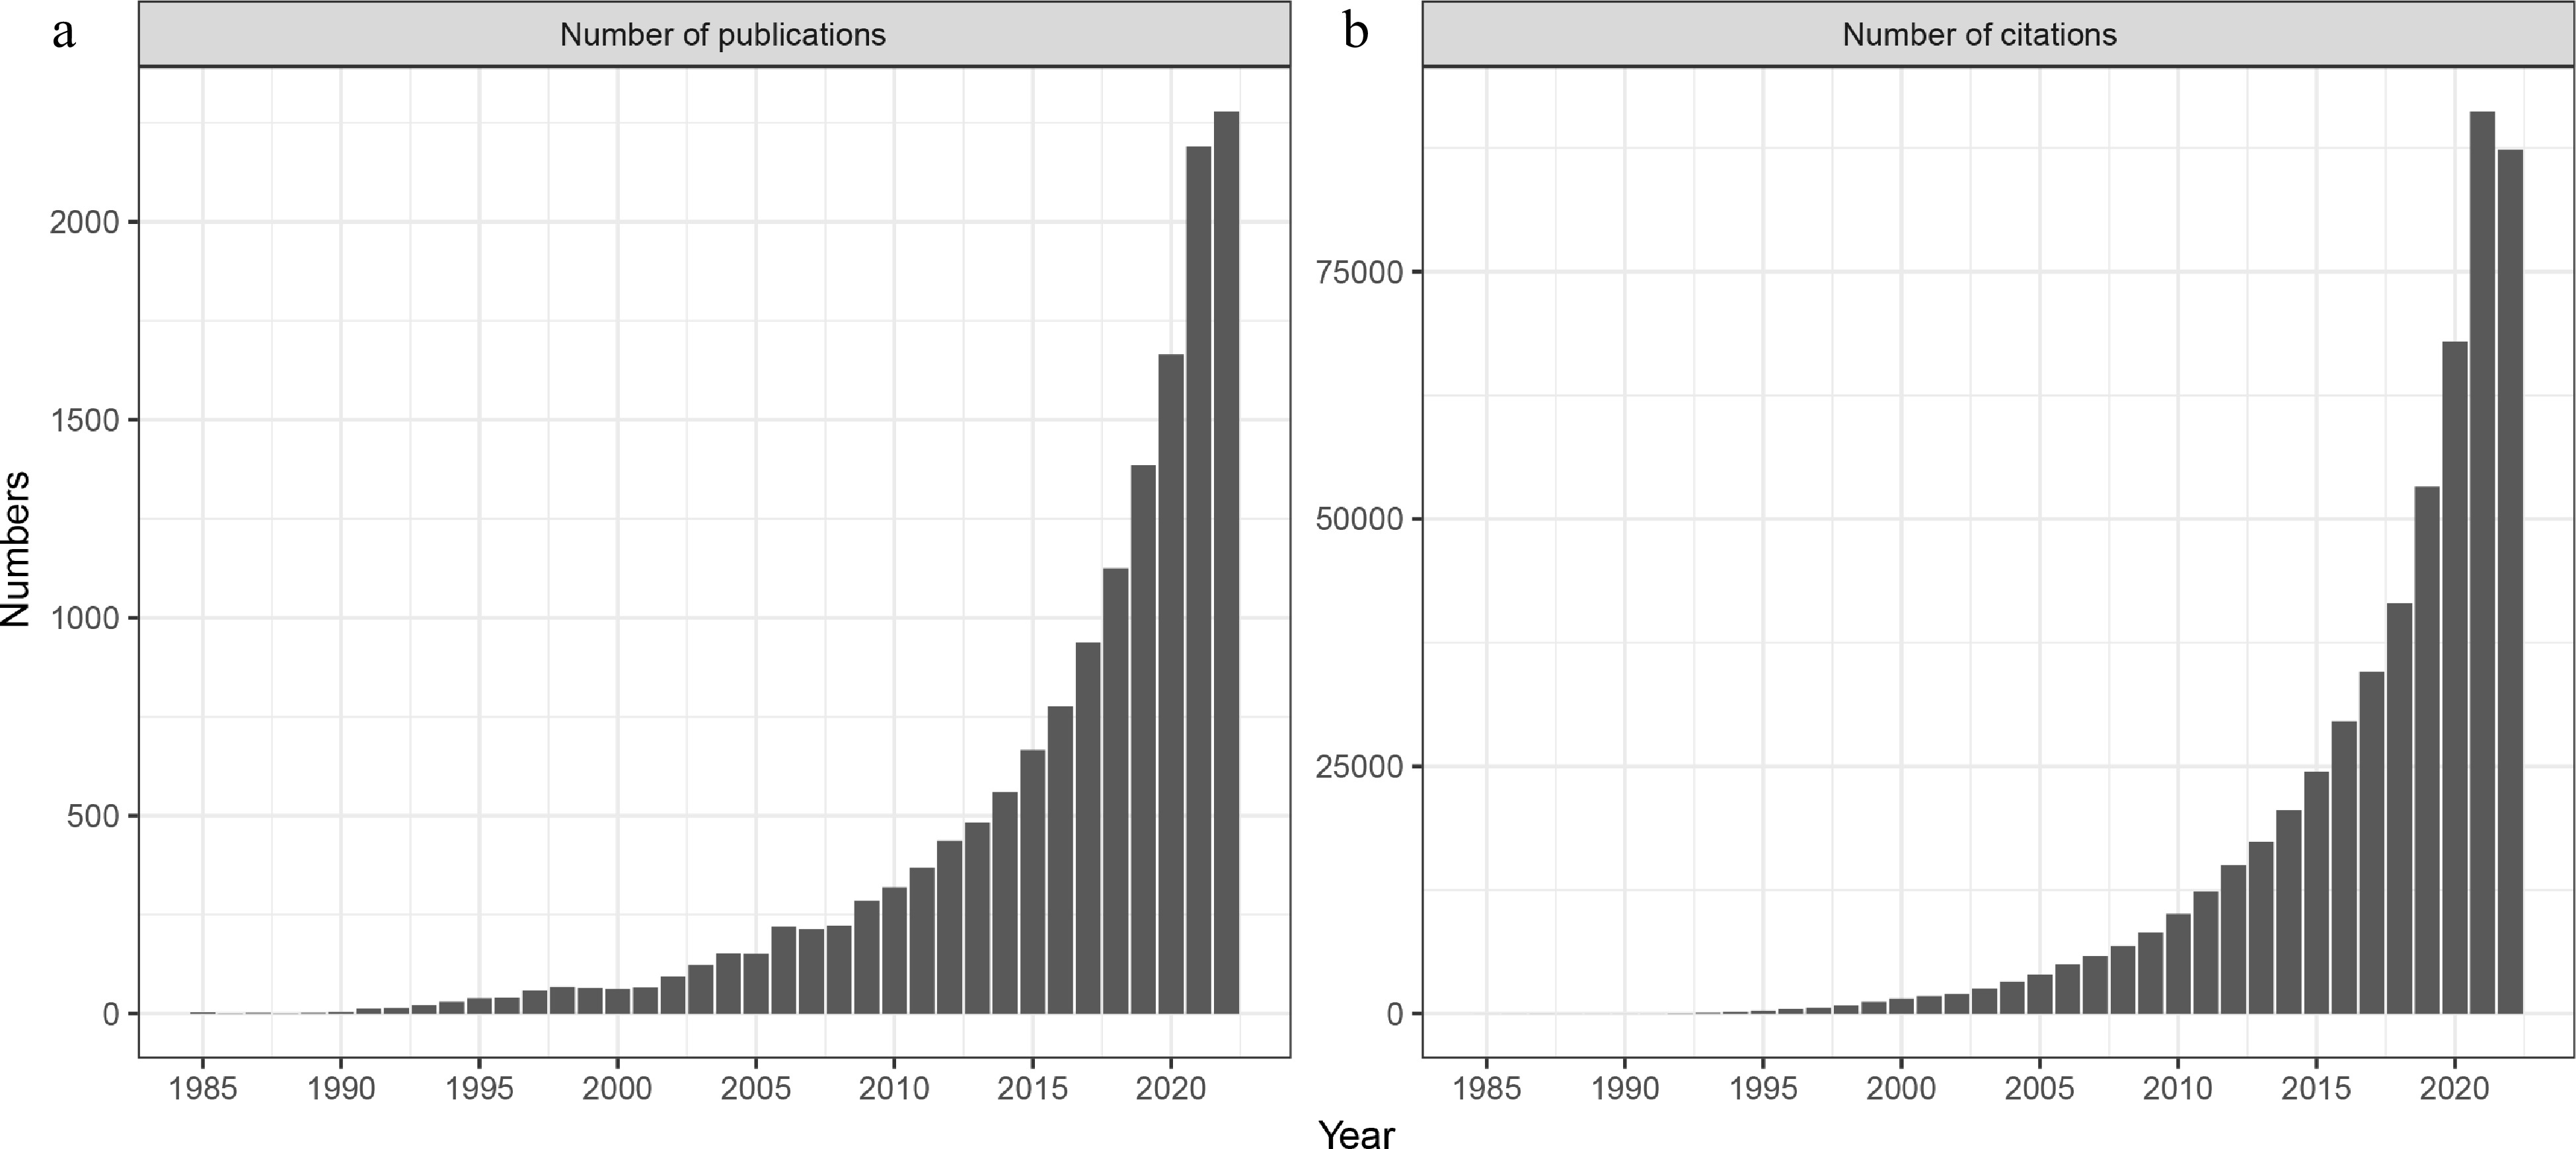
Figure 1.
(a) Number of publications and (b) citations referencing microbial network analysis (Web of Science from 1985 to Dec 20, 2022; search = network and microbiology or microbes or microbiome or microbiota or microflora as two separate subjects).
-
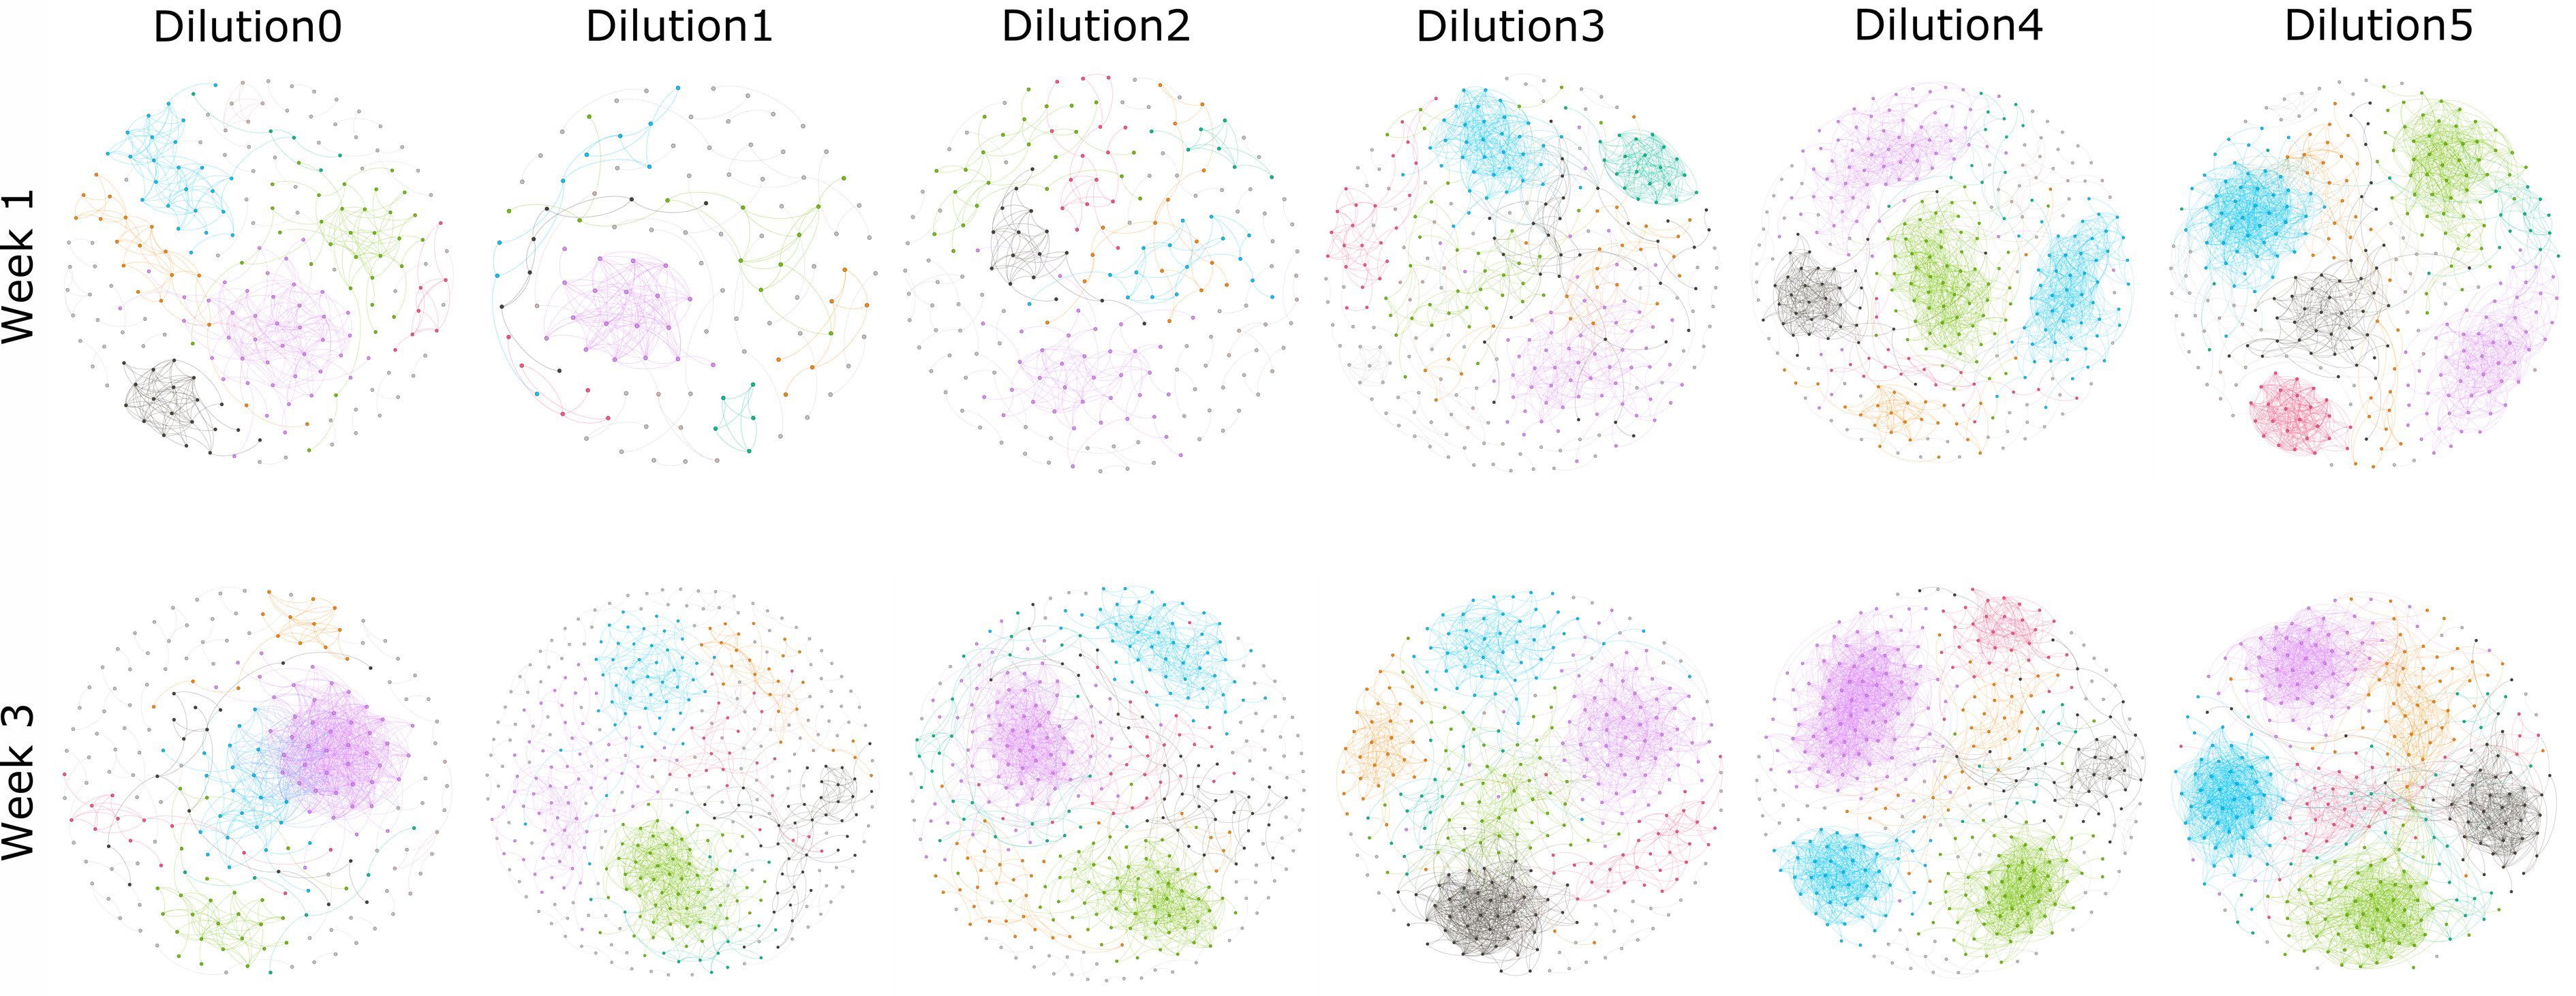
Figure 2.
Co-occurrence networks of rhizosphere bacteria microbiota from samples collected from week 1 and week 3 across the given soil suspension dilution treatments. Connections represent significant (P < 0.01) correlation as calculated by the Pearson method. Nodes represent different OTUs. Nodes and edges are colored by modularity class.
Figures
(2)
Tables
(0)