


-
High-throughput interrogation of microbial communities has provided a quantum leap in our ability to characterize the phylogenetic composition of our microbial world. However, as ecologists, we aim to go beyond pure stamp collecting of who is present in a community. We seek to understand the drivers of community dynamics and the interactions that dictate community functioning. A range of tools has been developed to visualize co-occurrence patterns, generated for instance by High-throughput (HTP) tag sequencing of ribosomal RNA gene fragments, as networks of taxa that are positively or negatively correlated in their distributions (Barberán et al., 2012). While such studies often reveal interesting changes in network topology as related to specific environmental gradients or experimental manipulations (Hilton et al., 2021; Li et al., 2021), interpretation of how such networks relate to actual interactions and community drivers has remained problematic and can even be misleading (Cardona et al., 2016). Here, we use a set of manipulated soil-borne microbial communities to demonstrate that extra complex and tightly knit microbial co-occurrence networks can be generated by selection processes that have no link to actual ecological interactions. Thus, while co-occurrence network topology and complexity may indeed have ecological meaning, we purport that they are more related to common outcomes of population selection, as opposed to interactive activities.
As we continue to develop more advanced and thorough means to describe complex microbial communities, we obviously wish to move beyond cataloguing relative population densities toward detecting patterns of ecological significance. To drive such research forward, a number of approaches have been employed to examine evolutionary and ecological signatures within large microbial datasets (Horner-Devine and Bohannan, 2006; Stegen et al., 2012; Dini-Andreote et al., 2015), in order to examine how interspecific interactions, be they positive, negative or neutral, shape microbial community structure and assembly (Faust and Raes, 2012; Zelezniak et al., 2015; Blasche et al., 2021). The use of co-occurrence and correlation networks has increased significantly in recent years, as a means of organizing population distributions across a range of complex microbial communities from oceans to the human gut and for describing not only bacteria, but also fungi, protists and other organisms (Faust and Raes, 2012; Morriën et al., 2017; Xiong et al., 2018; Gao et al., 2022). Indeed, a simple search of the Web of Science (Fig. 1) demonstrates the widespread and growing use of such approaches.
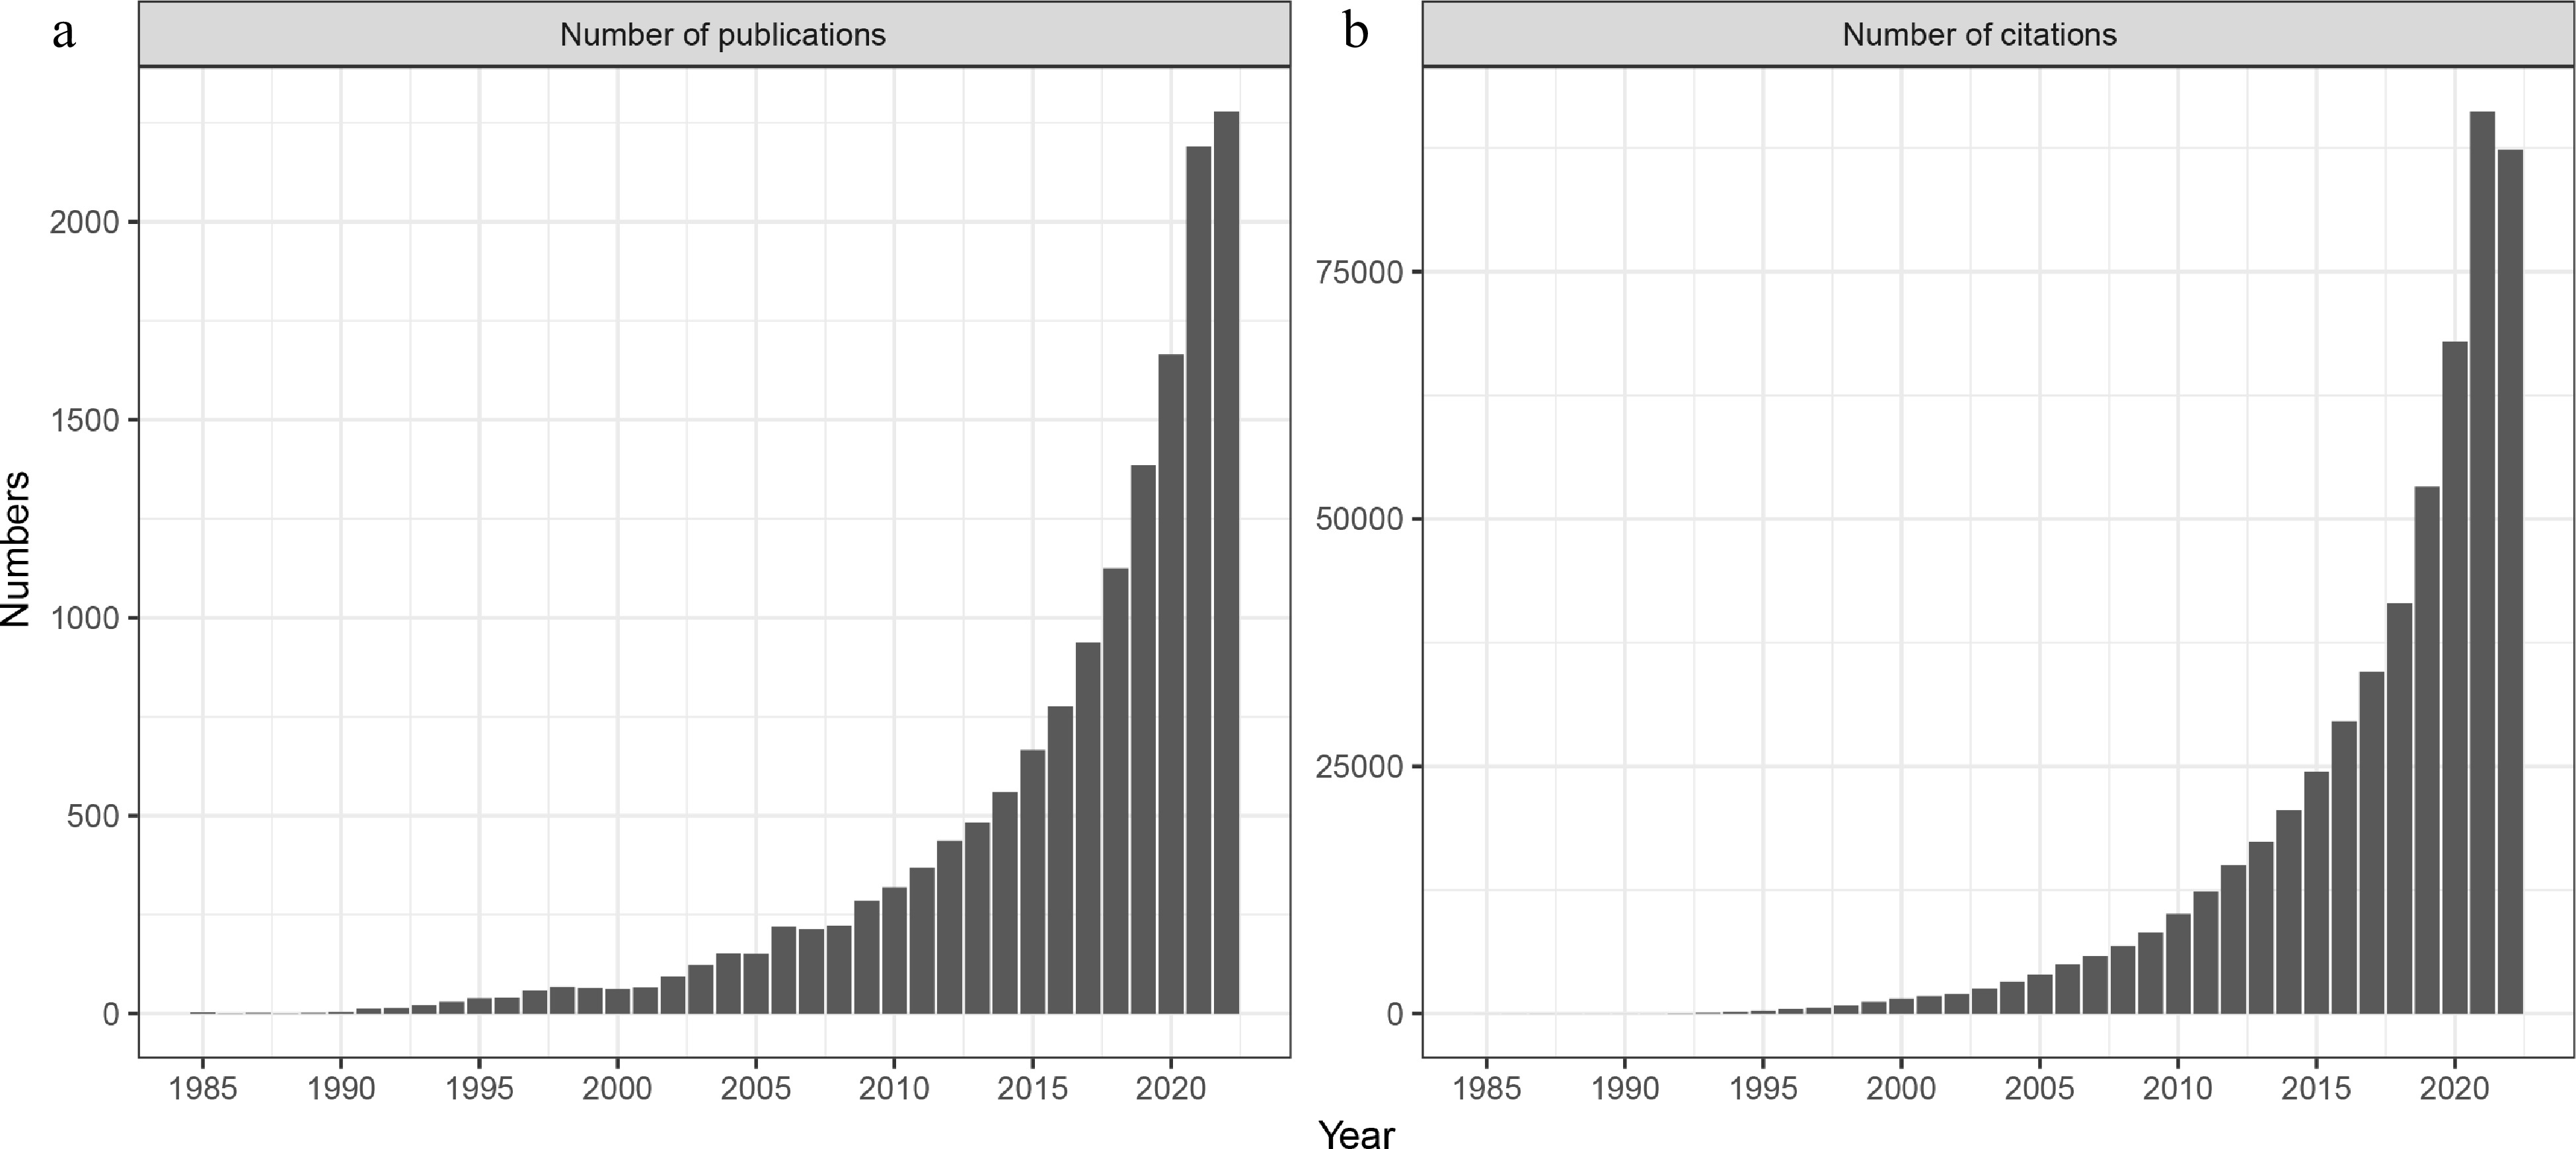
Figure 1.
(a) Number of publications and (b) citations referencing microbial network analysis (Web of Science from 1985 to Dec 20, 2022; search = network and microbiology or microbes or microbiome or microbiota or microflora as two separate subjects).
Many different approaches (correlation networks (CoNet), local similarity analysis (LSA), maximal information coefficients (MIC), random matrix theory (RMT), sparse correlations for compositional data (SparCC), Pearson correlations, Spearman correlations, Bray–Curtis, and so on) and models (copula, null model, ecological, and lotka–volterra) have been explored for constructing co-occurrence networks, and were reported to exhibit different correlation technique usage (Weiss et al., 2016). Resulting changes in network topology are then typically related to specific environmental gradients or experimental manipulations. While most researchers recognize that such networks do not demonstrate actual ecological interactions between species, the very term 'network' implies that such community portrayals yield interactive information (Morales-Castilla et al., 2015; Cazelles et al., 2016; Sander et al., 2017). Real world interactions are far more complex than a mathematical linkage can convey. They involve specific physiologies, higher-order and indirect interactions, changing environmental conditions and spatially structured environments (Alexander et al., 2015; Thakur and Geisen, 2019; Dal et al., 2020; Vos et al., 2013). Network analysis is clearly booming, but what insight does it lend to illuminating microbial interactions or drivers of community structuring?
Positive or negative links within co-occurrence networks have been shown to be poor predictors of actual interactions upon examination of one-to-one effects (Freilich et al., 2018). However, such pairwise interactions should also be viewed within the context of other interactions within the community, as interactions may be indirect and other species in the network may impact one or both of the pairwise players. Species can also coexist and exhibit a correlation in their abundances through population selection by a third species (Holt and Bonsall, 2017) or unreported abiotic factors (Röttjers and Faust, 2018; Lv et al., 2019). It has also been suggested that co-occurrence may be a result of dispersal limitation (Ulrich, 2004), or common selection due to specific environmental factors, without any actual direct or indirect interaction (Peres-Neto et al., 2001; Freilich et al., 2018).
We believe that this latter explanation is in many cases driving the topology of microbial co-occurrence networks. In order to examine this premise, we used a set of engineered soil-borne microbial communities that differed in the degree to which populations were segregated across replicates. We then tracked rhizosphere community assembly and network topology, via a range of methods, over time. Briefly, we used a dilution series of a soil suspension re-inoculated back into its sterilized origin soil to create soil communities that had been subjected to different levels of population segregation (Supplemental Fig. S1). With such a dilution-to-extinction experiment setup, all starting communities derived from low dilutions have very similar species pools, as nearly all species remain present in the starting inoculum. On the other hand, replicates at higher dilutions receive more disparate species pools due to the dilution to extinction of different subsets of the initial community. As such, this imposed community 'drift' acts as a strong experimentally imposed segregation at high dilutions, but not at low dilutions. Soils were incubated for 61 weeks and then used to examine microbial community assembly on plant roots via 16S rRNA gene tag sequencing by primers 341F (5’-CCTACGGGNBGCASCAG-3’) and 806R (5’-GGACTACNVGGGTWTCTAAT-3’) based on the Illumina MiSeq platform and network analyses in a replicated design (Supplemental Fig. S1). There are 12 sequencing samples in each dilution with three replicates per treatment which was derived from one origin soil (in a total of four origin soils) and with 446-814 OTUs in each sample, depending on the dilution and the sampling time, used to compute one network.
Co-occurrence network analyses of rhizosphere communities showed distinct patterns with respect to the dilution of the starting communities, as well as the age of the plant (Fig. 2), with denser and stronger networks with increased dilution and plant age. In addition, the number of links per network also showed increased trends with dilution, independent of the co-occurrence model used (see Supplemental Fig. S2; e.g. CoNet, Pearson or Spearman). The Spearman correlations between node (or link) number with dilutions in each network were calculated, and significant correlations can be observed in some networks (see Supplemental Table S1). In our manipulated communities, we have no reason to assume that communities at higher dilutions are more 'connected' or contain more microbial interactions, which can be supported by the decreased number of OTUs involved in the network (see Supplemental Fig. S2). Rather, the imposed segregation of populations, which is greater at higher dilutions, resulted in a greater preponderance of positive and negative co-occurrence patterns and an increased number of nodes derived from multiple replicates (see Supplemental Fig. S3). Similarly, network strength is increased with the continued growth of the plant (Fig. 2). We believe that this result is due to the increased selective action of the plant, which increases with plant size. Indeed, it has previously been observed that co-occurrence network complexity increases with plant growth stage (Shi et al., 2016; Ceja-Navarro et al., 2021).
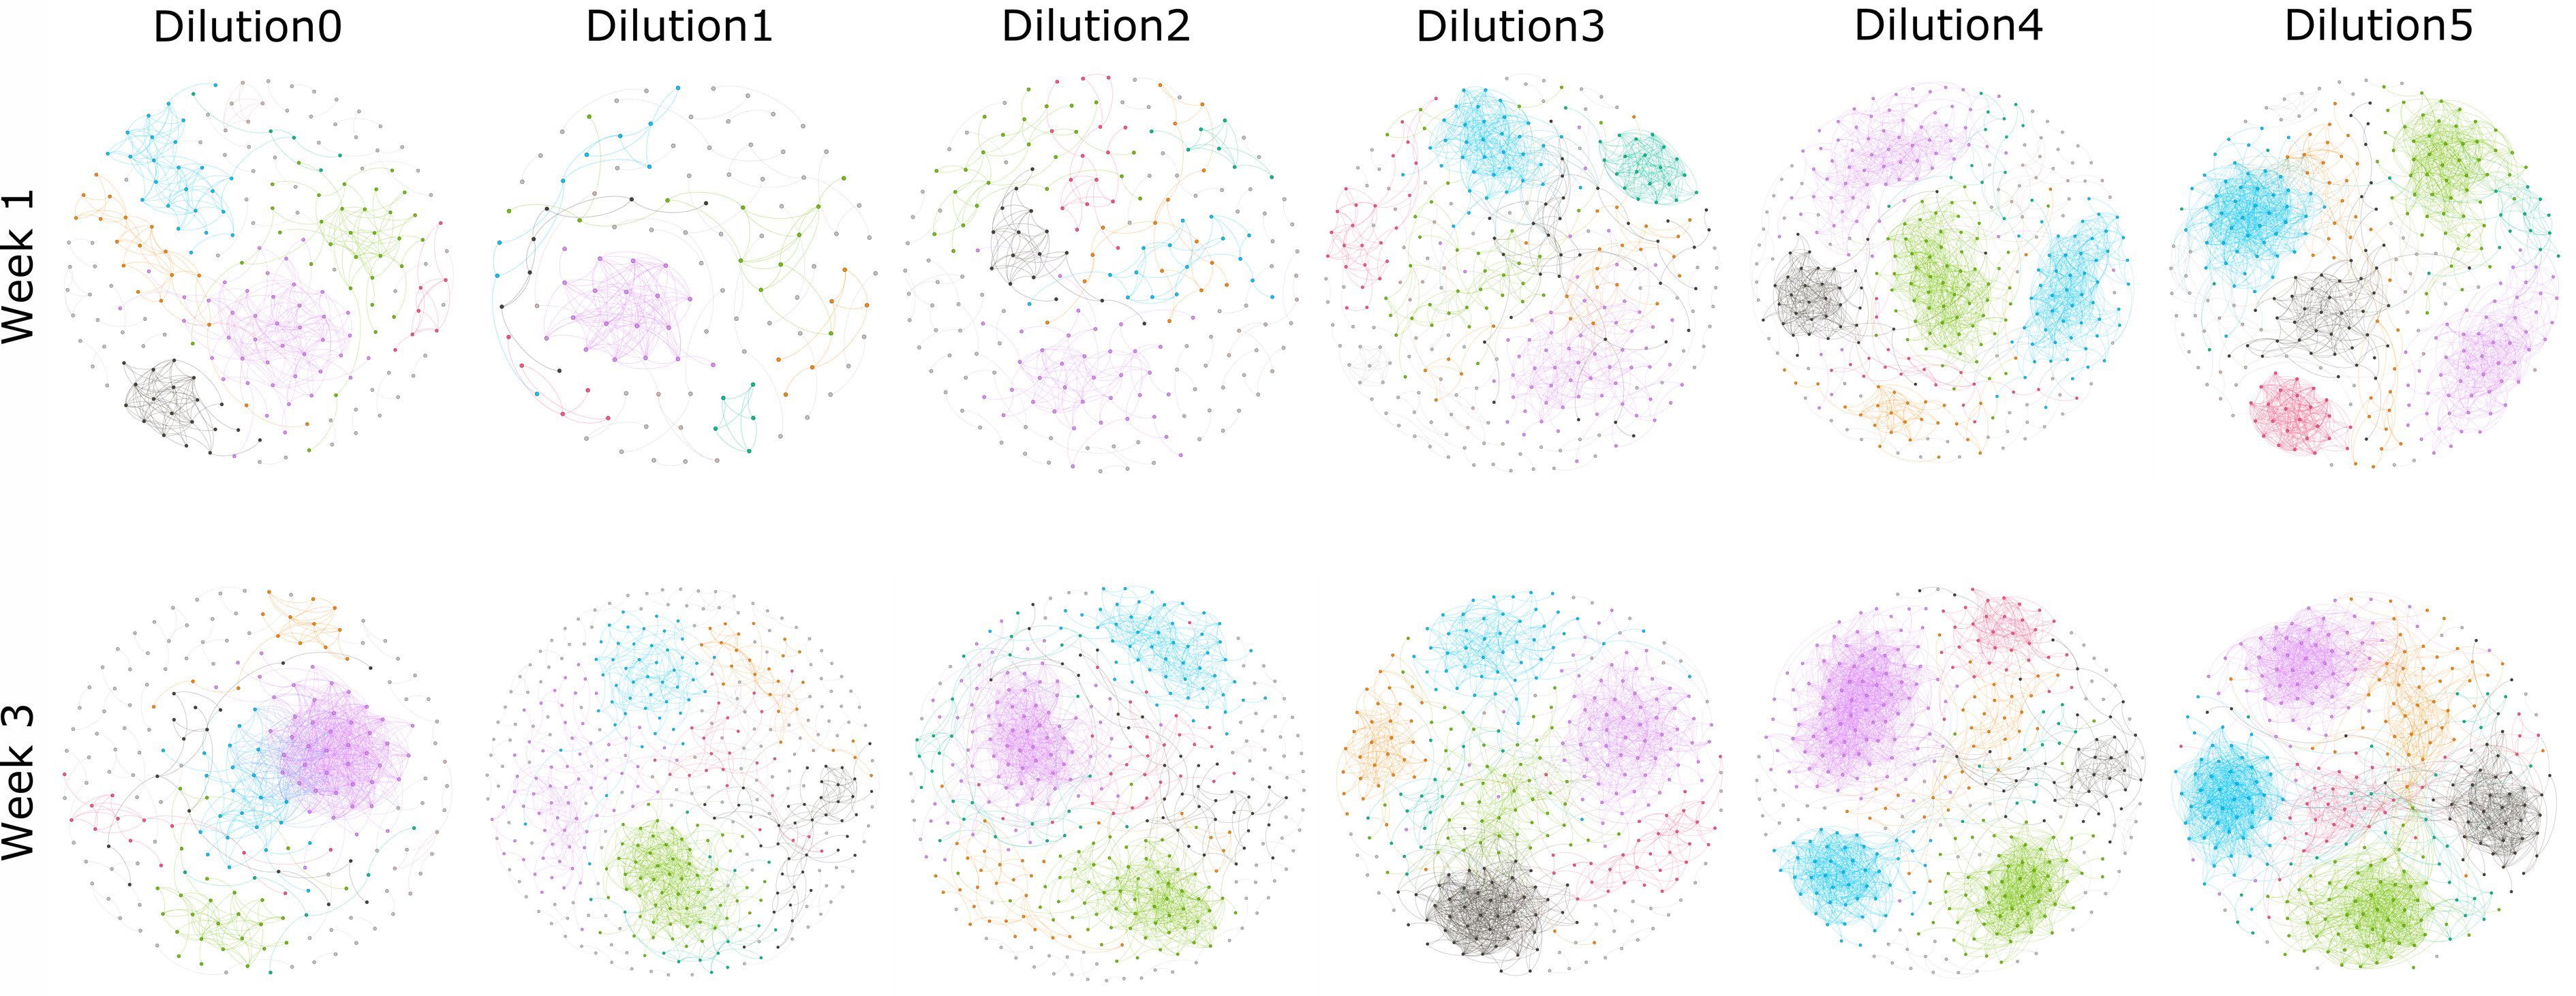
Figure 2.
Co-occurrence networks of rhizosphere bacteria microbiota from samples collected from week 1 and week 3 across the given soil suspension dilution treatments. Connections represent significant (P < 0.01) correlation as calculated by the Pearson method. Nodes represent different OTUs. Nodes and edges are colored by modularity class.
It has been suggested that co-occurrence networks can be misleading if other factors, such as habitat filtering, result in non-random patterns in the abundance of multiple taxa (Berry and Widder, 2014). In other words, if one seeks to zoom in on one particular parameter driving co-occurrence network structure, it is important to keep all other factors that may influence this structure constant. Here, the numbers of intra- and inter-treatment links both showed increased trends in co-occurrence networks of rhizosphere microbiota with the level of dilution (see Supplemental Fig. S4). We demonstrate that our imposed segregation of populations, which can be seen as a random selection, resulted in more tightly knit network topologies – a result that most likely has nothing to do with increases in actual interactions. The distribution of microbial species in the environment is clearly not independent, and we suggest that estimations of microbial responses to environmental filtering need to be considered, for instance via generalized joint attribute modeling (Clark et al., 2017). Our example provides an empirical warning regarding the ecological interpretation of co-occurrence networks. We show that co-occurrence network structure and complexity can be principally driven by common patterns of imposed selection, thereby providing a strong cautionary message to the interpretation of functional interactions from such approaches.
HTML
This work was supported by the Key project at central government level: The ability establishment of sustainable use for valuable Chinese medicine resources (2060302); Natural Science Foundation of Jiangsu Province, China (BK20200544); the Priority Academic Program Development of the Jiangsu Higher Education Institutions (PAPD), the National Natural Science Foundation of China (42107141), the Nederlandse Organisatie voor Wetenschappelijk Onderzoek (ALW.870.15.050) and the Koninklijke Nederlandse Akademie van Wetenschappen (530-5CDP18).
-
Li R, Shen Q and Kowalchuk GA are the Editorial Board members of Journal Soil Science and Environment. They were blinded from reviewing or making decisions on the manuscript. The article was subject to the journal's standard procedures, with peer-review handled independently of these Editorial Board members and their research groups.
- Supplemental Fig. S1 Cartoon of the experimental design. Soil was collected from a sandy soil grassland field, microbial suspensions extracted from the soil, and 10-fold serially diluted aliquots were re-inoculated into the origin sterilized soil (by gammairradiation). The extraction and re-inoculation procedure was repeated 4 times (given as A, B, C and D). Soils were incubated in the dark at 20 °C for 61 weeks, after which 12 seedlings of Arabidopsis thaliana were transplanted per soil (one plant per pot), 4 pots of which were harvested after 1, 2 and 3 weeks of growth, respectively. Three replicate pots from the 1- and 3-weeks harvest were randomly chosen for 16S rRNA gene tag sequencing and network analysis of rhizosphere soil.
- Supplemental Fig. S2 Input OTUs used in the network analyses (A), number of network nodes using three different models (B), and number of links in co-occurrence networks (C) of rhizosphere microbiota from samples collected from week 1 and week 3 across the given levels of dilution treatment; Spearman correlations between input OTUs and dilutions were listed under panel; Spearman correlations between nodes (or links) and dilutions in each network were listed in Table S1; Asterisk means a statistically significant (*P < 0.05).
- Supplemental Fig. S2
- Supplemental Fig. S3 Co-occurrence networks of rhizosphere bacteria microbiota from different dilutions from samples collected after 1 and 3 weeks of plant growth. Connections indicate significant (P < 0.01) correlation calculated by the Pearson method. Nodes represent different OTUs and are colored by the replicates in which the co-occur (A, B, C, and D represent 4 replicates). Grey links represent positive correlations, and pink links represent negative correlations.
- Supplemental Fig. S4 Numbers of intra- and inter-treatment (which was derived from one origin soil, in total of 4 origin soils) links in co-occurrence networks of rhizosphere microbiota from samples collected from week 1 and week 3 across the given levels of dilution.
- Supplemental Fig. S3
- Supplemental Table S1 Spearman correlations between node (or link) number with dilutions in each network. Correlations were calculated by cor.test function in R3.4.3, and asterisk means a statistically significant (*P < 0.05, ** P < 0.01).
- Copyright: © 2023 by the author(s). Published by Maximum Academic Press, Fayetteville, GA. This article is an open access article distributed under Creative Commons Attribution License (CC BY 4.0), visit https://creativecommons.org/licenses/by/4.0/.
Li R, Weidner S, Ou Y, Xiong W, Jousset A, et al. 2023. Co-occurrence networks depict common selection patterns, not interactions. Soil Science and Environment 2:1 doi: 10.48130/SSE-2023-0001


|