-
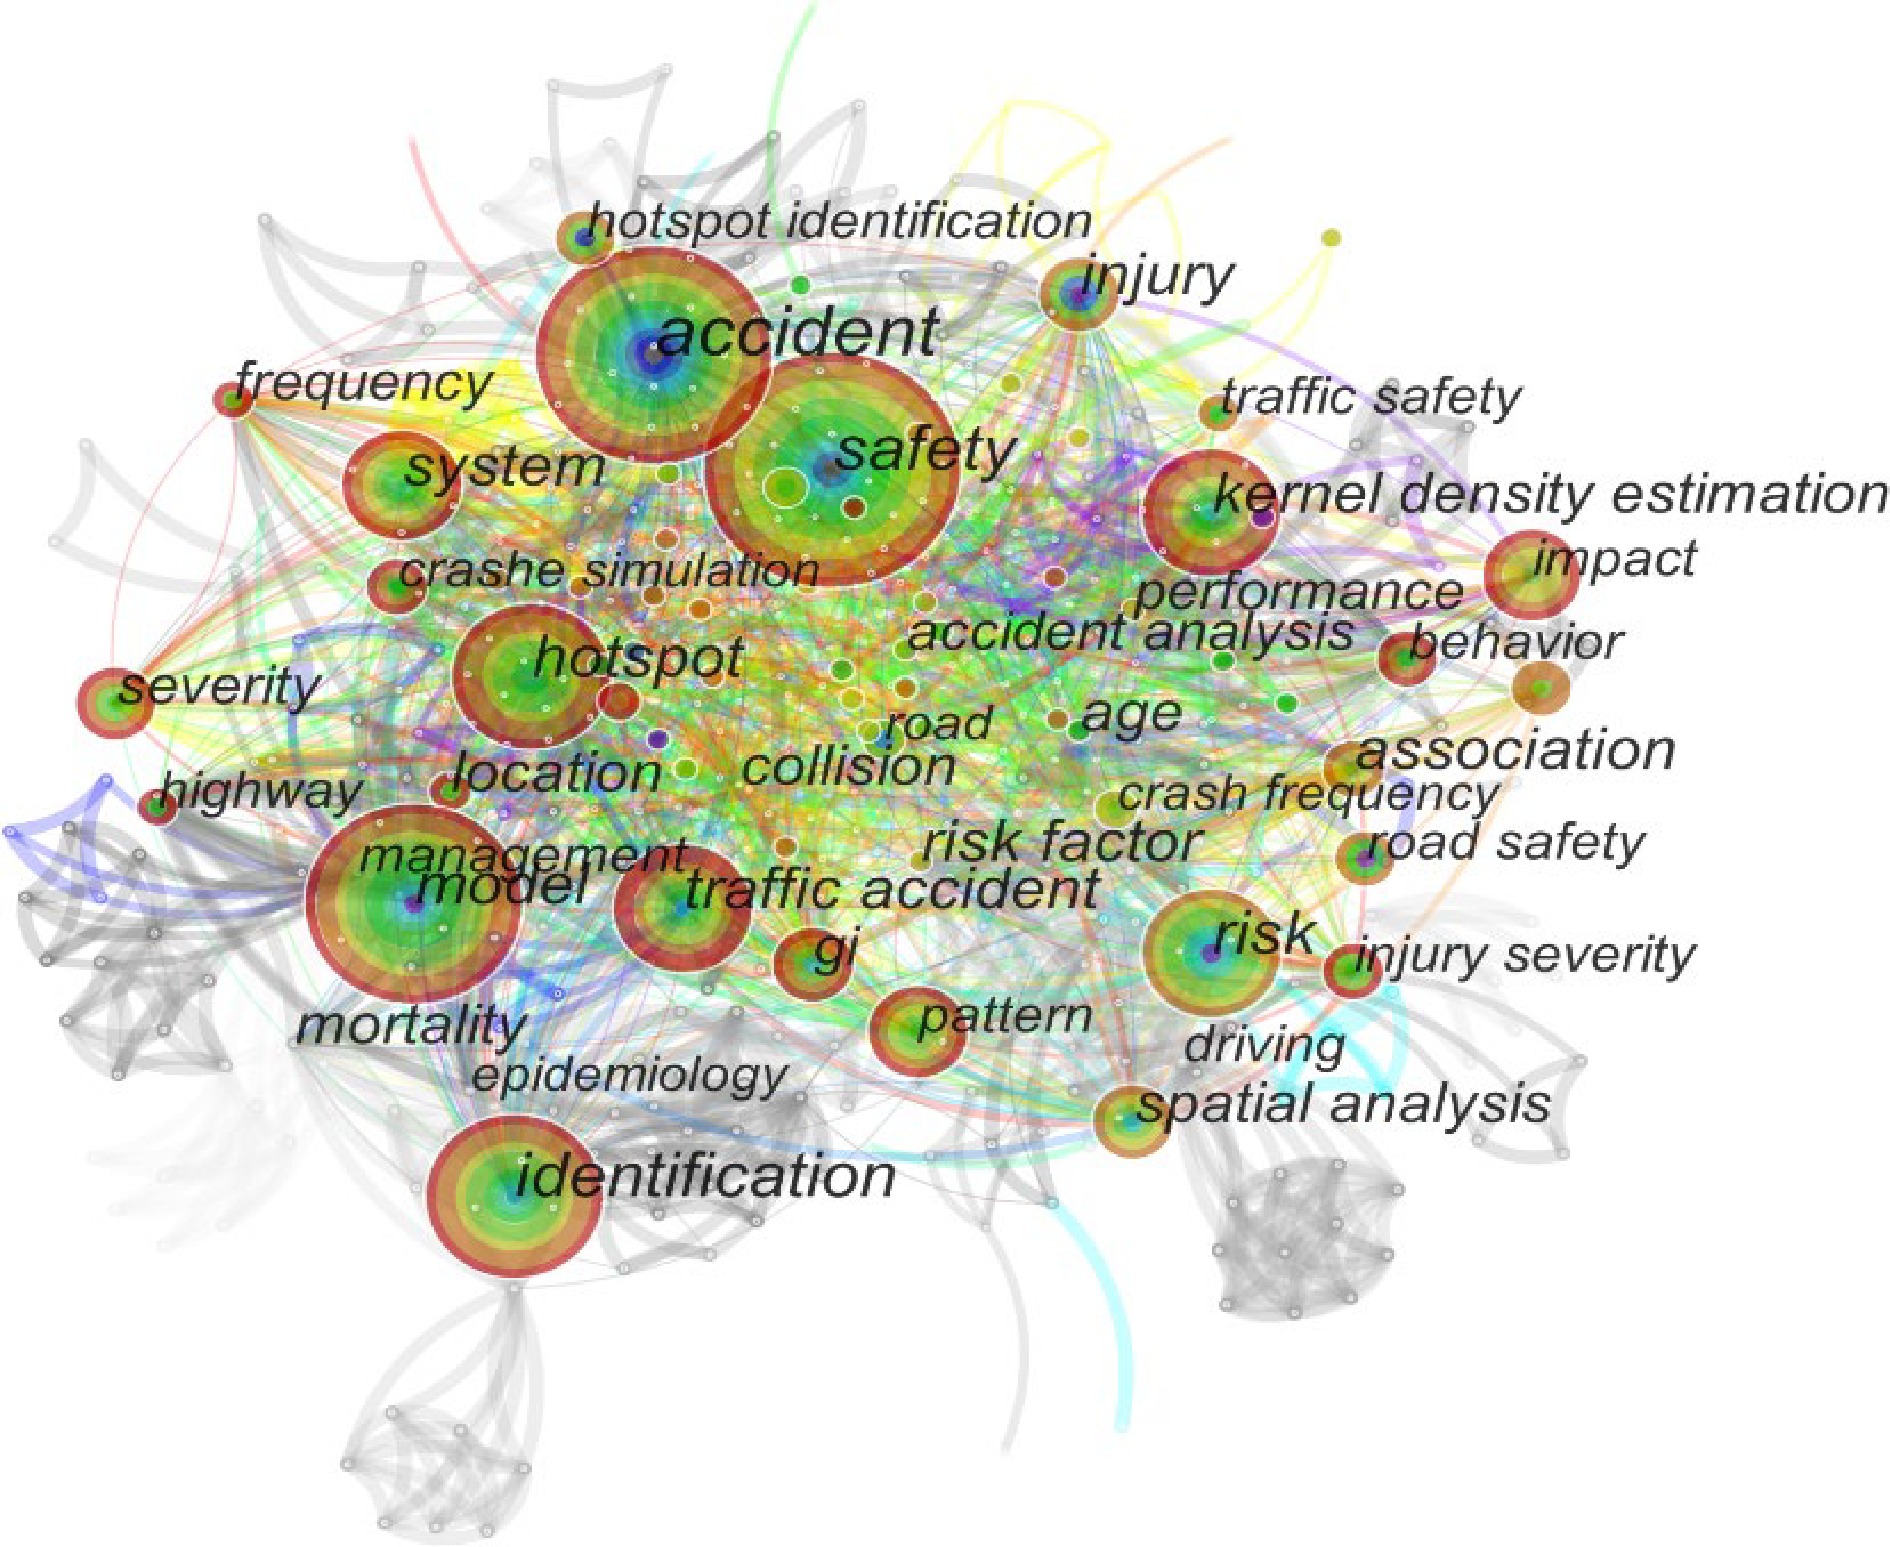
Figure 1.
Keyword clustering network diagram from the English literature studied.
-
-
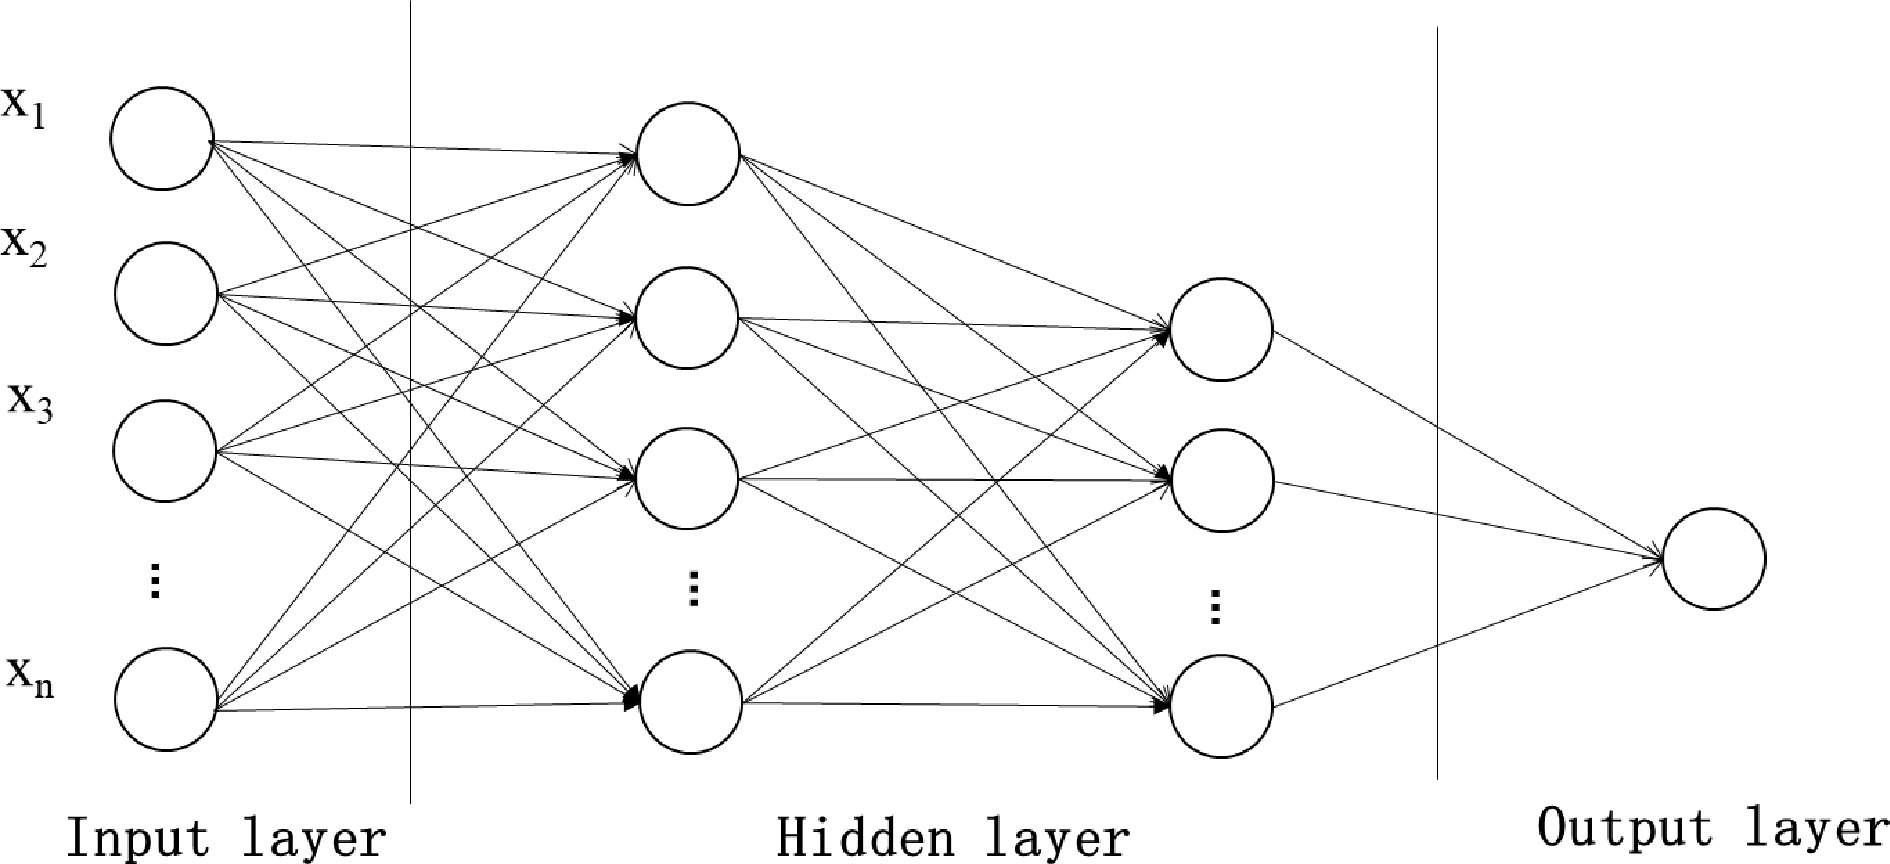
Figure 3.
Schematic diagram of the neural network model.
-
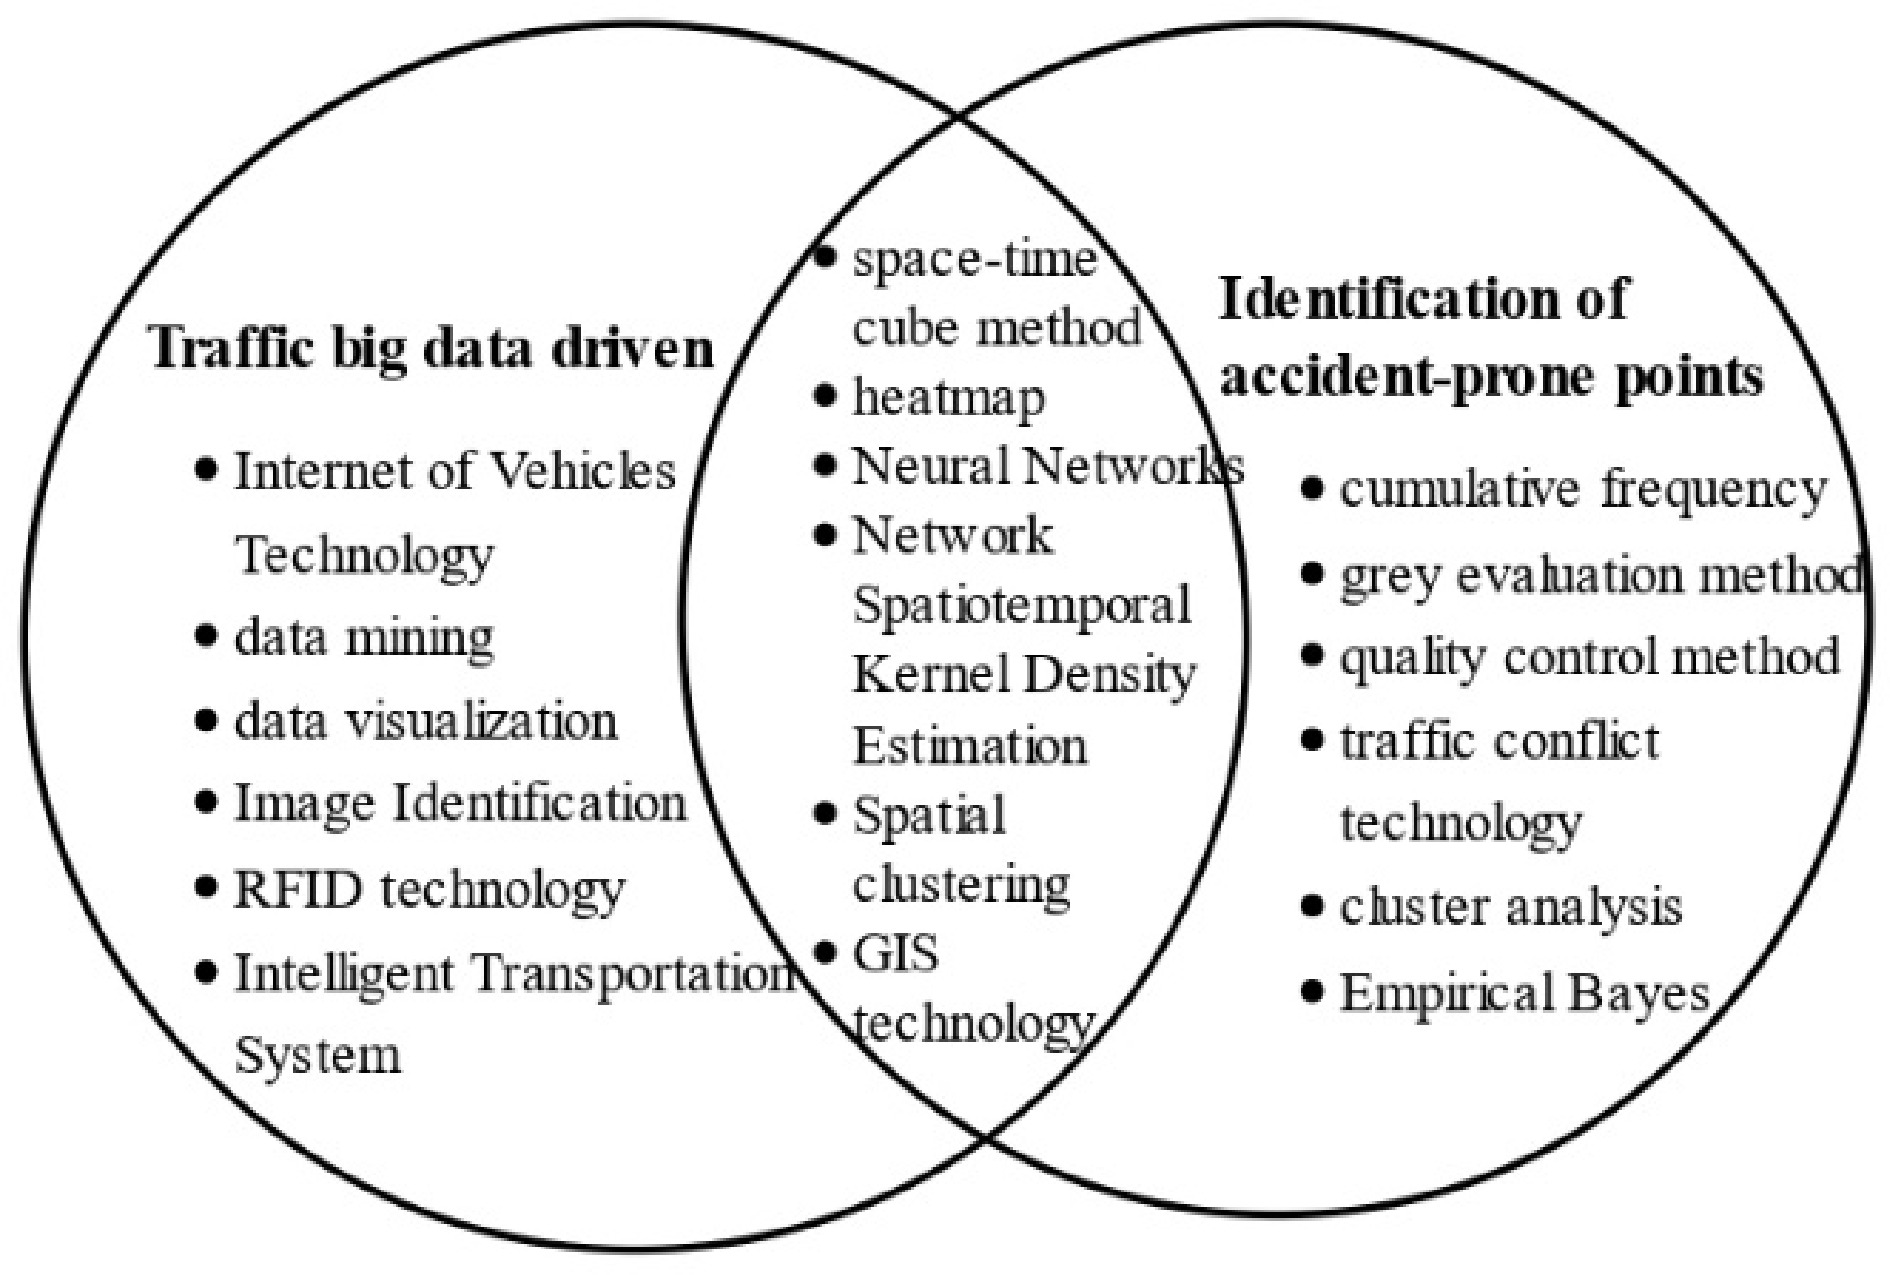
Figure 4.
Relationship diagram of research scope.
-
Research perspective Accident identification method Index Applicable conditions Advantage Disadvantage Micro level Accident frequency method Number of accidents Suitable for a specific range of smaller intersections or streets, etc. Single indicator;
Easy to determine;
With good operabilityThe judgment results are highly subjective, and the differences in traffic conditions and road environment are not considered;
High error rateAccident rate method Accident rate Suitable for longer sections or regional roads Comprehensive consideration;
Strong operability and intuitive resultsLack of consideration of the severity of the accident;
A gap with actual traffic conditionsEmpirical model method Predicted number of accidents Suitable for level intersections of roads. The model is intuitive;
It can solve the problem of random fluctuationDifficulty in collecting a large number of typical level intersection statistics;
Cannot be used for road segment or area identificationEquivalent accident number method Equivalent Accidents Suitable for roads with similar road conditions and stable traffic volume Considering the differences in the severity of accidents;
The evaluation results are objective and comprehensiveFactors such as traffic volume and road conditions are not considered
The choice of weights is subjectiveTraffic conflict laws Distance, speed, time Suitable for urban roads or specific road sections and intersections The dependence on accident statistics is small;
The theoretical basis is sufficient; The cycle is shortConflict investigation workload is heavy;
Difficult to model, poor portability
The influence of road environment, etc. is not consideredMeso level Quality control method Upper and lower bounds on the combined accident rate Suitable for road networks or road sections with roughly the same traffic conditions The calculation is simple, the theory is perfect, and the scope of application is wide, considering the random fluctuation problem The workload is large and accurate traffic data is required;
Does not consider spatiotemporal accumulation and dynamic patterns of spatiotemporal evolution;
Confidence selection is subjectiveEmpirical Bayes Bayesian prior and posterior estimates, recognition thresholds Suitable for intersections with roughly the same road and traffic conditions Homogeneous road data is considered to avoid the influence of the regression effect caused by the randomness of accidents, and the prediction accuracy is high Excessive requirements for the completeness of historical data
Does not consider spatiotemporal accumulation and dynamic patterns of spatiotemporal evolution
The calculation process is complicatedMacro level Grey evaluation method Influencing factors and indicators constitute an evaluation set Suitable for regional road network Clear meaning, clear algorithm, strong practicability Have a certain degree of subjectivity;
Data indicators are too single;
Evaluation accuracy is lowCumulative frequency method Number of accidents per kilometer, accident rate per vehicle kilometer Suitable for regional roads with poor traffic conditions and different accident conditions Wide application, relatively mature judgment threshold, high practical value The selection of unit length has a great influence on the results;
Factors such as traffic volume and accident severity are not considered;
There may be peak clippingRegression analysis Regression Model Predicts Number of Accidents Suitable for regional road networks and roads Considering factors are comprehensive and the scope of application is wide The algorithm is relatively simple;
The results are subjective and difficult to apply in practiceCluster analysis Equivalent total Accident rate value, accident-prone point threshold value Applies to the entire road network or to specific roads The results are reasonable and accurate, and the positions that are easily missed by the traditional method can be identified The number of indicators used is limited and the accuracy is not high
The results have certain limitationsTable 1.
Comparison of identification methods for accident-prone points.
-
Past Now Single typical accident data Accident data, road attributes, spatial attributes Specific road intersection Spatiotemporal road network Road segments by distance Divide homogeneous road segments Simple historical accident statistics Spatiotemporal accident data Traffic accident record Traffic travel information Number of traffic accidents or conflicts Image, heat map recognition Table 2.
Comparison of identification data.
Figures
(4)
Tables
(2)