

-
With rapid economic and social development and the continuous increase in the number of motor vehicles, the problem of road traffic safety has become prominent. During the 13th Five-Year Plan period, the number of urban road traffic fatalities and rural road traffic fatalities increased by 27.6% and 11.5% respectively[1]. In order to investigate potential traffic safety hazards and avoid traffic accident risks, increased attention has been paid to the identification of traffic accident-prone points and segments. The occurrence of a single traffic accident is often the result of the combination of many factors such as drivers, vehicles, roads and the environment, with discrete distribution and great contingency. When traffic accidents show the characteristics of agglomeration in some places or sections of the road (especially a specific type of accident), it means that there is a certain connection between these accidents and the road. China's road traffic environment is complex and the investment in traffic safety management is limited. It is a special concern of traffic design and management departments to analyze, investigate, rectify traffic accident black spots, and to minimize the probability of traffic accidents with small investment.
Relevant literature in Chinese and English from 2000 to August 2022 were searched in the China National Knowledge Infrastructure (CNKI) and Web of Science (WoS) and the frequency analysis of the keywords of these literatures was performed using the statistical function of CiteSpace. The two main elements with 'frequency' and 'centrality' as keywords, the top five keywords of Chinese literature are: expressway (20, 0.29), cluster analysis (13, 0.21), GIS (12, 0.3), traffic engineering (8, 0.18), big data (7, 0.14), the top three keywords in English literature are model (62, 0.09), kernel density estimation (37, 0.14), spatial analysis (32, 0.09). Visually analyze the keywords of the documents within the search scope, and the visualization results are shown in Fig. 1. The font size and node size of the keywords in the relationship graph are positively correlated with the weight, and the thickness of the connection between each keyword node represents the closeness of the direct relationship between the keywords. As can be seen from Fig. 1, the current research hotspots can be summarized as GIS, cluster analysis and expressway, respectively.
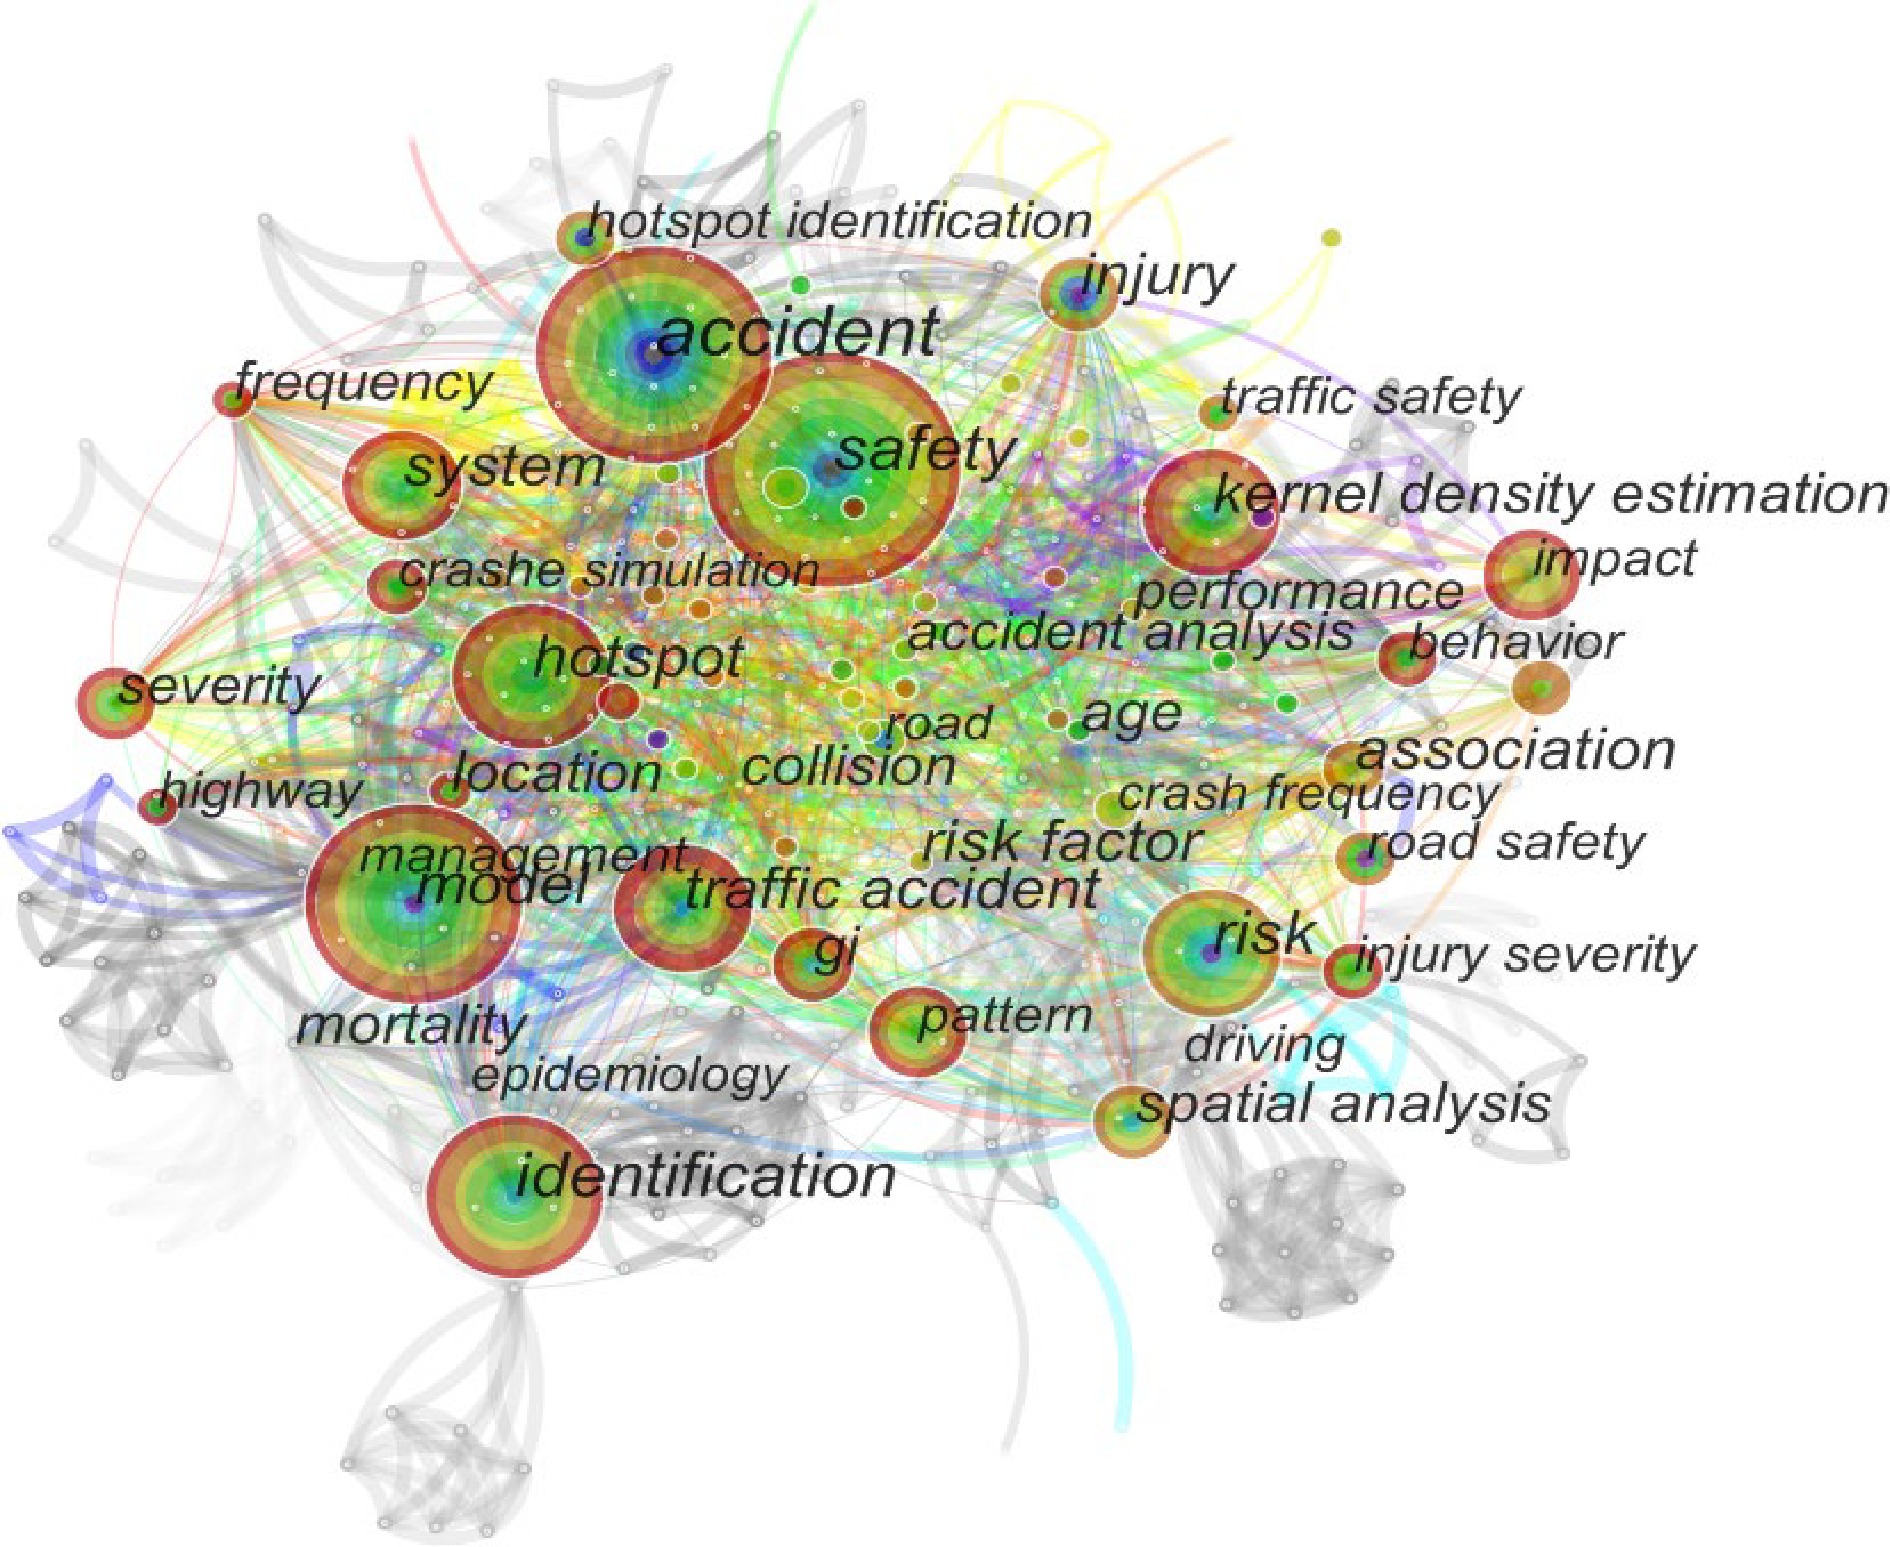
Figure 1.
Keyword clustering network diagram from the English literature studied.
For the identification of accident-prone points, a series of studies have been conducted by Chinese and foreign researchers and institutions. Research on identification was carried out earlier abroad, and a series of traditional methods such as the accident rate method, the quality control method and the safety factor method were first developed. Then on the basis of these methods, special studies and improvements were carried out and developed in the direction of accuracy and practicality. Chinese scholars have also carried out some in-depth research work on the basis of commonly used identification methods, combined with fuzzy evaluation methods, genetic algorithms, neural network models and so on, with remarkable research results. Comparing the research status at home and abroad in recent years, we find that foreign scholars focus on the innovation of data and indicators, and the research work on the identification of accident-prone points in road network safety management has gradually advanced, moving from accident-prone point safety management to road network safety management. In China, most of the research has focused on the integration of multiple identification methods and on theoretical innovation.
Due to the limitation of research data, the theories, methods and techniques of accident-prone point identification are not systematic and perfect, and there is still a gap between them and their universal application, which cannot effectively guide the safety design, operation and management of roads. This paper systematically reviews the existing research theories and methods in terms of common identification indicators, identification methods and future development directions. By analysing the hot issues and challenges faced by the research driven by big data, future research priorities and breakthrough directions are clarified to provide support for further improving road safety and enriching the theoretical system of traffic safety.
-
The identification indicators of accident-prone points can generally be divided into absolute indicators, relative indicators and comprehensive indicators. The absolute index is based on the basic accident statistics. Usually, the number of accidents per unit length in the statistical time is used to reflect the accident status of the road section, and the calculation is relatively simple. At present, the widely used absolute indicators include the number of accidents, casualties, and direct economic losses, which directly show the severity of accident-prone points and provide a basis for the traffic management department to determine the order of treatment.
The absolute index is based on the basic accident statistics, and the number of accidents per unit length in the statistical time is mostly used to reflect the accident status of the road section, and the calculation is relatively simple. Currently, the widely used absolute indicators include the number of accidents, the number of casualties, and direct economic losses, which directly show the severity of accident-prone points and provide a basis for the traffic management department to determine the order of treatment.
The relative index is to calculate the relative accident rate under certain conditions by linking the absolute indicators such as the number of accidents and the number of casualties with the objective factors that affect the occurrence of accidents, such as road length, traffic volume, regional population, and car ownership. It makes the identification index more objective and comprehensive, and is widely used in the identification method of accident-prone points. For example, the accident rate method determines the number of accidents per million vehicle kilometers per year as the criterion. If the accident rate of a certain location or road section is greater than a certain a priori standard value, it is judged as the accident-prone section. This method objectively considers the influence of the survey location and survey time, but the calculation result is sensitive to the traffic flow of the road section, which easily leads to the distortion of the identification result. The calculation method of accident rate is shown in formula (1).
$ {U_f} = \frac{{{N_t} \times {{10}^4}}}{{V \times L}} $ (1) In the formula: Uf represents the accident rate (Number of accidents/10,000 vehicles per kilometer or 10,000 people per kilometer); Nt is the number of accidents (times) on a road segment of length L in year t; V is the number of cars or the total population of the road sections; L is the length of road segment (km) .
The comprehensive index is a judgment index that comprehensively considers absolute and relative factors. Identification methods such as matrix method, quality control method and equivalent accident number-accident rate method all use comprehensive indicators for identification. For example, the equivalent accident rate considers both the severity of the accident and the influence of the traffic volume and the length of the road section to describe the accident characteristics more comprehensively. This method takes into account more than two main factors affecting road traffic safety, and performs equivalent transformation calculations on the basic statistical data to express the comprehensive level of road traffic safety. The typical comprehensive indicators are shown in formulas (2) and (3).
$ K = \frac{Q}{{\sqrt {PN} }} $ (2) $ {K_d} = \frac{{{Q_{\text{d}}}}}{{\sqrt[3]{{P{N_{\text{d}}}{L_d}}}}} $ (3) In the formula: K is the comprehensive accident coefficient; Kd is the equivalent comprehensive accident coefficient; Q is the number of traffic accidents that occurred on the surveyed road during the statistical time period; Qd is the equivalent number of traffic accidents that occurred on the surveyed road during the statistical time period; P is the statistical time period is the population number within the surveyed road range; N is the number of vehicles passing the surveyed road within the statistical time period; Nd is the equivalent number of vehicles passing the surveyed road within the statistical time period; L is the length of the surveyed road section.
At present, the development of identification indicators for accident-prone points tends to be comprehensive, and the factors considered are no longer limited to road and traffic attributes. They not only reflect the location of road accident-prone sections, but also reflect the change process and development trend of accident black spots. For example, Bhavsar et al. analyzed the speed, traffic flow and road characteristics data of a four-lane rural road in Dahode, India, and proposed a new model that incorporates the average daily traffic volume and average on-site speed into the identification of accident-prone locations. The model uses accidents per kilometer as the dependent variable and the hub density, ADT, AS, etc. as independent variables, and is evaluated by correlating various attributes of the accident site with the severity of the accident (fatal or non-fatal)[2]. Bham et al. proposed a composite rank metric CPRM based on principal component analysis, which comprehensively considered the collision rate (CR), empirical Bayes coefficient (EB), equivalent property damage (EPDO) and other indicators to overcome the current situation. There are limitations of network screening metrics, and the discriminative results of CPRM are validated using US interstate and intrastate highway data[3]. Scholars such as Lee & Mannering proposed an improved method for screening hotspots, which allows the length of each hotspot to be dynamically determined according to the imposed constraints, using a sliding window (SW) and a continuous risk profile (CRP) to seek the optimal target value. The screening method has been demonstrated with historical crash data on the San Francisco highway in California (USA)[4].
-
Commonly used accident identification methods in research can be divided into mathematical statistics, cluster analysis, machine learning, and conflict technology according to evaluation indicators and modeling methods. The safety factor method, the grey evaluation method, the empirical model method and the regression analysis method are all commonly used methods in the identification of the macro-regional accident-prone locations. However, the cluster analysis method and the traffic conflict rule have developed rapidly in the micro-discrimination aspect, fully exerted the data mining function, and realized the rapid and effective determination and screening of the frequent points of road traffic accidents. In addition, with the continuous research and development of GIS, GPS and other high-tech, many new methods are gradually introduced into the research of accident-prone points.
Mathematical statistical methods
-
Mathematical statistics methods mainly search for internal laws by counting the number or frequency of traffic accidents at different points, and finally make relatively accurate judgments and predictions. When analyzing and judging the traffic safety situation, the public security traffic management department mostly uses the mathematical statistics method, and the indicators are developed from accident frequency and accident rate to more objective indicators, such as comprehensive accident frequency, equivalent accident number and cumulative frequency. In the 1940s, the traffic management department of Florida first adopted the accident number method when identifying the locations of frequent road traffic accidents. The most representative mathematical statistical method in the early stage is the quality control method. Norden et al.[5] first applied the quality control method to the identification of accident black spots, Sung et al. improved the quality control method based on the negative binomial distribution[6], Persaud & Hall proposed a Bayesian-based quality control method by comparison[7].
In 1997, Chen & Wang first proposed to use the critical rate to identify dangerous road sections[8]. In 1999, Jordan combined the advantages of the accident number method and the accident rate method, and proposed a matrix method. The road sections with high accident number and accident rate were identified as accident black spots. The safety of road sections with low accident rate characteristics needs to be further analyzed in combination with road conditions[9]. In 2001, Saccomann et al. applied Poisson regression analysis and empirical Bayesian model to the identification of accident-prone points, and proved the feasibility of the two models through the accident data of the SS107 highway in southern Italy[10]. In 2001, Fang et al. proposed the cumulative frequency method, which calculates the cumulative frequency by sorting the frequency of accidents. The position with a small cumulative frequency but a large number of accidents is a possible accident-prone point[11]. In 2002, Xinglin & Bingkun proposed the identification method of the number of equivalent accidents-the accident rate. After calculating the average number of equivalent accidents and the accident rate, the moving ruler method was used to determine the accident-prone points[12]. In 2006, Yulong improved the quality control method, using the gamma distribution with the formal parameter nb and the ruler parameter 1/tb to calculate the average accident rate, and identified the Shenyang-Dalian Expressway, and obtained a reasonable identification result[13]. In 2013, Gregoriades & Mouskos used Bayesian network to establish the index of accident risk index, and completed the identification of accident-prone points through scenario simulation[14]. In 2016, Guerrero-Barbosa & Santiago-Palacio used the quantile regression method to classify the danger level of accident-prone road sections within the city of Ocanha, Colombia[15]. In 2017, Meng & Qin used statistical analysis and hypothesis testing to find that the number of accidents on the basic sections of the expressway conformed to the negative binomial distribution, and based on the accident data of nine expressways such as the Beijing-Zhuhai Expressway, it was proved that the distribution was used to determine the accident-prone locations. It is theoretical and feasible[16].
Different from other identification methods, the quality control method presupposes that the number of traffic accidents on any road section obeys the Poisson distribution, and compares the accident rate of the location with the actual average accident probability of similar locations. The level determines the range of the comprehensive accident rate. If the actual accident rate of the inspected location is greater than the upper limit of the comprehensive accident rate, it is considered to be an accident-prone location. This method overcomes the experience and subjectivity of judging criteria, and considers the impact of traffic volume, but requires data from similar roads and does not consider the severity of the accident. It is suitable for road networks or road sections with roughly the same road and traffic conditions, while it is not suitable for identification of urban accident-prone points at the meso and micro scales. It has requirements for the traffic flow of each road, and does not consider the temporal and spatial accumulation and dynamic patterns of temporal and spatial evolution.
$ P(X\text{=k)=}\frac{{\lambda }^{k}}{k!}{e}^{-\lambda } $ (4) $ R_C^ \pm = {R_0} \pm K\sqrt {\frac{A}{M}} \pm \frac{1}{{2M}} $ (5) In the formula: λ represents the average number of accidents;
$R^{\pm}_C $ $R^+_C $ $R^-_C $ Due to the randomness of traffic accidents, the accident indicators of road units in a certain period of time cannot fully reflect the road traffic safety situation in this period. Only the expected value of the accident index can more accurately reflect the road safety level, and the expected value of the accident index can only be obtained by estimation. Statistical accident indicators are likely to produce large deviations, which are often referred to as regression to the mean (RTM). This is a salient feature of traffic accidents, indicating that the accident indicator will revert to its mean over time[17,18]. The empirical Bayesian method not only considers the accident information of the road unit itself, but also fully combines the accident information of similar roads of the same type, which can avoid the influence of the mean regression effect caused by the randomness of traffic accidents. In 2010, Montella used the location consistency test to compare several common methods of identifying accident-prone points. It is found that the empirical Bayesian method is superior to other traditional methods of identifying accident-prone points, and is the most reliable and effective method for identifying accident-prone points[19]. For the accident number λi of road segment i, the formula for calculating empirical Bayes is as follows:
$ {\lambda _i}{\text{ = }}{\omega _{\text{i}}}E\left[ {{\lambda _i}} \right] + \left( {1 - {\omega _{\text{i}}}} \right){{\text{x}}_{\text{i}}} $ (6) $ {\omega _{\text{i}}}{\text{ = }}\frac{1}{{1{\text{ + }}\dfrac{{VAR\left[ {{\lambda _i}} \right]}}{{E\left[ \lambda \right]}}}} $ (7) where: i is the code of the road;
$ {\lambda }_{i} $ $ {\lambda }_{i} $ $ {\lambda }_{i} $ In summary, the mathematical statistics method has developed from a single index evaluation in the past to a comprehensive index identification combined with road attributes or accident severity. Considering the traffic conditions of similar road sections at the same time, it can objectively and comprehensively reflect the road conditions and traffic safety conditions of a specific location. Due to the simple operation and intuitive results of the mathematical statistics method, this method will still be widely used in practical engineering in the future.
Cluster analysis method
-
Mathematical statistics method is mainly based on traffic accident statistics, but it does not make full use of statistical data, nor does it truly reflect the severity of accidents. Meanwhile, the accident-prone points obtained are often of equal length, which lacks objective authenticity. With the rapid growth of traffic accident data scale, data mining has become a new research focus. The cluster analysis method can divide the unknown data set into several groups or classes with common attributes, and the similarity standard of the division is determined according to the distance between the data objects. In the identification of traffic accident-prone points, there are mainly five clustering methods based on division results, grid-based, hierarchy-based, density-based and model-based. Among them, the amount of calculation based on the division results is large, which is suitable for discovering small and medium-sized databases. For example, Yang selected an area with a relatively high accident density in Xicheng District, Beijing (China), and used the K-Means clustering algorithm to conduct research and analysis, and obtained each time period. Accident-prone areas are used to construct a road network topology map based on accident-prone areas[20].
Accident analysis methods based on density clustering are generally used for regional traffic accident analysis, showing the situation of concentration in some areas. It is especially obvious for identifying traffic accidents with specific characteristics (such as drunk driving, speeding, etc.), which is convenient for the traffic control department to carry out refined management of traffic accidents in the region and formulate targeted accident prevention countermeasures. Anderson analyzed the spatial characteristics of the distribution of road traffic accidents by using the idea of kernel density estimation method, and performed K-means clustering on the accident data of London for four consecutive years, so as to determine the accident-prone points[21]. In 2018, Lin et al. established a new error criterion function to eliminate the influence of abnormal noise data points, and improved the K-means clustering algorithm to identify the accident black spots in Yinzhou District, Ningbo City (China)[22]. Wang & Lu used the grey clustering evaluation method to analyze and determine the location of the accident black spots in the up and down direction of the Changyu Expressway, and the results were basically consistent with the actual investigation[23]. DBSCAN (Density-based Spatial Clustering of Applications with Noise) is a density-based spatial clustering algorithm proposed by Martin Ester[24]. Wang et al. verified through an example that the method can clearly characterize the danger level of each road section in the road, realize the arbitrariness of the detection length selection, and is suitable for the study of the spatial distribution characteristics of accident-prone points[25]. In 1999, Luo & Zhou proposed an identification method based on dynamic clustering, adding the severity of the accident to the Bayesian probability model[26]. In 2015, Chen used the network kernel density estimation method to improve the coverage to linear line segments under the constraints of the road network, and identified accident black spots on the urban road network of Burlington in the United States, which improved the comprehensive identification efficiency and accuracy[27]. Wang & Wang took the three-year road traffic accident data in a certain place in East China as the research object, formed accident spatiotemporal sub-sections through road network matching and road network clipping, and proposed to use the network spatiotemporal kernel density estimation based on the traffic accident scene as the identification index. Accident-prone point identification method using cumulative frequency method and zero-inflated negative binomial regression model to determine the identification threshold[28].
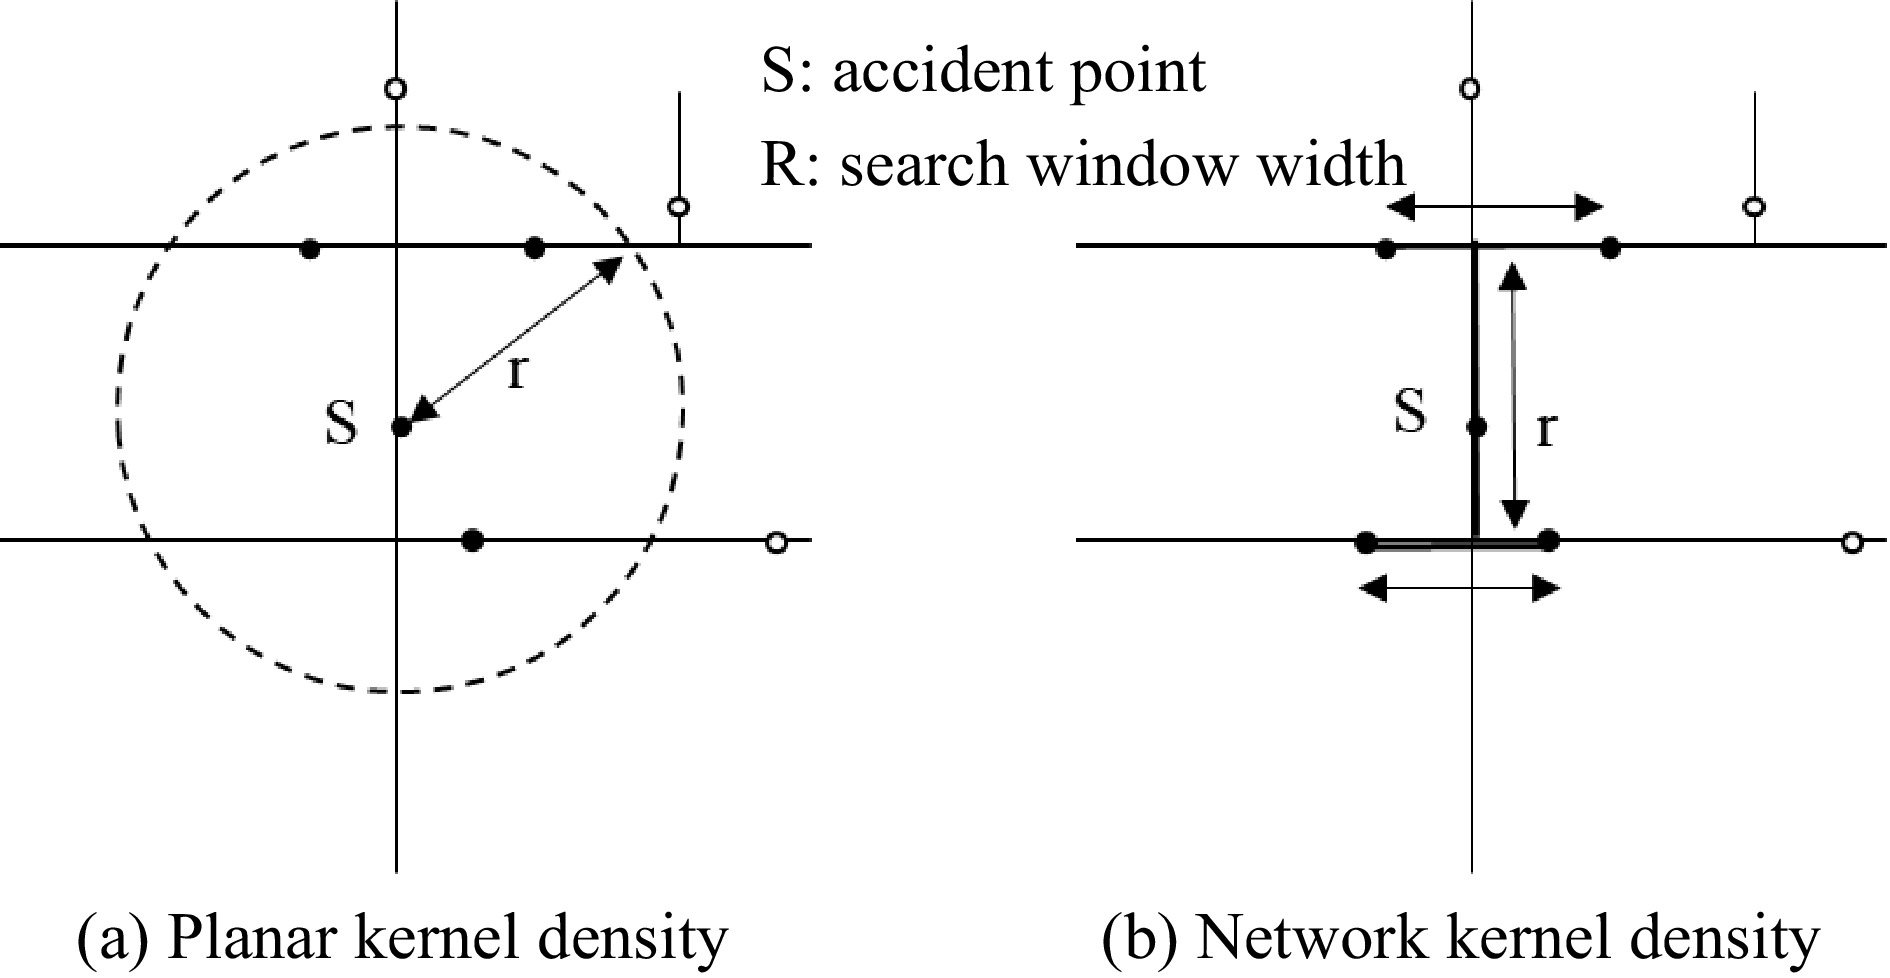
Kernel density estimation (KDE+) is a method that currently helps researchers and road managers in many countries to quickly identify accident-prone locations in transportation networks[29−32]. The KDE+ method is based on a standard kernel density estimation method enriched by statistical tests for cluster significance. The search window of the plane kernel density estimation is a circular plane with the search window width as the radius. The network KDE+ uses the shortest path distance in the linear space as the basis of the window, and takes the window width of a certain length as the attenuation threshold of the accident influence range. The principle is shown in Fig. 2. KDE+ produces a relative metric, cluster strength, and uses this to rank accident-prone hotspots, prioritizing the most dangerous hotspots. Bíl et al. used a clustering method to identify traffic accident hotspots in rural areas of the Czech road network over 9 years, and the results were well confirmed[33].
In summary, the cluster analysis method has been widely used in road safety research and identification of accident-prone points. This method avoids making subjective assumptions on sample data and realizes the objectivity of parameter index selection. While clustering accident data, it fully utilizes the data mining function, solves the problems of complex algorithm and single identification index, and provides a new idea for the research of road traffic safety. However, the current clustering methods are not comprehensive enough to consider the spatial information of traffic accidents, and the reliability of road traffic accident-prone point segment evaluation needs to be improved. In the future, the identification of accident-prone locations will combine other research methods and spatial analysis techniques such as principal component analysis, and consider accident influencing factors including pedestrians, vehicles, roads, and the environment, so as to comprehensively evaluate the level of road traffic safety.
Machine learning
-
The identification indicators considered in the identification of traffic accident-prone locations are becoming more and more comprehensive, and it is difficult to solve it with a clear function or existing traffic optimization problems. Therefore, the method of machine learning is introduced. As a classic model in machine learning, the typical neural network structure is shown in Fig. 3, including input layer, hidden layer and output layer, each layer has a corresponding neural network connected to the next layer. The input layer is generally a road traffic safety evaluation index system, each neuron corresponds to an index, the hidden layer mainly solves the linear inseparability problem, and the output layer is the identification result. Considering various influencing factors, Meng et al. considered various influencing factors to establish a three-layer BP neural network-based identification model for accident-prone points of urban arterial road accidents. And the data of 13764 traffic accidents occurred in 1999 to 2004 on 430 main road sections in the urban area of Harbin were identified[34]. On the basis of applying the multi-level gray evaluation method, Zhang et al. used the neural network method optimized by genetic algorithm (GA-BP neural network) to construct and verify the identification model of the road sections with frequent road traffic accidents in Urumqi, which has a high convergence speed and prediction accuracy[35]. Zhang et al. selected the traffic accident data of Lianfeng Middle Road, Yinzhou, Ningbo (China) as the analysis data set, and used Bayesian network to build a black spot recognition model. By comparing with three common algorithms of ID3 decision tree, logistic regression and support vector machine, it is proved that Bayesian network is the best model for effectively identifying black spots of road accidents[36]. Based on the traffic accident data in Suzhou Industrial Park (Suzhou, China), Fan et al. conducted a fusion analysis of the multi-source internal flow factors involved in traffic accident black spots, and proposed a black spot recognition algorithm based on deep neural network. The ability of the model to identify accident black spots was verified by establishing a deep neural network with relevant data category information[37]. Aiming at the difficulties such as the small number of samples of water traffic accidents and the drift of data information, Liu et al. proposed an identification index system for the 'black spots' of the waterway from the aspects of the complexity of the waterway and the frequent occurrence of accidents. The identification model of 'accident black spots' in inland waterway based on MEA-BP neural network was constructed, and the validity of the model was verified by an example of the Yangtze River waterway in the Three Gorges Reservoir area[38].
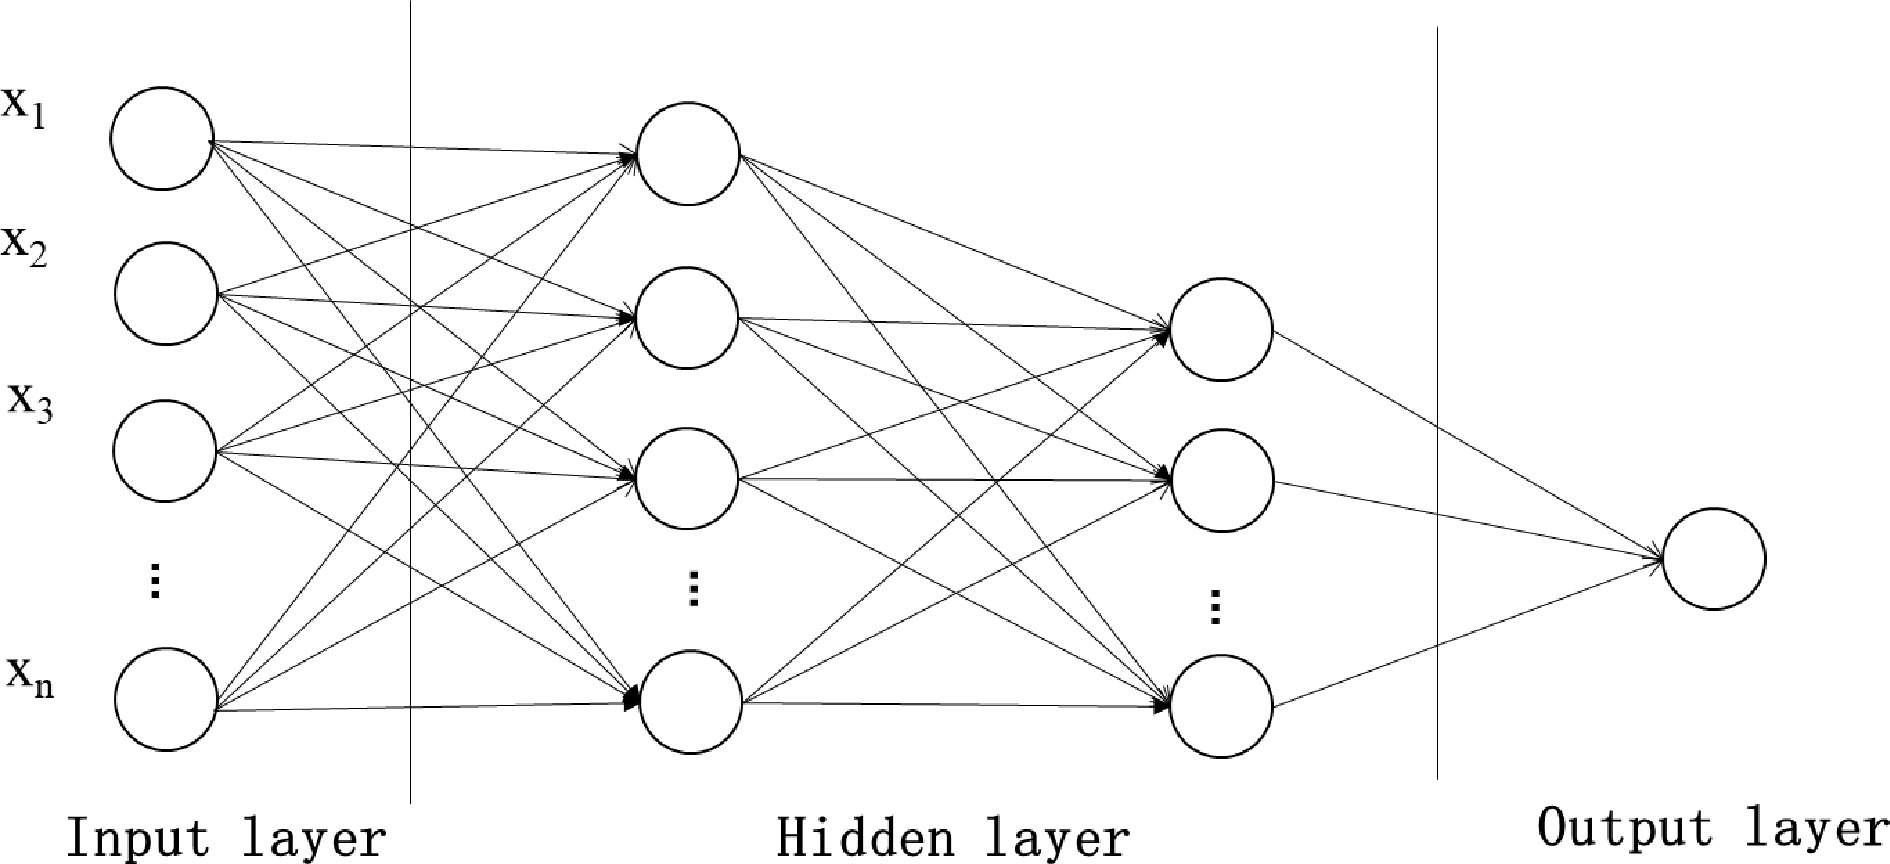
Figure 3.
Schematic diagram of the neural network model.
As an innovative identification method, machine learning has strong functions of classification and pattern recognition. By correctly selecting the main influencing factors of road traffic accidents and using the characteristics of the parallel structure of neural networks, not only can the safety status of the road traffic system be evaluated, but also the accident-prone points ignored by conventional identification methods can be identified. However, the current machine learning model mainly analyzes the existing road conditions, ignoring the dynamic changes of the road conditions, and the accuracy of the data has a great impact on the stability of the model. The future research direction can consider adding dynamic factors on the basis of static recognition, and combining with image recognition technology to establish a dynamic accident-prone location identification model.
Traffic conflict technology
-
Traffic conflict technology (TCT) belongs to the indirect evaluation method of non-traditional accident data statistics, and is a safety evaluation method established from the influencing factors of traffic accidents. It can not only quantitatively analyze the conflict occurrence process and evaluate the severity, but also make up for the deficiency of simply analyzing traffic accident data. Because the law of conflicts in road sections conforms to Poisson distribution, and there is a good correlation between conflicts and accidents, conflicts can better reflect the safety degree of locations. Through a large number of statistical analysis of traffic conflicts at the survey sites, the conflict value representing the safety of the road section can be obtained as the judgment standard. If the observed actual number of collisions is greater than the standard value, the road section is identified as an accident-prone location, which should be the focus of the traffic control department. This method is usually suitable for identifying accident-prone points of intersections in urban roads, but ignores factors such as road environment and traffic management. The traffic conflict method has higher requirements on video data, and is more suitable for dynamic monitoring of accident-prone points at the micro-scale (a certain intersection or road section).
The causes of traffic accidents and traffic conflicts are completely similar to the previous process, and the only difference between the two is whether direct damaging consequences occurred. Therefore, the use of traffic conflict data can be used to analyze the causes more directly and quickly. Da Costa et al. developed a new black spot recognition model based on empirical Bayesian using historical data of collisions on the Ipswich Highway in Australia from 2005 to 2009. The model also incorporates the severity of collisions, which has strong practical implications[39]. In 2000, Zhou & Luo established a method for identifying the frequent points of road traffic accidents based on traffic conflict technology on the basis of summarizing the existing methods. And the effectiveness of the method was confirmed by the conflict observation data of the Zhengzhou Yellow River Highway Bridge[40]. Wu constructed the discriminant model and standard of multi-section accident-prone points from the perspective of the danger of serious conflict. An example analysis was carried out on two typical road sections and intersections in Nanjing (China), which realized the rapid and effective determination and screening of urban road accident-prone points[41]. Sun et al. further proposed a gray evaluation method based on traffic conflict technology by introducing the evaluation index of the number of serious conflicts and using the gray evaluation method to classify the clustering values of various gray classes. Finally, the four-year accident data of a secondary highway in Chongqing (China) was used to prove the superiority of this method[42].
The traffic conflict technology itself and the discriminant model still need to be further improved and perfected. Most of the existing research theories of traffic conflict technology take road intersections as the research object, and it can be diverged to local and regional safety evaluation and diagnosis in the future. The comparison results of the main identification methods for the above-mentioned accident-prone points are shown in Table 1.
Table 1. Comparison of identification methods for accident-prone points.
Research perspective Accident identification method Index Applicable conditions Advantage Disadvantage Micro level Accident frequency method Number of accidents Suitable for a specific range of smaller intersections or streets, etc. Single indicator;
Easy to determine;
With good operabilityThe judgment results are highly subjective, and the differences in traffic conditions and road environment are not considered;
High error rateAccident rate method Accident rate Suitable for longer sections or regional roads Comprehensive consideration;
Strong operability and intuitive resultsLack of consideration of the severity of the accident;
A gap with actual traffic conditionsEmpirical model method Predicted number of accidents Suitable for level intersections of roads. The model is intuitive;
It can solve the problem of random fluctuationDifficulty in collecting a large number of typical level intersection statistics;
Cannot be used for road segment or area identificationEquivalent accident number method Equivalent Accidents Suitable for roads with similar road conditions and stable traffic volume Considering the differences in the severity of accidents;
The evaluation results are objective and comprehensiveFactors such as traffic volume and road conditions are not considered
The choice of weights is subjectiveTraffic conflict laws Distance, speed, time Suitable for urban roads or specific road sections and intersections The dependence on accident statistics is small;
The theoretical basis is sufficient; The cycle is shortConflict investigation workload is heavy;
Difficult to model, poor portability
The influence of road environment, etc. is not consideredMeso level Quality control method Upper and lower bounds on the combined accident rate Suitable for road networks or road sections with roughly the same traffic conditions The calculation is simple, the theory is perfect, and the scope of application is wide, considering the random fluctuation problem The workload is large and accurate traffic data is required;
Does not consider spatiotemporal accumulation and dynamic patterns of spatiotemporal evolution;
Confidence selection is subjectiveEmpirical Bayes Bayesian prior and posterior estimates, recognition thresholds Suitable for intersections with roughly the same road and traffic conditions Homogeneous road data is considered to avoid the influence of the regression effect caused by the randomness of accidents, and the prediction accuracy is high Excessive requirements for the completeness of historical data
Does not consider spatiotemporal accumulation and dynamic patterns of spatiotemporal evolution
The calculation process is complicatedMacro level Grey evaluation method Influencing factors and indicators constitute an evaluation set Suitable for regional road network Clear meaning, clear algorithm, strong practicability Have a certain degree of subjectivity;
Data indicators are too single;
Evaluation accuracy is lowCumulative frequency method Number of accidents per kilometer, accident rate per vehicle kilometer Suitable for regional roads with poor traffic conditions and different accident conditions Wide application, relatively mature judgment threshold, high practical value The selection of unit length has a great influence on the results;
Factors such as traffic volume and accident severity are not considered;
There may be peak clippingRegression analysis Regression Model Predicts Number of Accidents Suitable for regional road networks and roads Considering factors are comprehensive and the scope of application is wide The algorithm is relatively simple;
The results are subjective and difficult to apply in practiceCluster analysis Equivalent total Accident rate value, accident-prone point threshold value Applies to the entire road network or to specific roads The results are reasonable and accurate, and the positions that are easily missed by the traditional method can be identified The number of indicators used is limited and the accuracy is not high
The results have certain limitations -
The arrival of the era of big data has changed the development prospects of many fields of science and technology. Traffic big data mainly comes from GPS data, road toll systems, video detectors, handheld terminals, the Internet, etc., with huge output and rich information. Traffic accidents are random events, which are the result of the joint action of various risk factors. With the help of transportation big data, transportation infrastructure, transportation vehicles, transportation participants and the environment can be systematically considered. Maximize the advantages of information resources and overcome the limitations of data collection and the problems of large storage costs in the past.
As an important part of traffic big data, traffic accident data also has 3V characteristics: that is, a huge amount of data, rich data types, and high timeliness requirements. Using data mining technology to scientifically analyze accident data can effectively explore accident-prone points, and the research results are also conducive to in-depth understanding of the characteristics of traffic accidents and the action paths of causative factors. The traditional identification method of accident-prone points is mainly based on the analysis of accident data, while big data technology brings a new idea for identification and broadens the development space of accident-prone identification methods. The research scope relationship between big data and accident-prone location identification is shown in Fig 4. It has become a future trend to apply big data theory to deeply mine data features and analyze accident-prone locations to improve traffic safety.
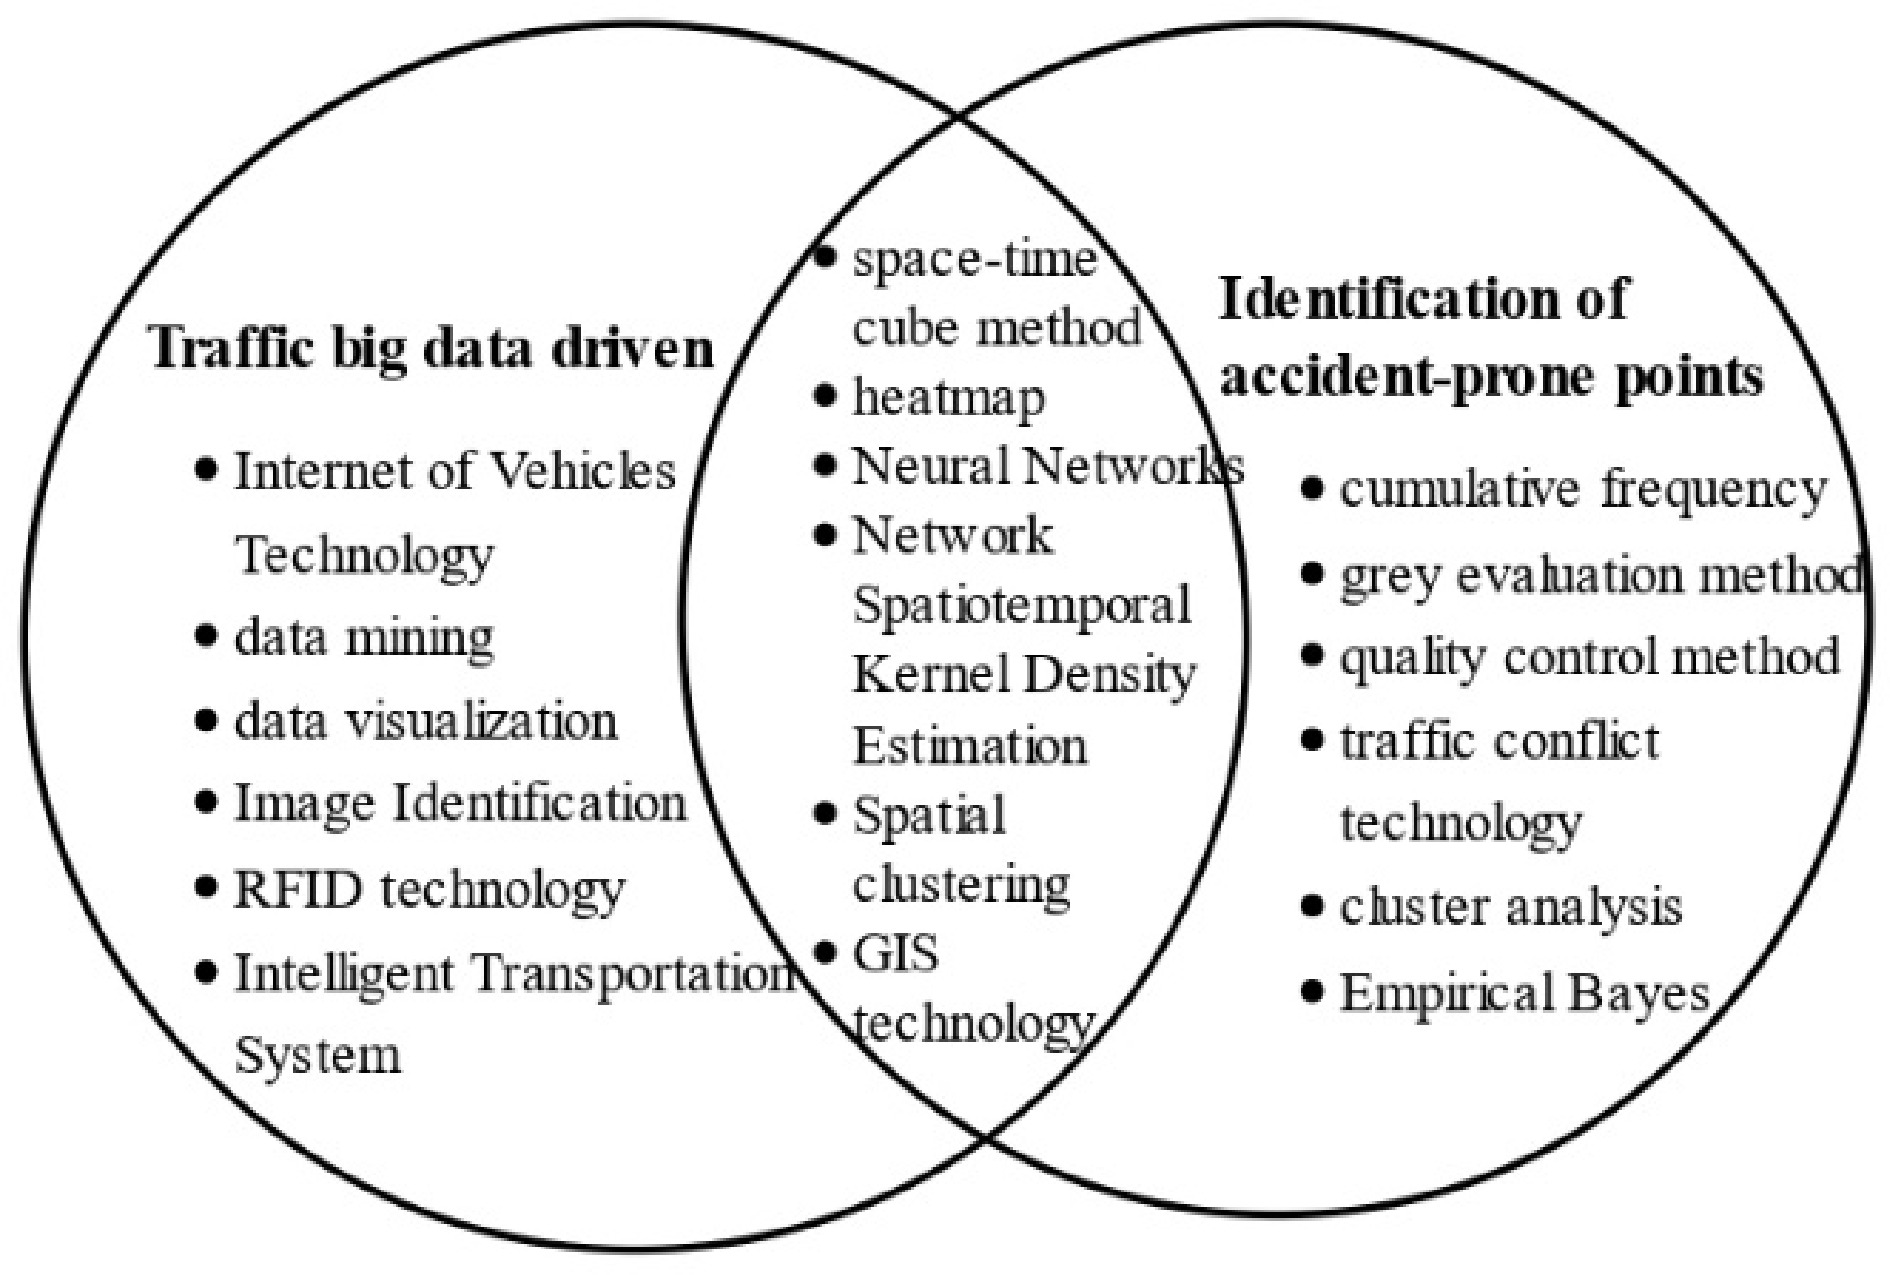
Figure 4.
Relationship diagram of research scope.
Driven by traffic big data, the identification of traffic accident-prone points has been further developed at the meso and micro scales. Discrimination methods of spatial statistics, such as spatiotemporal road network cube method, kernel density estimation and network kernel density estimation, have become popular in recent years. Spatial statistical methods can more comprehensively consider the spatiotemporal characteristics of traffic accidents, and at the same time can more deeply judge the spatiotemporal dynamic evolution of accident data, which is helpful for the dynamic identification of accident-prone points. Wu et al. are closely connected with reality, combining the space-time cube and the cumulative frequency curve method. Using the accident data of Huafu Street, Futian District, Shenzhen (China) to accurately identify three accident-prone locations in the urban road network, including sustained hot spots, continuous hot spots and scattered hot spots[43].
With the deepening of research, the method of identifying accident-prone points has a more scientific, efficient, accurate and visual development trend. Combined with the GIS platform, which has better spatial analysis technical characteristics, it can accurately excavate the spatial attribute characteristics and correlation of accidents. GIS system can not only use the method of 'Point buffer analysis' and 'Overlay analysis' to identify the accident-prone locations, the linear reference system and dynamic segmentation technology can be used to correlate the road attributes with the spatial location, and analyze and model the traffic accident data according to the geospatial information. Sandhu et al. used the network kernel density method to identify the accident-prone locations on some highway sections in India, and visualized them on the GIS map[44]. Erdogan et al. used two statistical methods of Poisson distribution and Bernoulli distribution in GIS system, respectively, and obtained the same identification results of accident-prone locations[45]. Wang & Li proposed to take the number of accident-equivalent fatalities as the point buffer radius, and applied it on the basis of some traffic accident data in a certain city, and obtained three frequently-occurring areas and two frequently-occurring road sections related to traffic accidents[46]. Yuan et al. proposed a new identification method based on firefly clustering algorithm and GIS, and selected the accident data in the urban area of Jinan City (China) to verify the feasibility of the algorithm[47]. Li established an identification model of accident-prone locations based on spatial autocorrelation and logistic regression theory combined with GIS spatial analysis functions, comprehensively considering accident attributes and spatial attributes, and took Enschede, the Netherlands as an example to verify[48]. Zhu et al. built an identification and analysis system for accident-prone road sections based on GIS spatial clustering based on the cumulative frequency method and GIS linear reference technology. The identification and analysis of accident black spots on roads in Shenzhen's jurisdiction from 2014 to 2016 were carried out, and the application prospect of GIS spatial analysis technology in traffic accident analysis was discussed[49].
Iranian scholars Jahan et al. improved the quality control method, considering the severity of the accident and the traffic volume, and proposed a comprehensive identification method based on P and P' control charts. The feasibility of the method is validated using accident data on the Tehran-Mashhad highway, and the ineffectiveness of corrective actions for accident black spots identified by traditional methods[50]. Harirforoush & Bellalite combined the network-based kernel density estimation with the HSM network screening method, considered the impact of exposure data on the identification of accident black spots, and then used the traffic accident data from 2011 to 2013 to test the Sherbrooke road network[51]. Xu & Tao proposed a method for identifying accident-prone points based on the principal component clustering ensemble model, and extracted accident hot spots through the Canopy-k means ensemble clustering algorithm. The identification results of the Anhui section of the G50 Shanghai-Chongqing highway show that the principal component cluster analysis method can not only carry out scientific accident statistical analysis, but also reflect the real traffic safety status[52].
With the in-depth development of identification methods, the data used for identification also presents a trend of diversification, from the initial typical accident data to the combination of road and spatial data, from simple historical accident data to dynamic spatiotemporal data. At the same time, data mining related technologies such as association rules, fuzzy logic, rough sets and decision trees are used for data mining, as shown in Table 2. In 2015, Australian scholars Sinnott & Yin linked historical accident blackspot information with Twitter data to reliably identify accident-prone locations in real time[53]. Heat maps are currently widely used to visualize accident data. In 2018, Szénási et al. and other scholars used morphological image processing methods to locate road accident-prone points on heat maps[54]. In 2020, Kipruto Wilson Cheruiyot et al.[55] developed a new technique for identifying black spots in four street view images based on semantic segmentation. Accident blackspots and safety spots were successfully classified using data from Thailand, where 75.86% of the blackspots were correctly identified[56].
Table 2. Comparison of identification data.
Past Now Single typical accident data Accident data, road attributes, spatial attributes Specific road intersection Spatiotemporal road network Road segments by distance Divide homogeneous road segments Simple historical accident statistics Spatiotemporal accident data Traffic accident record Traffic travel information Number of traffic accidents or conflicts Image, heat map recognition -
Traffic accident-prone points have always been the key targets of road traffic safety management, and effective identification of them can reduce the risk of accidents. However, the formation of traffic accident-prone points is a complex problem, involving many influencing factors, and different object-oriented and analysis angles, forming a huge research system. This paper firstly summarizes the Chinese and foreign researches systematically, and then proposes three types of identification indicators: absolute, relative and comprehensive by selecting different reference standards. Then, according to the evaluation indicators and modeling methods, from the aspects of mathematical statistics, cluster analysis, machine learning, conflict technology, etc., it systematically summarizes the current research status and existing problems of the theory and method of identification of accident-prone points.
Although scholars from various countries have carried out research on the identification of traffic accident-prone points for many years, there are still many difficulties that have not yet been broken through. The booming emerging technologies in recent years have brought new ideas to the solution of these problems, and the arrival of the era of big data has expanded the development space. For example, the integration of GIS and clustering algorithms provides data support and visualization for the identification of traffic accident-prone points, and big data and artificial intelligence algorithms effectively improve the identification accuracy[49,51]. In the era of big data, with the development of the Internet of Vehicles, smart transportation and the popularization of new technologies such as mobile terminals and social media, massive traffic data containing rich information has continuously shown its potential value in traffic system analysis. The advancement of communication and network technology provides a new source of information for analyzing accident-prone points[53−56].
Foreign studies on traffic accident black spots are mostly focused on traditional statistical principle identification methods and comprehensive methods and other research fields[14,15]. These research methods have been continued and widely applied abroad. The main reason is that the traffic accident management and research departments in developed countries have rich basic data for the collection and research of accident black spots with large sample size. It has a relatively complete and systematic traffic safety data, and has good conditions for statistical application. China has introduced many new methods in road black spot research and analysis, but in the process of research often aimed at a certain area or a section of road, but not to expand the new method theory, research is disconnected, has not yet formed a perfect black spot analysis technology system, there are obvious limitations in the use of method[22−26]. The current road traffic accidents show the characteristics of diversity and severity, which also puts forward higher requirements for the identification method and identification accuracy of accident-prone points. The future identification method must be a fusion of multiple methods, and at the same time consider the temporal and spatial distribution of accidents, and the identification results are gradually transformed from regions to specific road sections and points to achieve more refined and precise identification. The identification of traffic accident-prone points driven by big data can provide support for improving the safety level of road traffic, and provide reference suggestions and directions for road design rectification and effective traffic safety management regulations and measures.
The formation of accident-prone locations is influenced by multi-dimensional factors including vehicle type, road, time and environment, and there may also be a coupling effect between factors[4]. They may be characterised by complex and variable road alignments, with more small radius curves, longer and steeper longitudinal slopes, a larger proportion of tunnels and more bridge and culvert structures. In unfavourable weather conditions or wet road conditions, the driver's mood, vision is greatly affected, the friction coefficient of the road significantly reduced, the braking stability of motor vehicles, steering stability will become worse, in the combined effect of a variety of factors are very prone to traffic accidents.
There is a need to fully apply big data for black spot prevention of road traffic accidents. Combined with the existing map software's road traffic accident uploading and prediction functions, a data platform for road traffic accident disposal research and prevention based on big data technology can be created and constructed in cooperation with the traffic management departments of public security organs. The platform is mainly divided into the following sub-systems: real-time road condition monitoring system; traffic police mobile terminal system; real-time traffic accident broadcast and on-site disposal system; key vehicle detection system; key regional chokepoint management system; and accident black spot detection system. Use modelling and simulation experiments to test the unreasonableness of road section design and planning, and reduce road hazards through rectification. Build a cloud platform for monitoring road traffic operation data at provincial, municipal and county levels, accelerate the opening and sharing of data resources, and improve the road traffic information network.
This study was supported by The Fundamental Research Funds for the Central Universities (No: 2022RC023).
-
Dong Chunjiao is the Editorial Board member of Journal Digital Transportation and Safety. She was blinded from reviewing or making decisions on the manuscript. The article was subject to the journal’s standard procedures, with peer-review handled independently of this Editorial Board member and her research groups.
- Copyright: © 2023 by the author(s). Published by Maximum Academic Press, Fayetteville, GA. This article is an open access article distributed under Creative Commons Attribution License (CC BY 4.0), visit https://creativecommons.org/licenses/by/4.0/.
-
About this article
Cite this article
Dong C, Chang N. 2023. Overview of the identification of traffic accident-prone locations driven by big data. Digital Transportation and Safety 2(1):67−76 doi: 10.48130/DTS-2023-0006 

Overview of the identification of traffic accident-prone locations driven by big data
- Received: 03 November 2022
- Accepted: 15 March 2023
- Published online: 30 March 2023
Abstract: Effective identification of traffic accident-prone points can reduce accident risks and eliminate safety hazards. This paper first systematically compares the research in Chinese and foreign literature, and proposes three types of identification indicators, namely absolute, relative and comprehensive, according to different reference standards. According to the evaluation indicators and modelling methods, the current status of research and problems in identification theory and methods are systematically summarised in terms of mathematical statistics, cluster analysis, machine learning and conflict technology. The study shows that the foreign literature focuses on the innovation of data and indicators and changes from accident point safety management to road network safety management, while the research in Chinese literature focuses on the integration of multiple identification methods and theoretical innovation. Driven by big data, the identification of traffic accident-prone points has been further developed at the meso-micro scale. Morphological image processing methods are widely used, combined with GIS platforms, to accurately mine the spatial attributes and correlations of accidents. Also, considering the spatial and temporal distribution of accidents, the identification results are also transformed from regions to specific road sections and points to achieve more accurate identification.
-
Key words:
- Traffic safety /
- Accident-prone locations /
- Review /
- Data mining /
- Mesoscale