


-
With the continuous increase in highway mileage and vehicle ownership in China, the absolute number of highway traffic accidents exhbitis an upward trend. In the past five years, the number of casualties due to road traffic safety accidents in China has exceeded 100,000 per year, resulting in serious economic and property losses. How to ensure the driving safety of highway vehicles has become an urgent problem in need of resolution. Vehicle driving safety is divided into active safety and passive safety. Active safety refers to all safety technologies that enable the vehicle to take active measures to avoid accidents, including Anti-lock Brake System systems (ABSs), Electric Brakeforce Dis-tribution systems (EBDs), Electronic Stability Program systems (ESPs), Traction Control System systems (TCSs), etc. Passive safety refers to safety devices that can minimize personal injury after a traffic accident, including the protection of passengers and pedestrians. It requires key components such as a body frame structure that can absorb as much kinetic energy as possible in the case of collision but also prevent excessive deformation to better protect the space of passengers[1]. Guardrails are important safety protection facilities on highways. The corrugated beam guardrail is the most widely used highway guardrail. In the vehicle-guardrail collision process, the guardrail uses structural deformation to buffer and absorb energy, forcing the vehicle to change direction and restore the correct driving state, which is of great significance to reducing accident hazards and protecting the life and property of drivers and passengers. Therefore, this paper studies the problem of highway vehicle-guardrail collisions from the perspective of passive safety.
Real vehicle testing is extremely difficult to implement due to the huge costs and danger involved stemming from the need to prepare a large enough site, use experimental equipment and employ enough staff. Therefore, this paper uses finite element simulation technology and simulation software to establish a collision model between a vehicle and guardrail and simulates the collision process between a vehicle and guardrail on the highway. The research results can provide a reference for passive safety research on vehicles on highways and provide a theoretical basis for demonstrating the safety of vehicles on highways.
-
There are many research results on vehicle collision simulation at home and abroad. Zhao et al. built a vehicle-guardrail collision simulation model for a certain type of vehicle, analyzed the column trip resistance mechanism, and designed a filled column and an n-shaped curved column. The simulation verified that the two improved columns can significantly improve vehicle guardrail collision safety[2]. Zhang & Li used ANSYS workbench software to establish a finite element model of a guardrail and bus and carried out a collision simulation according to the simulation scheme. The results show that the reinforced class guardrail structure can effectively protect running vehicles[3]. Using the HyperMesh and LS-DYNA joint simulation method, Wang & Jing found that the height of the guardrail has a negative correlation with the acceleration of the vehicle’s center of gravity and the driving angle and a positive correlation with the maximum dynamic deformation[4]. Guo & Fang used the similarity principle to design a scale model test of the reconstructed column and analyzed the deformation of the guardrail and the motion state of the vehicle through a collision simulation test. The results show that when the height of the corrugated beam guardrail is reduced by more than 100 mm, passenger cars and trucks will roll over. The energy absorption rate and buffer capacity of the heightened column were better than those of the standard column. The reconstructed guardrail meets the class A corrugated beam guardrail standard[5]. Li simulated the collision process between cars or trucks and an F-shaped concrete guardrail or corrugated beam semirigid guardrail through the dynamic analysis software LS-DYNA, optimized the structural dimensions of the two guardrails, and analyzed the relationship between the collision force and the guardrail deformation sensitivity during the collision between cars and guardrails to provide a reference for real vehicle operation[6]. Song et al. studied the collision behavior between highway guardrails and vehicles, compared the collision performance of different guardrails, and found that the comprehensive performance of using two corrugated guardrails is the best, which provides important reference data for the study of the collision response between vehicles and guardrails[7]. Shi established a vehicle-occupant-guardrail collision system model with HyperMesh software and verified the effectiveness of the model through relevant collision tests. Then, the safety risk of the occupants during the collision between the car and the guardrail was evaluated and studied[8].
Ferdous et al. found that on sloping road sections, the collision height between the guardrail and vehicle is related to the running track of the vehicle and the slope size. In addition, four forms of semirigid corrugated beams are optimized, and the guardrail performance during collision is analyzed. It is found that the use of three corrugated beam guardrails is most suitable for slope sections[9]. Hou et al. established a finite element model of a vehicle and corrugated beam guardrail system. Two widely used corrugated beam semirigid guardrails are simulated, including the W-beam guardrail and rope beam guardrail. The radial basis function (RBF) is used to construct the regression model of the analysis target, which improves the fitting accuracy, and the Pareto set and optimal solution are obtained. After design optimization, the W-beam guardrail and three-wave guardrail were greatly improved, thus improving the collision safety between the corrugated beam guardrail and the vehicle body[10]. Jin based on the design principles and requirements of guardrails, designed a new type of anti-collision guardrail with better overall performance and tested the strength of the new guardrail with the finite element software ANSYS to meet the guardrail requirements[11]. Atahan et al. developed a new type of steel guardrail and completed a series of collision tests between guardrails and vehicles of different models with different weights. It was found that the change in collision performance of 10 t freight cars during the test played an important role in the analysis of the test results and provided valuable results for the revision of the EN1317 standard[12]. Gutowski et al. used numerical simulation to study the collision process between vehicles passing through an American Association of State Highway and Transportation Official curb and W-shaped steel guardrail and analyzed the maximum guardrail deflection and vehicle response based on the exit trajectory after a collision to evaluate the guardrail performance[13]. Yang et al. designed a new type of movable intermediate guardrail that overcomes the structural defects of two conventional central/intermediate guardrails composed of concrete and a W-beam. The guardrail has better collision performance and better stability after collision[14]. Gao et al. developed an elastic guardrail for high-speed railways and optimized the guardrail thickness through a multiobjective genetic algorithm. The simulation shows that the elastic guardrail has better anti-collision performance for trains[15].
In summary, the many available research results can provide rich reference experience for highway guardrail collision simulation research in this paper. On that basis, the paper simulates vehicle-guardrail collisions under different collision speeds and collision angles and compares the vehicle driving safety results under different conditions.
-
Build a guardrail-vehicle collision model in the 3D modeling software, and then use HyperMesh to carry out the pre-processing work. Preprocessing includes surface cleaning, meshing, material and attribute setting, loading, constraint setting, calculation setting, and output. The K file containing all finite element simulation information is imported into the LS-DYNA solver to obtain the finite element simulation solution. Finally, data processing and result analysis are carried out using HyperView and HyperGraph 2D software.
Establishment of the vehicle finite element model
-
There are many types of vehicles. In this paper, an ordinary car model is selected as the finite element simulation model. The finite element simulation model of the car is shown in Fig. 1. Since this experiment mainly analyzes the results generated by the collision between a vehicle and guardrail when driving on a highway, the vehicle model is relatively simplified. The main parameters of the vehicle model are as follows: the surface area of the automobile is 5.22 × 107 mm2, volume is 1.98 × 109 mm3, with an overall mass of 1.32 t. It is divided into 342 parts, 275985 units, and 283858 nodes.
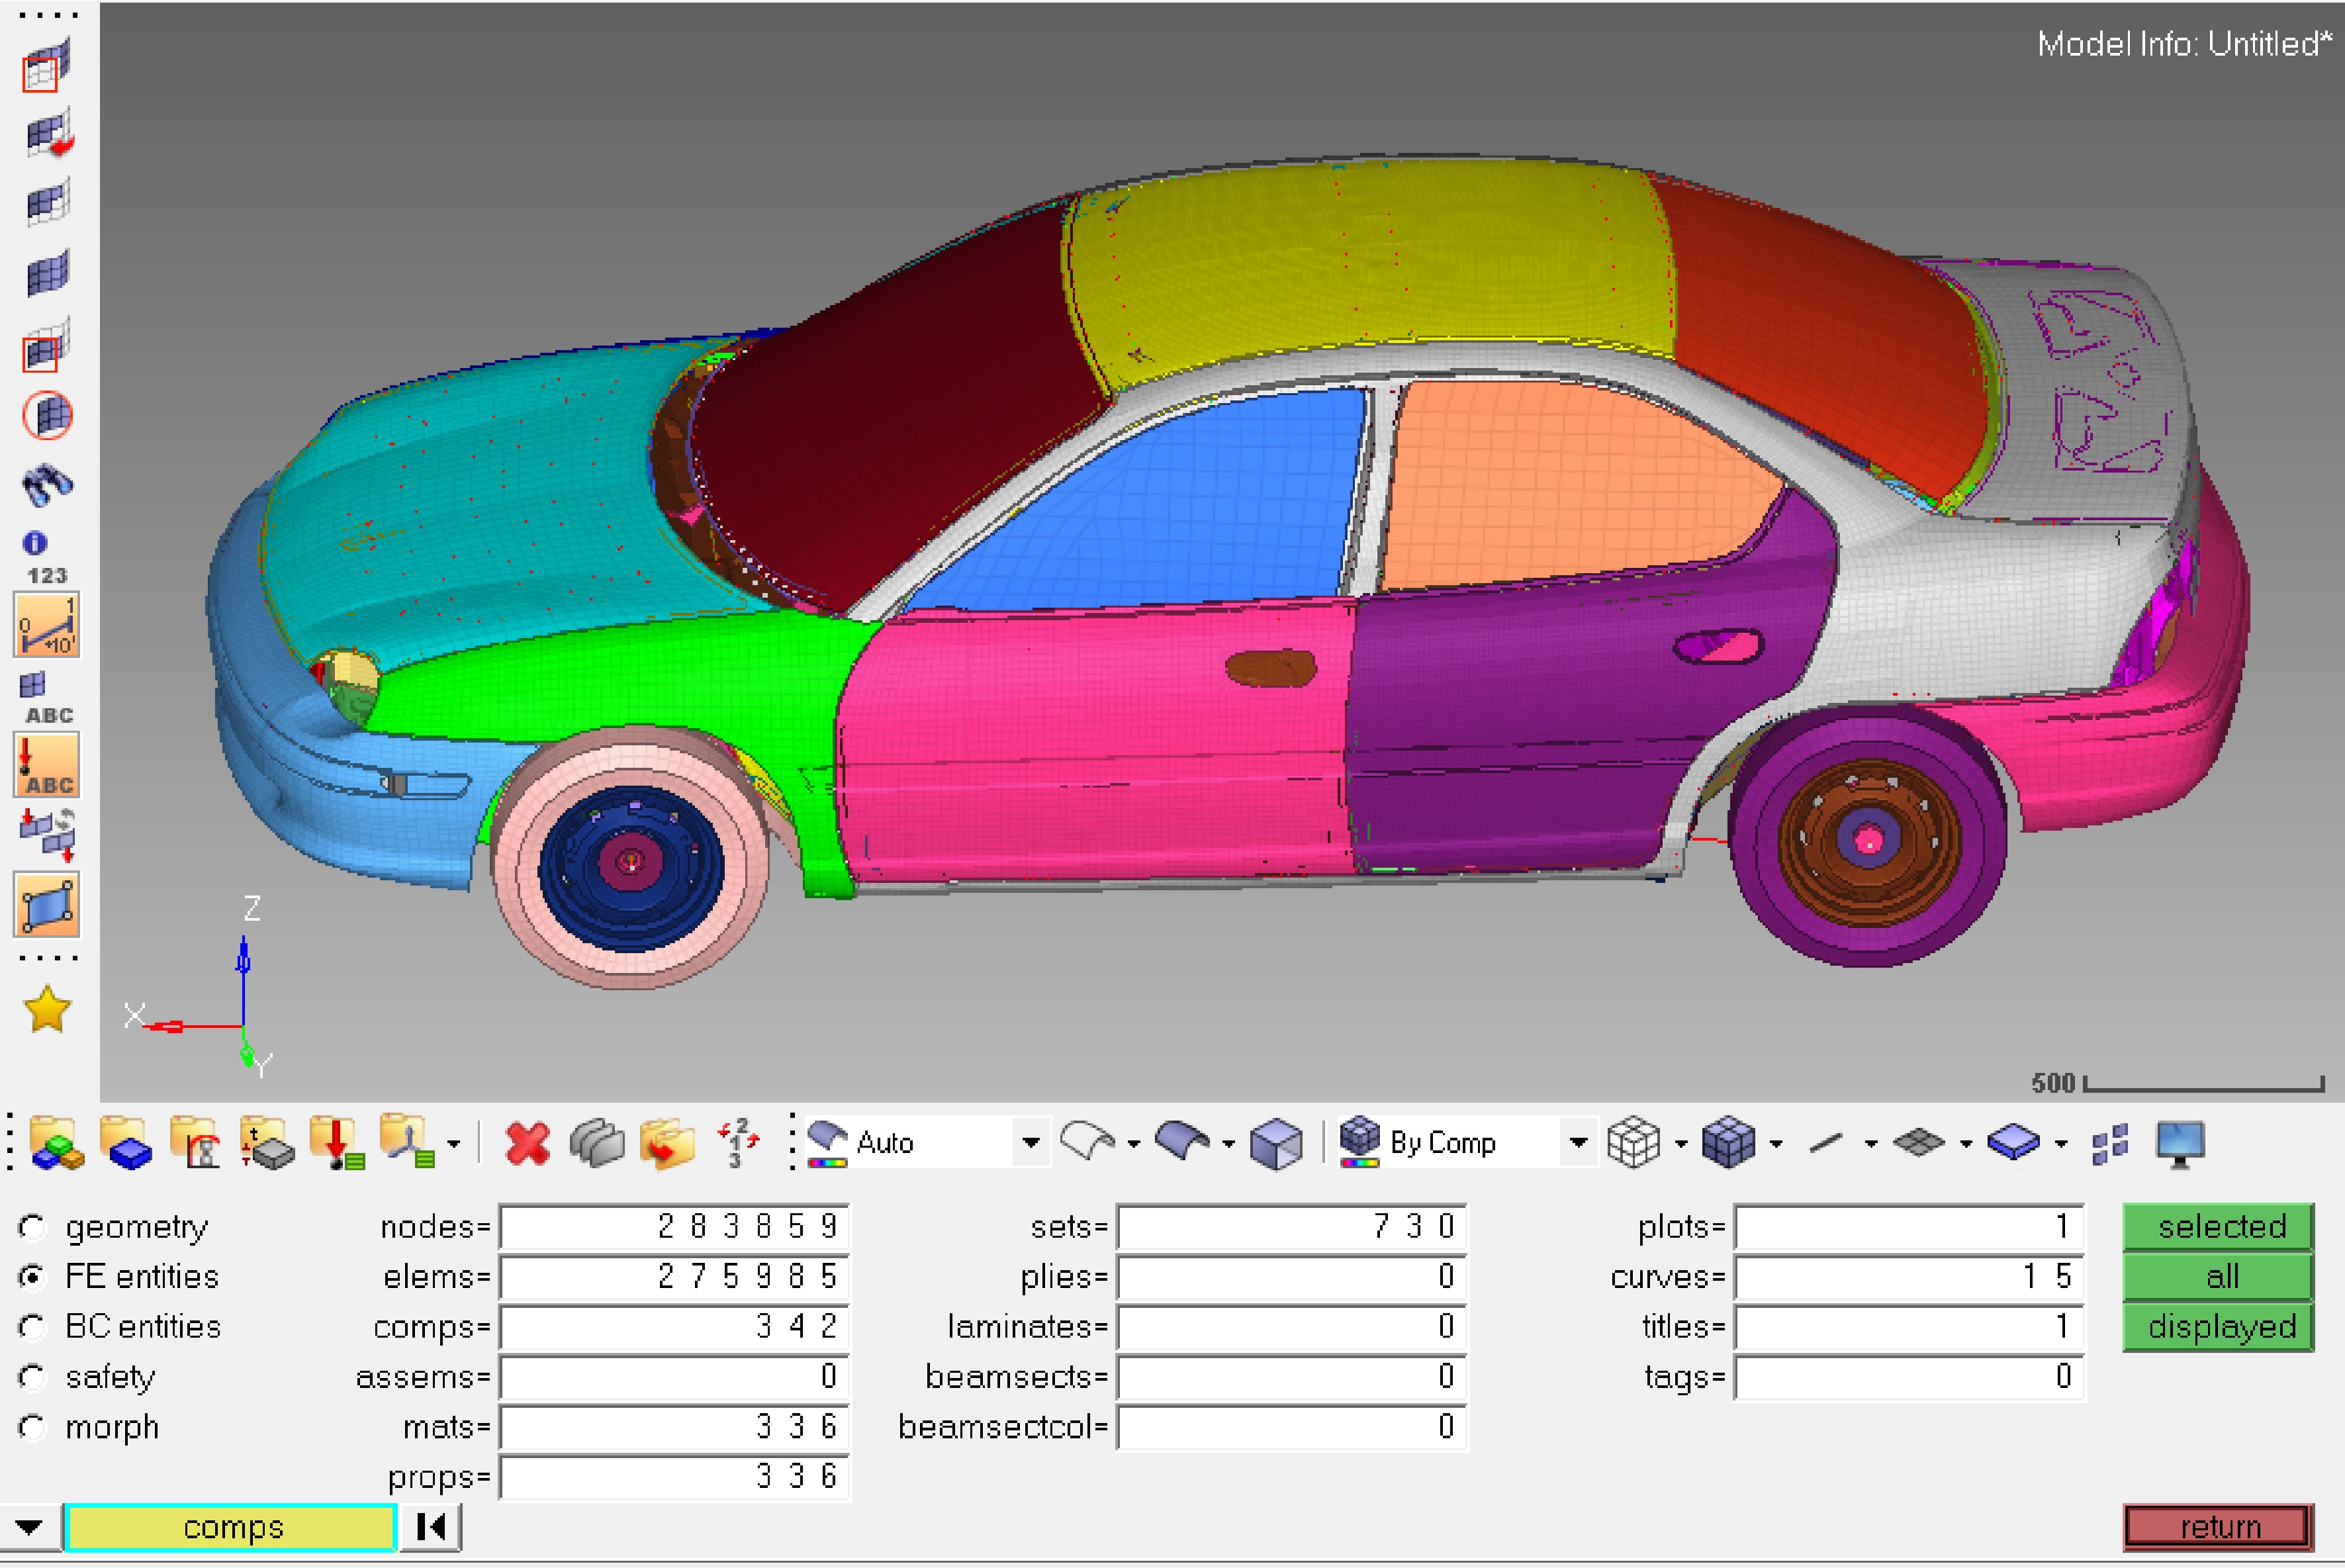
Figure 1.
The vehicle model.
Establishment of the finite element model of the guardrail
-
According to The Code For Design Of Highway Traffic Safety Facilities JTG D81-2017, class A guardrails apply to highways and class I roads. This paper studies the collision between a vehicle and a corrugated beam guardrail when driving on the highway, so this paper uses the parameters for a class A guardrail for modeling and analysis.
The modeling software UG is used to model the double wave guardrail according to the standard size. The established model includes a corrugated beam breast board, hexagonal anti-blocking block, and circular column. According to the specification, the spacing of columns is 4,000 mm, the overall column height is 2,150 mm, the thickness of columns is 4.5 mm, and there are 8,184 units in total. The anti-blocking block type adopted is an anti-blocking block with a hexagonal cross-section. The cross-section is 102 mm long, the vertical section is 178 mm, the height is 200 mm, and the thickness is 4.5 mm. There are 1,540 units in total. In the actual construction process, the breast board of the corrugated beam guardrail is imprisoned and connected by bolts, and it does not break or damage easily during the collision process. In this paper, the guardrail board is set as a whole, with a total length of 51,032 mm and a thickness of 4 mm, for a total of 21,872 units. According to the experience gained from studying traffic accidents, different collision conditions will affect the length of the guardrail above 11 spans. To truly reflect the collision state between the vehicle and the guardrail at super high speed, 11 spans are selected to model the guardrail in this paper. The parameters of the guardrail are shown in Table 1, and the simulation model of the guardrail is shown in Fig. 2.
Table 1. Guardrail parameters.
Density (t/mm3) Modulus of elasticity (MPa) Poisson's ratio Yield strength (MPa) Strain rate parameter C(l/s) Strain rate parameter P Tangent modulus (MPa) 7.89e-09 210,000 0.3 21,000 40 5 735 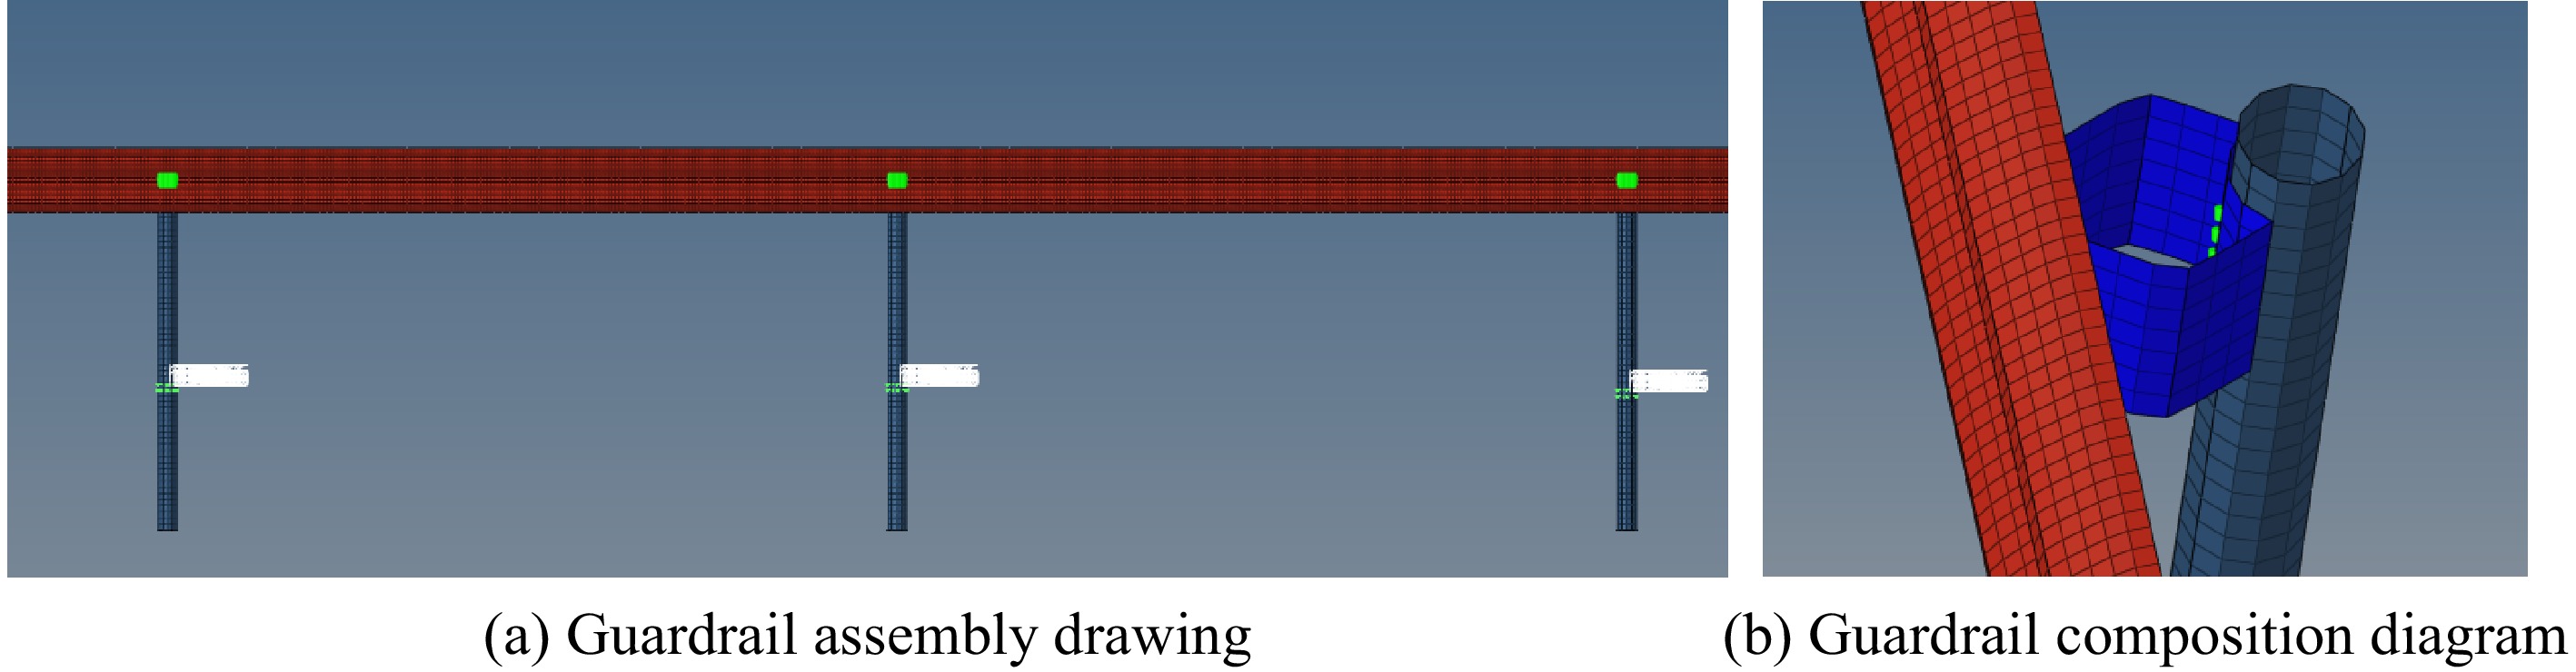
Figure 2.
Guardrail model.
Establishment of the vehicle-guardrail coupling model
-
The vehicle model and guardrail model, which were separately created in HyperMesh with mesh, materials, and attributes, are imported into HyperMesh software for assembly work at the same time, and the rigid wall with the normal direction of the Z direction is established in the assembled model as the ground. Relevant research shows that after the upper part of the column is loaded, the maximum bending moment appears at 0.4 m below the ground. The location of the maximum bending moment has nothing to do with the diameter of the column and the buried depth of the column. Therefore, in the finite element model, the full constraint of 6 degrees of freedom is established for the node of the column 400 mm below the ground[16]. In the vehicle-guardrail collision model, there are three contact types, as follows: the self-contact single-surface between the vehicle itself and the guardrail itself; surface-to-surface contact between wheel and ground; and the surface-to-surface contact between the vehicle and guardrail. In the actual construction process, the guardrail board, anti-blocking block, and column are connected by bolts. Here, the solder joint connection between a flexible body and another flexible body is used, and the established contact is the solder joint contact.
After the contact is established, the output of the output parameters is set, and it should be noted that penetration control should be carried out on the Control_Contact control card. Penetration is accompanied by contact. In this paper, the vehicle and guardrail are in face-to-face contact, and there is a great possibility of penetration occurring during a high-speed collision, so it should be controlled by setting the parameters and penalty function factors. In addition, the hourglass energy should be controlled through the CONTROL_HOURGLASS control card in the output setting. The hourglass coefficient is set to 0.10. The hourglass energy is a zero-energy model. The hourglass mode is an existing deformation mode in theory, but it cannot exist in the actual model. The zero energy mode is a pseudo deformation mode that has deformation but does not consume energy. If it is not controlled, the calculation model will become unstable, and the calculated results will be meaningless. The coupled vehicle and guardrail model is shown in Fig. 3.
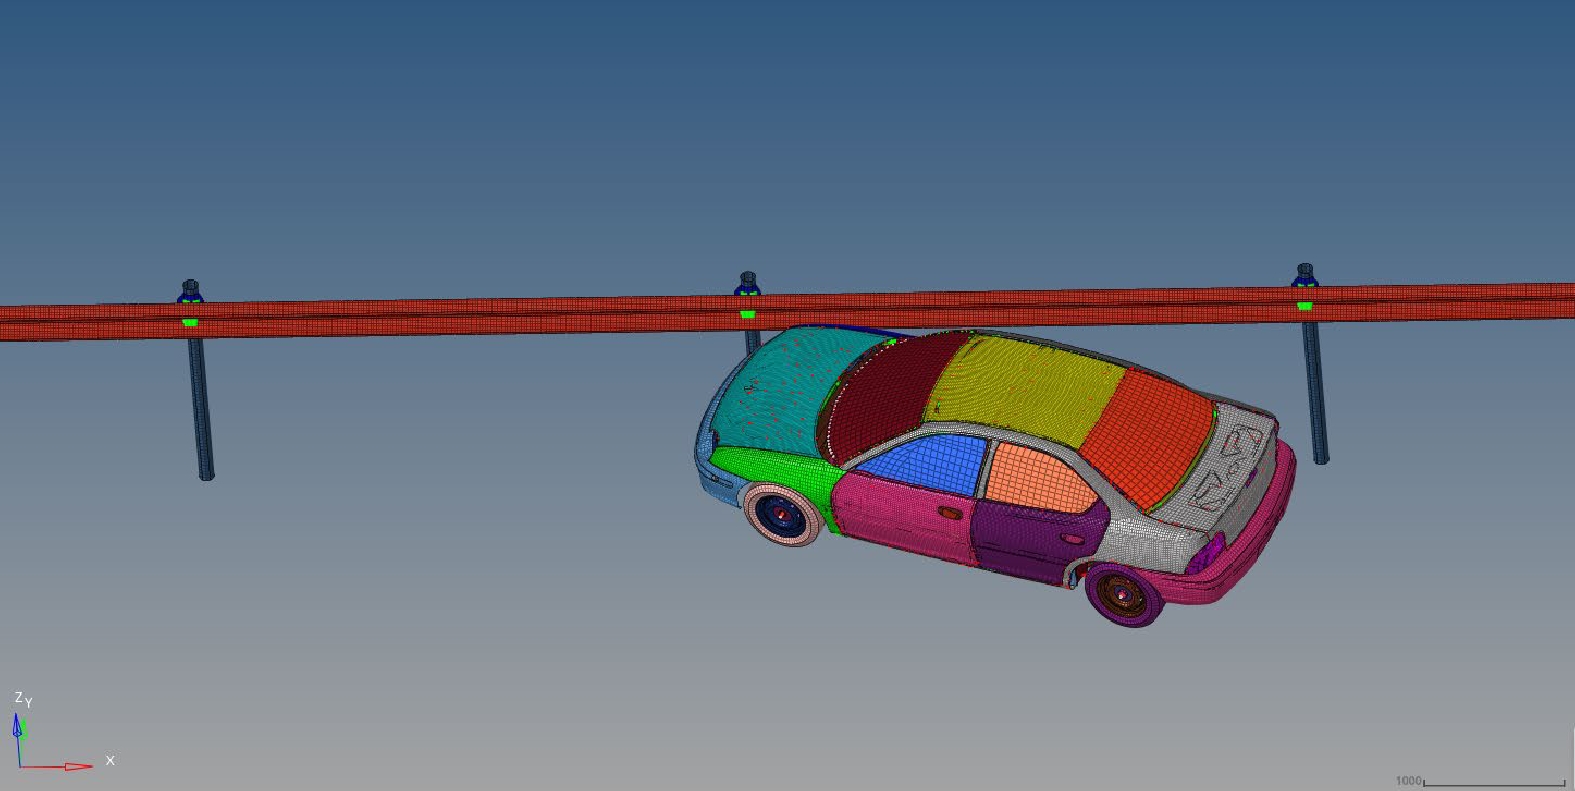
Figure 3.
Coupled vehicle-guardrail model.
Verification of the vehicle finite element model
-
There are many types of vehicle crash tests. Whether the setting of the computer simulation model is reasonable or not has a great impact on the overall simulation accuracy. Because the vehicle structure is relatively complex, it is difficult to realize the overall 1:1 simulation of the vehicle, so the computer simulation model will include a relatively simplified vehicle model. In the vehicle model computer simulation, the effectiveness of the vehicle model needs to be verified, and then the next simulation analysis is carried out. According to the provisions of the Chinese frontal collision law, the initial speed during the vehicle collision model verification is set at 50 km/h, a rigid wall is set at 20 mm in front of the vehicle, and the running time is set to 0.15 s[6]. A schematic diagram of the collision experiment is shown in Fig. 4, and the energy and speed curves for the vehicle collision verification are shown in Fig. 5.
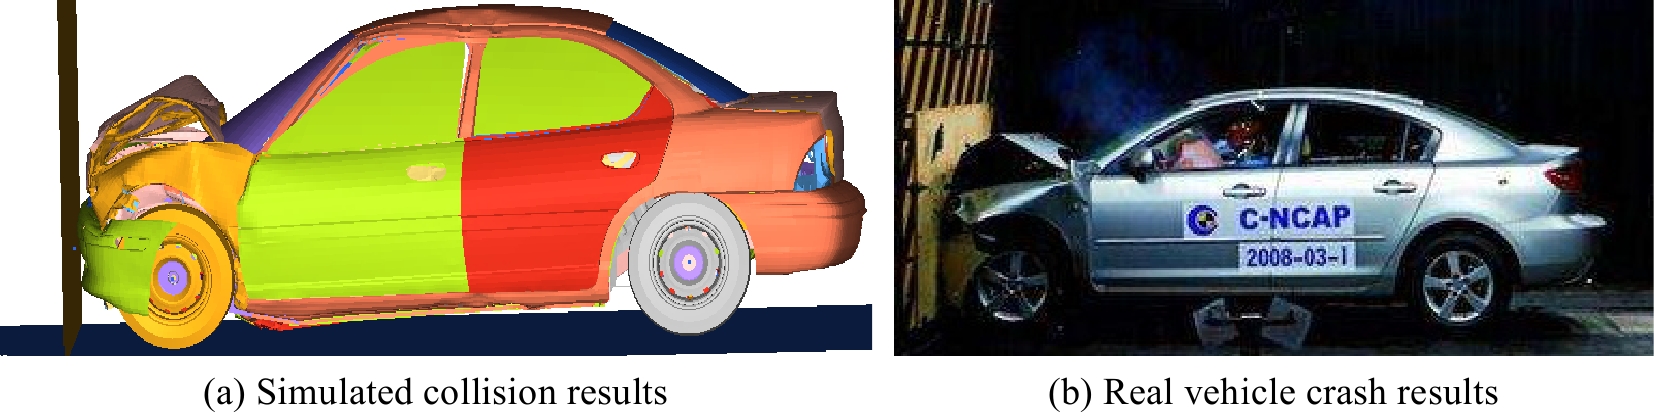
Figure 4.
Vehicle verification experiment.
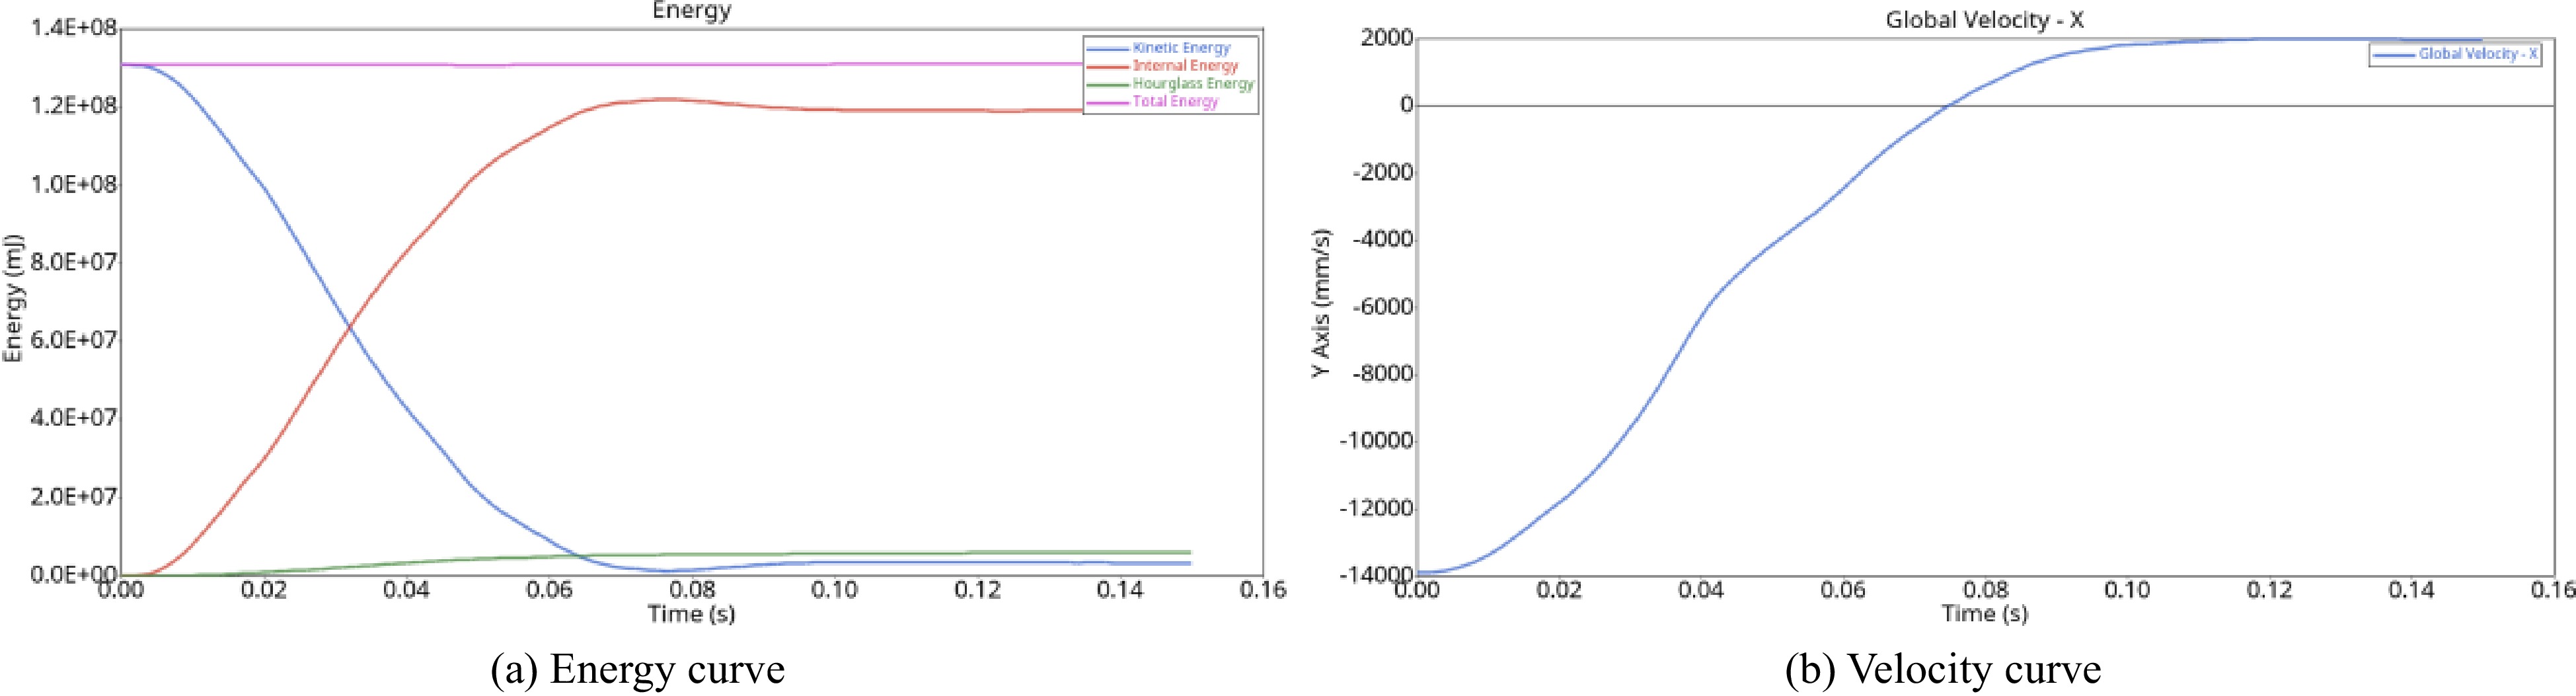
Figure 5.
The collision curve.
According to the collision results, the results of a frontal collision with a rigid wall are similar to those of a real vehicle collision test, and the deformation degree of the front bumper and that of the hood are almost the same. At the moment of collision, due to the huge impact force and the inertia of the car, the rear of the car tilted slightly, and the deformation was the most serious. At the moment of collision, the vehicle rebounded due to the reaction force of the collision between the vehicle and the wall. At this time, corresponding to the phenomenon that the speed in the speed curve in Fig. 5b changed from negative to positive, the direction changed while the speed decreased. As the energy curve in Fig. 5a shows, during the vehicle collision process, the speed decreases and the kinetic energy decreases. Due to the corresponding increase in internal energy generated by collision, the proportion of hourglass energy is less than 5%. Therefore, the effectiveness of the vehicle model has been verified.
-
The post-processing software HyperView is used to extract the simulation results of the vehicle colliding with the guardrail at a collision speed of 60 km/h and collision angles of 5°, 10°, 15°, and 20°, as shown in Fig. 6.
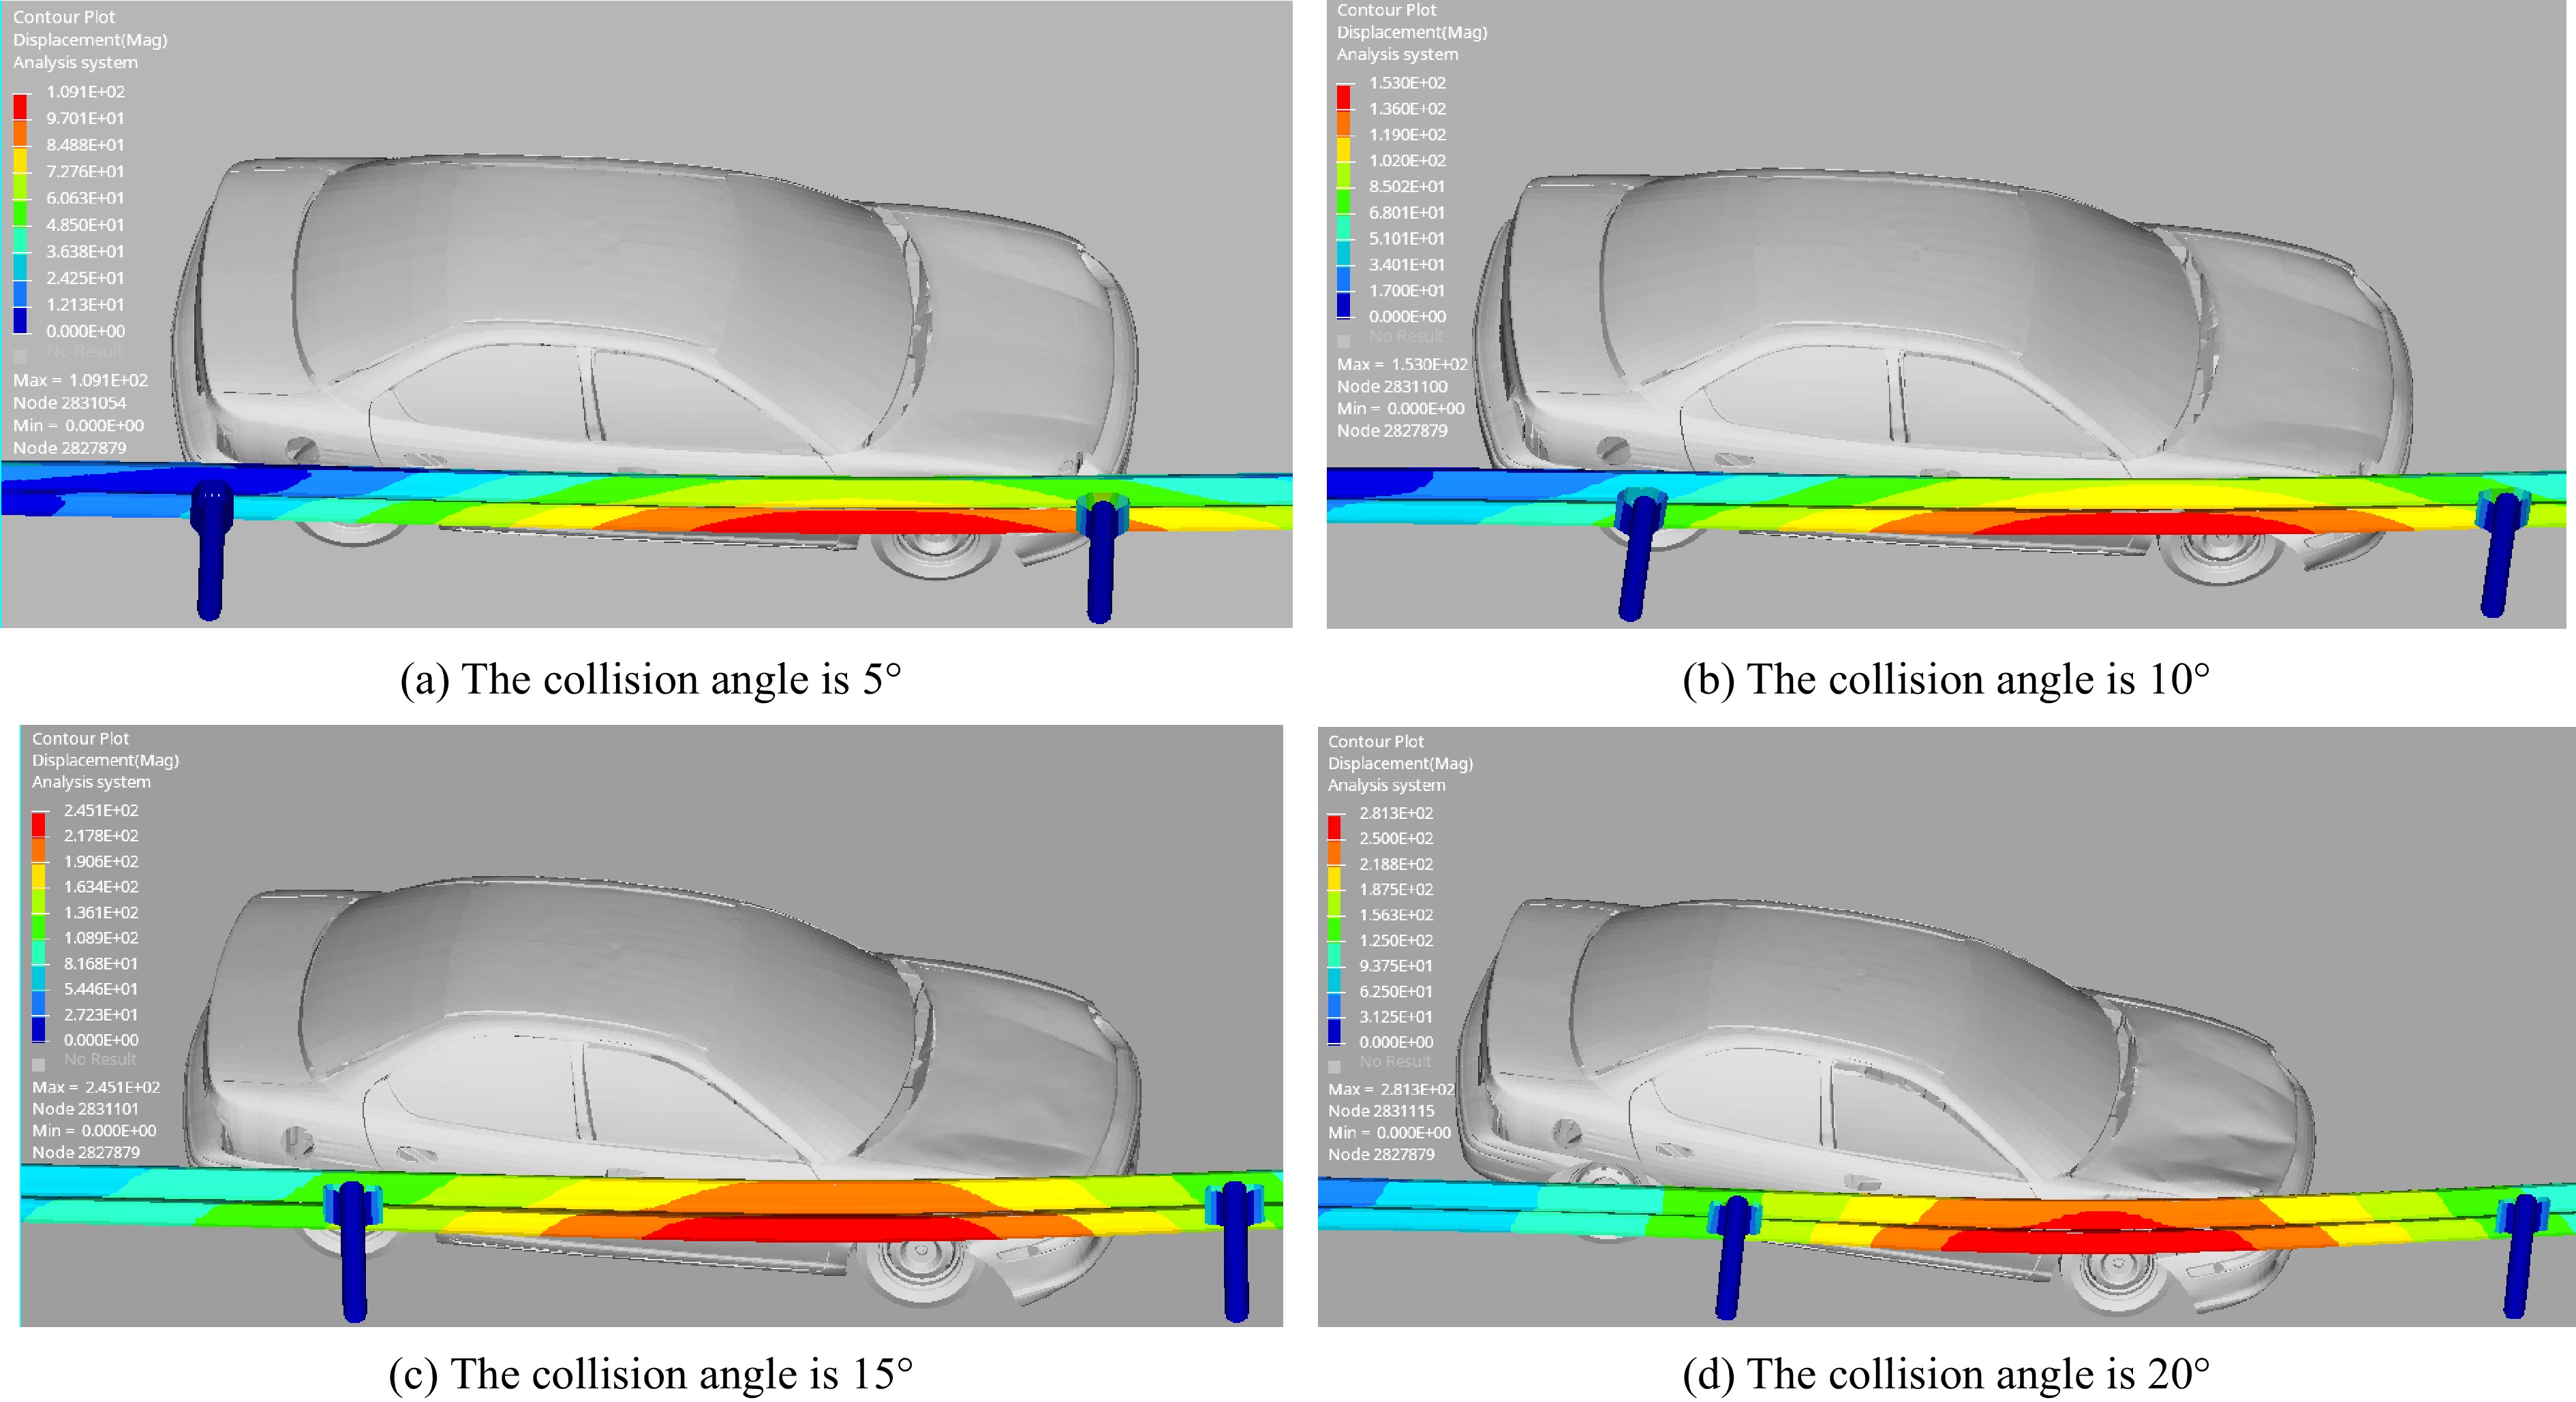
Figure 6.
Deformation of the guardrail at different collision angles (60 km/h).
When the vehicle is travelling at 60 km/h and collides with the guardrail at different angles, the guardrail maintains good integrity. The red part in Fig. 6 shows that the maximum lateral displacement of the guardrail occurs between two adjacent columns of the guardrail. When the collision angle is 5°, only one anti-blocking block is slightly deformed to ensure the safe driving of the vehicle away from the guardrail. When the collision angle is 10°, 15°, and 20°, the adjacent two anti-blocking blocks are deformed in the process of a vehicle colliding with the guardrail. With the increase in the collision angle, the lateral displacement of the guardrail increases, and the deformation of the anti-blocking block becomes increasingly serious, but the column does not produce lateral displacement. When the collision angle is 20°, the left front hood and door of the car are slightly deformed, which will not pose a threat to the passengers. Throughout the collision process, the vehicle did not trip or ride over the guardrail, the vehicle deformation was small, and the guardrail was able to provide good protection performance and guidance performance.
The maximum dynamic lateral displacement of the guardrail is an important index for evaluating the protective performance of the guardrail. Figure 7 shows that when the collision angle is 5°, the displacement begins to increase significantly at 0.13 s at the beginning of the collision and the maximum displacement of the guardrail (109.1 mm) occurs at 0.25 s. When the collision angle is 10°, the lateral displacement of the guardrail begins to increase significantly at 0.05 s and gradually decreases after reaching the maximum value of 153.0 mm at 0.2 s. When the collision angle is 15°, the lateral displacement of the guardrail increases rapidly. When the collision time reaches 0.03 s and reaches the maximum value of 245.1 mm at 0.2 s. As the vehicle speed and steering behavior decrease, the displacement of the guardrail begins to decrease. When the collision angle is 20°, the displacement of the guardrail begins to increase to 0.18 s before 0.03 s, reaches the maximum value of 281.3 mm, and then begins to decrease. When the vehicle’s speed is 60 km/h and collides with the guardrail at different angles, the maximum lateral displacement of the guardrail begins to increase, the time becomes earlier and earlier with the increase in the angle, and the maximum lateral displacement of the guardrail increases with the increase in the collision angle, but the safety standards are still met at all angles.
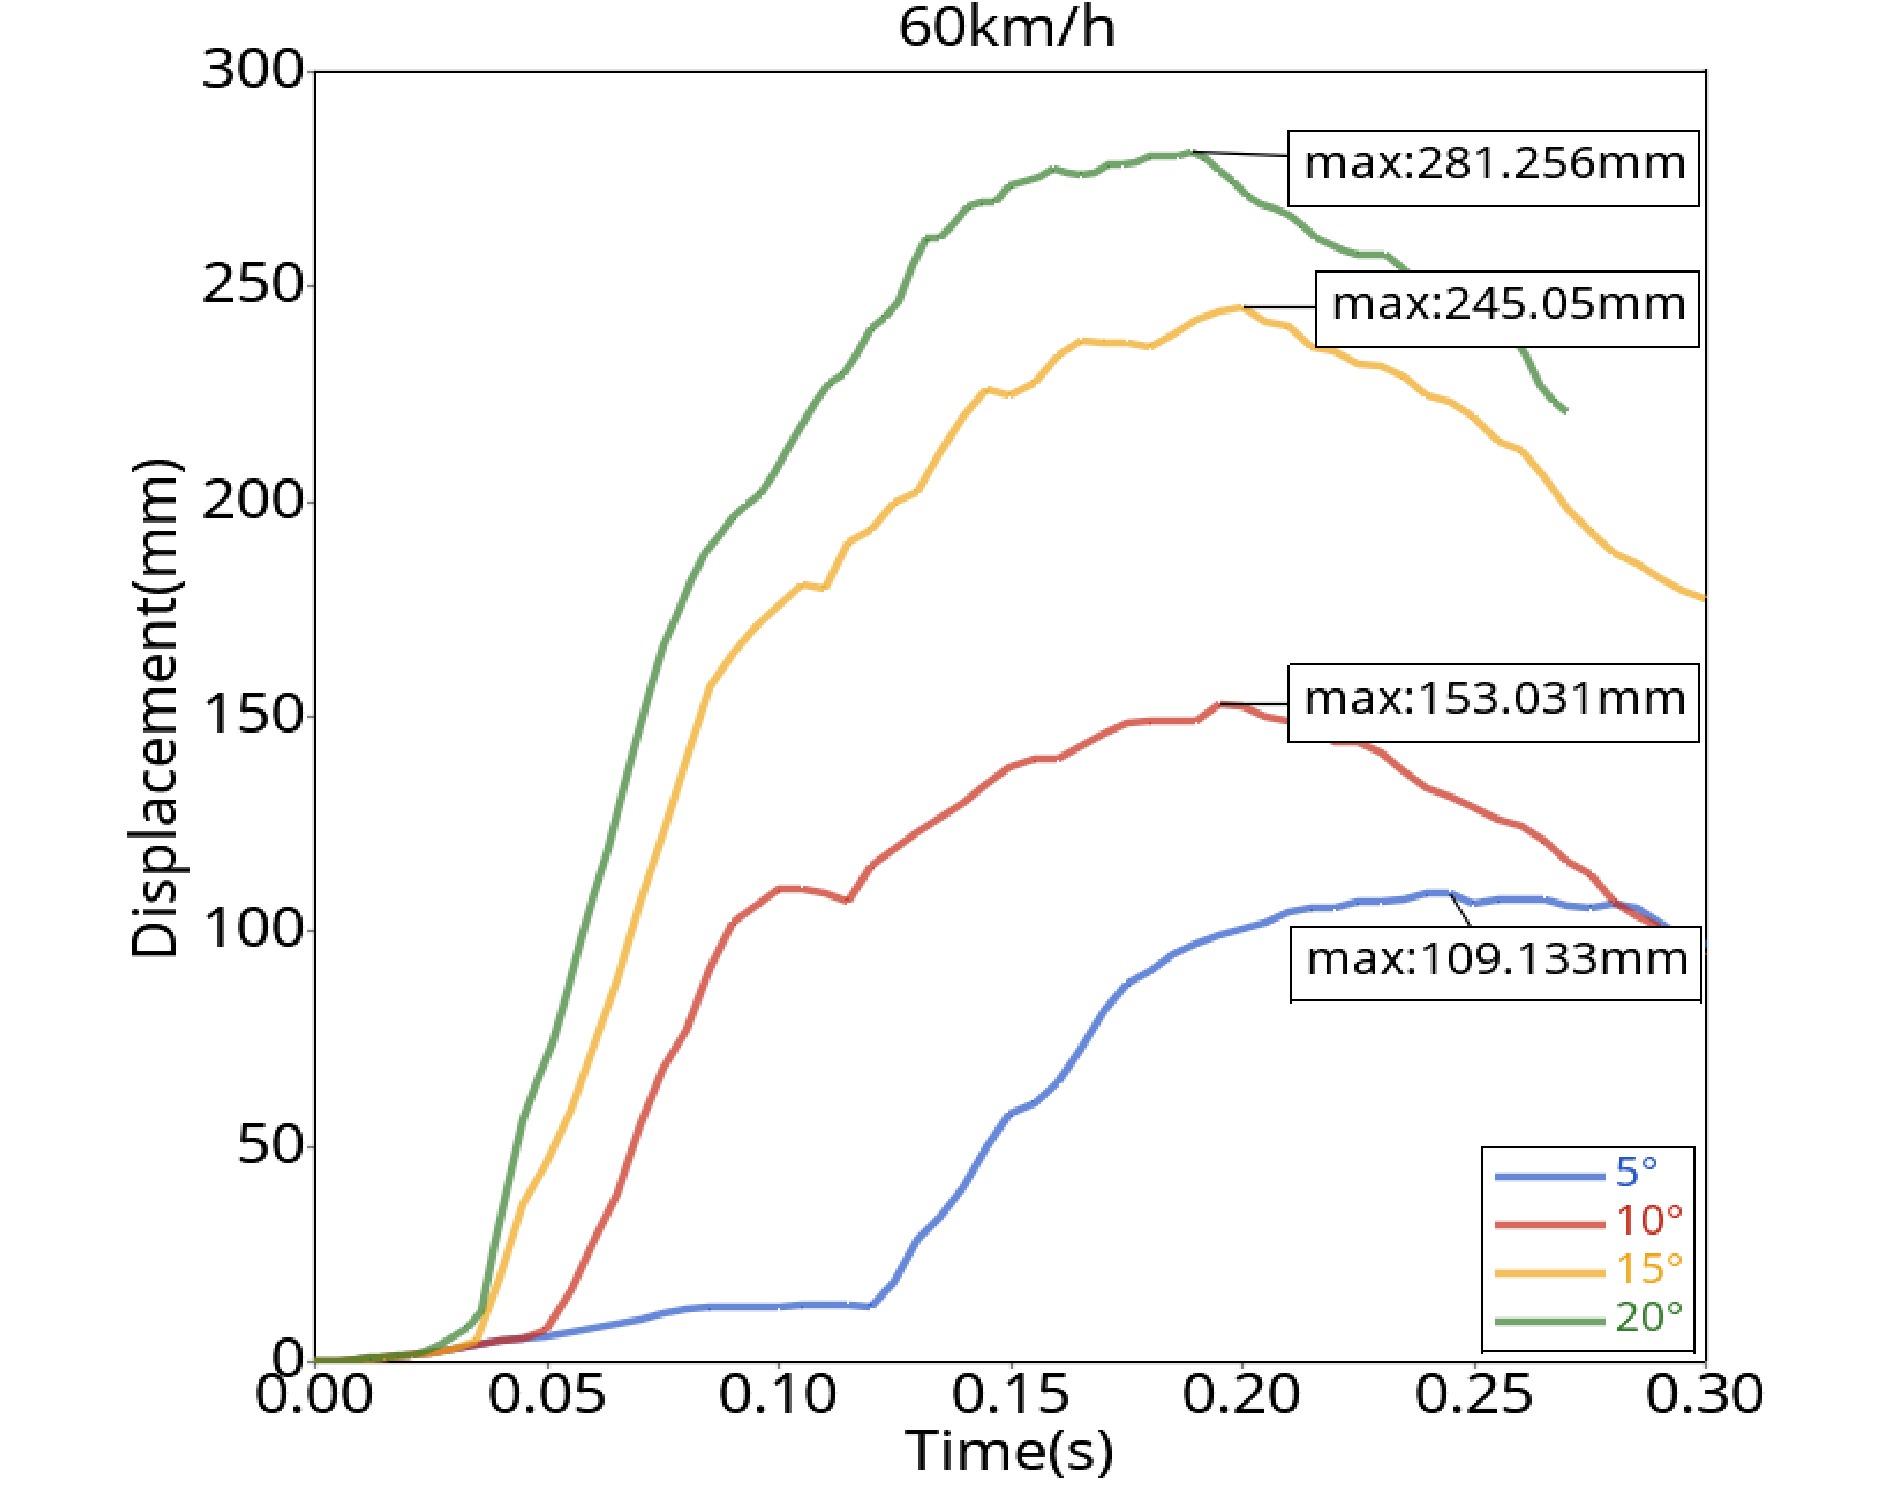
Figure 7.
Guardrail displacement curve (60 km/h).
Simulation analysis of collision at a speed of 80 km/h
-
The D3plot file in the simulation results was imported into HyperView software, and the displacement cloud diagram of guardrail deformation is obtained after processing. In the cloud diagram, the deformation when the car collides with the guardrail at a speed of 80 km/h at different collision angles can be observed, as shown in Fig. 8.
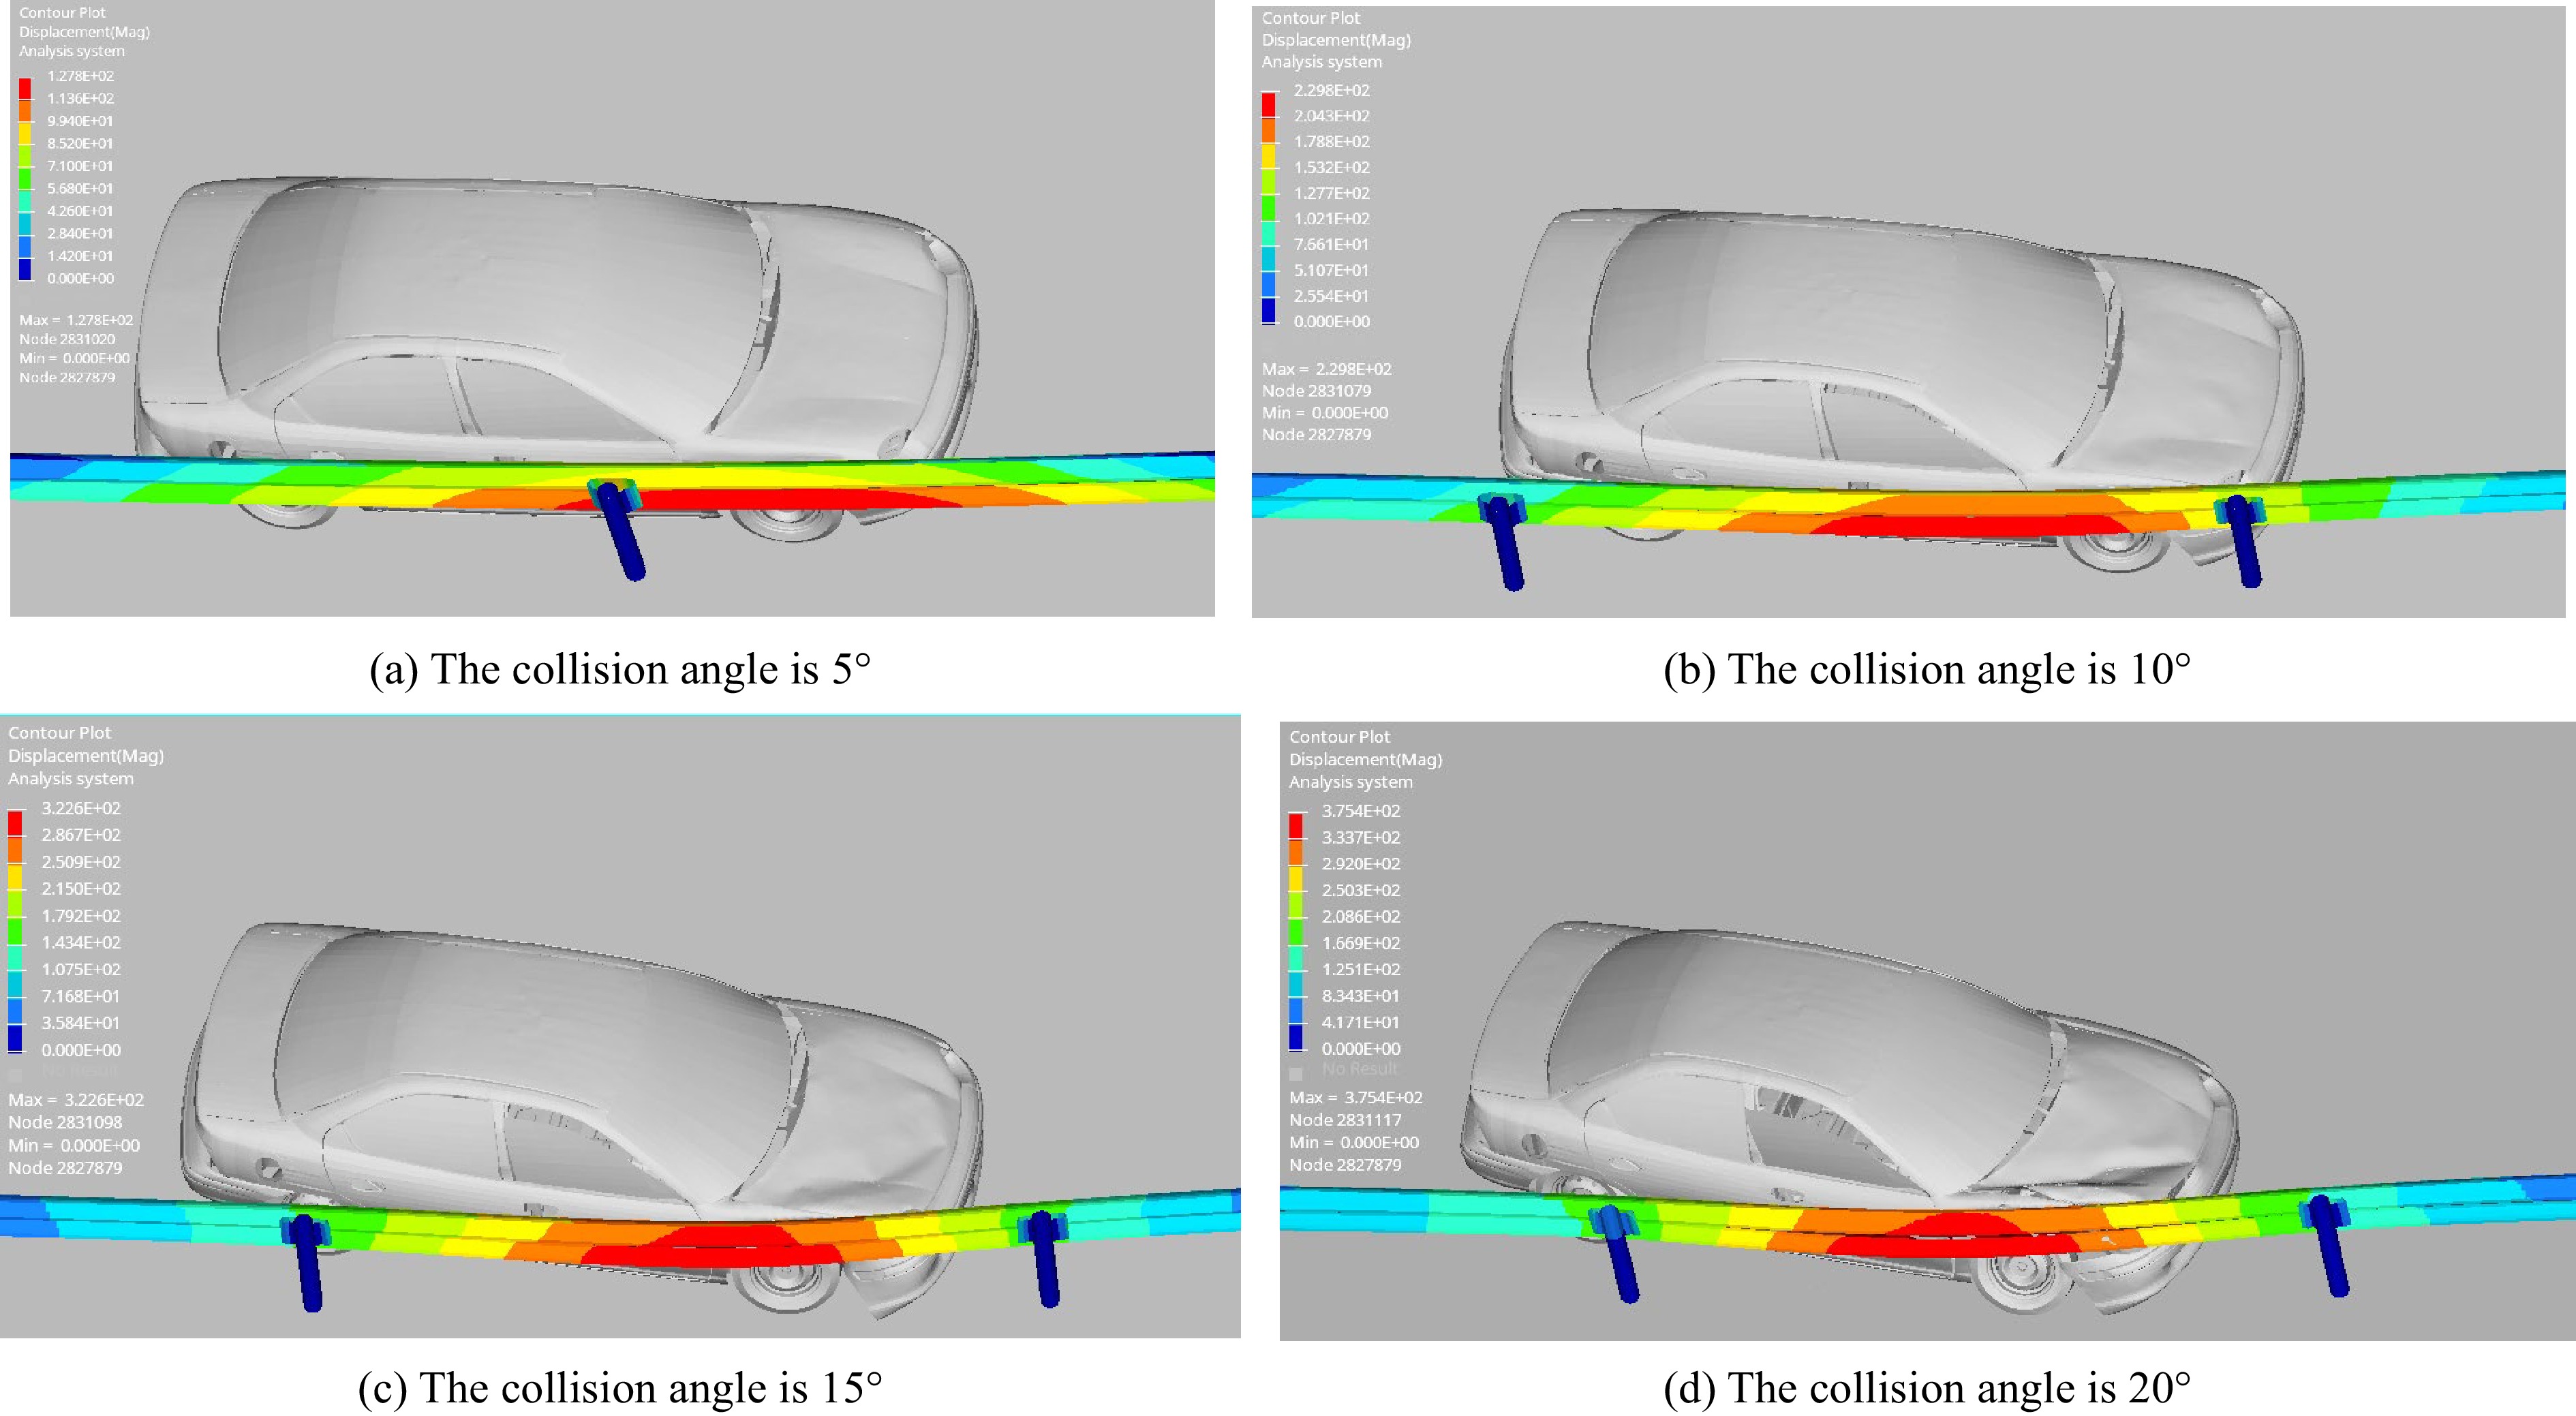
Figure 8.
Deformation of the guardrail at different collision angles (80 km/h).
Figure 8 shows that when the vehicle collides with the guardrail, the point of maximum displacement is advanced with an increasing collision angle. When the collision angle is 5°, an anti-blocking block is squeezed and deformed, the column is not bent, and the left body of the vehicle is scratched while the guardrail shows no obvious deformation. When the collision angle is 10°, the anti-blocking blocks on the two adjacent vertical columns are squeezed and deformed, the columns are not bent, the left front of the vehicle is slightly deformed, and the front passenger door is slightly deformed. When the collision angle is 15°, the two adjacent anti-blocking blocks are flattened, the column is not affected, and the front bumper and bonnet of the vehicle are deformed. When the collision angle is 20°, the maximum lateral displacement of the guardrail occurs in the middle of the two columns. The first column has a slight lateral bend, the left headlamp and bumper of the vehicle are damaged, and the bonnet and codriver door are warped and deformed. When the vehicle collides with the guardrail at 80 km/h, although the guardrail has different degrees of deformation, the guiding function after the collision is achieved, and there is little threat to the safety of passengers.
The process of guardrail displacement is obtained through simulation, and the generated time history curve is shown in Fig. 9.
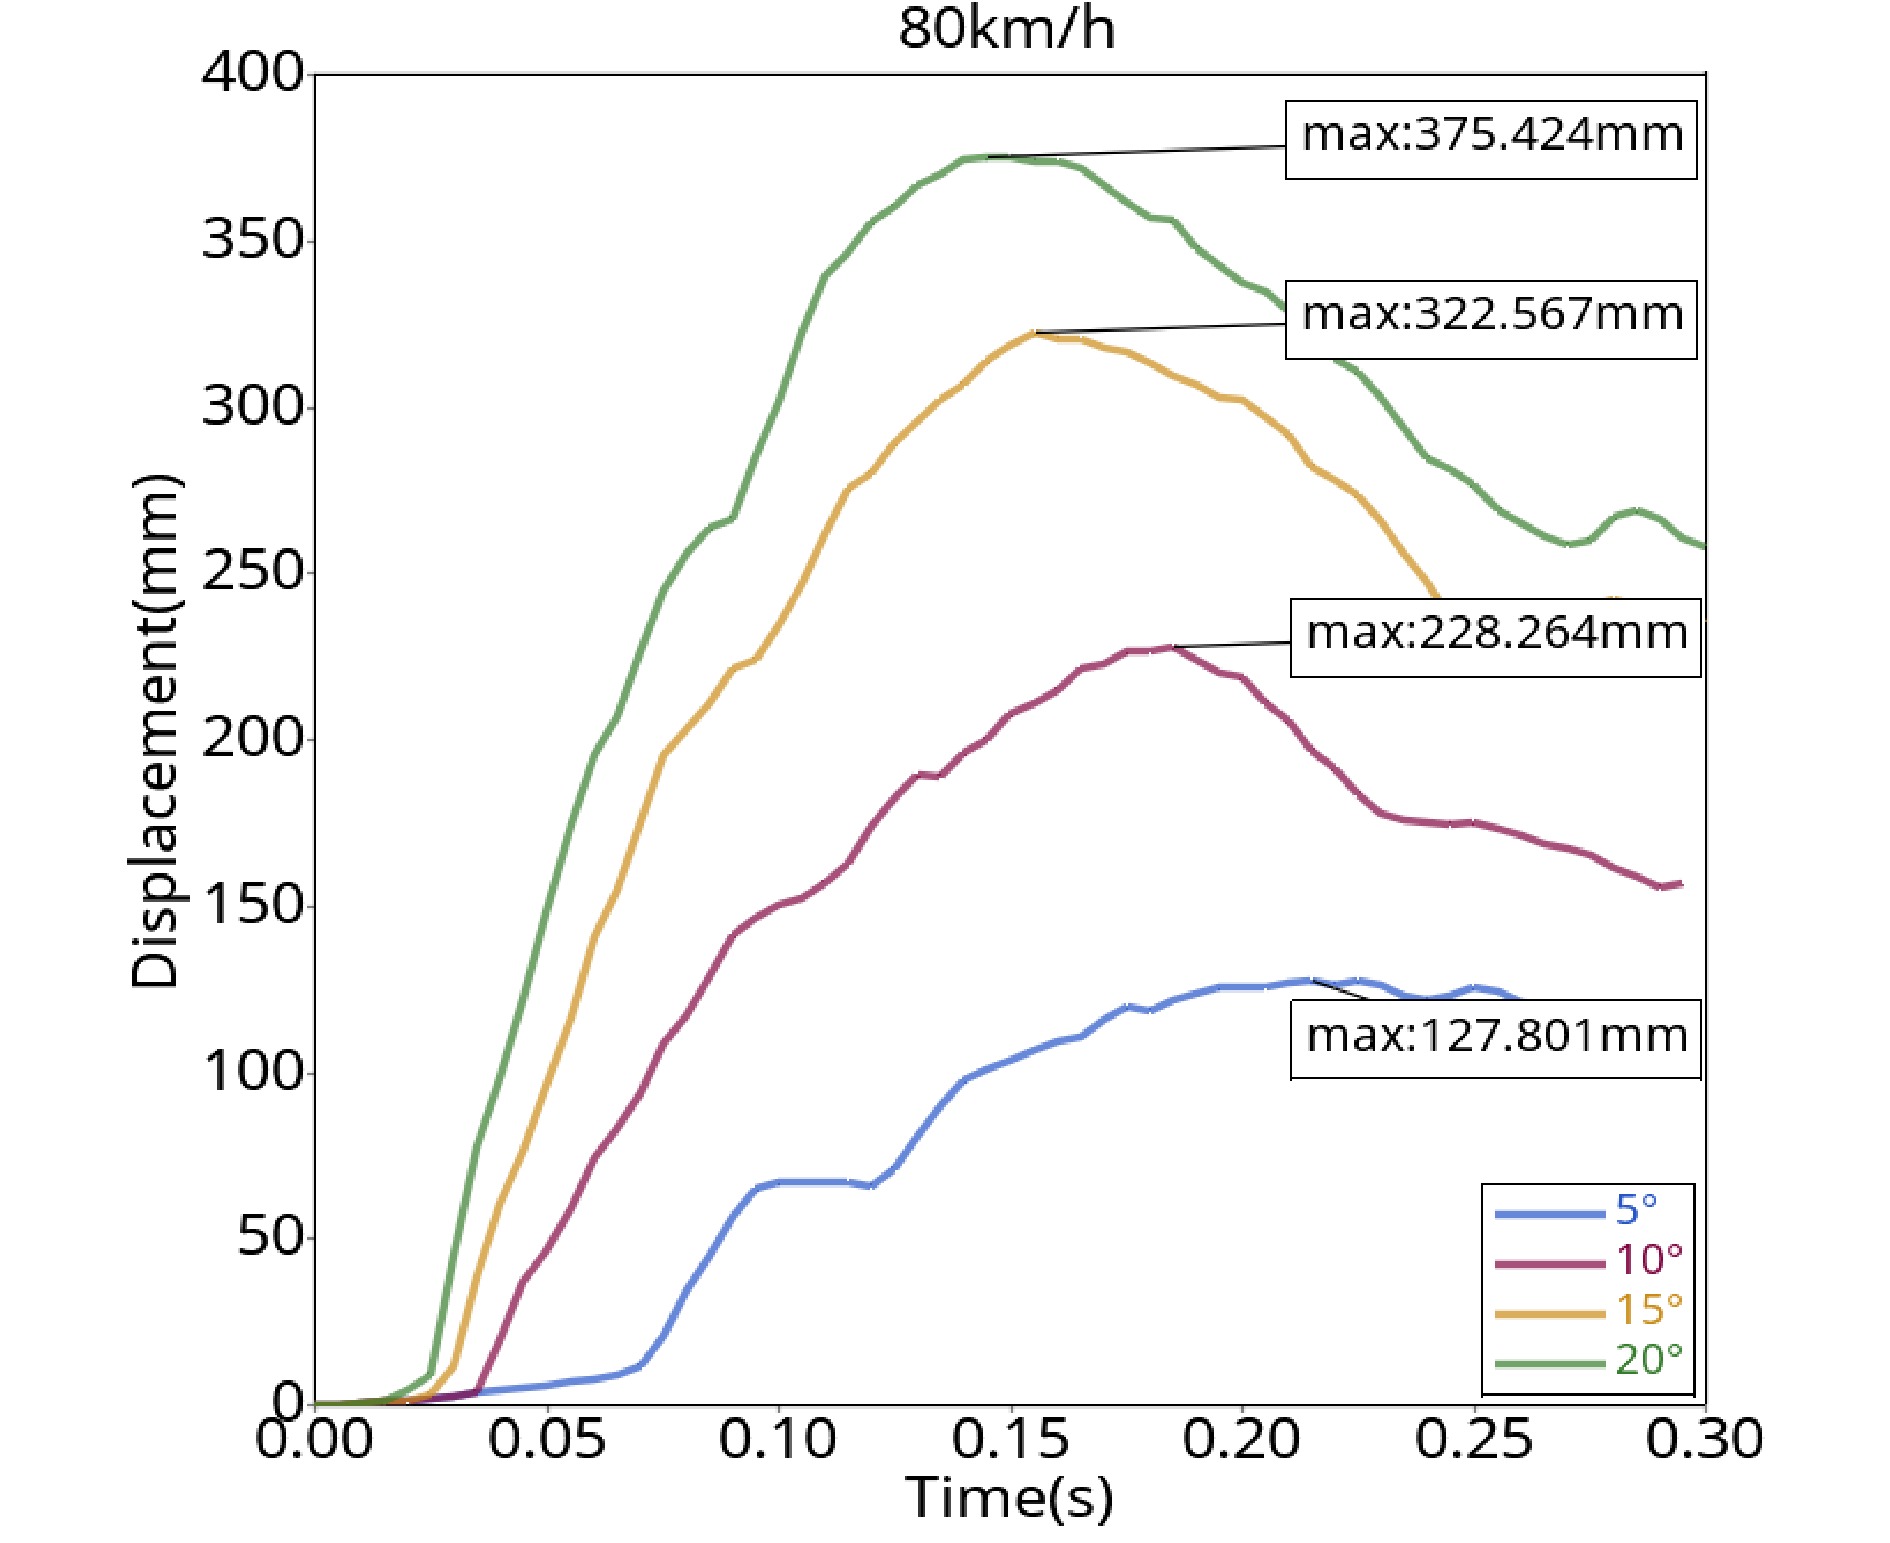
Figure 9.
Guardrail displacement curve (80 km/h).
As shown in Fig. 9, when the vehicle is traveling at a speed of 80 km/h, the maximum lateral displacement of the guardrail increases with increasing collision angle, and the time point of the maximum displacement gradually advances. When the initial impact angle is 5°, the maximum displacement (127.8 mm) occurs at 0.22 s. When the collision angle is 10°, the maximum displacement (229.8 mm) occurs at 0.17 s. When the collision angle is 15°, the maximum lateral displacement (322.6 mm) occurs at 0.16 s. When the collision angle is 20°, the maximum transverse displacement of the guardrail is 375.4 mm, which occurs in 0.14 s. After the vehicle collides with the guardrail, the guiding function of the guardrail causes the vehicle to turn and drive away from the guardrail. At this time, the lateral displacement of the guardrail board decreases gradually.
Simulation analysis of collision at a speed of 100 km/h
-
The D3plot file of the simulation results with a collision speed of 100 km/h was imported into HyperView software, the components corresponding to the guardrail in the contour state are selected, and the displacement cloud diagram of guardrail deformation is generated. The collision between the vehicle and guardrail under different collision angles is shown in Fig. 10.
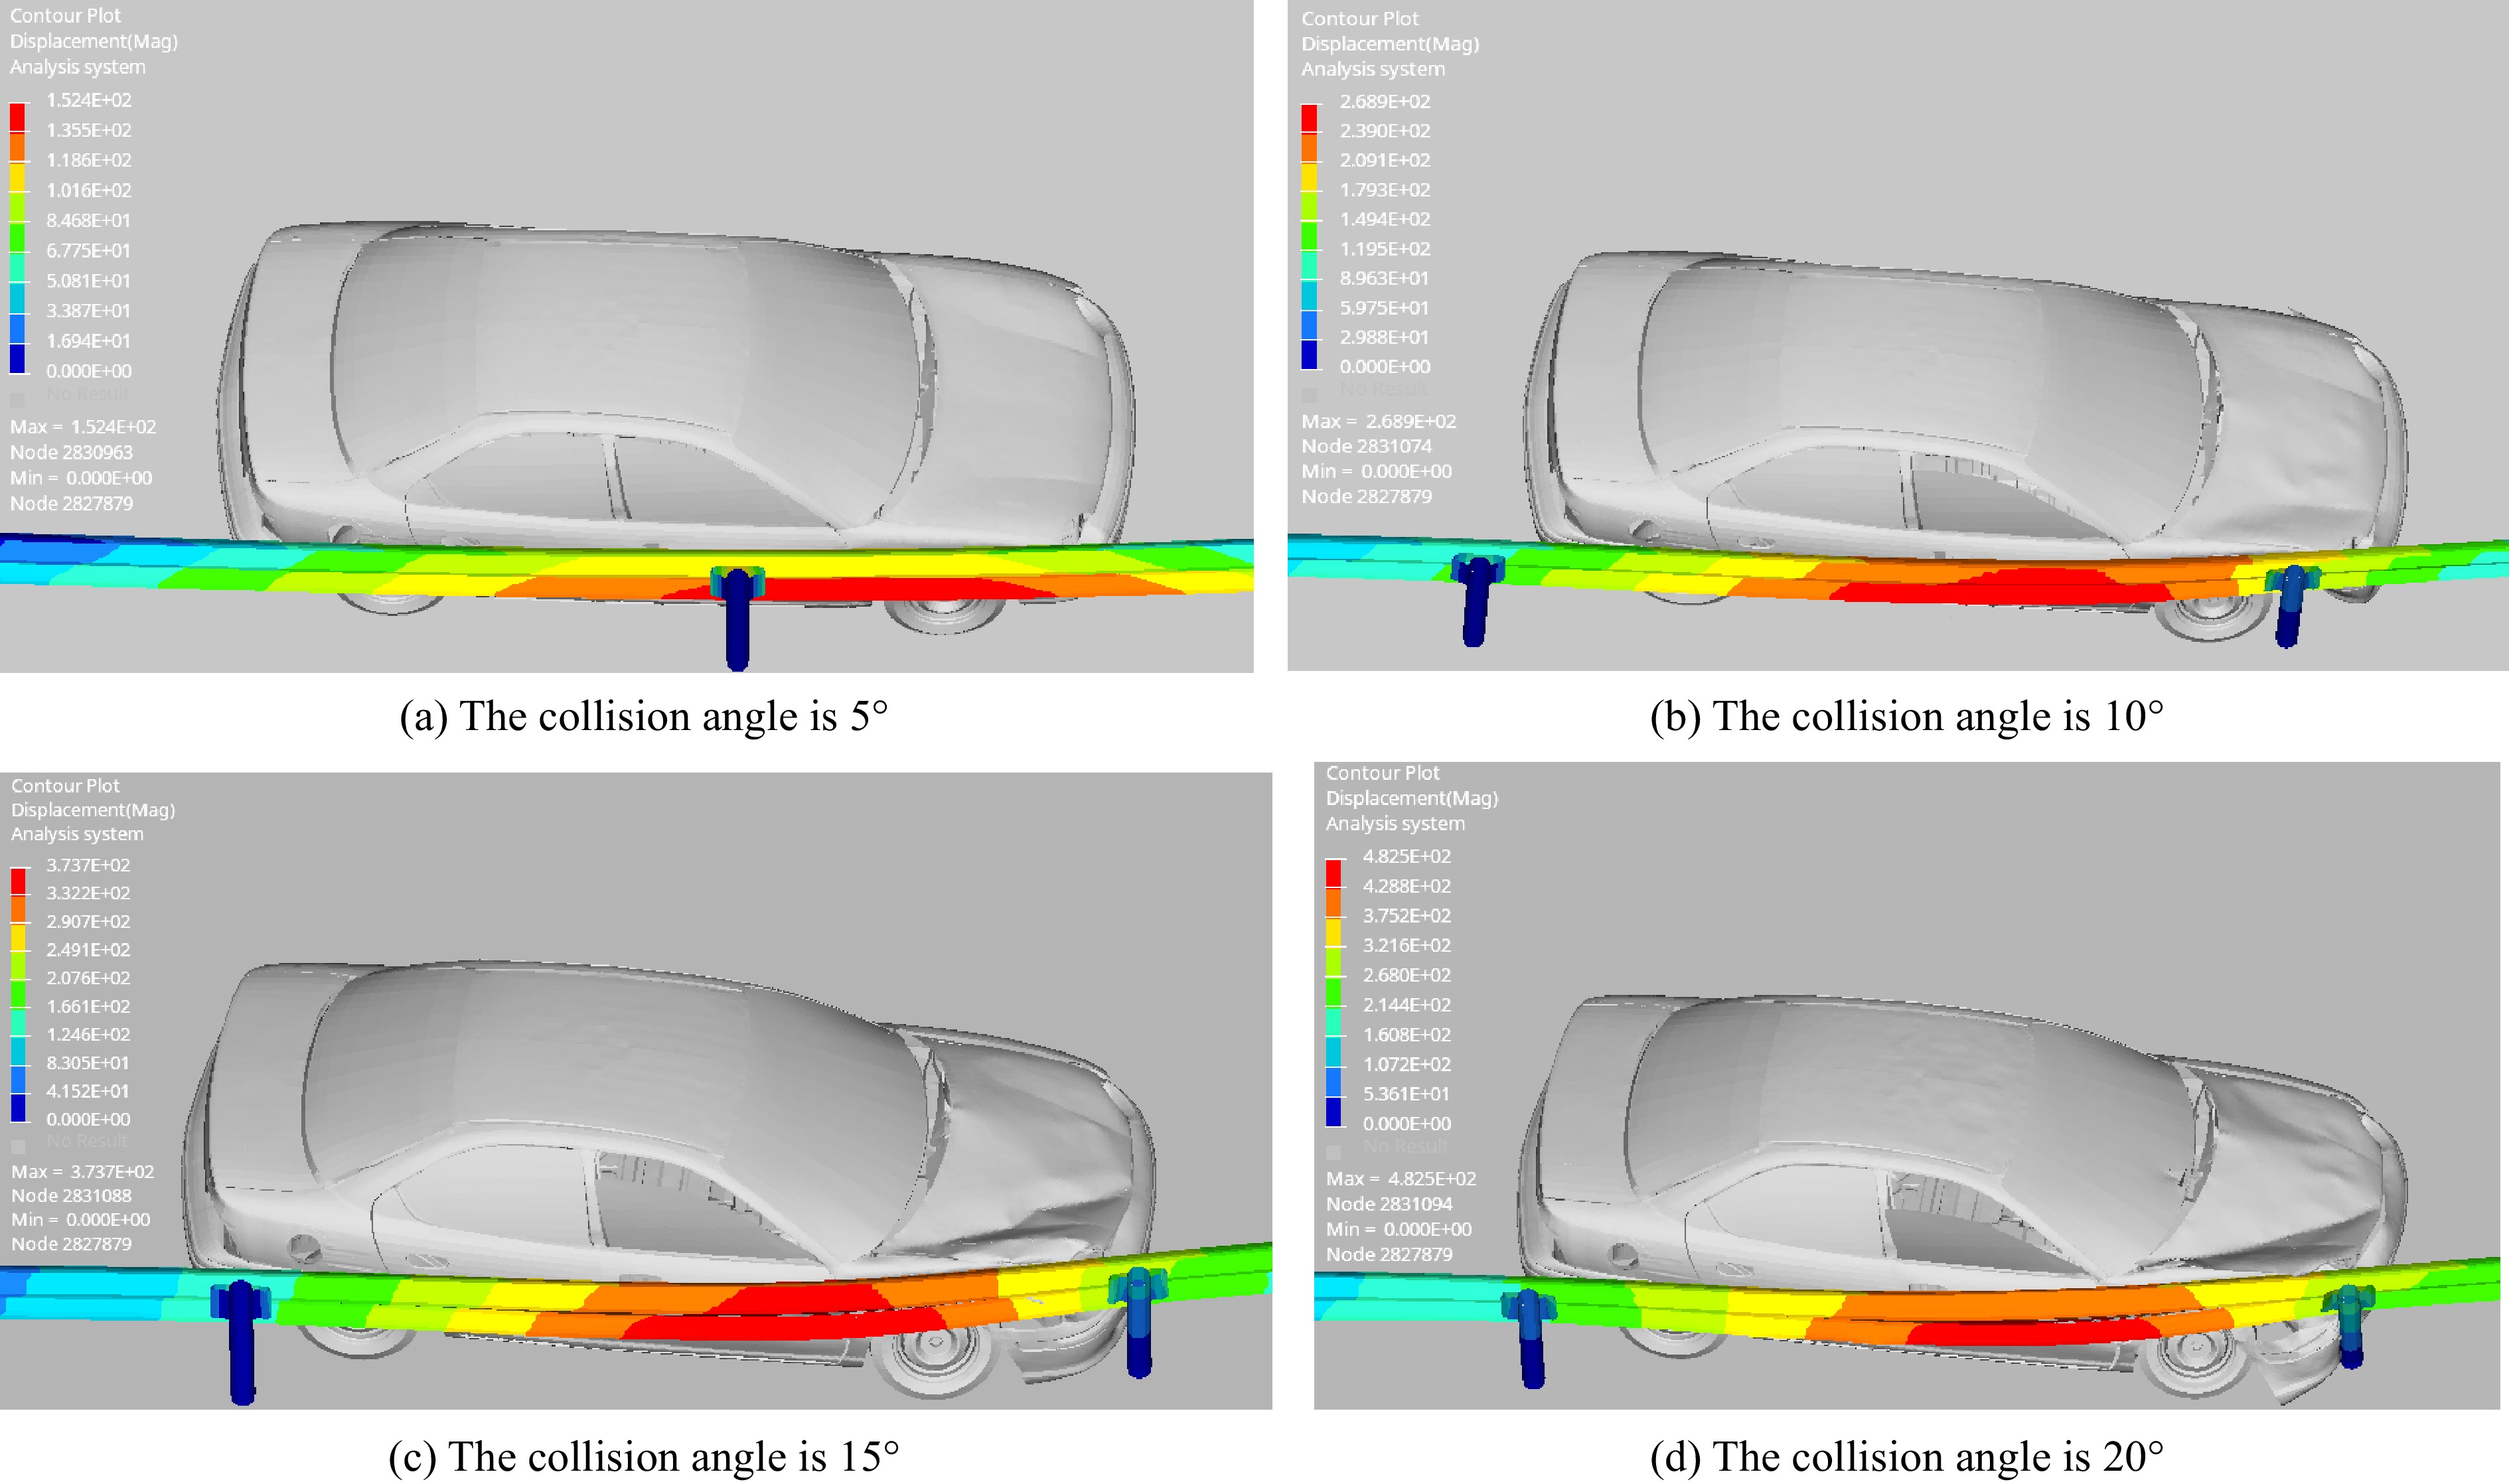
Figure 10.
Deformation of the guardrail impacted at different angles (100 km/h).
Figure 10 shows that when the vehicle collides with the guardrail at a collision angle of 5°, the vehicle and the guardrail remain parallel, and the side of the vehicle rubs against the guardrail without obvious deformation. One anti-blocking block of the guardrail is flattened, and the other anti-blocking block is also squeezed when the vehicle leaves the guardrail. The maximum displacement of the guardrail is 152.4 mm, which appears near the anti-blocking block with serious deformation. When the collision angle is 10°, the upper part of the left front wheel and the front passenger door of the car are slightly deformed, and the two adjacent anti-blocking blocks are almost flattened. The maximum displacement of the guardrail is 268.9 mm, which is near the anti-blocking block with serious deformation. Three breast-board sections are affected in the overall collision process. When the collision angle is 15°, the vehicle is damaged, and the three adjacent anti-blocking blocks are extruded and deformed. The middle anti-blocking block is seriously deformed, and the column begins to show lateral side bending. When the collision angle is 20°, the front bumper becomes disconnected, the bonnet and the left front door are severely crushed and deformed, and the three adjacent anti-blocking blocks are crushed and deformed. The columns connected by the two anti-blocking blocks are slightly bent. During the collision, the left front wheel drove past the column at the side bend, completing the process of driving away from the guardrail. In the process of a four-angle collision, the guardrail plays a guiding role, making the car turn and drive away from the guardrail.
After importing the D3plot file of the simulation results into the post-processing software HyperView, combined with HyperGraph 2D, the guardrail displacement time history curve is obtained, as shown in Fig. 11.
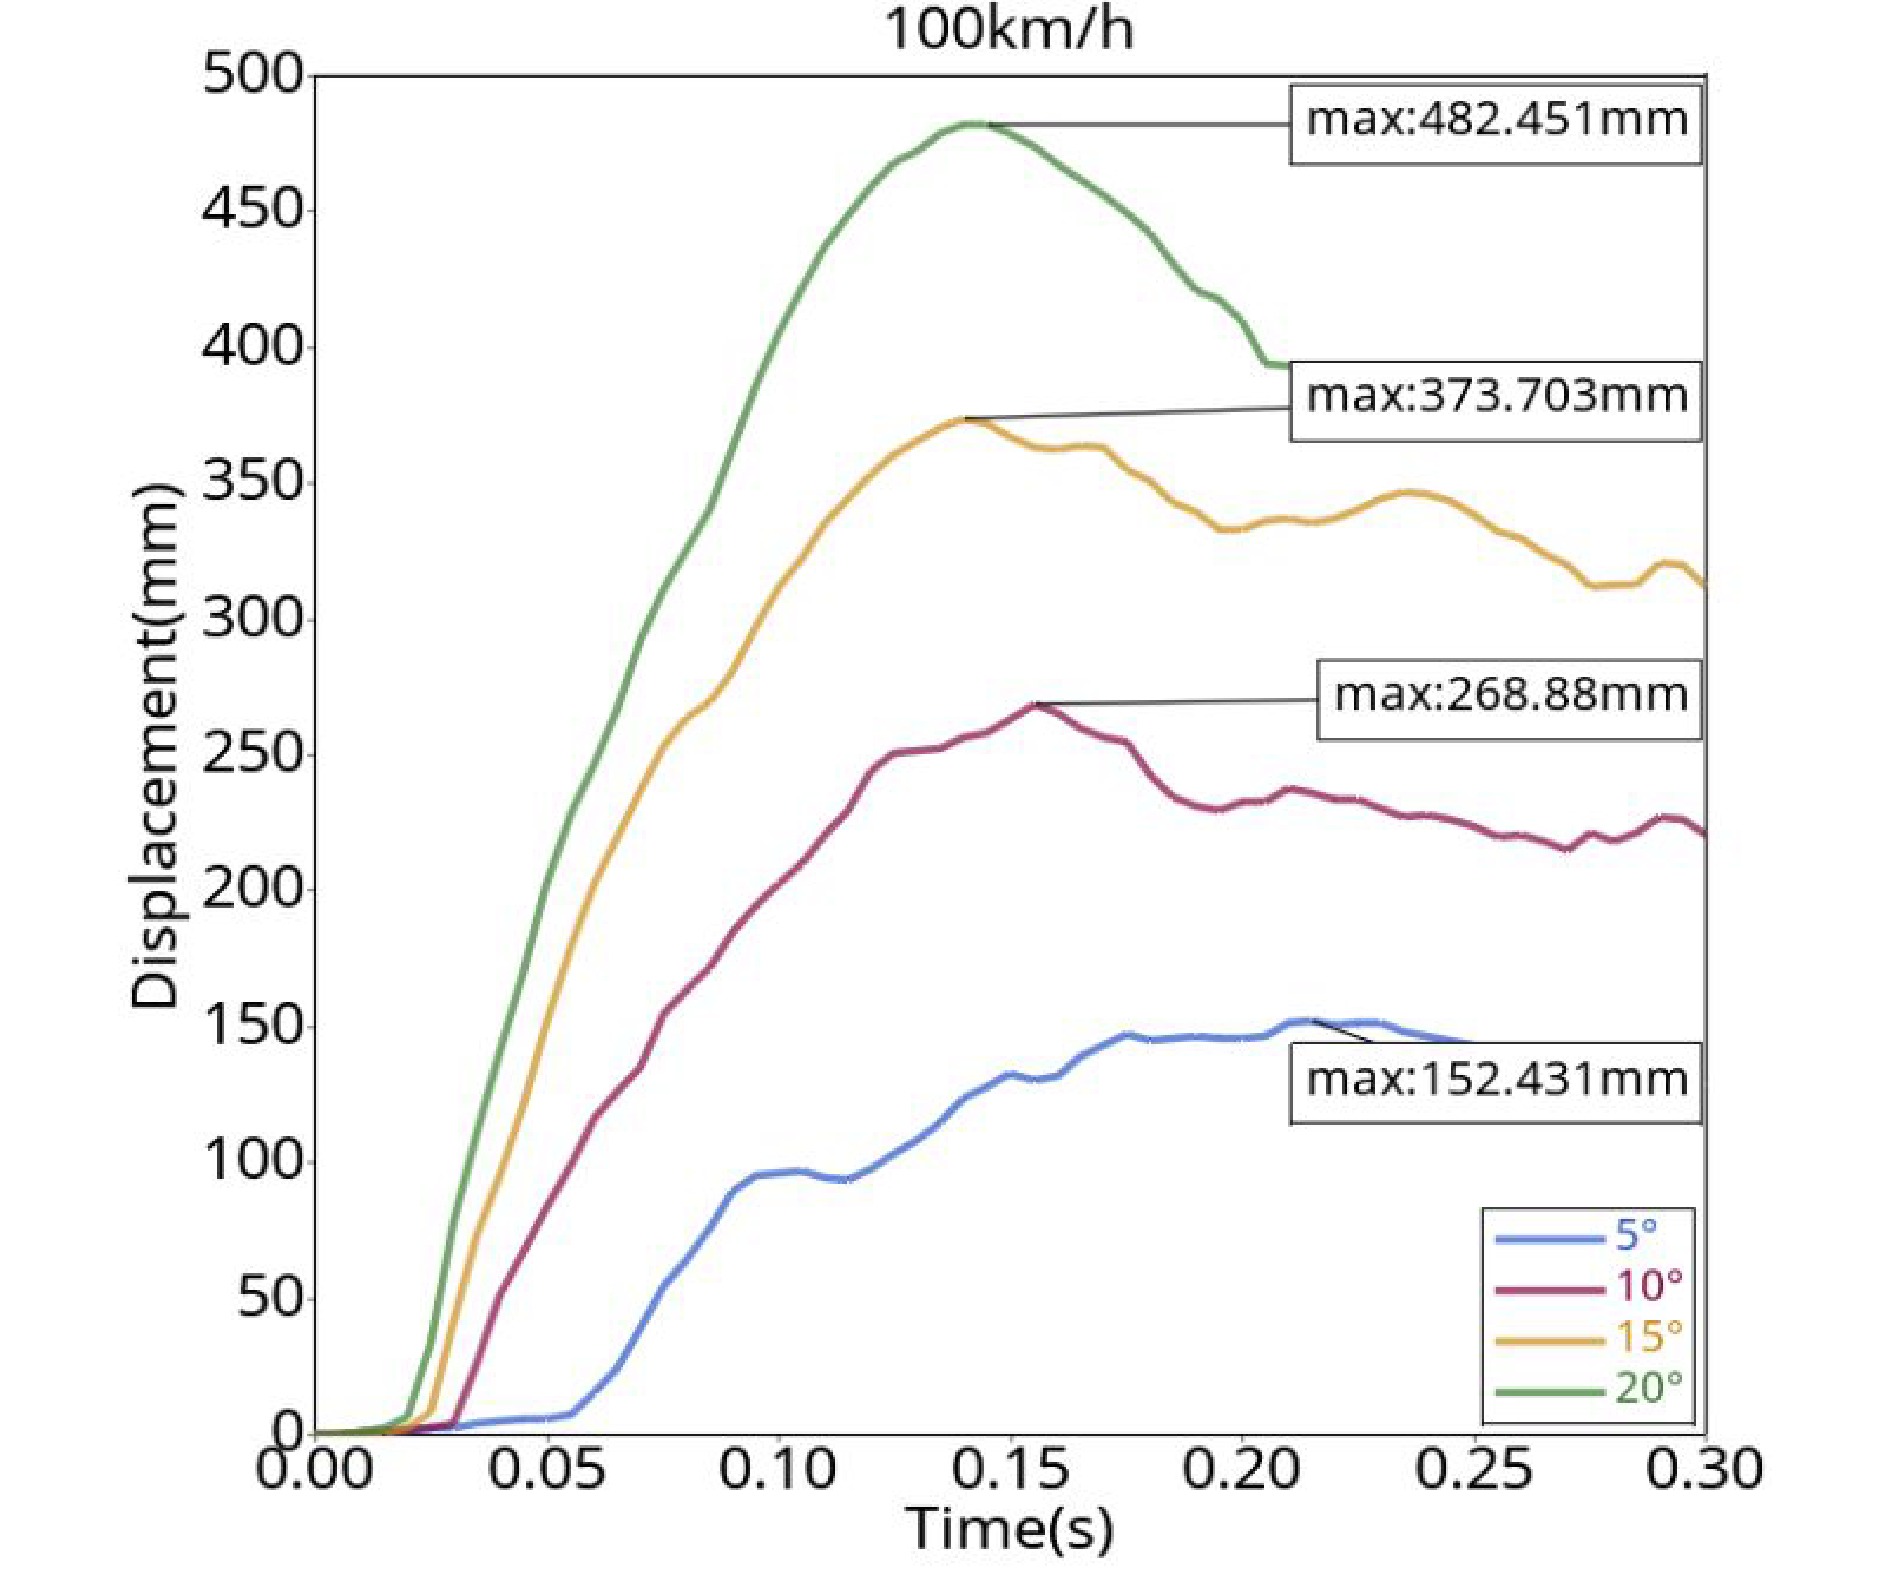
Figure 11.
Guardrail displacement curve (100 km/h).
Figure 11 shows that when the collision angle is 5°, the guardrail displacement increases rapidly at 0.06 s and reaches a maximum value of 152.4 mm at 0.22 s. There is a slight fluctuation of the curve due to the friction between the vehicle’s body and the fender at this angle during the collision. When the collision angle is 10°, the displacement of the guardrail increases rapidly at 0.03 s and reaches the maximum value of 268.9 mm at 0.16 s. After that, the vehicle begins to turn, and the contact between the vehicle and the guardrail gradually changes from the left front of the vehicle to the rear of the vehicle. When the collision angle is 15°, the displacement of the guardrail increases rapidly at 0.25 s. The guardrail absorbs the impact of the vehicle through deformation and reaches the maximum value of 373.7 mm at 0.14 s. There is an obvious fluctuation at 0.23 s, which is caused by the wheel pressing on the side bending column when the vehicle turns. When the collision angle is 20°, a large deformation of the guardrail is produced at 0.02 s, the maximum value of 482.5 mm is reached at 0.13 s, and then the vehicle starts to turn and drive away from the guardrail.
Simulation analysis of collision at 120 km/h
-
The D3plot file of the simulation results of the vehicle’s collision with the guardrail at various angles when the collision speed is 120 km/h was imported into the post-processing software HyperView, Contour is selected, the components corresponding to the guardrail are selected, and the cloud diagram is obtained as shown in Fig. 12.
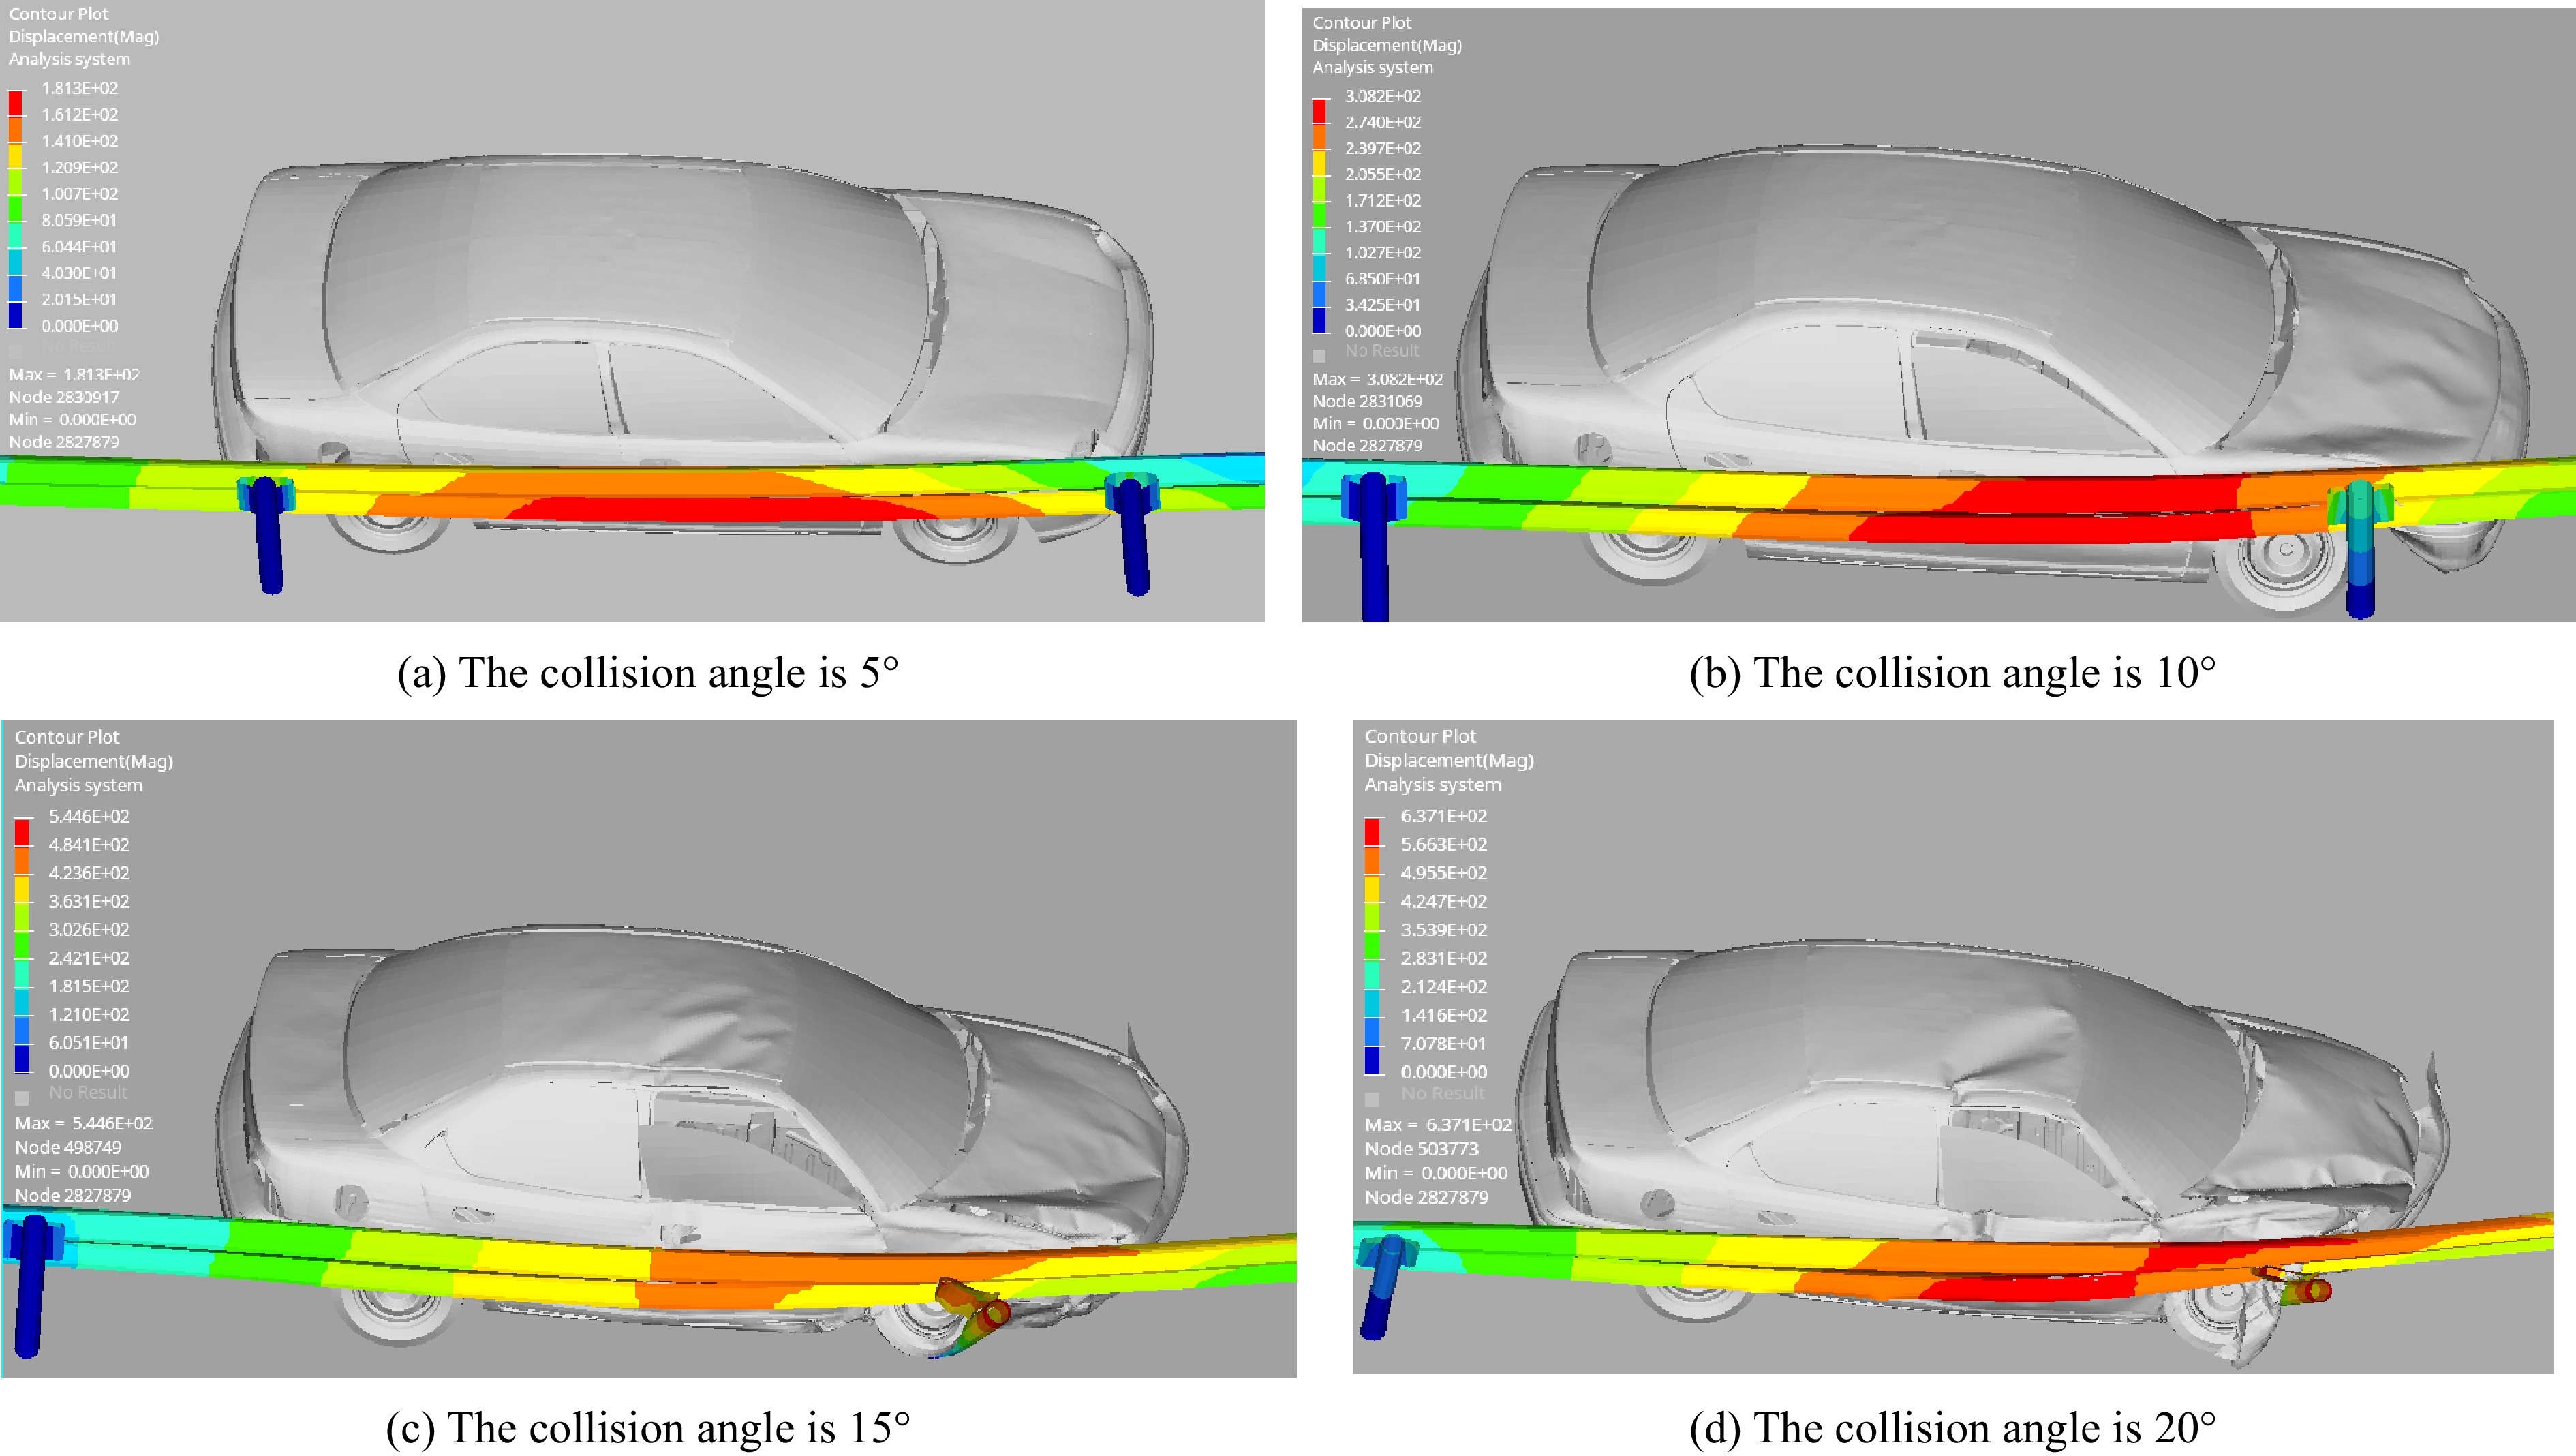
Figure 12.
Deformation of the guardrail impacted at different angles (120 km/h).
Figure 12 shows that when the collision angle is 5°, the red part of the figure is the maximum lateral displacement of the guardrail, which is generated in the middle of the two adjacent columns. The guardrail displacement is mainly caused by the body crossing the guardrail. The two adjacent anti-blocking blocks at the place where the car contacts the guardrail are deformed. The columns are not laterally bent. The damage to the car body is mainly scratching, which will not pose a threat to the safety of passengers. When the collision angle is 10°, the car begins to make contact with the guardrail to influence the steering behavior, and the three adjacent anti-blocking blocks are crushed to varying degrees. Among them, after the middle anti-blocking block is completely flattened, the column bends, and the red part in the figure of the maximum transverse displacement of the guardrail is generated on the side close to the side bending column. The outside of the left front wheel rubs against the bending column, and the front bumper and fender bend inward and deform, which poses a small threat to the safety of passengers. When the collision angle is 15°, the maximum lateral displacement of the guardrail occurs at the top of the column. Due to the large impact on the guardrail caused by high-speed driving, the column is seriously bent. When the vehicle turns, the wheel presses against the bent column, the vehicle bounces, and secondary damage is caused to the column. At this time, the anti-blocking block is moved and deformed, the vehicle is seriously damaged, and the safety of passengers is threatened. When the collision angle is 20°, maximum lateral displacement of the guardrail occurs on both sides of the column, the adjacent four blocks are flattened, the car left front wheel and column tripping phenomenon occurs, and the block is almost out of the column and guardrail plate. Because the initial speed of the car is high, the wheel cannot be timely directed by column pulling effect, resulting in side slip and serious body deformation and the lives of the occupants are threatened.
The transverse displacement time history curve of the guardrail is obtained through the joint processing of the postprocessing software HyperView and HyperGraph 2D, as shown in Fig. 13.
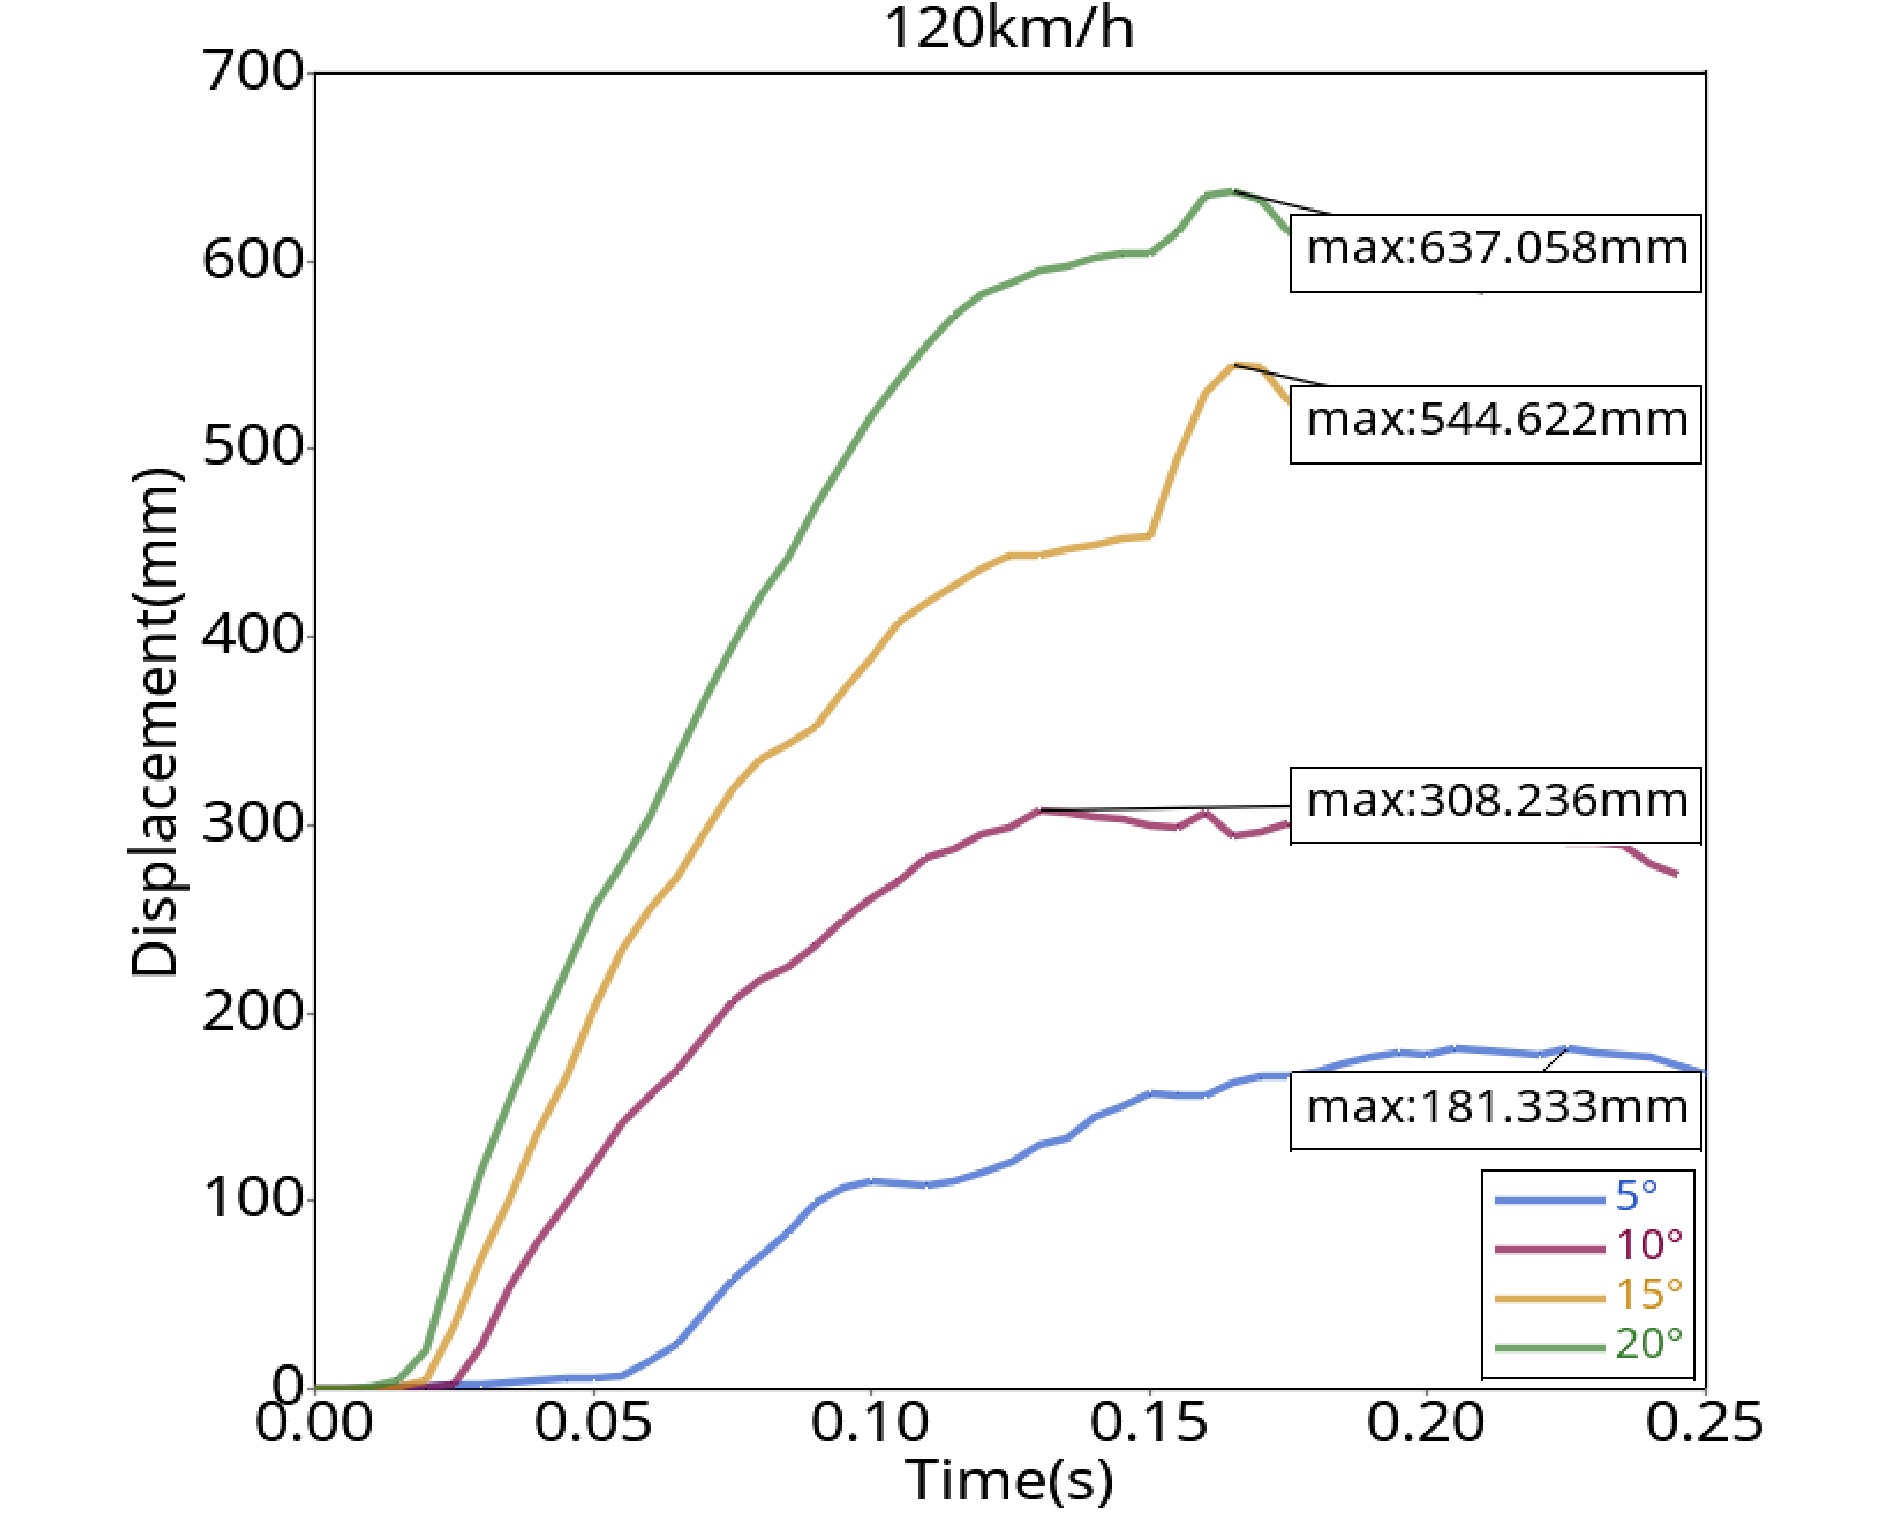
Figure 13.
Guardrail displacement curve (120 km/h).
As shown in Fig. 13, when the collision angle is 5°, the maximum transverse displacement of the guardrail is 181.3 mm, which appears at approximately 0.23 s, and the displacement increases rapidly at 0.06 s. At this time, the body begins to gradually make contact with the guardrail. Due to the small collision angle, the car mainly relies on the friction between the body and guardrail plate to achieve steering behavior, so the displacement curve will fluctuate slightly. When the collision angle is 10°, the maximum lateral displacement of the guardrail is 308.2 mm, which occurs at approximately 0.13 s. The deformation of the guardrail begins to increase at 0.025 s, and a small fluctuation occurs at 0.16 s, which is caused by the left front wheel rubbing against the column when the car turns. When the collision angle is 15°, the maximum lateral displacement of the guardrail is 544.6 mm at approximately 0.17 s. At 0.02 s, the car makes contact with the guardrail and degenerates rapidly, at which time the car begins to collide with the guardrail. At 0.15 s, the rapid increase in the lateral displacement of the guardrail is caused by the left front wheel of the car pressing on the side bending column. When the collision angle was 20°, the maximum lateral displacement of the guardrail (637.1 mm) appeared at 0.16 s, and the guardrail began to deform rapidly at 0.015 s. The collision began at 0.15 s, because the column was stuck between the car wheel and the car body, the huge impact force of the car had a pulling effect on the guardrail, resulting in a sudden increase in displacement and serious damage to the car guardrail.
Analysis of working conditions at the same collision angle
-
When the collision angle is 5°, Figs 6a, 8a, 10a & 12a show that due to the small collision angle, the driving direction of the vehicle is nearly parallel to the guardrail. During the collision, the left side body of the vehicle mainly makes contact with the guardrail to produce scratching behavior and the guardrail achieves protective performance and guiding function. When the collision speed increases, the number of anti-block deformations increases, and the degree of deformation becomes increasingly serious.
When the collision angle is 10°, Figs 6b, 8b, 10b & 12b show that with the increase in collision speed, the headlights, fender and front bumper of the car gradually begin to deform. Although the deformation degree is serious with the increase in collision speed, the body deformation is not obvious when the collision speed is 60 km/h. Although the two anti-blocking blocks in the collision area are deformed, they are not flattened. When the collision speed is 120 km/h, the front bumper of the car bends inward and reforms. The engine hood is squeezed and tilted, and the three connecting anti-blocking blocks are flattened, resulting in transverse side bending of the middle column.
When the collision angle is 15°, Figs 6c, 8c, 10c & 12c show that when the collision speed is 60 km/h, the deformation of the vehicle’s body is not obvious. When the collision speed is 120 km/h, the vehicle is seriously damaged, the vehicle’s body is distorted, the guardrail column is seriously bent and subjected to a second impact from the rolling of the vehicle, and the anti-blocking block is extracted and deformed by the fence and column.
When the collision angle is 20°, Figs 6d, 8d, 10d & 12d show that when the collision speed is 60 km/h, the vehicle’s body begins to deform slightly, and the guardrail column does not change significantly. However, when the collision speed is 120 km/h, the vehicle’s body is seriously distorted, and the adjacent columns of the guardrail are laterally bent and seriously damaged. The anti-blocking block on the column is almost broken, and passenger safety is threatened.
According to Figs 7, 9, 11 & 13, the maximum lateral displacement values generated by the guardrail when the vehicle collides with the guardrail at different speeds and angles are shown in Table 2.
Table 2. Maximum lateral displacement of guardrail (mm).
Speed (km/h) 60 80 100 120 5° 109.1 127.8 152.4 181.3 10° 153.0 228.3 268.9 308.2 15° 245.1 322.6 373.7 544.6 20° 281.3 375.4 482.5 637.1 The values in Table 2 gradually increase from left to right, which shows that when the collision angle is the same, the lateral displacement of the guardrail increases with the increase of the collision speed, and the overall trend of the increase of the value also increases with the increase of the collision speed, which means that the damage and deformation of the guardrail are increasingly serious, and the protection performance and guidance performance decrease.
-
After HyperGraph 2D filtering, the vehicle acceleration curves with a collision speed of 60 km/h and collision angles of 5°, 10°, 15°, and 20° are obtained, as shown in Fig. 14.
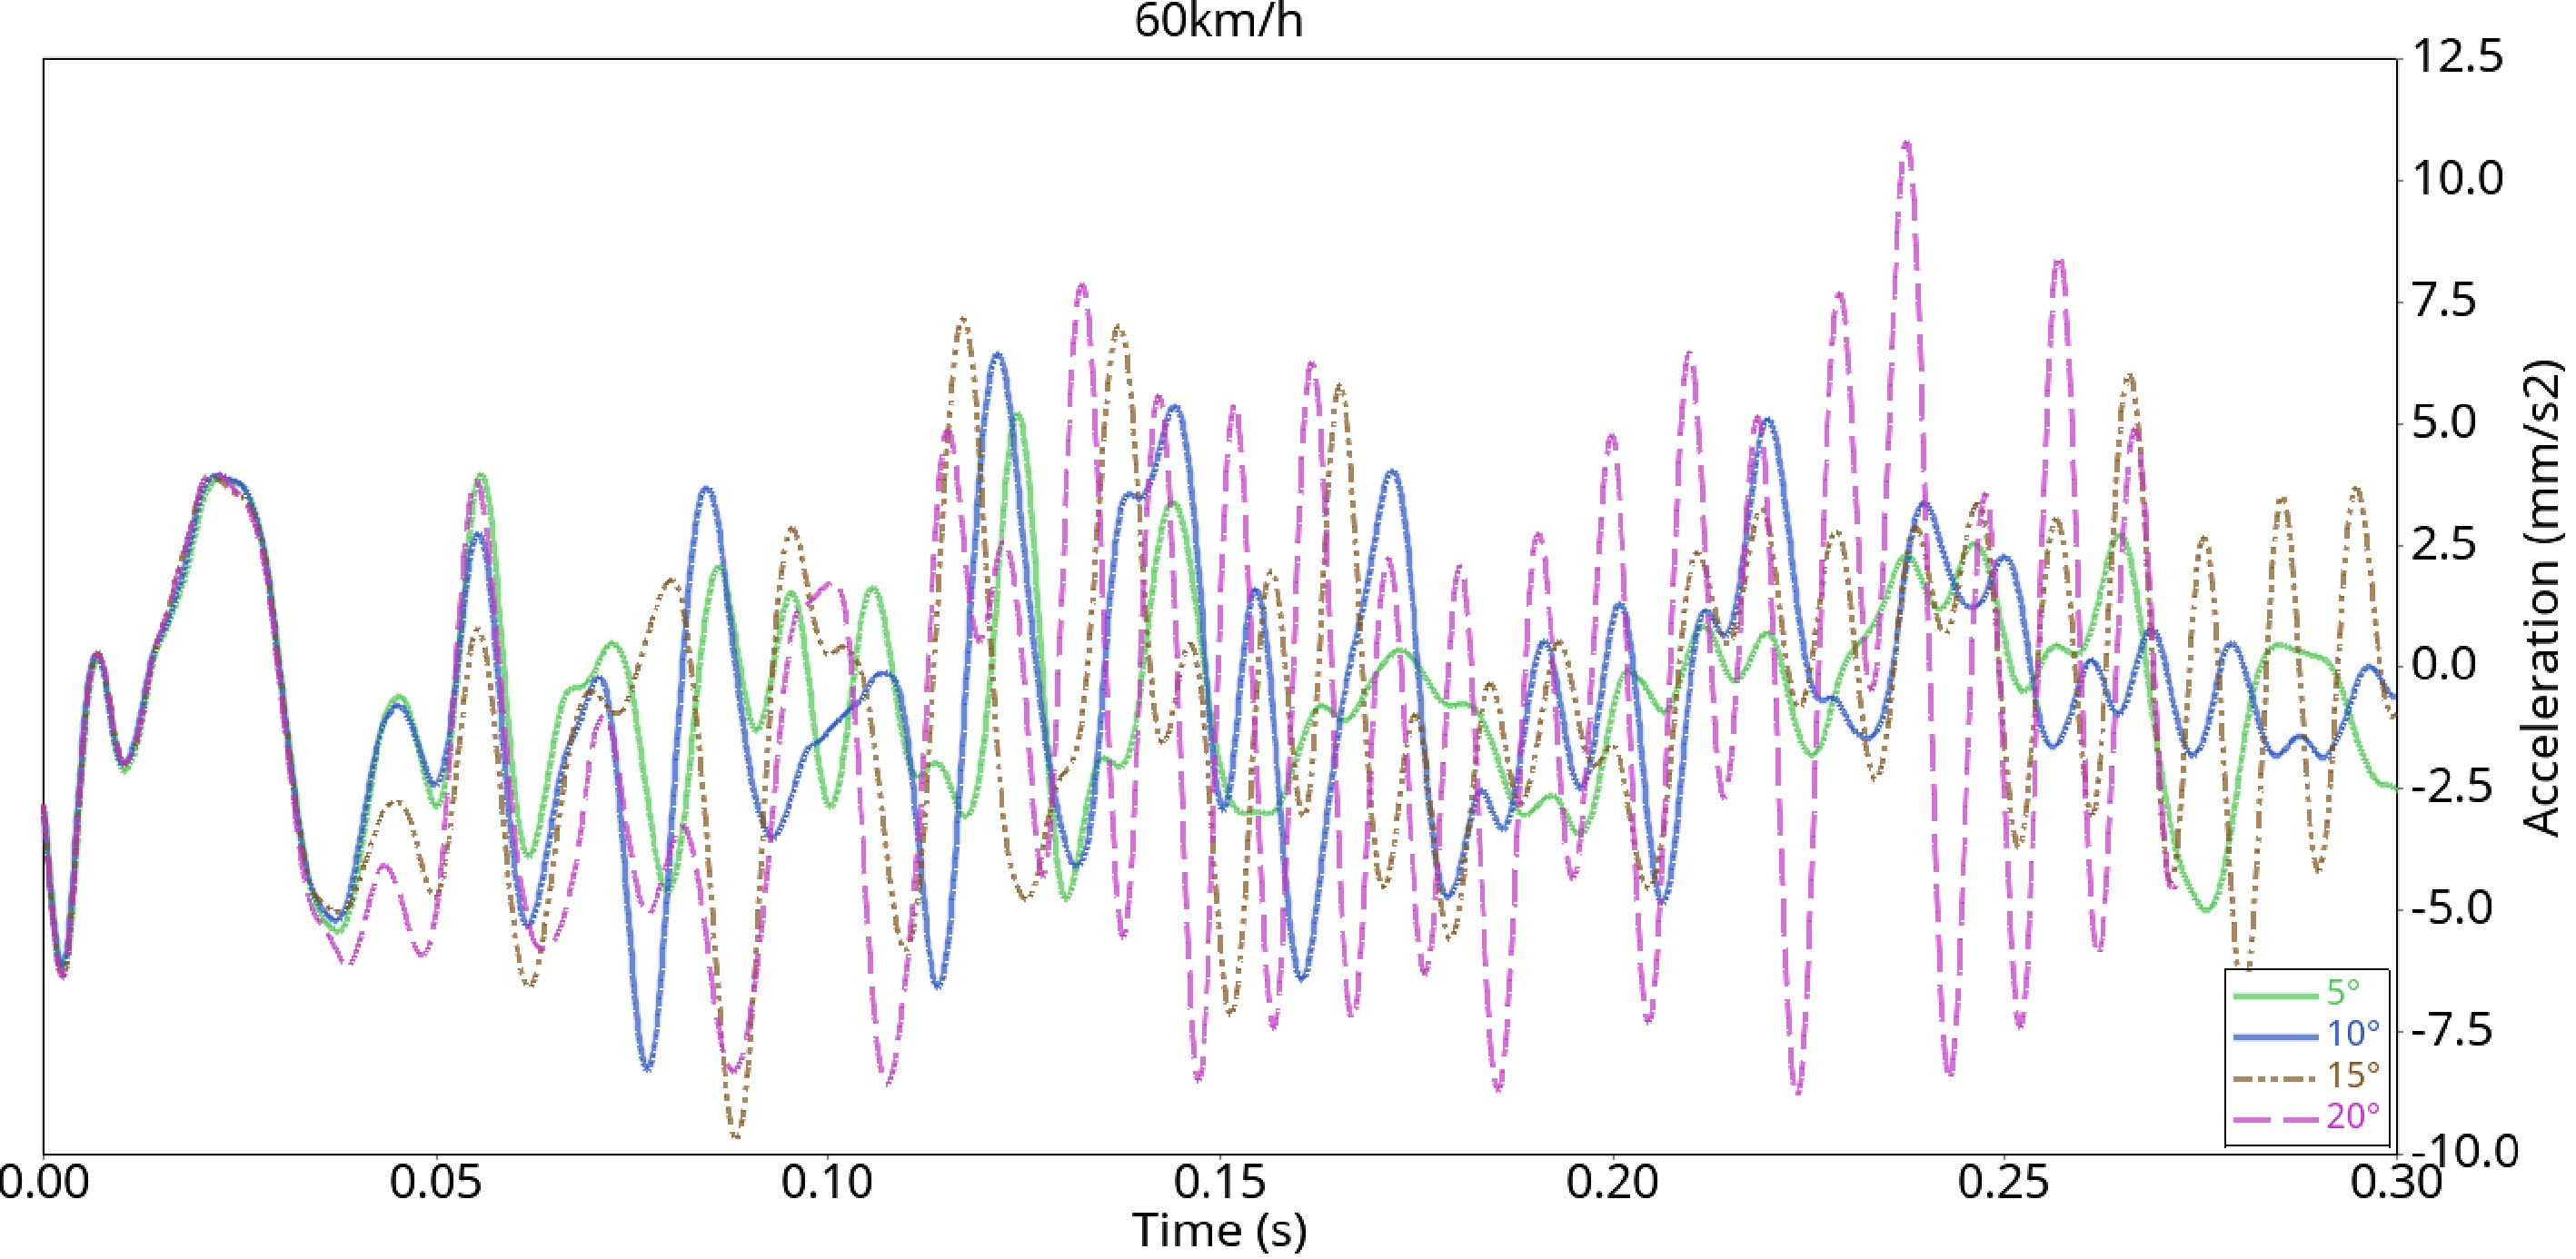
Figure 14.
Acceleration curve (60 km/h).
The acceleration curve in Fig. 14 shows that the acceleration curve of the vehicle coincides within 0~0.05 s, which means that the vehicle begins to make contact with the guardrail, and then fluctuates with different amplitudes after 0.05 s. At 0.1~0.2 s, the acceleration fluctuation amplitude and fluctuation range of all collision angles are larger, and the maximum acceleration values of collision angles of 5°, 10°, and 15° are also within this range, indicating that the vehicle quickly approaches the guardrail and acts on the guardrail during this period. After that, the vehicle’s speed decreases and begins to produce steering behavior, and the acceleration fluctuation tends to be gentle. When the collision angle is 15°, another large fluctuation occurs between 0.25 and 0.3 s, which is caused by the secondary collision between the rear of the car and the guardrail after turning. Similarly, when the collision angle is 20°, a large fluctuation also occurs at approximately 0.25 s.
Simulation analysis of collision at a speed of 80 km/h
-
The Nodout file of the simulation results of the vehicle’s speed of 80 km/h is imported into HyperGraph 2D to obtain the speed curve and then SAE60 filtering processing is performed after deriving the speed to obtain the acceleration curve of the vehicle when colliding with the guardrail at each collision angle, as shown in Fig. 15.
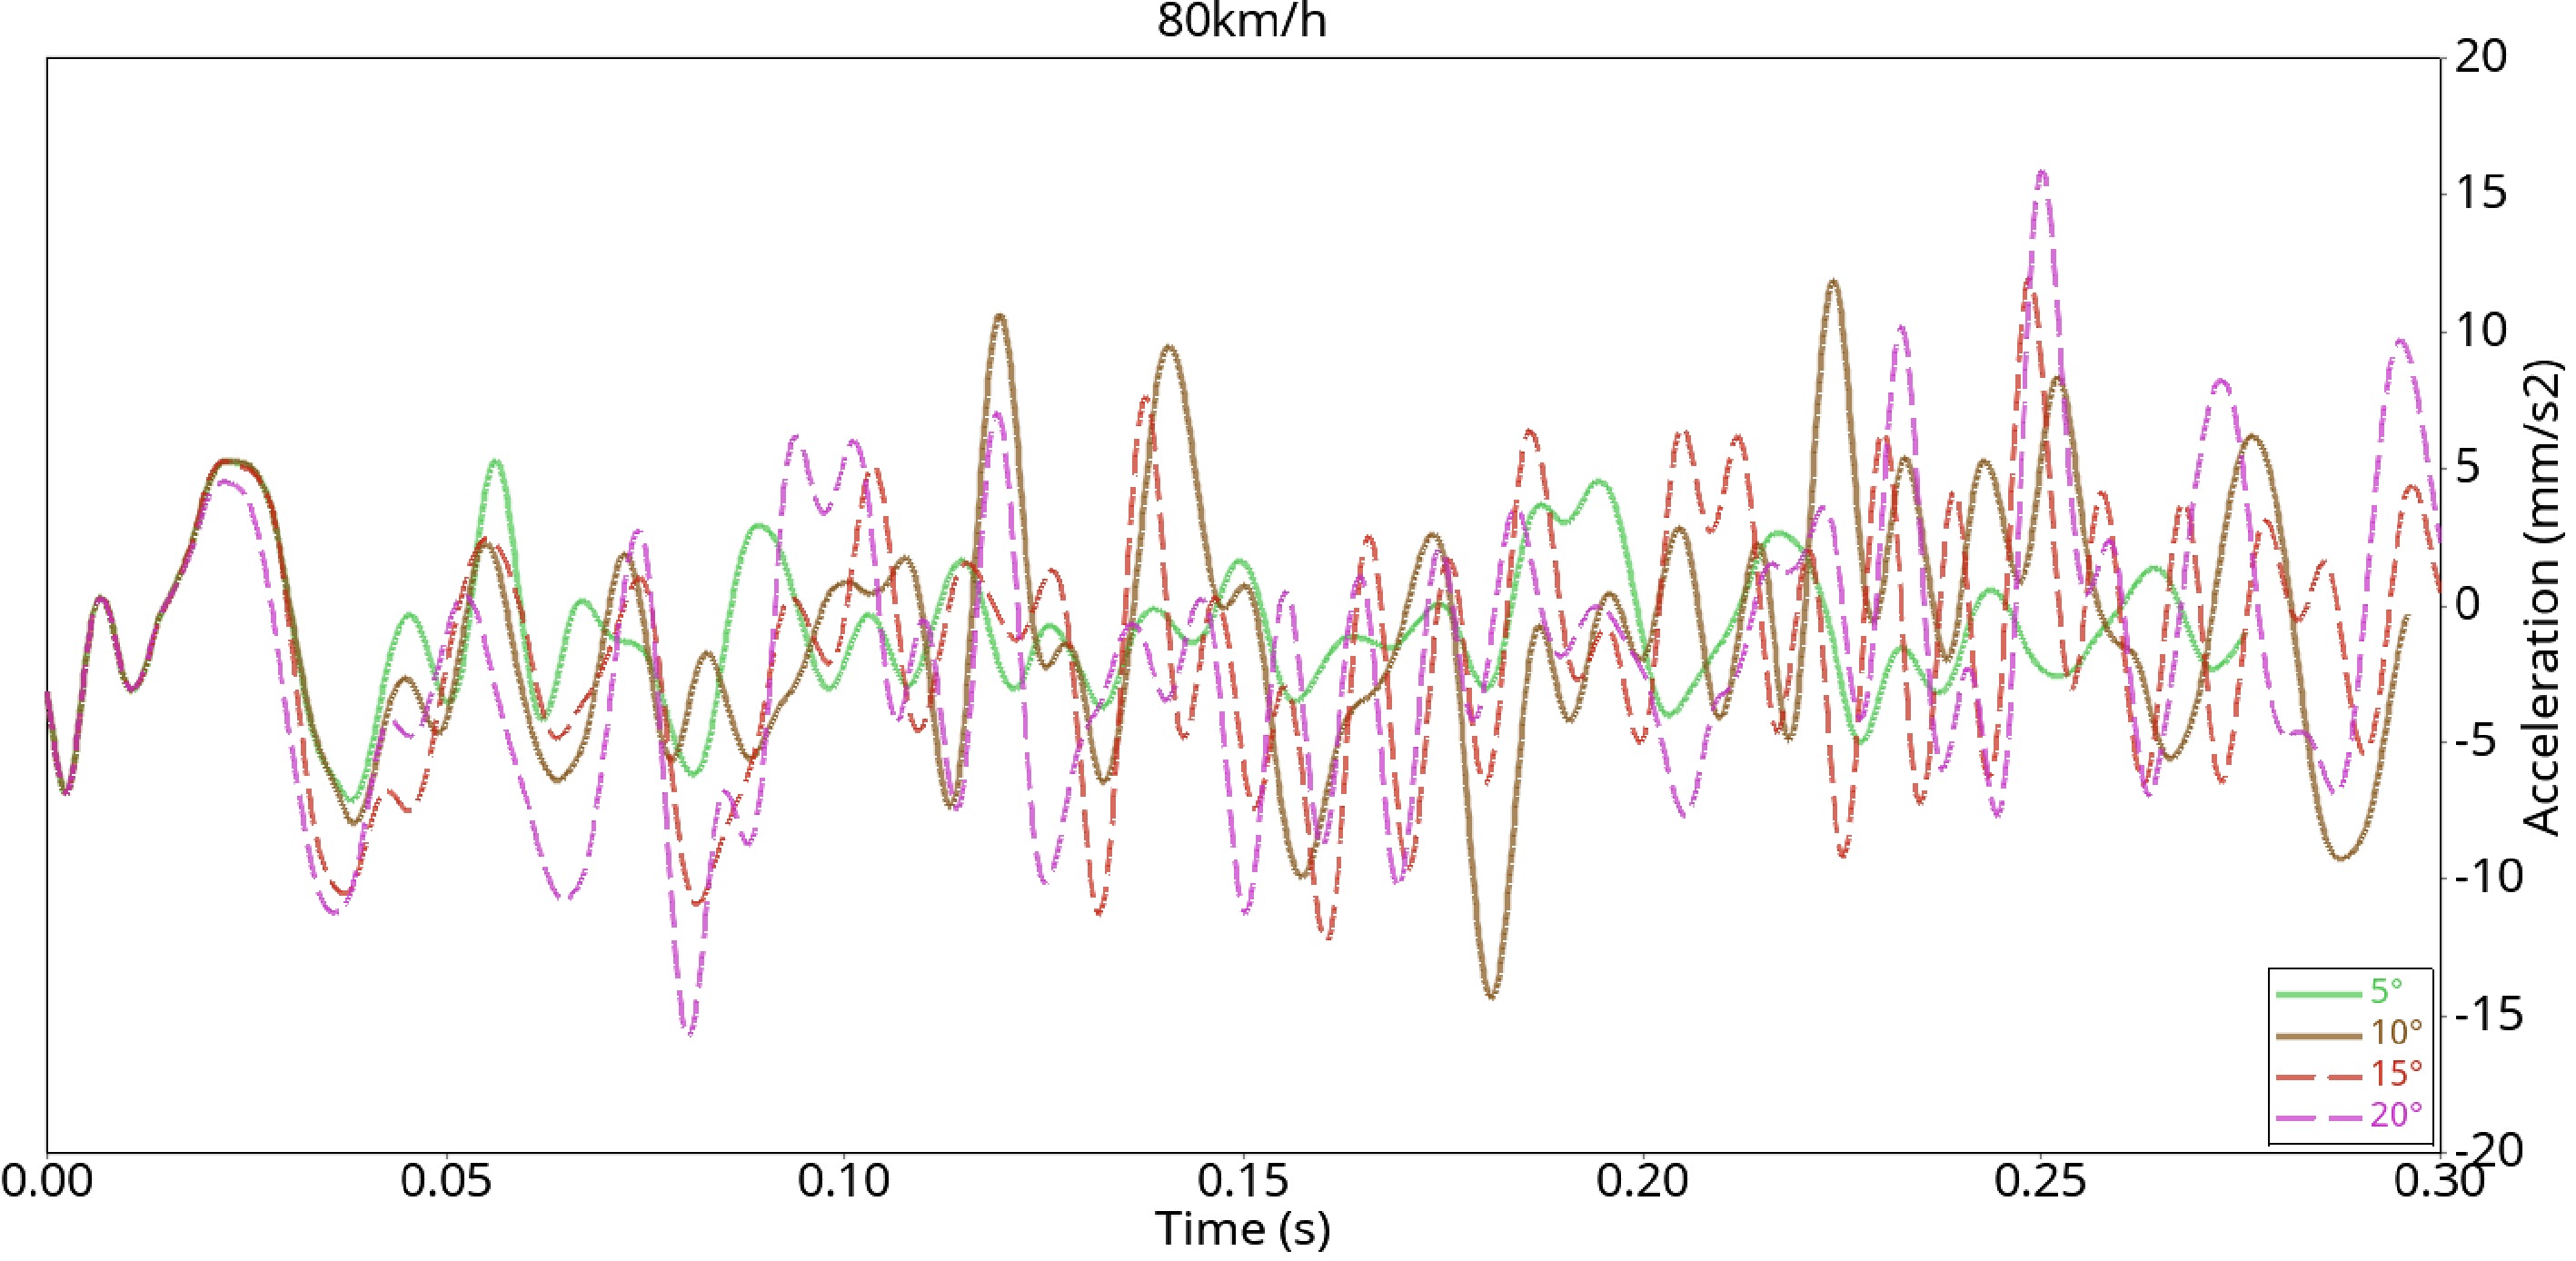
Figure 15.
Acceleration curve (80 km/h).
In the simulation process, the positive direction of X is selected as the normal driving direction of the vehicle, and the acceleration curve of the vehicle in the X direction is extracted here. Figure 15 shows that at the moment of contact between the vehicle and the guardrail, the vehicle’s acceleration is negative due to the reaction force and friction of the guardrail. The vehicle slows down. Under the reaction force, the vehicle will deform to absorb the energy brought by the reaction force, and the vehicle will accelerate at that moment. When the reaction force is transmitted to the body, the vehicle starts to slow down again. With time, the contact area between the vehicle and the guardrail continues to increase. The friction increases, and the greater the deformation of the guardrail is, the greater the resistance. The speed of the vehicle mainly decreases. When the car starts to turn, the contact area decreases gradually, the force on the guardrail decreases, and the car begins to accelerate.
Simulation analysis of collision at a speed of 100 km/h
-
The Nodout file in the simulation result file is imported into the post-processing software HyperGraph 2D; it is derived from the speed curve and filtered to obtain the following acceleration curve of the car colliding with the guardrail at different angles, as shown in Fig. 16.
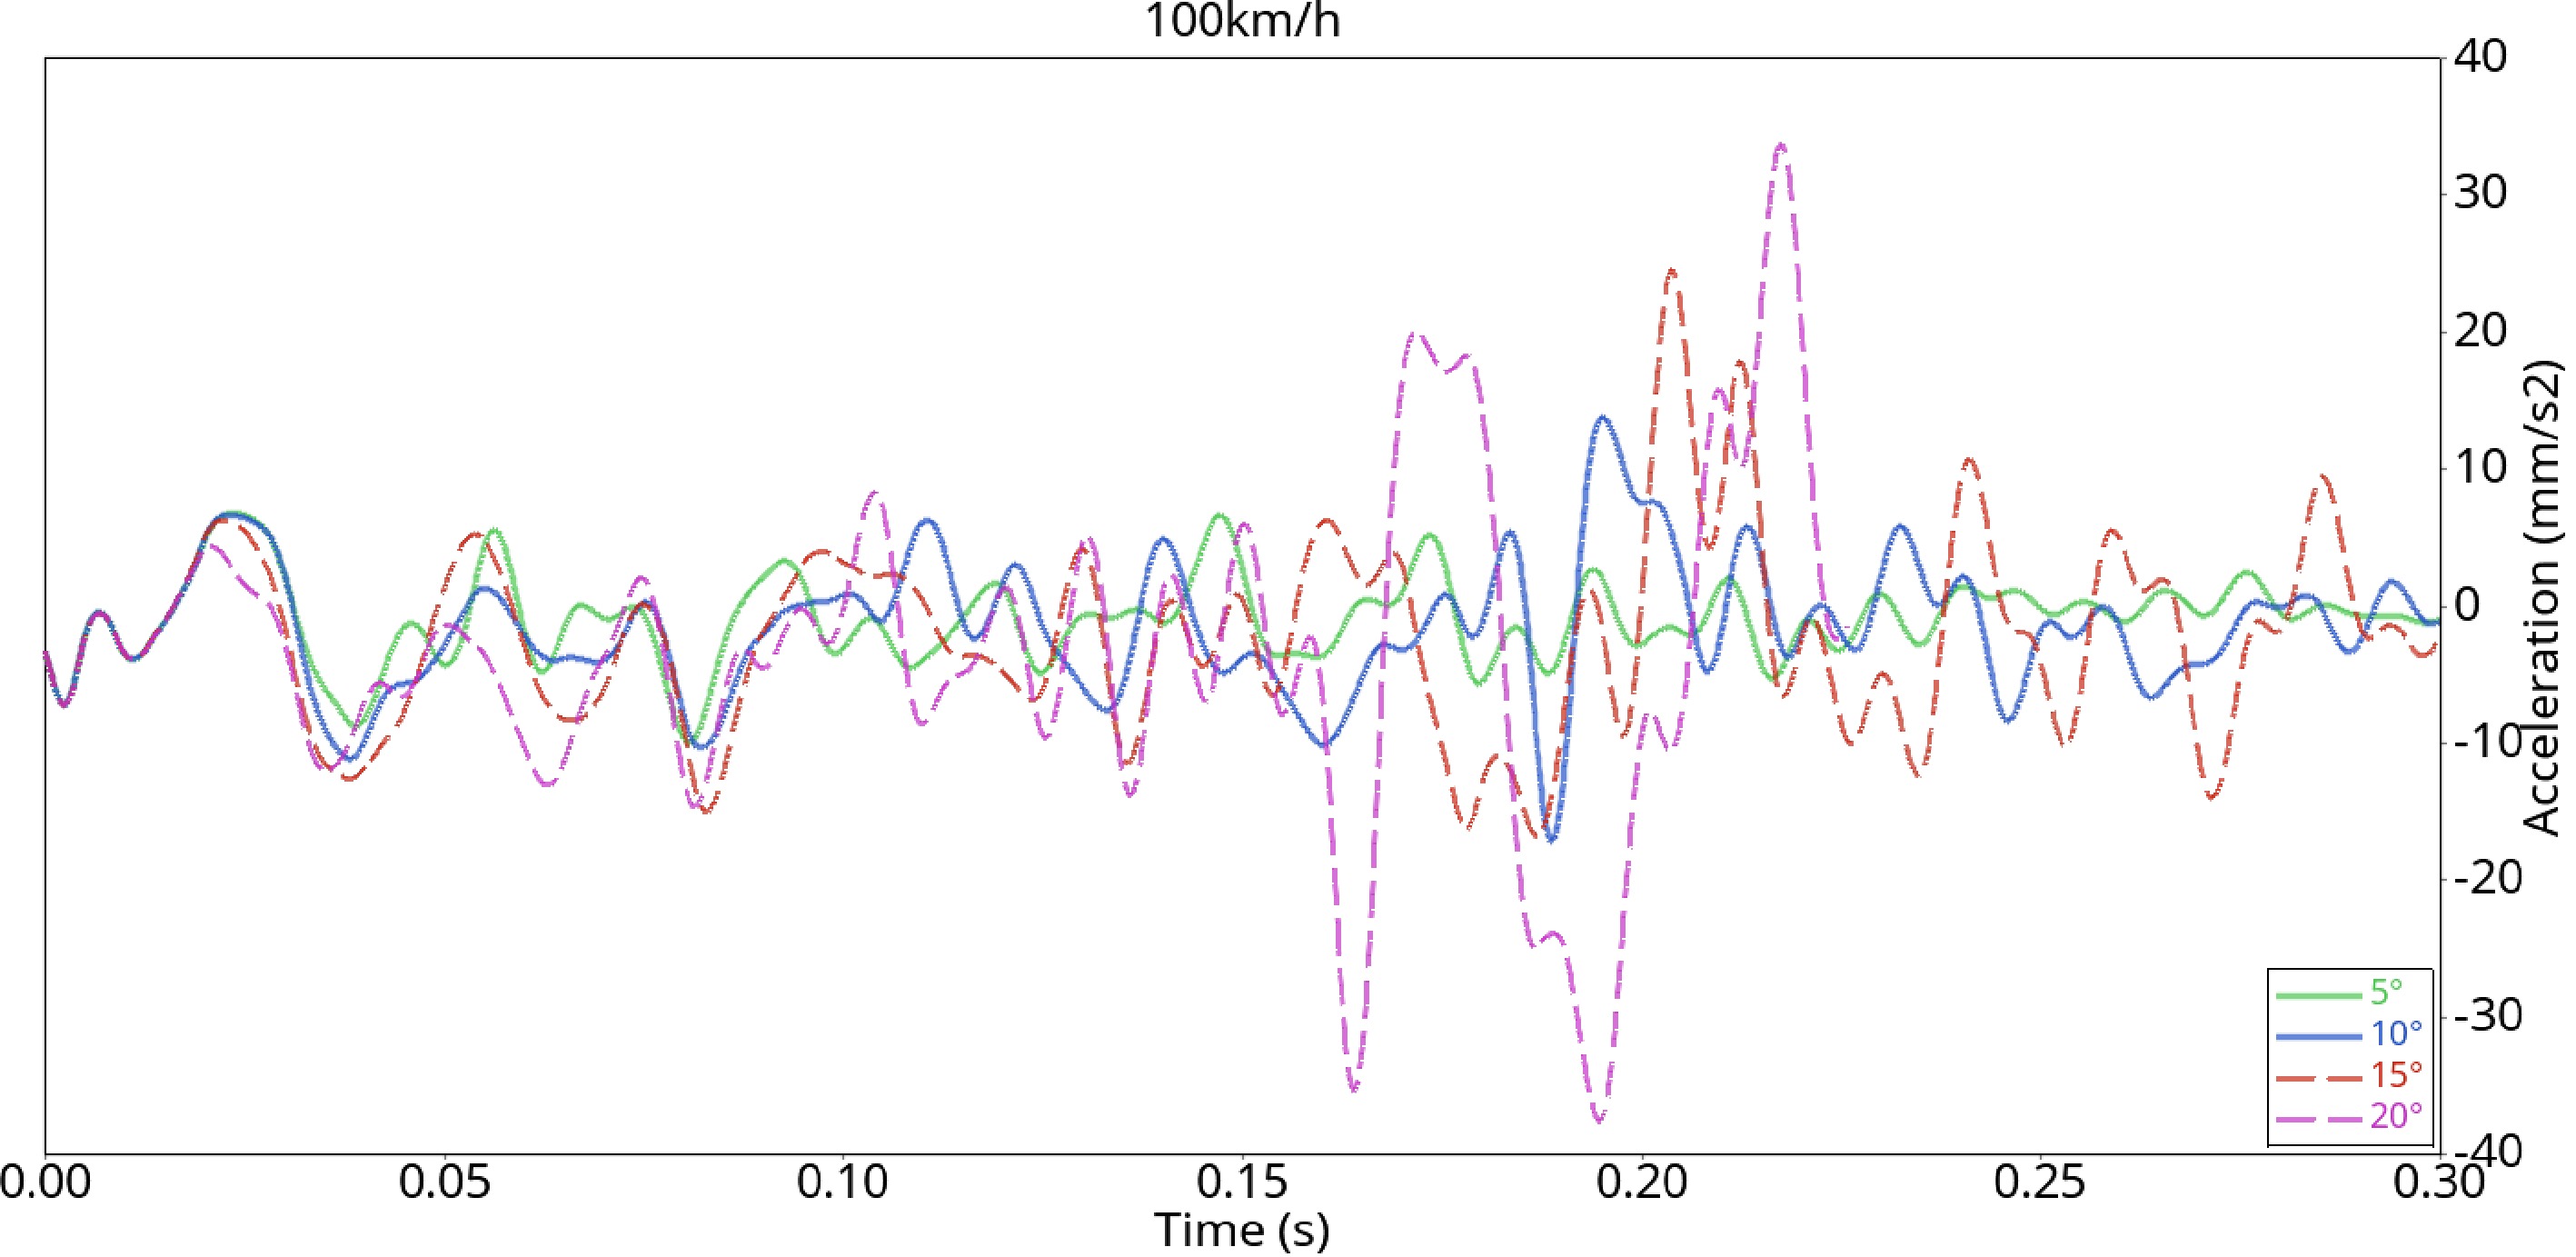
Figure 16.
Acceleration curve (100 km/h).
Figure 16 shows that when the collision angle is 5°, the acceleration of the vehicle fluctuates greatly up and down, mainly because sliding friction between the vehicle and the guardrail occurs in the X-direction. After 0.25 s, the acceleration fluctuation is small, indicating that the vehicle is gradually driven away from the guardrail at this time. When the collision angle is 10°, 15°, and 20°, the acceleration fluctuation is relatively stable before 0.17 s. After 0.17 s, the acceleration fluctuates up and down to the peak value. At this time, the force of the vehicle on the guardrail reaches the limit, and the maximum guardrail displacement value is produced. Then, the vehicle begins to turn, and the amplitude of the acceleration fluctuation begins to decrease. When the collision angle is 20°, the two lowest acceleration peaks occur, which is due to the slight tripping of the bent side column on the wheel, and then the wheel starts to accelerate after rubbing against the bent column.
Simulation analysis of collision at 120 km/h
-
The files of the simulation results were imported into HyperGraph 2D software to obtain the velocity changes, and then the acceleration curves of vehicles colliding with the guardrail at various angles in Fig. 17 were obtained through derivation, filtering, and unit processing.
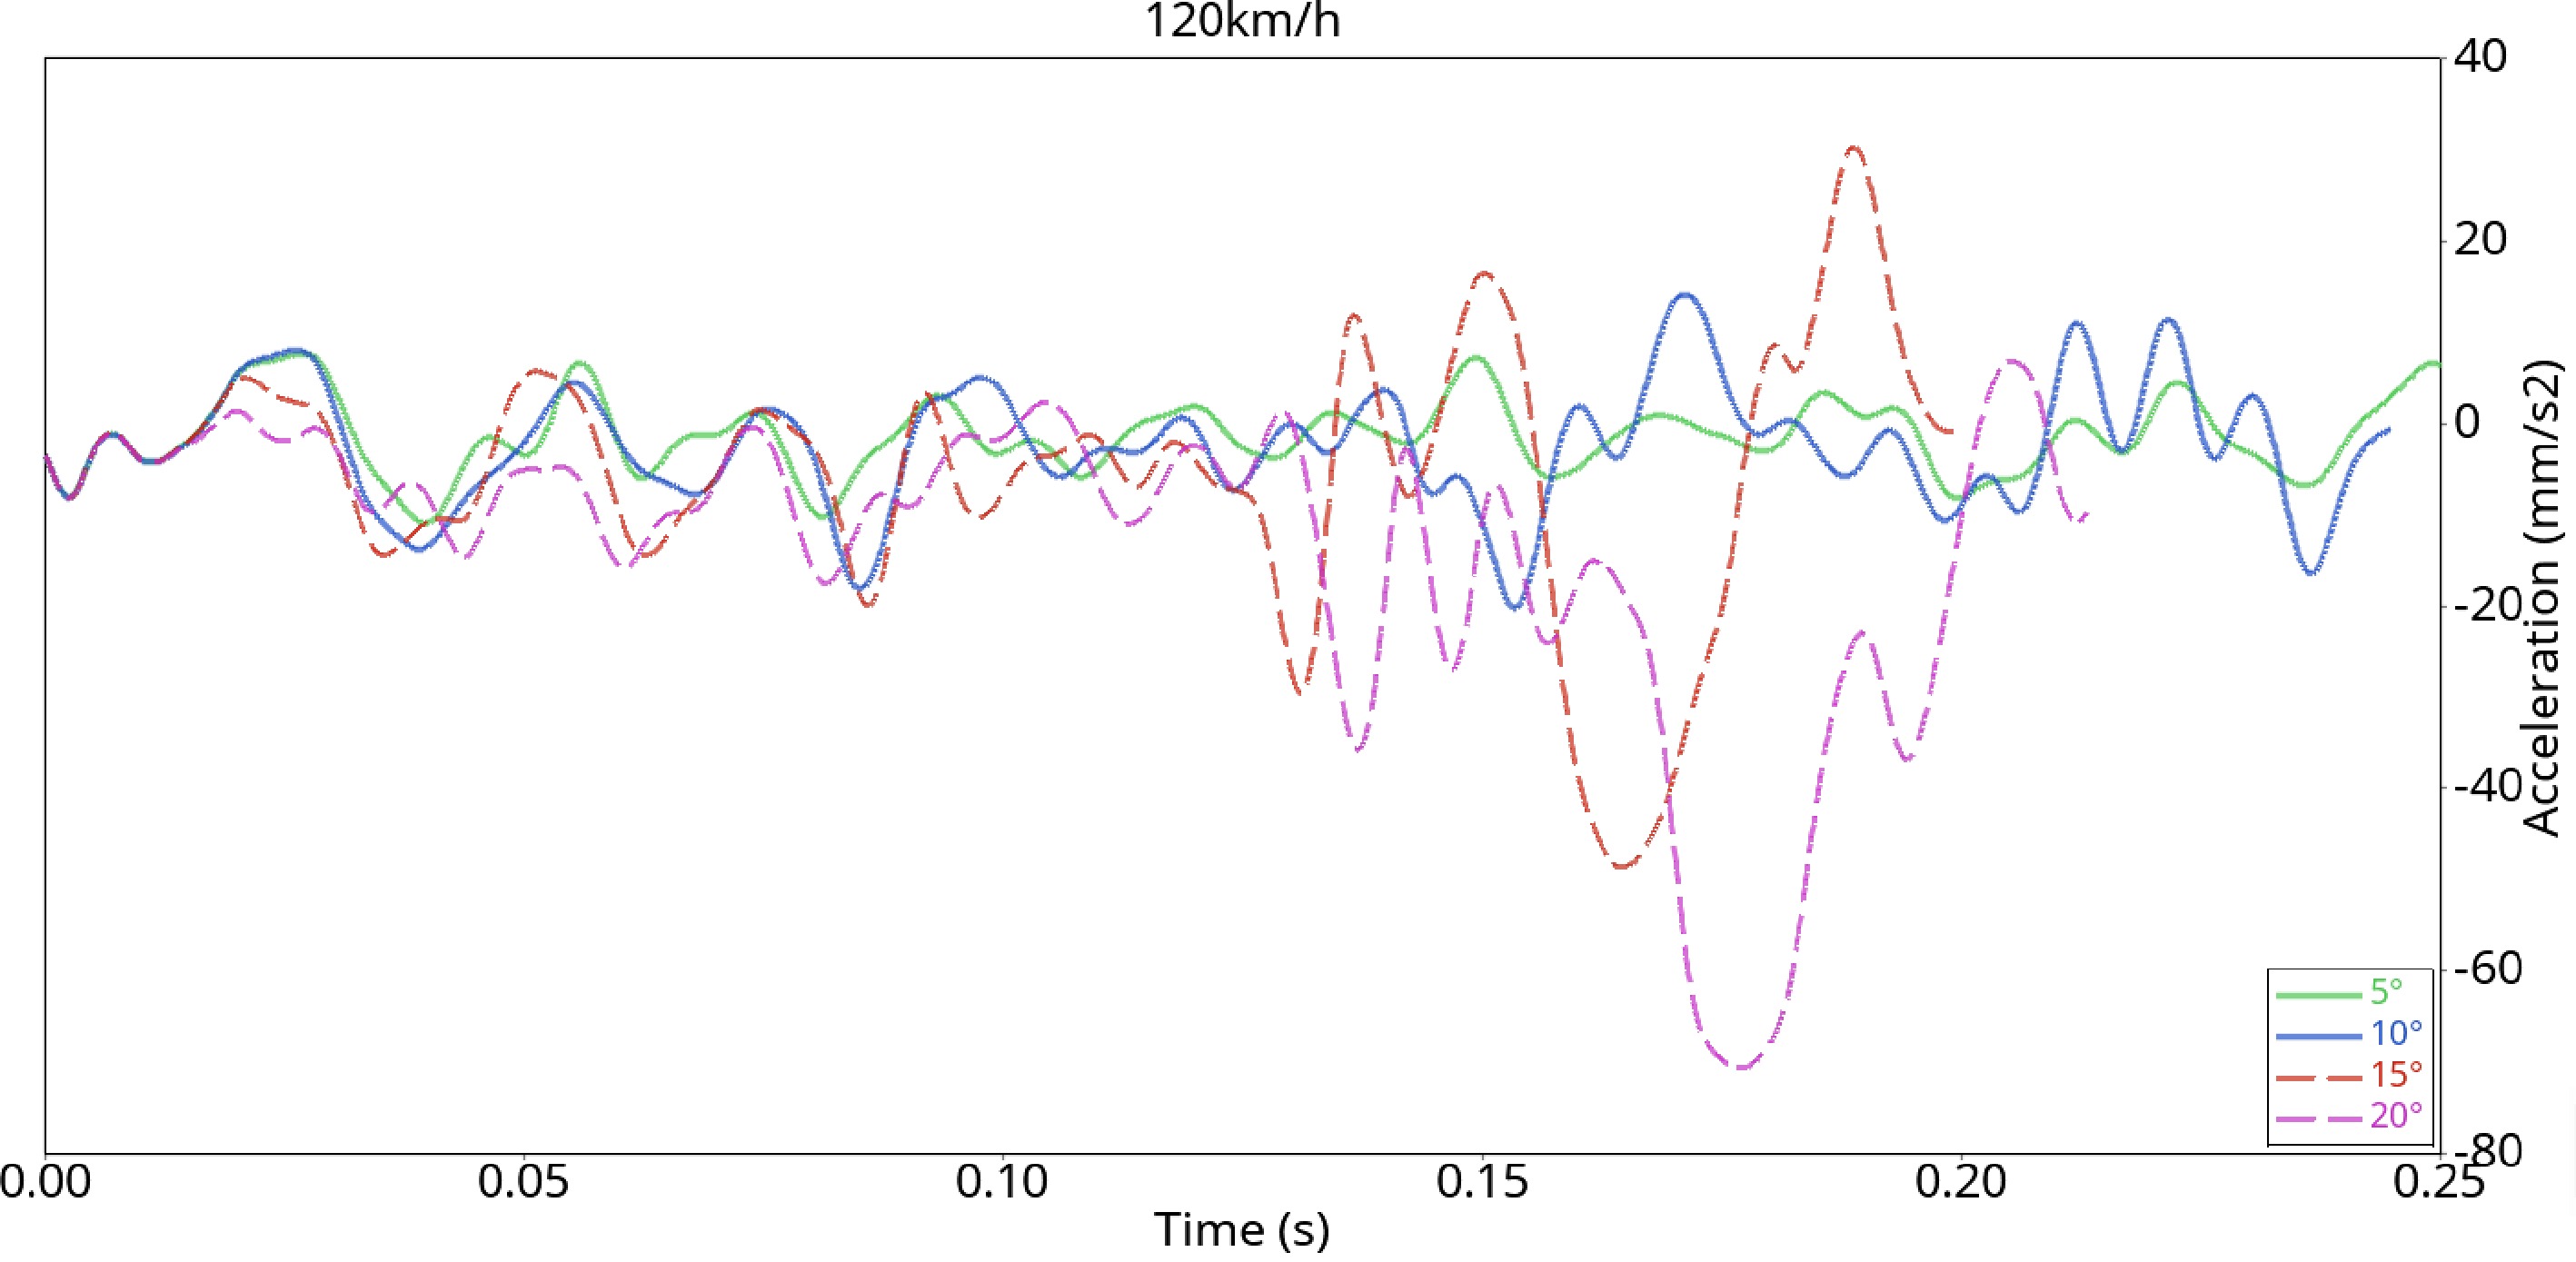
Figure 17.
Acceleration curve (120 km/h).
Figure 17 shows that when the collision angle is 10°, the vehicle’s body and the guardrail fence realize the guardrail guidance in the form of sliding friction, and the acceleration fluctuates greatly due to the unstable friction. When the collision angle is 10°, due to the action of the wheel and the column, there is a huge fluctuation within the period of 0.15~0.17 s, and then the body makes contact with the fence, resulting in the acceleration fluctuating up and down until it reaches 0. When the collision angle is 15°, after the wheel is tripped by the side bending column at 0.15 s, the speed is too fast, and the car continues to drive after bouncing, so the speed decreases instantaneously at 0.15 s and then begins to increase. When the collision angle is 20°, due to the interaction between the column and the vehicle, the vehicle’s speed decreases rapidly in the period of 0.15~0.2 s until the calculation stops.
Analysis of acceleration at the same collision angle
-
From Figs 14, 15, 16 & 17, the variation range of the acceleration value when the vehicle collides with the guardrail at different speeds and angles can be obtained, as shown in Table 3.
Table 3. Acceleration range (g).
Speed (km/h) 60 80 100 120 5° 5 ~ −5 5 ~ −7 7 ~ −10 8 ~ −12 10° 7.5 ~ −8 10 ~ −13 14 ~ −14 15 ~ −21 15° 8 ~ −10 12.5 ~ −12.5 23 ~ −17 30 ~ −50 20° 11 ~ −9 16 ~ −16 35 ~ −38 10 ~ −72 According to the evaluation index of the guardrail in The Safety Performance Evaluation Standard Of Highway, when the vehicle collides with the guardrail, the maximum value of vehicle synthetic acceleration should not be greater than 20 g. Therefore, the change in acceleration in the process of a vehicle collision with a guardrail is an important index to measure the passive safety of the vehicle. Table 3 shows that when the collision angle is 5°, the acceleration range of each collision speed meets the safety standard. When the collision angle is 10°, the maximum acceleration of vehicles with collision speeds of 60, 80, and 100 km/h is less than 20 g, and when the collision angle is 120 km/h, the maximum acceleration of 21 g slightly exceeds the safety standard. When the collision angle is 15°, the acceleration ranges of 60 and 80 km/h are within the safe value range, and the maximum values of 100 and 120 km/h are 23 g and –50 g, respectively, which exceed the standard value of 20 g. When the collision angle is 20°, the acceleration ranges of the collision speeds of 60 and 80 km/h are also within the safe value range. The maximum values of the collision speeds of 100 and 120 km/h far exceeded the standard value of 20 g; thus the safety of the vehicle cannot be ensured.
-
The Glstat file generated by the LS-DYNA simulation is imported into the post-processing software and the energy change curves of the vehicle colliding with the guardrail at 5°, 10°, 15°, and 20° when driving at 60 km/h are drawn, as shown in Fig. 18.
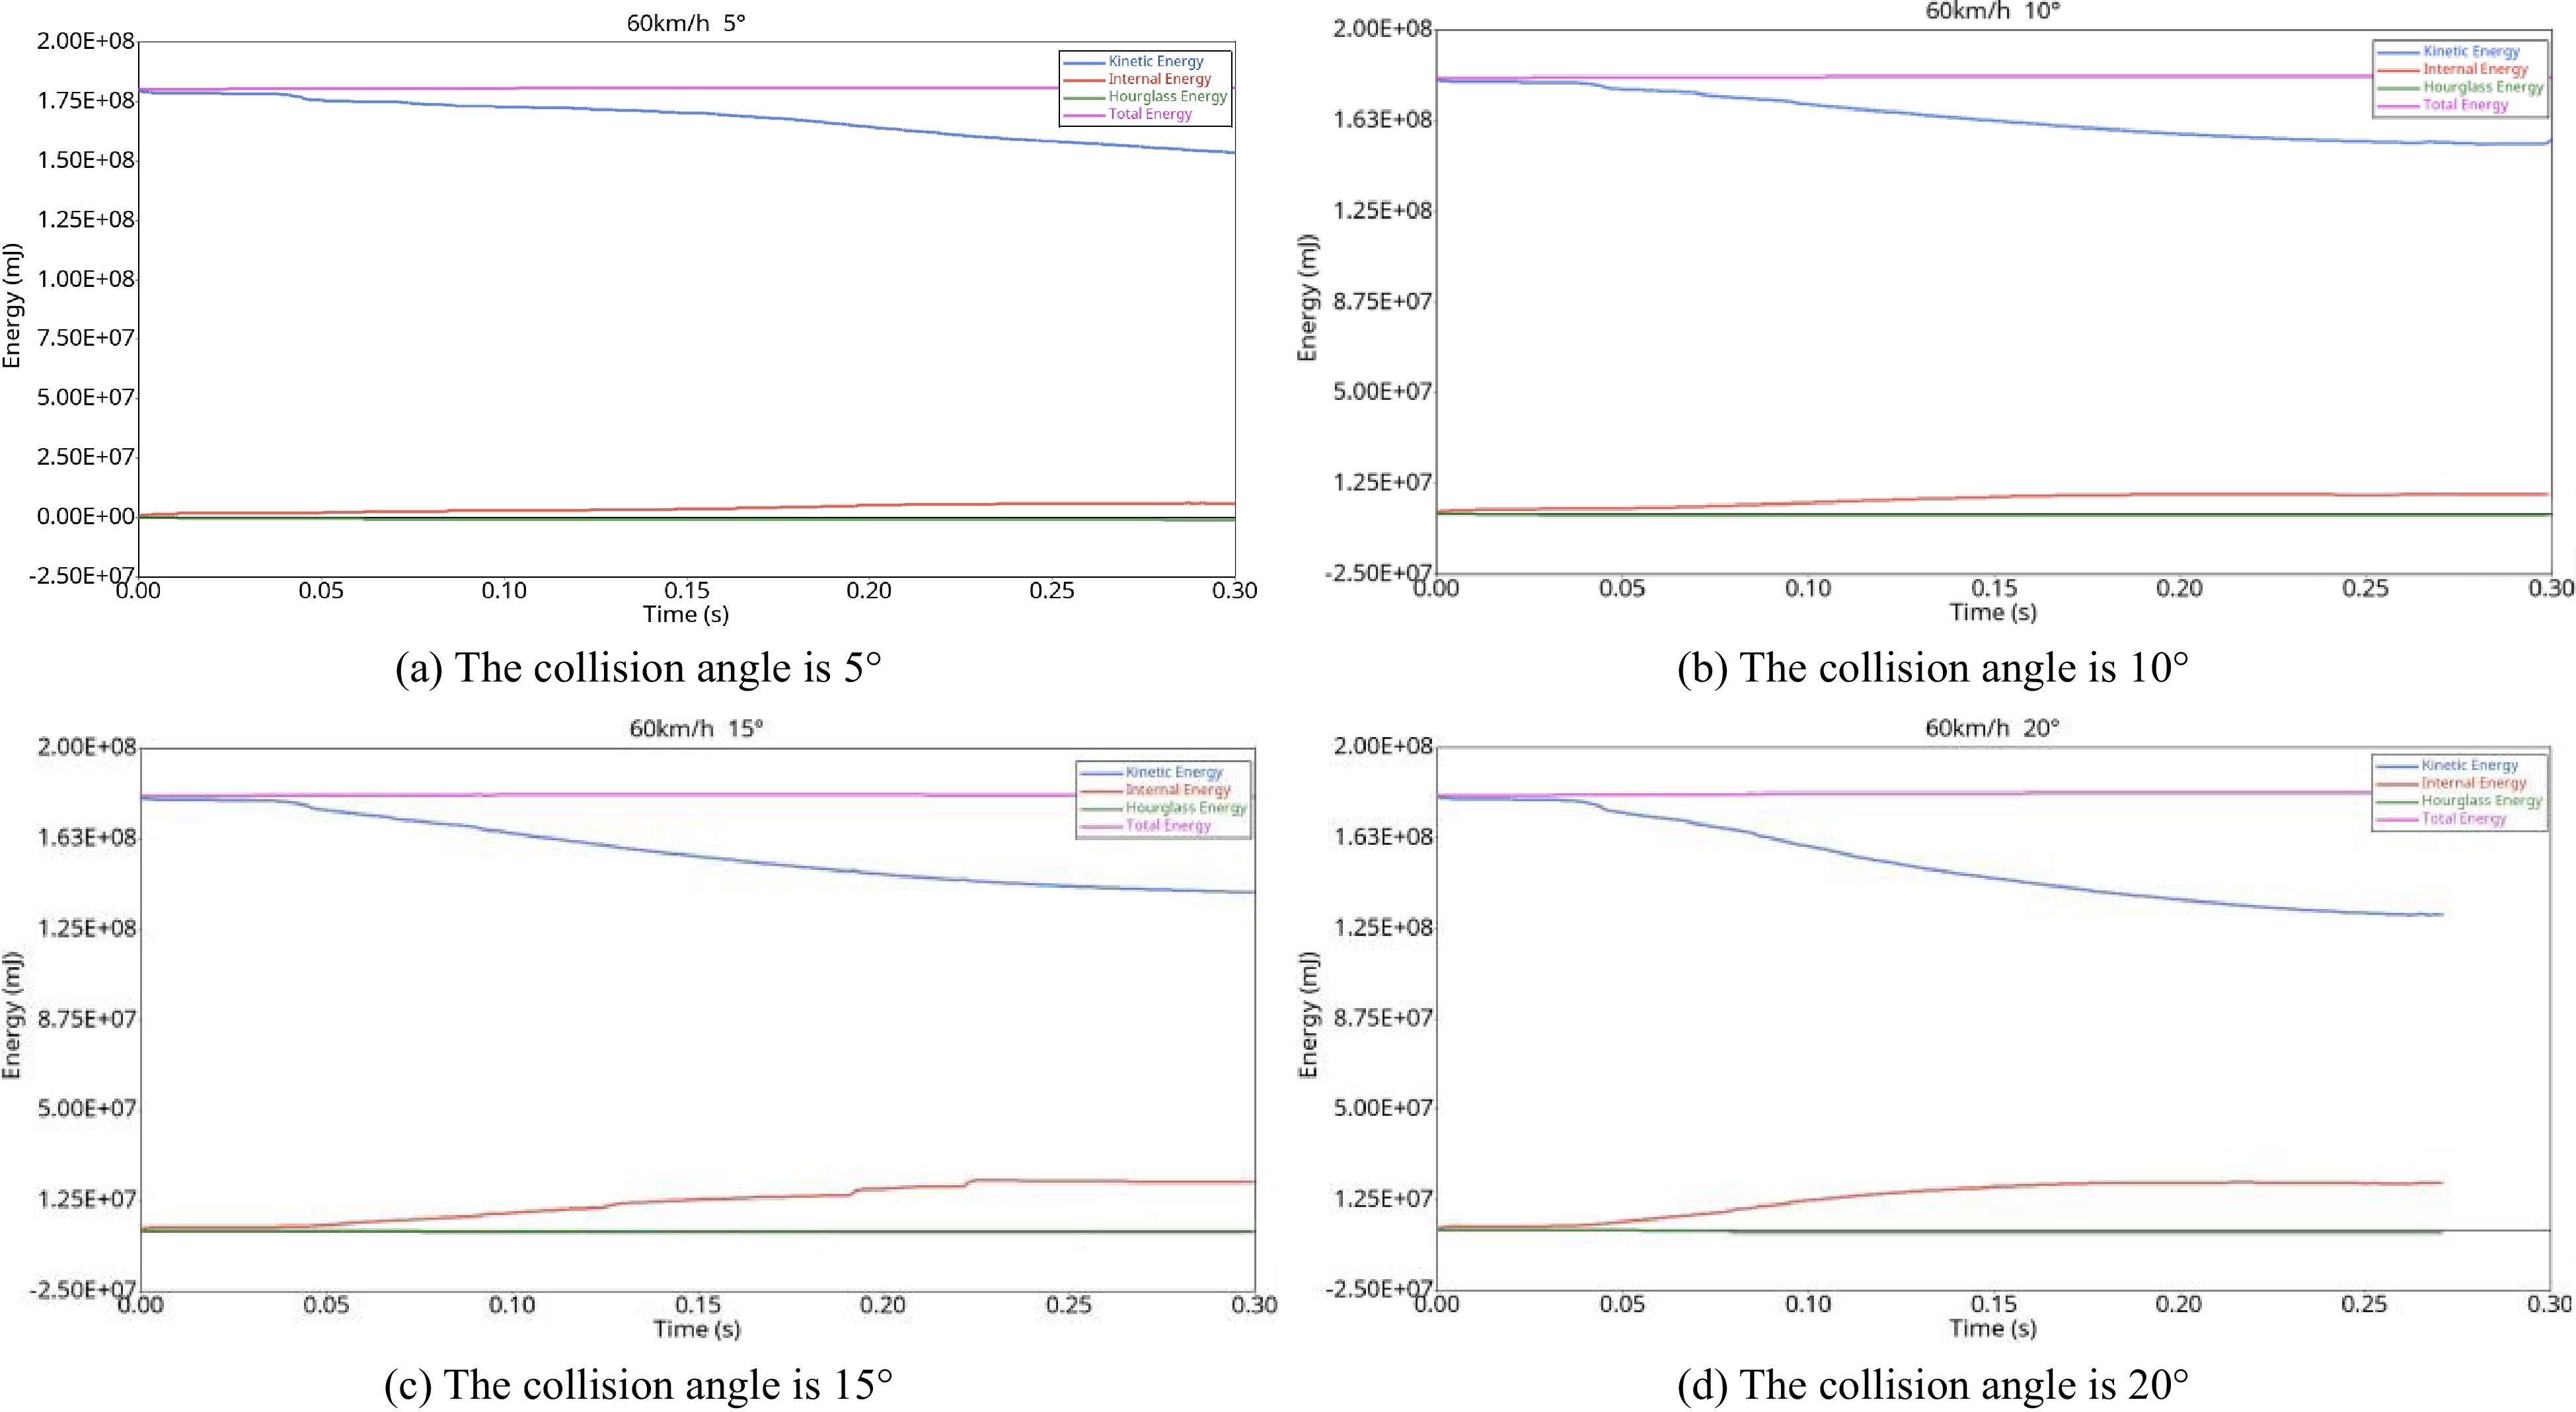
Figure 18.
Energy curves (60 km/h).
The car crash barrier mainly involves the process of converting kinetic energy into internal energy. In Fig. 18, the energy curves from top to bottom are the total energy, kinetic energy, internal energy, and hourglass energy. Whether the car crash energy is conserved is mainly considered by these four energy factors. It can be seen from the figure that when the car collides with the guardrail at different angles at 60 km/h, the decrease in kinetic energy and the increase in internal energy in the figure are relatively gentle, but the decrease in kinetic energy is significantly greater than the increase in internal energy. This is because part of the energy is absorbed by the guardrail in the form of deformation, and part of the energy is consumed by the heat energy generated by the friction between the vehicle surface and the guardrail. The total energy and hourglass energy in the figure do not fluctuate significantly and are almost in a straight line, and the hourglass can be close to the abscissa axis, which shows that the hourglass deformation does not have a significant impact on the simulation results.
Simulation analysis of collision at a speed of 80 km/h
-
Vehicle collision with the guardrail is an energy conservation process. When the vehicle collides with the guardrail, the kinetic energy of the vehicle is converted into internal energy, which exists in the system, and the total energy does not change. The Glstat file in the simulation result file is imported into HyperGraph 2D. After selecting the energy option, Ctrl in the right selection box is selected and held to select the kinetic energy, internal energy, hourglass energy, and total energy options. Apply is chosen to obtain the energy curve, as shown in Fig. 19.
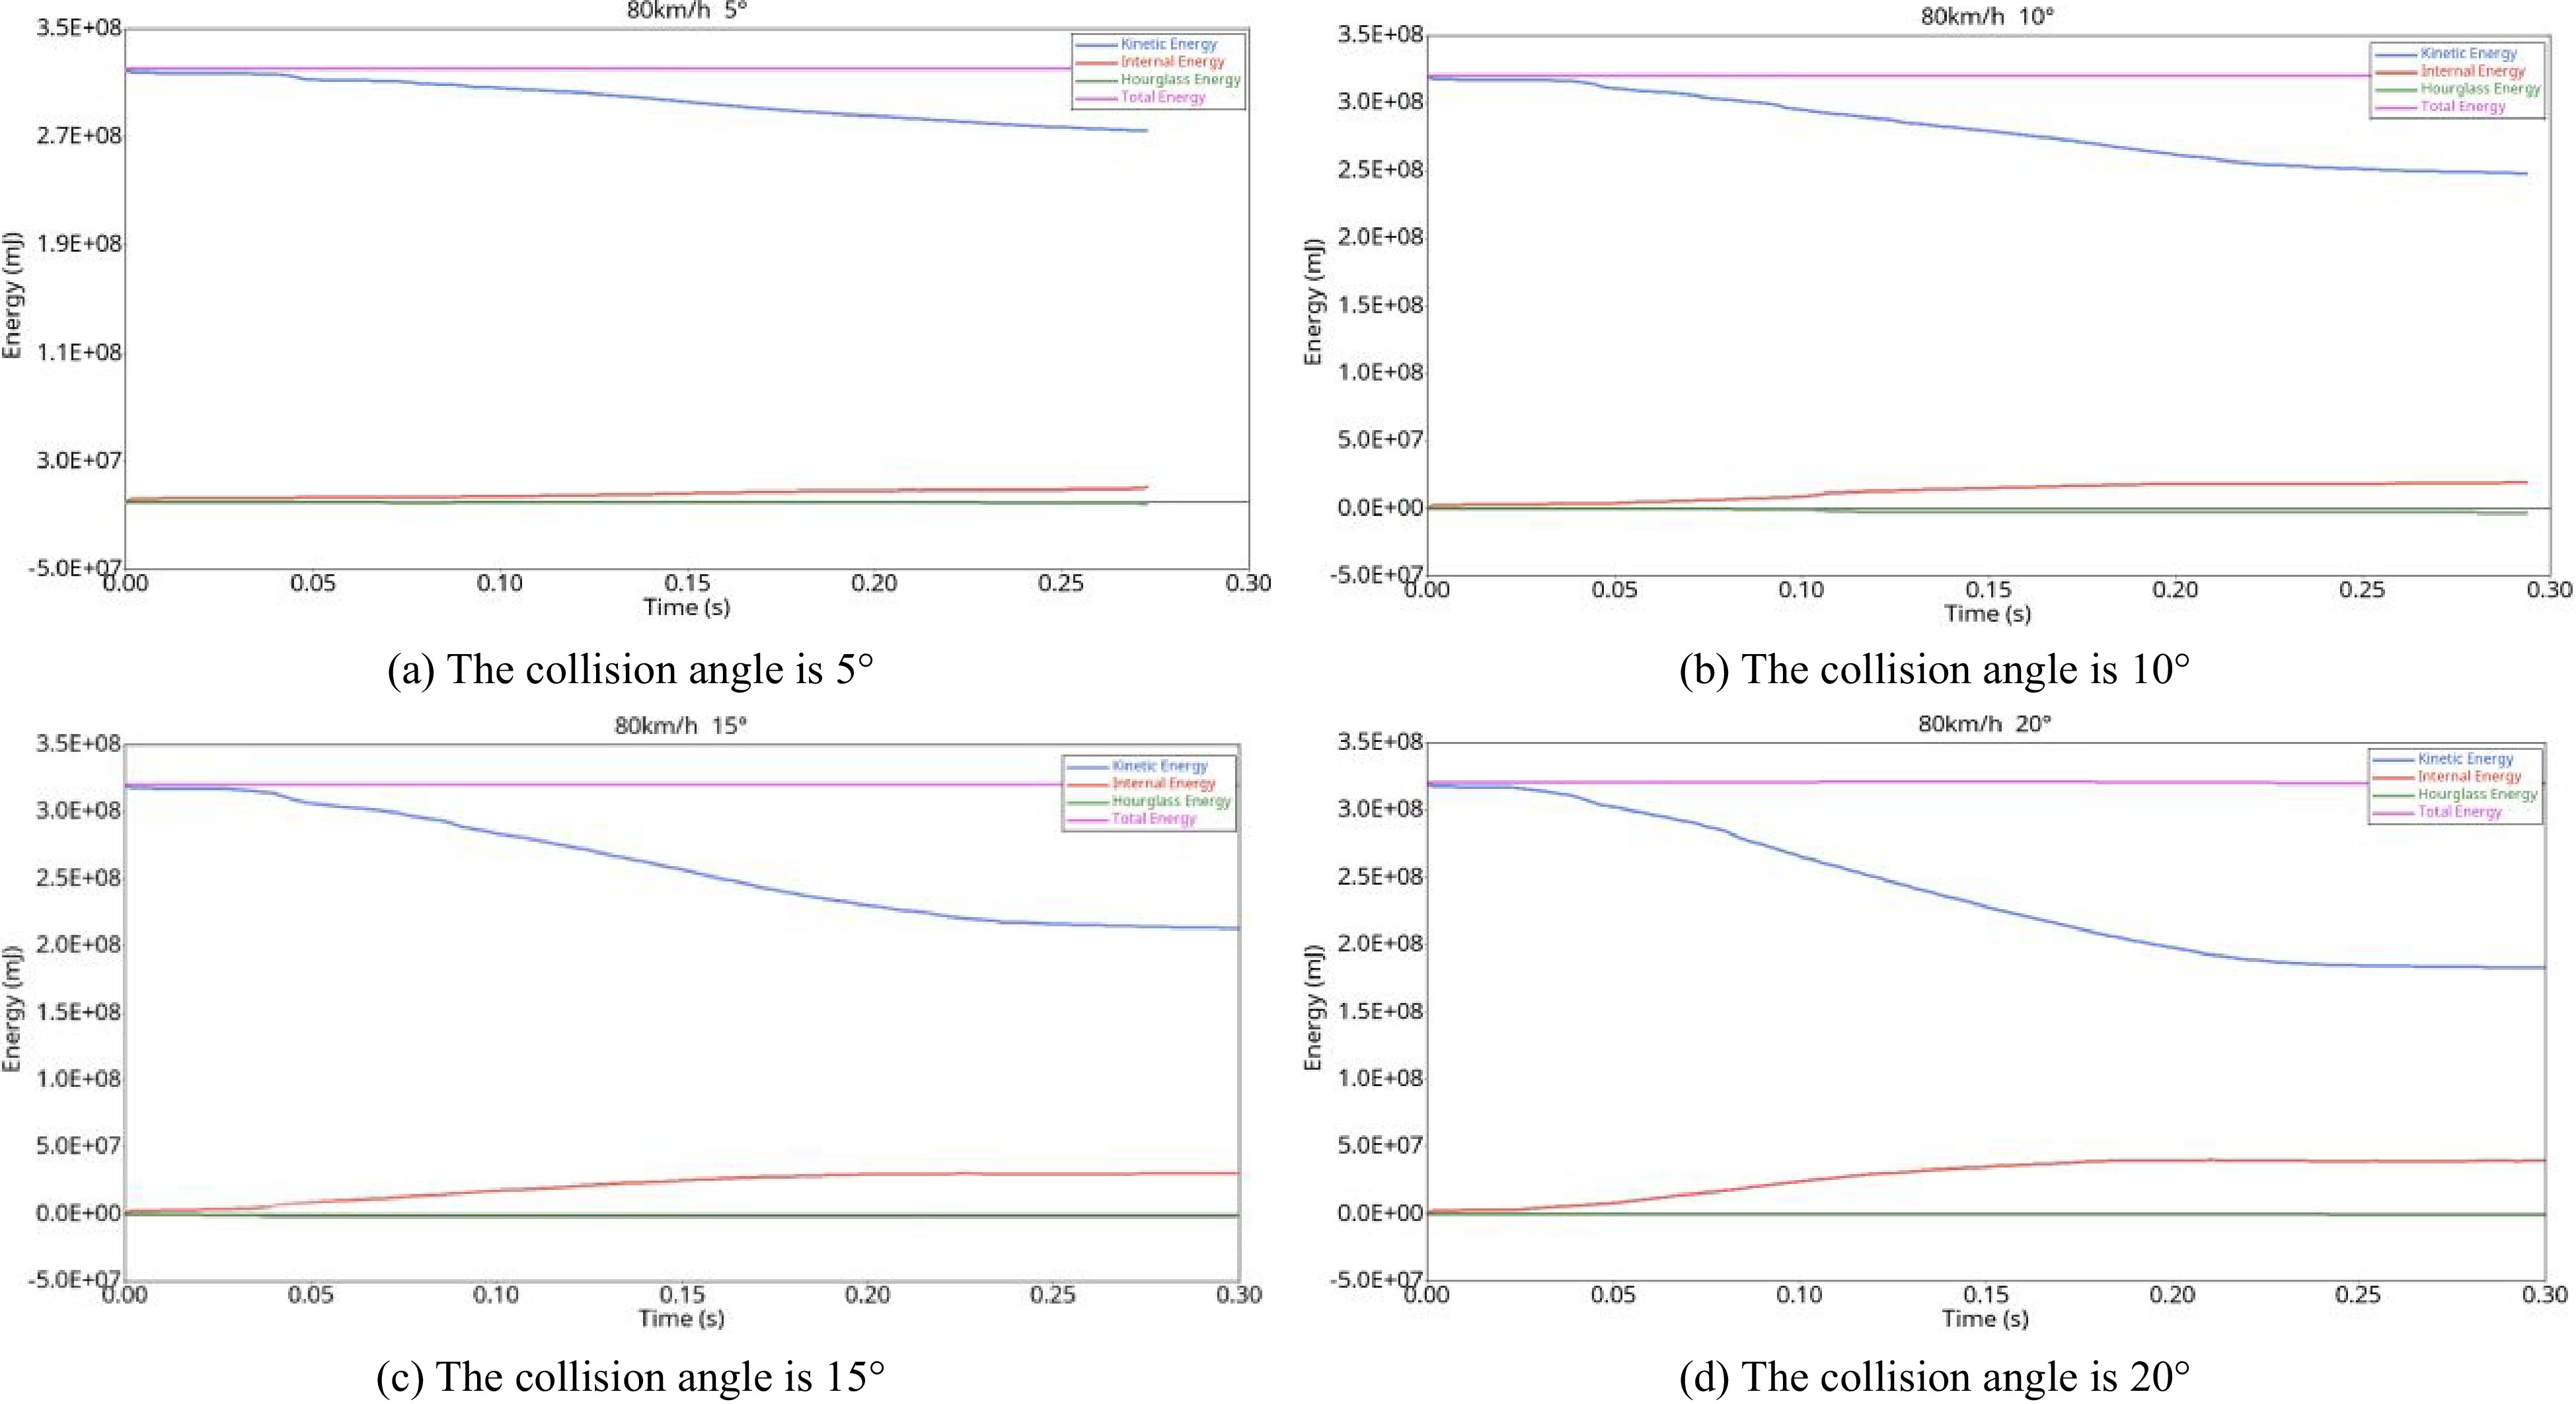
Figure 19.
Energy curve (80 km/h).
As Fig. 19 shows, with time, the kinetic energy of the system gradually decreases, the maximum kinetic energy is reached before the vehicle makes contact with the guardrail, and the internal energy is 0 J. After the collision, due to the reaction force and the friction between the body and the fence, the internal energy of the body begins to increase. At this time, the speed of the vehicle gradually decreases, and the kinetic energy decreases. The kinetic energy is transformed into internal energy and exists in the system with the process of the vehicle colliding with the guardrail, but the vehicle’s speed is not reduced to 0 km/h during the collision, so the kinetic energy will not be reduced to 0 J. When the vehicle gradually leaves the guardrail, the kinetic energy and internal energy reach stability. It can be seen from the figure that the hourglass energy almost coincides with the coordinate axis and is always less than 10% of the internal energy, so it has no obvious impact on the simulation results.
Simulation analysis of collision at a speed of 100 km/h
-
The Glstat file in the simulation result file is imported into the post-processing software HyperGraph 2D to obtain the energy curves under different collision angles, as shown in Fig. 20.
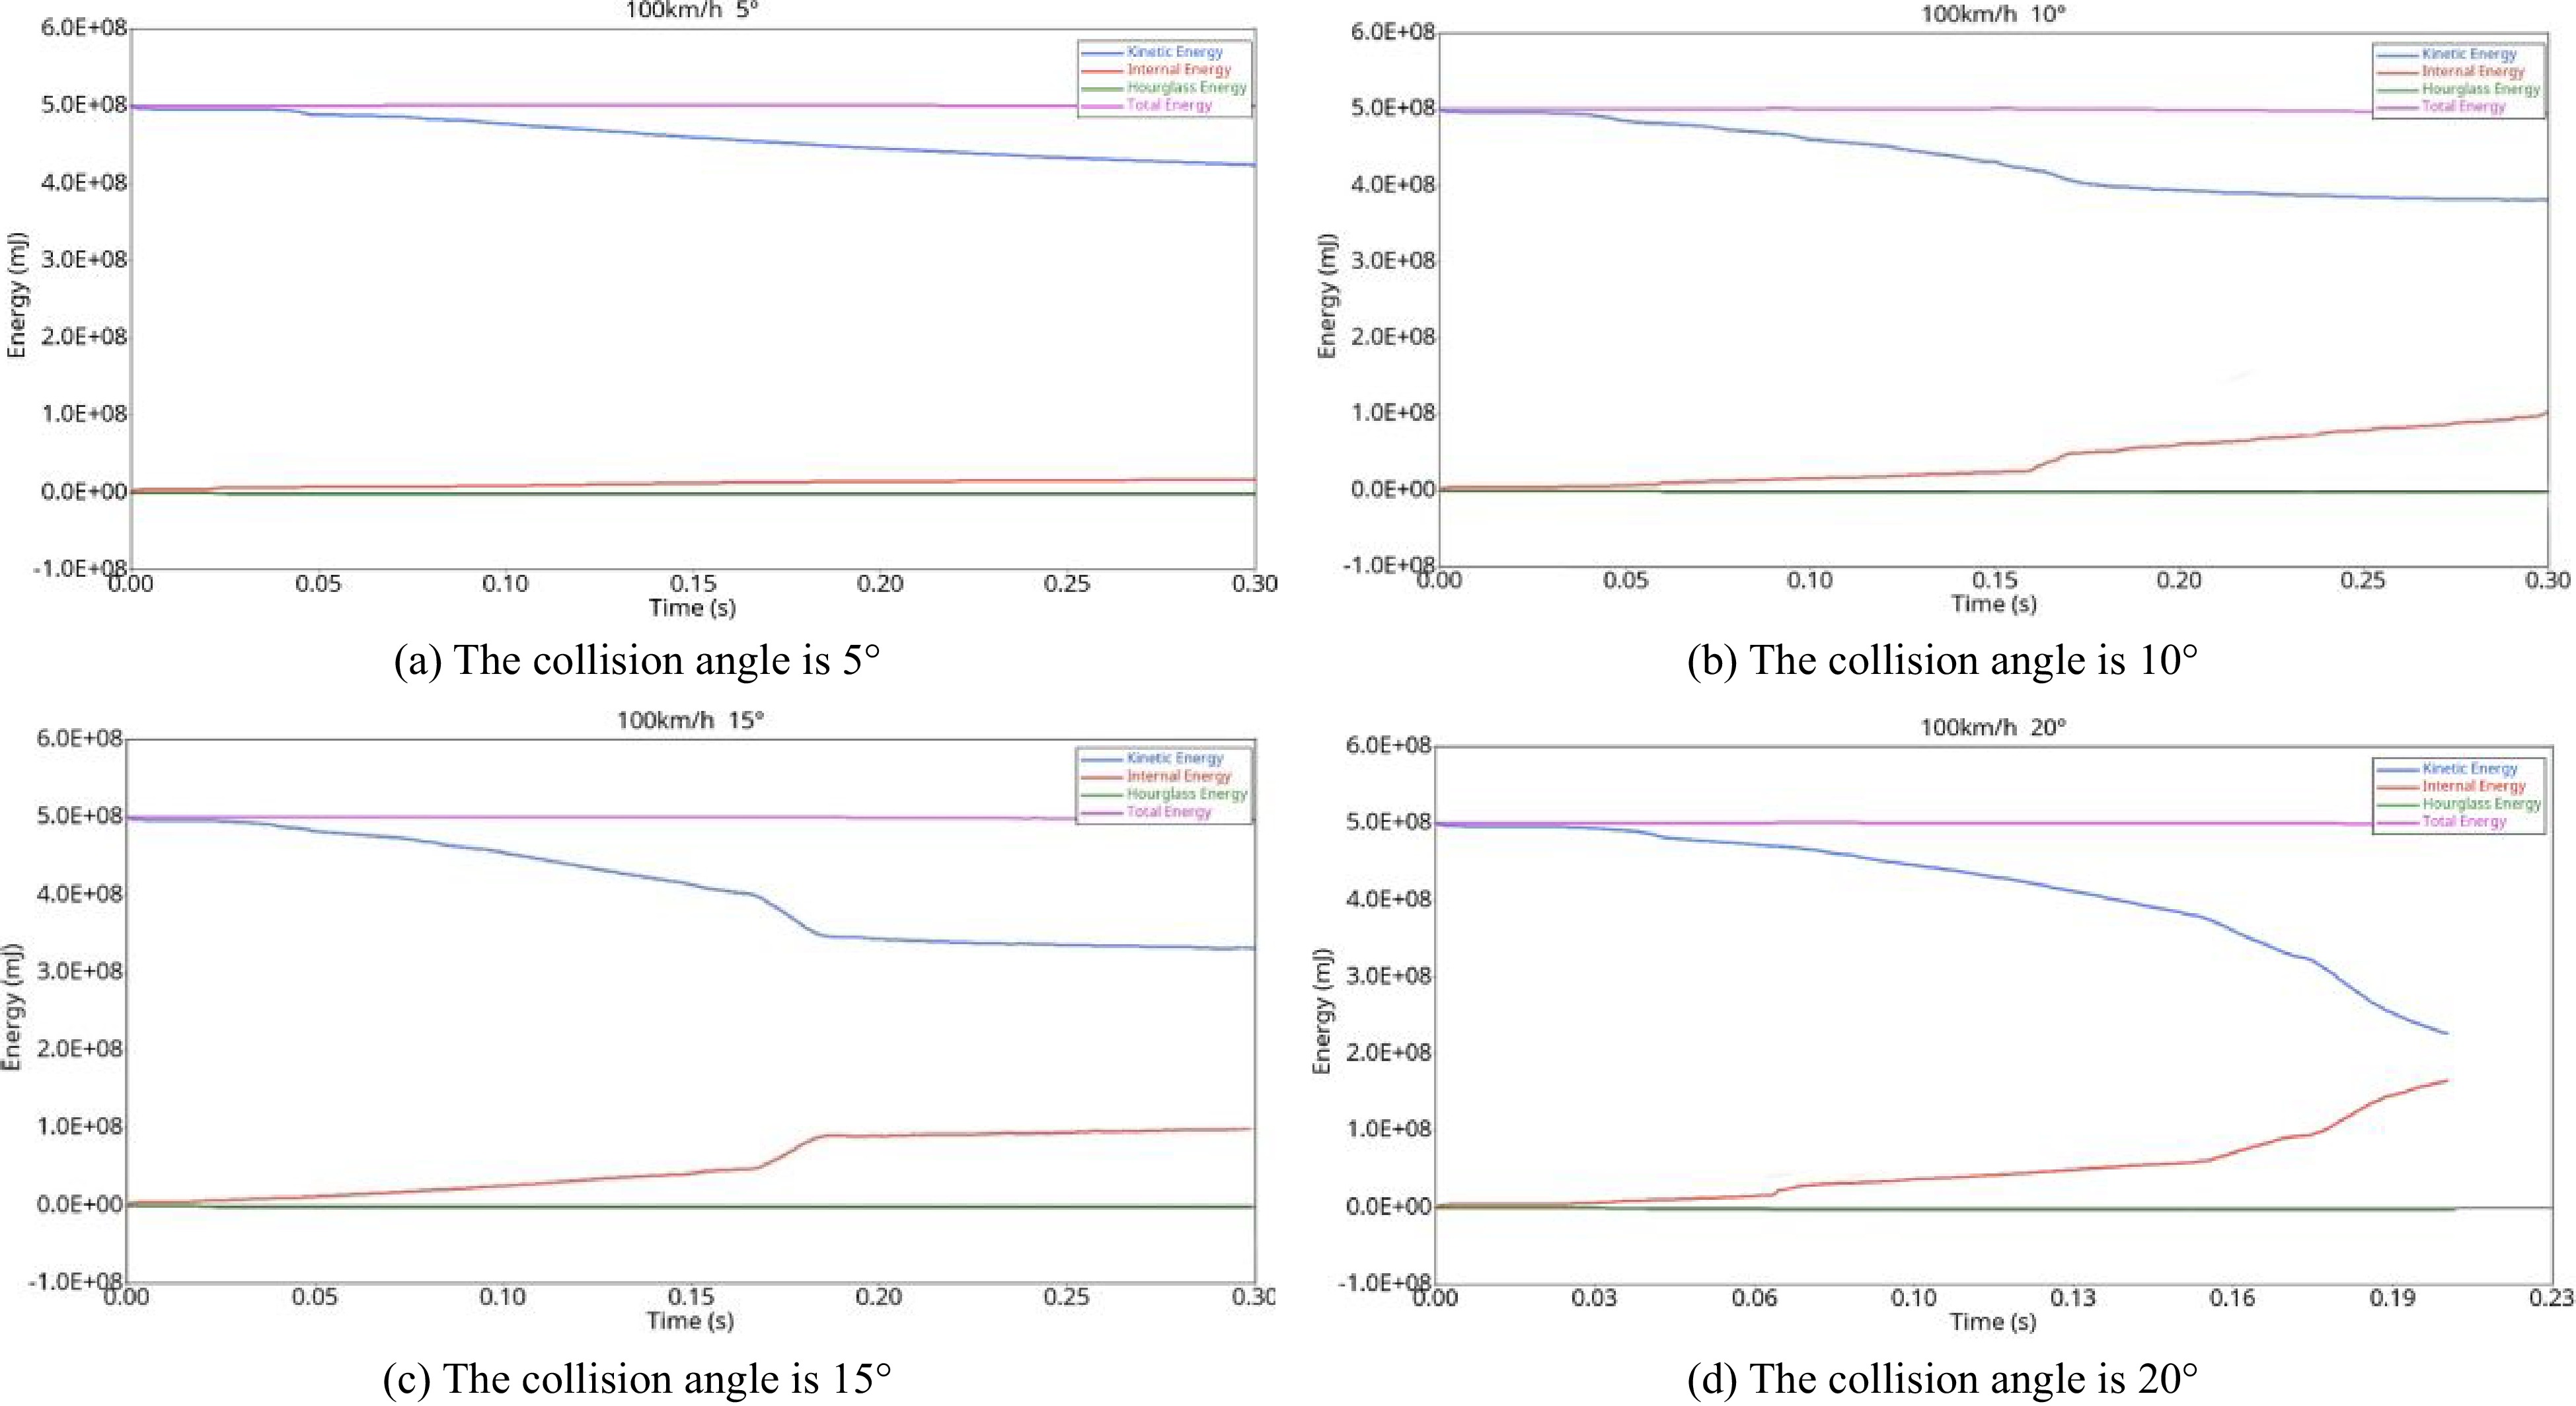
Figure 20.
Energy curves (100 km/h).
As Fig. 20 shows, the total energy and hourglass energy under the four collision angles form a stable curve, and the hourglass energy meets the industry standard of less than 10% of internal energy. Automobile collision is a process in which the total energy and hourglass energy change little, and the main process is the mutual transformation of kinetic energy and internal energy. When the collision angle is 5°, because the automobile mainly acts on the guardrail by sliding friction and the speed change is small, the internal energy is mainly generated by friction. When the collision angle is 10°, the slight deformation of the guardrail cues to vehicle collision gradually turns into sliding friction and drives the vehicle away from the guardrail, so it tends to be flat after a fluctuation. When the collision angle is 15° and 20°, the vehicle deformation is relatively serious, so the internal energy increases relatively more and even tends to intersect with the kinetic energy curve, but the total energy and hourglass energy remain unchanged, and the system energy is conserved.
Simulation analysis of collision at 120 km/h
-
The Glstat file in the simulation results is imported into HyperGraph 2D, and the energy curve of the car colliding with the guardrail at various angles at 120 km/h was plotted, as shown in Fig. 21.
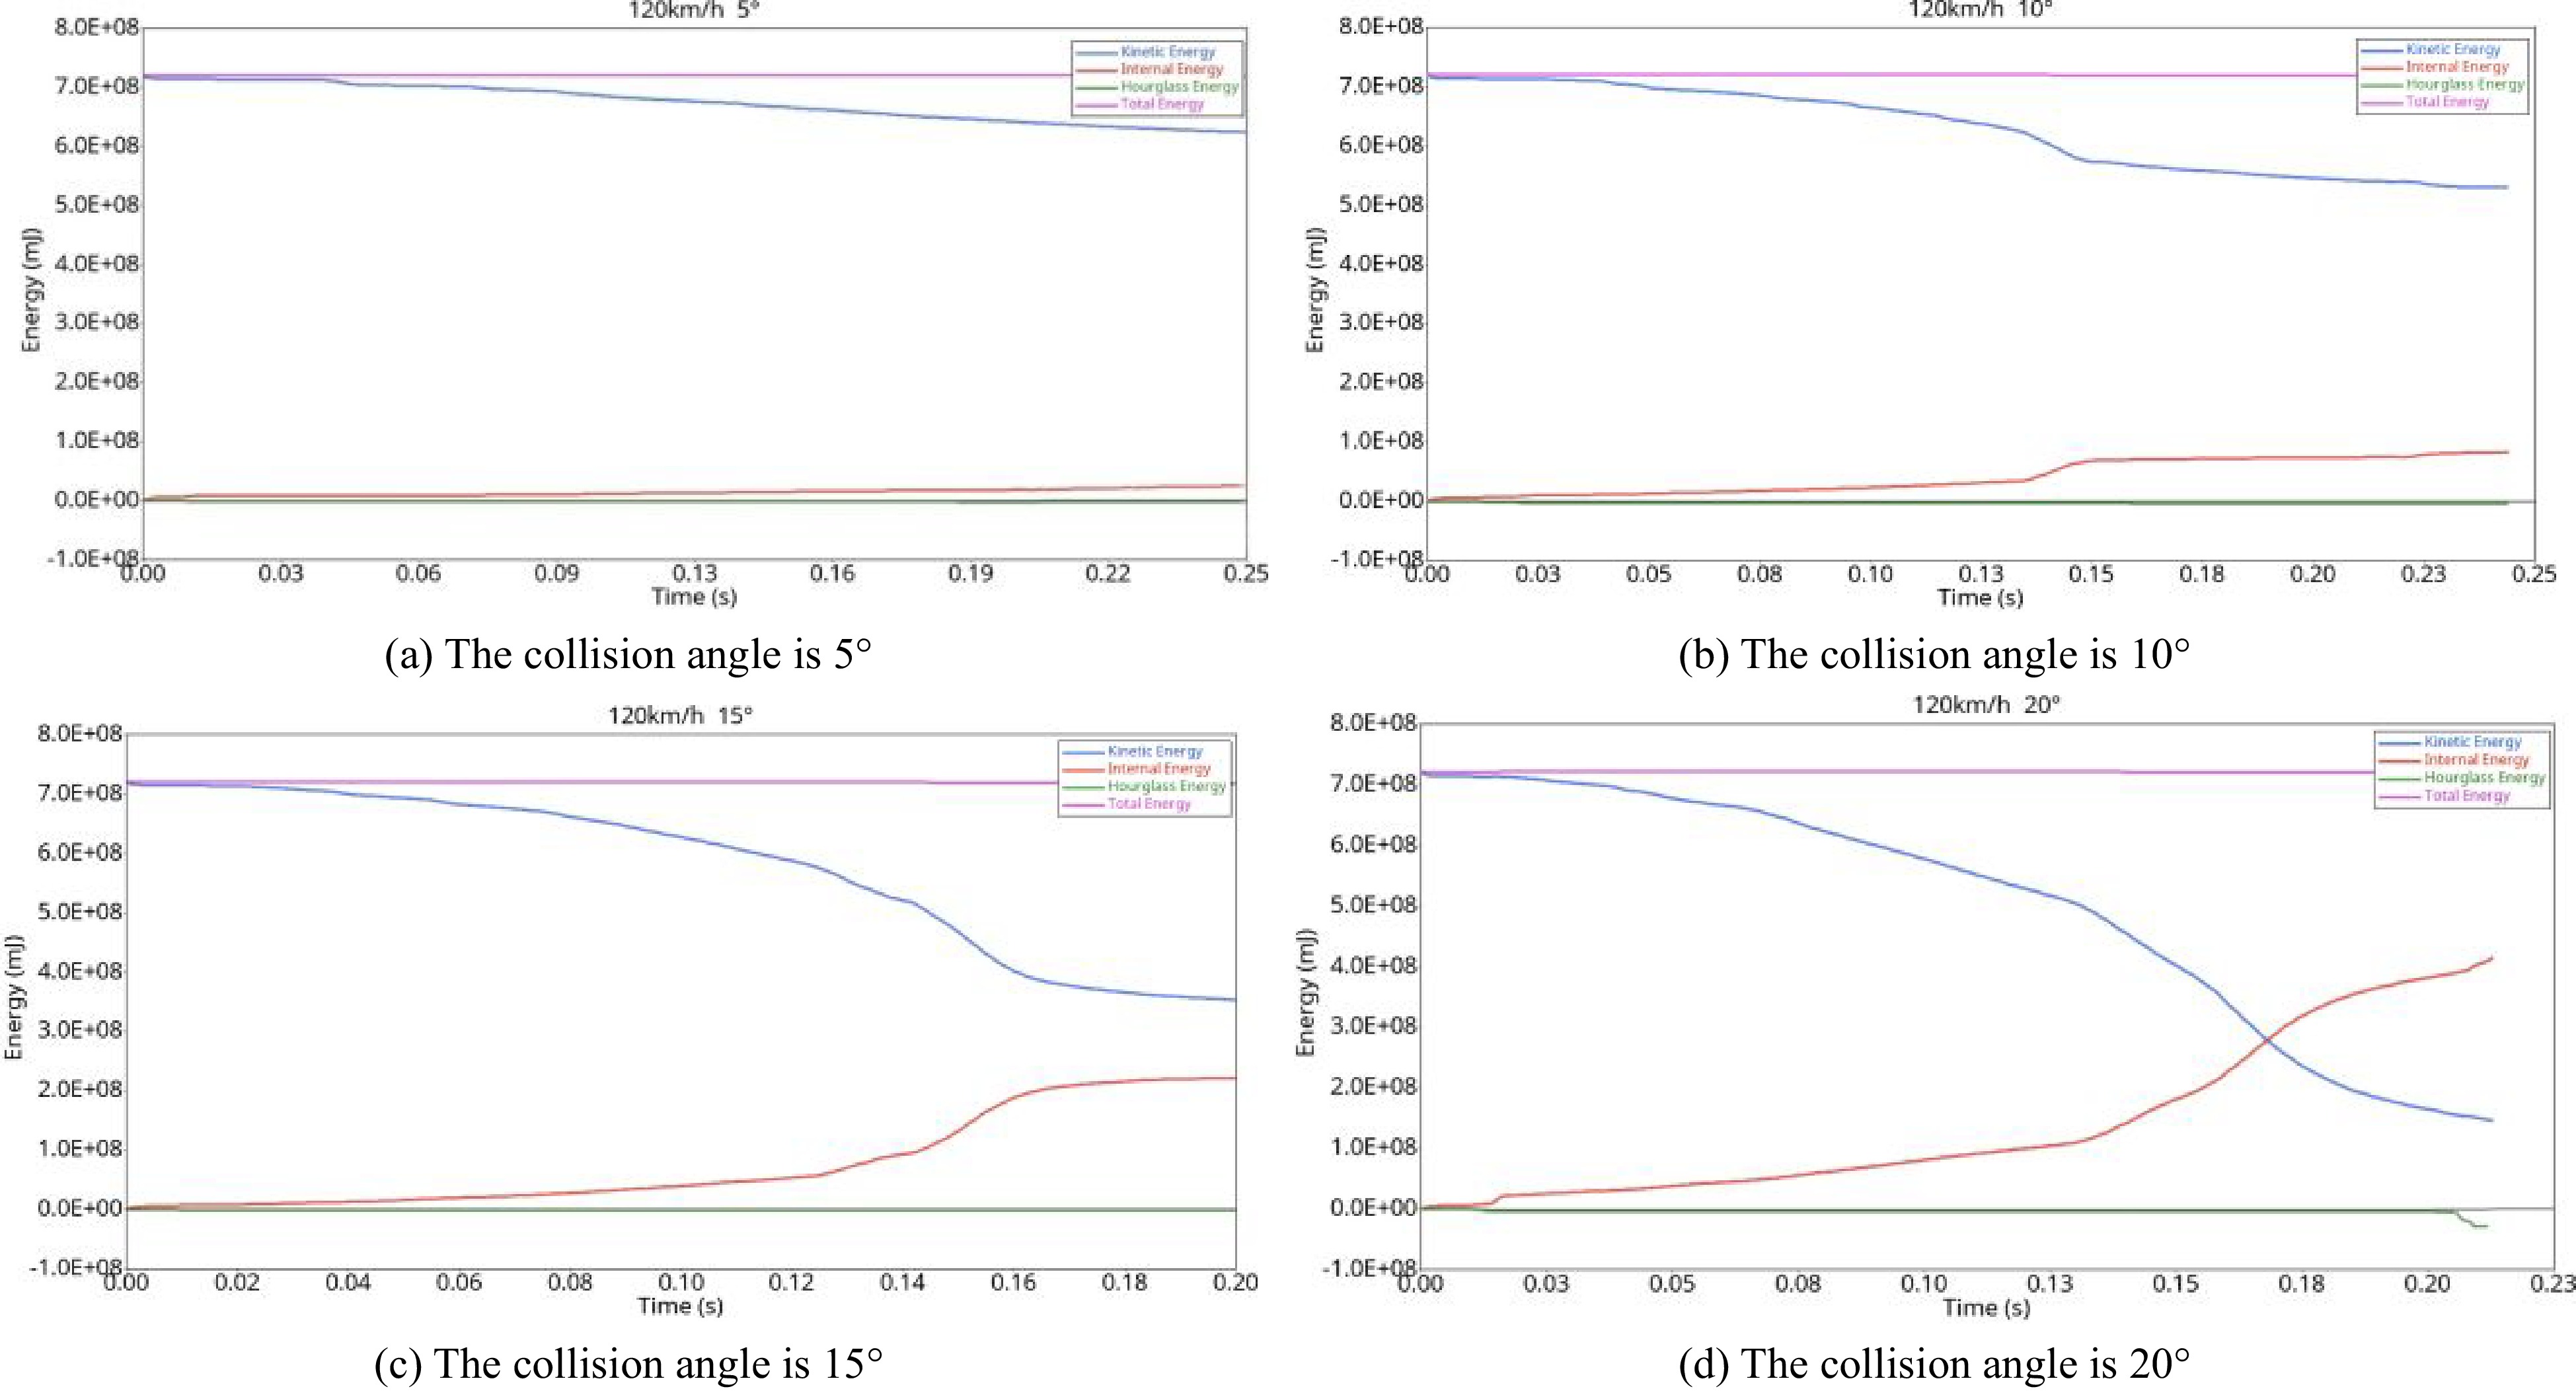
Figure 21.
Energy curve (120 km/h).
Figure 21 reflects the changes in kinetic energy, internal energy, hourglass energy, and total energy in the process of vehicles colliding with guardrails at different angles. It can be seen from the figure that the changes in total energy and hourglass energy when colliding with guardrails at four angles are not obvious. In Fig. 21d, when the collision angle is 20°, the absolute value of the hourglass energy increases to 2.01 × 10⁴ mJ after 0.2 s; at this time, the internal energy increases to 4.15 × 10⁵ mJ, and the hourglass energy accounts for 4.8% of the internal energy, which is within 10% of the industry standard, so the simulation results are effective. When the collision angle is 5°, the kinetic energy of the vehicle decreases evenly, part of it is converted into the internal energy of the vehicle, and part of it is consumed due to friction. When the collision angle is 10°, the kinetic energy and internal energy fluctuate once in 0.15 s and then tend to be flat. This is due to the scratch between the wheel and the column, which leads to the rapid reduction of vehicle deceleration kinetic energy. At this time, the wheel grid is deformed, and the internal energy increases. The kinetic energy of the vehicle tends to flatten out after the collision with the column at an angle of 15°, so the kinetic energy of the vehicle tends to flatten out after the collision with the column at an angle of 0.14 s. When the collision angle is 20°, the vehicle starts to make contact with the column at 0.13 s, and then the column is stuck between the wheel and the body. Due to the huge impact force, the body is seriously deformed, and most of the kinetic energy of the vehicle is converted into internal energy.
Analysis of collision energy at the same collision angle
-
When the collision angle is 5°, the energy transformation under different collision speeds is relatively gentle, as shown in Figs 18a, 19a, 20a & 21a. With the increase in collision speed, more kinetic energy of the vehicle is converted into internal energy, and the rest of the energy is absorbed by the guardrail in the form of deformation and friction into thermal energy for consumption.
When the collision angle is 10°, Figs 18b & 19b show that the energy conversion at collision speeds of 60 km/h and 80 km/h is relatively gentle. Figures 20b & 21b show that the kinetic energy and internal energy conversion at collision speeds of 100 and 120 km/h fluctuate. When the vehicle turns, the wheel creates friction with the column, and the wheel rubs against the column and drives the vehicle away from the guardrail, resulting in a sudden decrease in speed, tire deformation, and increase in internal energy of friction heat generation.
When the collision angle is 15°, Figs 18c & 19c show that the energy curves of the collision speeds of 60 and 80 km/h do not fluctuate, but the internal energy converted from kinetic energy increases with increasing speed. When the collision speed is 100 km/h, as shown in Fig. 20c, the kinetic energy and internal energy fluctuate due to the action of tires and columns and then recover gently. When the collision speed is 120 km/h, as shown in Fig. 21c, the car trips the guardrail and crosses the column to leave the guardrail. Serious deformation of the vehicle's body leads to a greater increase in internal energy.
When the collision angle is 20°, the energy curves of 60 and 80 km/h in Figs 18d & 19d still change smoothly, but with increasing collision speed, more kinetic energy is converted into internal energy. When the collision speed is 100 km/h in Fig. 20d, the outside of the whole wheel interacts with the column, and the tire is crushed and deformed, resulting in more kinetic energy being converted into internal energy. When the collision speed is 120 km/h in Fig. 21d, the interaction between the vehicle’s body and the column is the most obvious. When the vehicle cannot leave the guardrail, it absorbs the huge amount of energy generated by the speed through the deformation of the vehicle's body.
-
The vehicle and double wave guardrail are the research objects of this paper, HyperMesh is used to set the parameters to establish the vehicle-guardrail coupling model, LS-DYNA is used to simulate and solve the vehicle collision guardrail, and the simulation results are processed through Hyperview and HyperGraph 2D. The running track of the guardrail, the maximum lateral displacement of the guardrail, the change in vehicle acceleration and energy when the collision angle is 5°, 10°, 15°, and 20° when the vehicle is driving at 60, 80, 100, and 120 km/h are analyzed, and the following conclusions are drawn:
(1) The collision speed is constant, the collision angle increases and the collision angle is constant, the collision speed increases, the collision between the car and the guardrail has the following rule. The more forward the position and time point of the guardrail started to produce lateral displacement, the greater the maximum lateral displacement of the guardrail. The position where the car body is seriously damaged changes from the body to the right front wheel position, and the acceleration fluctuation range increases until it exceeds the 20 g safety standard. According to the severity of the deformation between the guardrail and the vehicle, more vehicle kinetic energy is converted into internal energy of the system.
(2) When the vehicle's speed is 100 km/h and the collision angle is 15° and 20°, when the vehicle's speed is 120 km/h and the collision angle is 10°, 15°, and 20°, the vehicle acceleration exceeds the safety standard. When the vehicle's speed is 100 km/h and the collision angle is 20°, the vehicle slightly trips and climbs the guardrail. When the vehicle's speed is 120 km/h and the collision angle is 15° and 20°, the tripping between the vehicle and the guardrail is obvious, and the vehicle climbs the guardrail and turns laterally. When installing guardrails on the roadside with a speed limit of more than 100 km/h, it can be considered to reduce the spacing between columns, use three-wave beams, etc. to improve the protective performance of guardrails, so as to ensure the safety of passengers.
(3) When the vehicle's speed is 60, 80 km/h and the collision angle is 5°, 10°, 15°, and 20°, when the vehicle’s speed is 100 km/h and the collision angle is 5° and 10°, when the vehicle's speed is 120 km/h and the collision angle is 5°, the deformation of the vehicle and guardrail is small, and the acceleration fluctuation range is within the specified value range. The guardrail can realize the protection performance and guidance function to ensure the safety of passengers.
-
The paper uses the finite element simulation software to conduct a detailed analysis of the collision conditions of the double-wave guardrail with collision speeds of 60, 80, 100, 120 km/h, and the collision angle of 5°, 10°, 15°, 20°. In the future, further research will be carried out on the following aspects according to the current limitations of the paper:
(1) In this paper, only one car model is analyzed in the crash test, and further analysis and discussion can be made on the safety of crash barriers of different car models such as passenger cars, trucks and trucks.
(2) In consideration of safety issues, the paper does not conduct crash analysis in combination with real vehicle experiments. The next step will consider further research on the protective performance of guardrails in combination with real vehicle experiments.
(3) The paper makes a detailed analysis of the deformation and lateral displacement of guardrail under different collision conditions, the resultant acceleration of the vehicle and the system energy, but does not put forward countermeasures for existing safety problems. In the future, the optimization of guardrail can be further discussed in combination with the existing safety problems in the collision process.
This research was supported by the Key Lab of Road Structure & Material in Chang’an University, Ministry of Transport (grant number 300102212504), and by the National Natural Science Foundation of China (grant number 71771047).
-
The authors declare that they have no conflict of interest.
- Copyright: © 2023 by the author(s). Published by Maximum Academic Press, Fayetteville, GA. This article is an open access article distributed under Creative Commons Attribution License (CC BY 4.0), visit https://creativecommons.org/licenses/by/4.0/.
-
About this article
Cite this article
He Y, Wan Y, Wei K, Feng J, Quan C. 2023. Simulation research on collisions between highway corrugated beam guardrails and vehicles based on LS-DYNA. Digital Transportation and Safety 2(1):52−66 doi: 10.48130/DTS-2023-0005 

Simulation research on collisions between highway corrugated beam guardrails and vehicles based on LS-DYNA
- Received: 02 December 2022
- Accepted: 12 March 2023
- Published online: 30 March 2023
Abstract: To explore the safety of highway traffic operations, the vehicle state and guardrail deformation during highway guardrail collisions are simulated and analyzed. The vehicle-guardrail collision is simulated by finite element software such as LS-DYNA and HyperMesh. The vehicle speed settings are 60, 80, 100 and 120 km/h, and the collision angles are 5°, 10°, 15° and 20°. The guardrail deformation, vehicle acceleration and energy changes under different collision speeds and angles are studied. The research results show that at the same collision speed, an increase in the collision angle causes more serious damage to the vehicle, a greater transverse displacement of the guardrail, and a greater range of car acceleration fluctuations. When the collision angle is the same, an increase in the collision speed causes greater lateral displacement of the guardrail, a greater vehicle acceleration fluctuation range, and more serious vehicle damage. The results of the study can provide a reference for demonstrating highway guardrail safety.