-

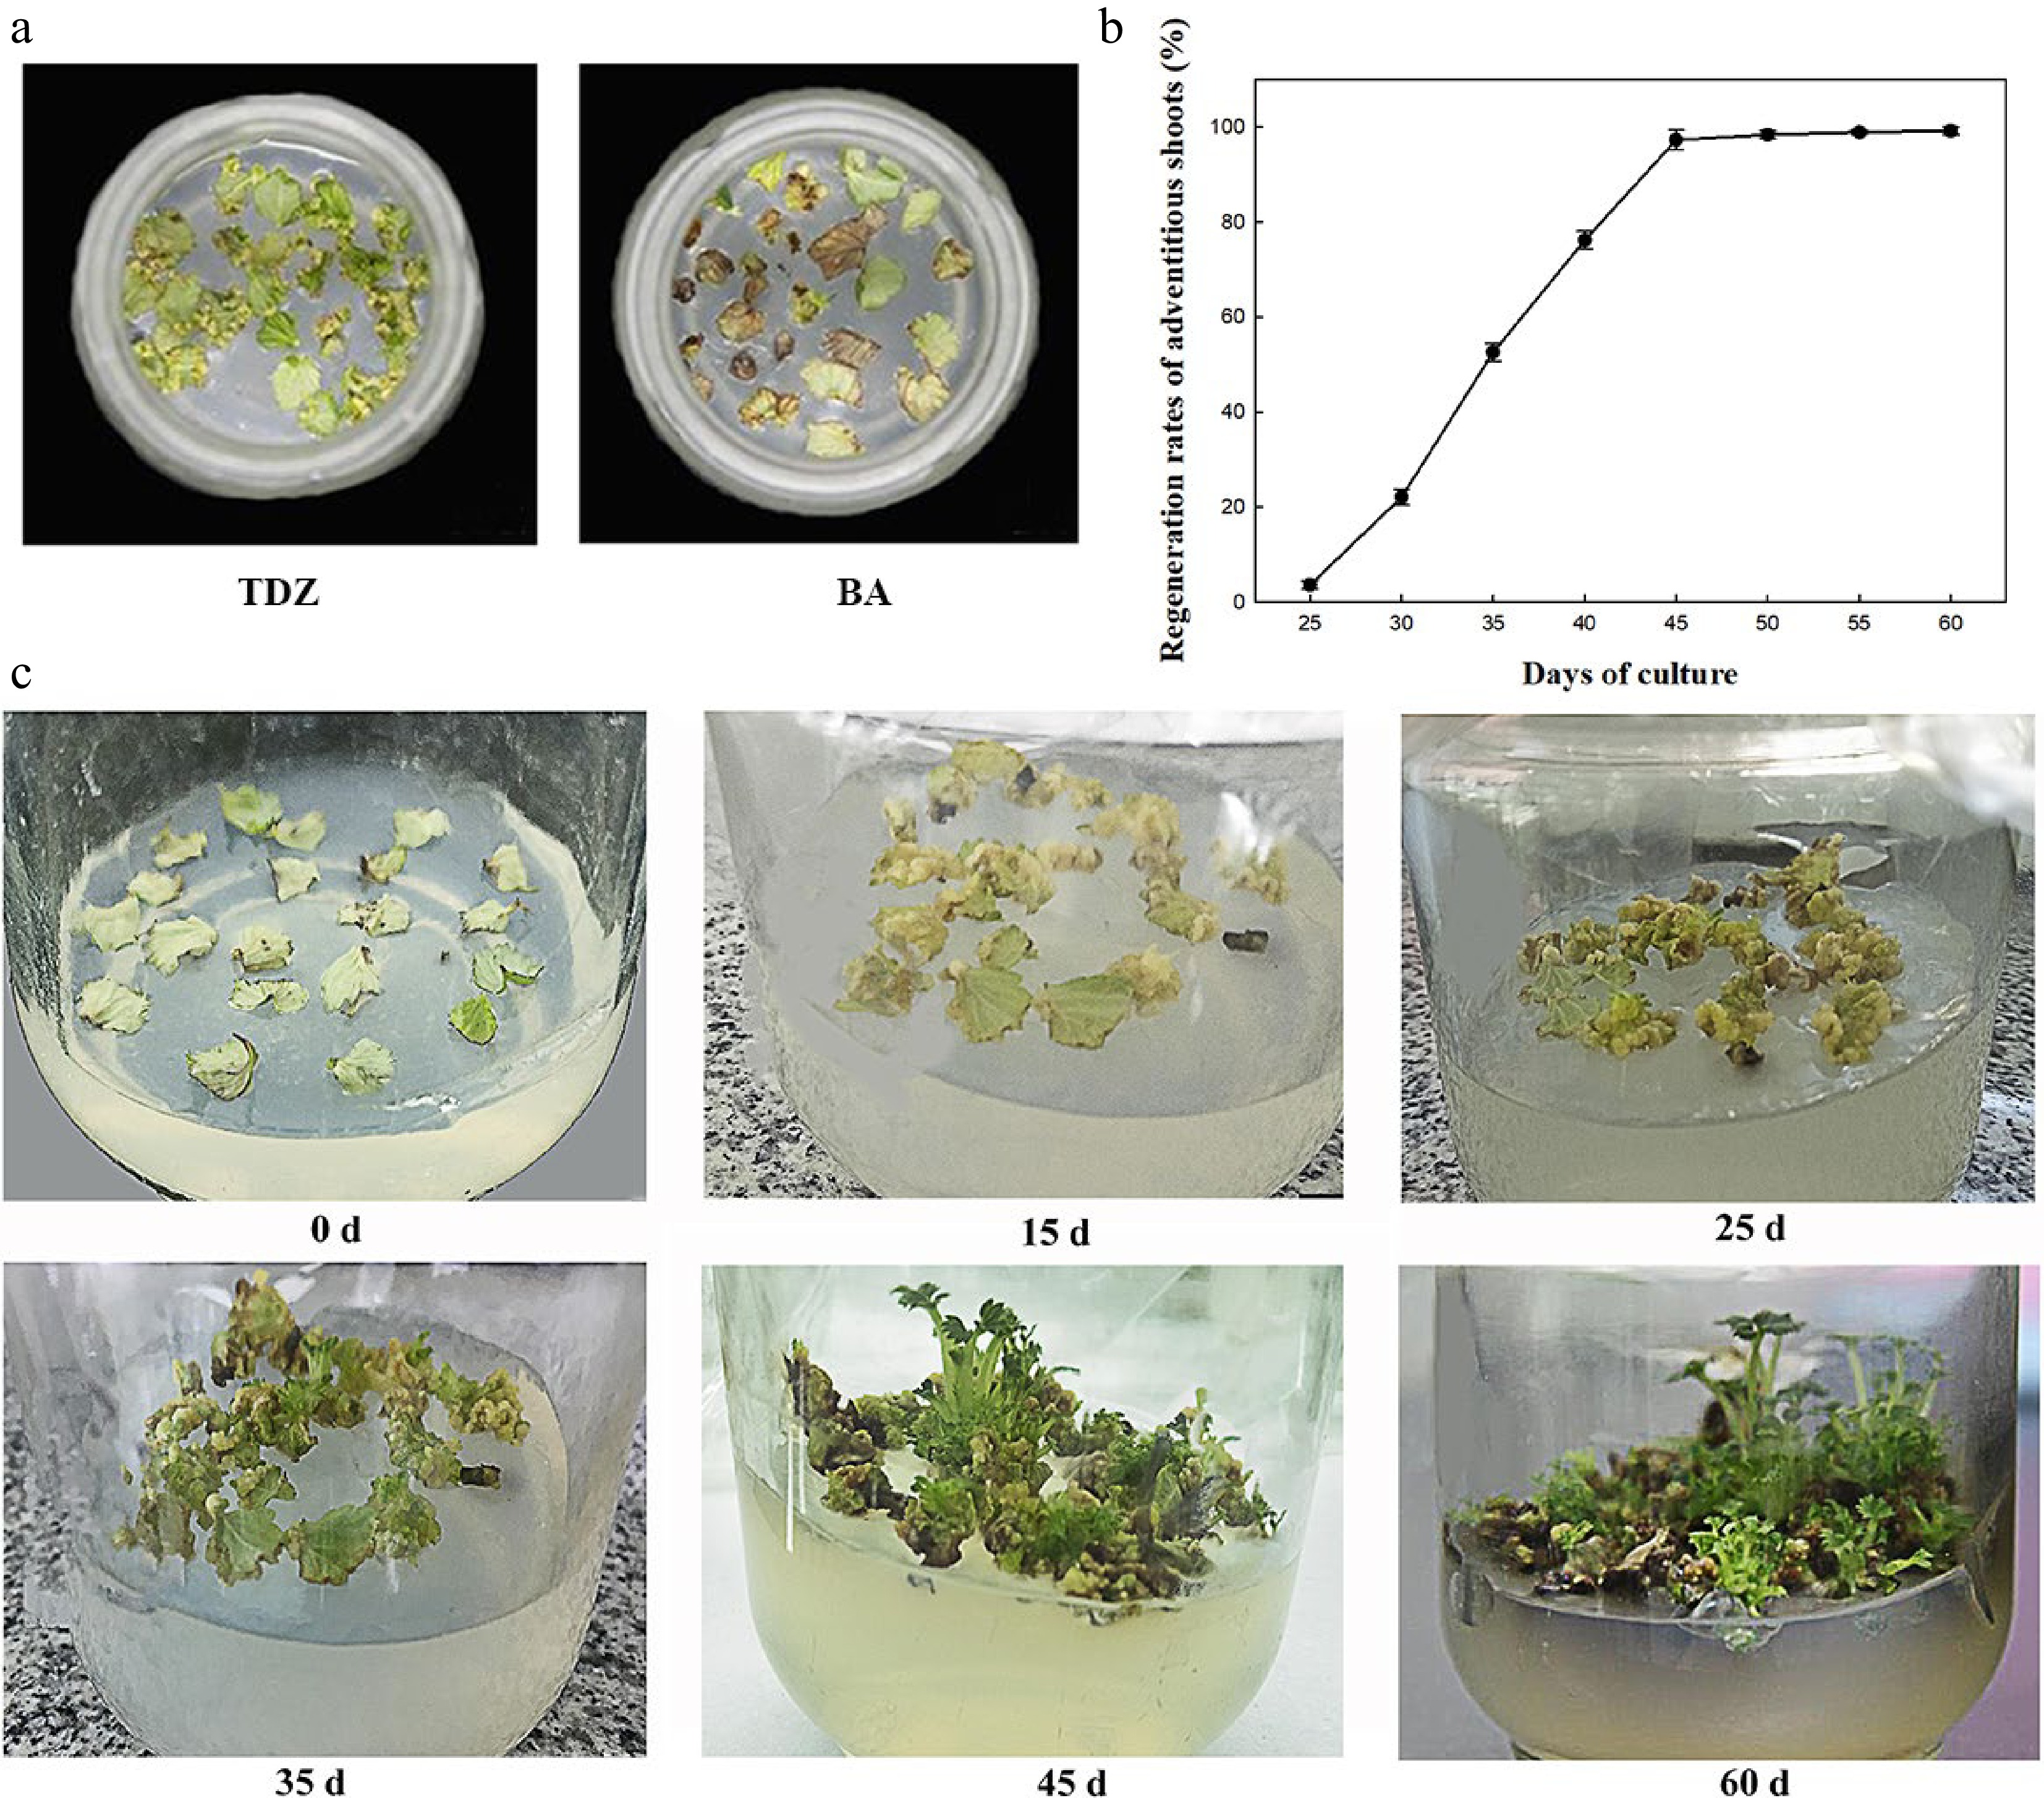
Figure 1.
Effect of PGRs on regeneration of F. nilgerrensis leaf discs. (a) Effects of TDZ and 6-BA on callus formation at 25 d of culture. (b) Shoot regeneration curve cultured on A2C2 medium for different days. (c) Shoot regeneration process cultured on A2C2 medium for different days.
-

Figure 2.
Effects of CH concentrations and dark culture duration on the regeneration of F. nilgerrensis leaf discs at 45 d of culture. (a) The callus weight and shoot regeneration rates under different CH concentrations and dark culture duration. (b) The callus growth curve on the media containing 0.0 and 0.5 g·L−1 CH. (c) Effect of dark culture for 0, 7, 14, 21, and 28 d on regeneration. (d) The effect of 0.0, 0.2, 0.5 , 0.7, and 1.0 g·L−1 CH on regeneration. Bars indicate the S.E. of the means; different lowercase letters indicate significant differences among the treatments according to the LSD test (P < 0.05).
-

Figure 3.
Paraffin section observation of callus obtained from F. nilgerrensis leaf discs. (a) Type I callus (left) and its cells (right, black arrow), bar = 100 μm. (b) Type II callus (left) and its cells (right, black arrow), bar = 100 μm.
-

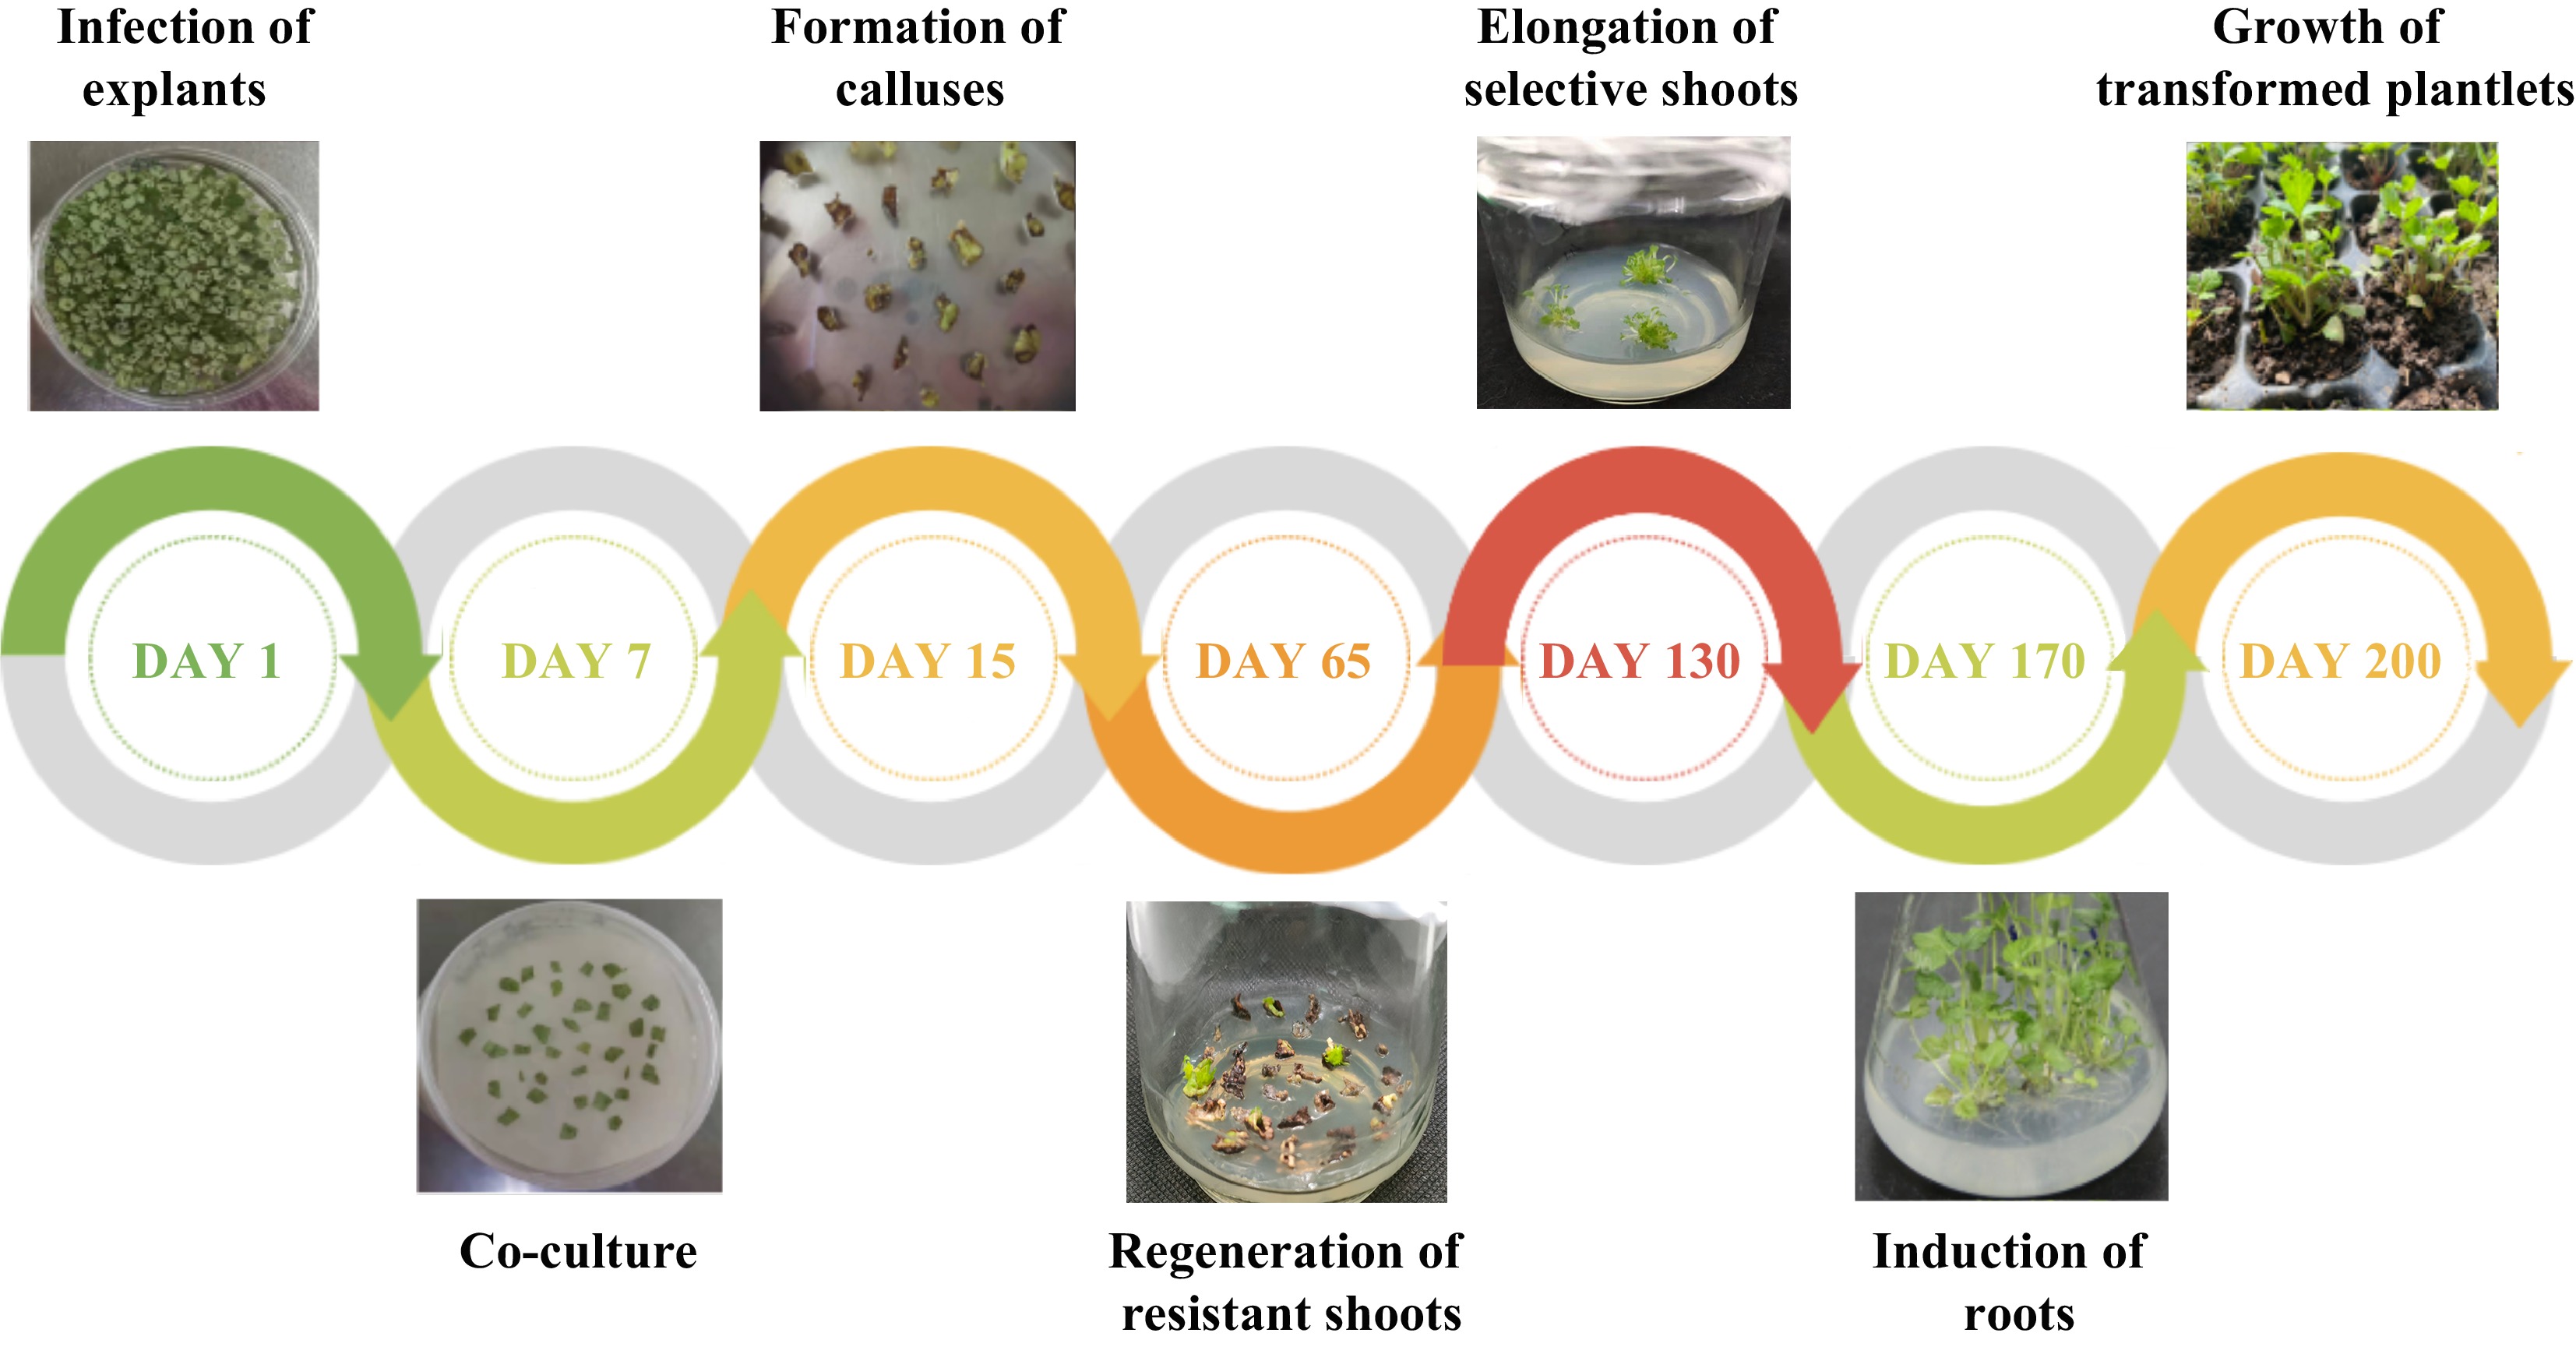
Figure 4.
Agrobacterium-mediated genetic transformation of F. nilgerrensis leaf discs.
-

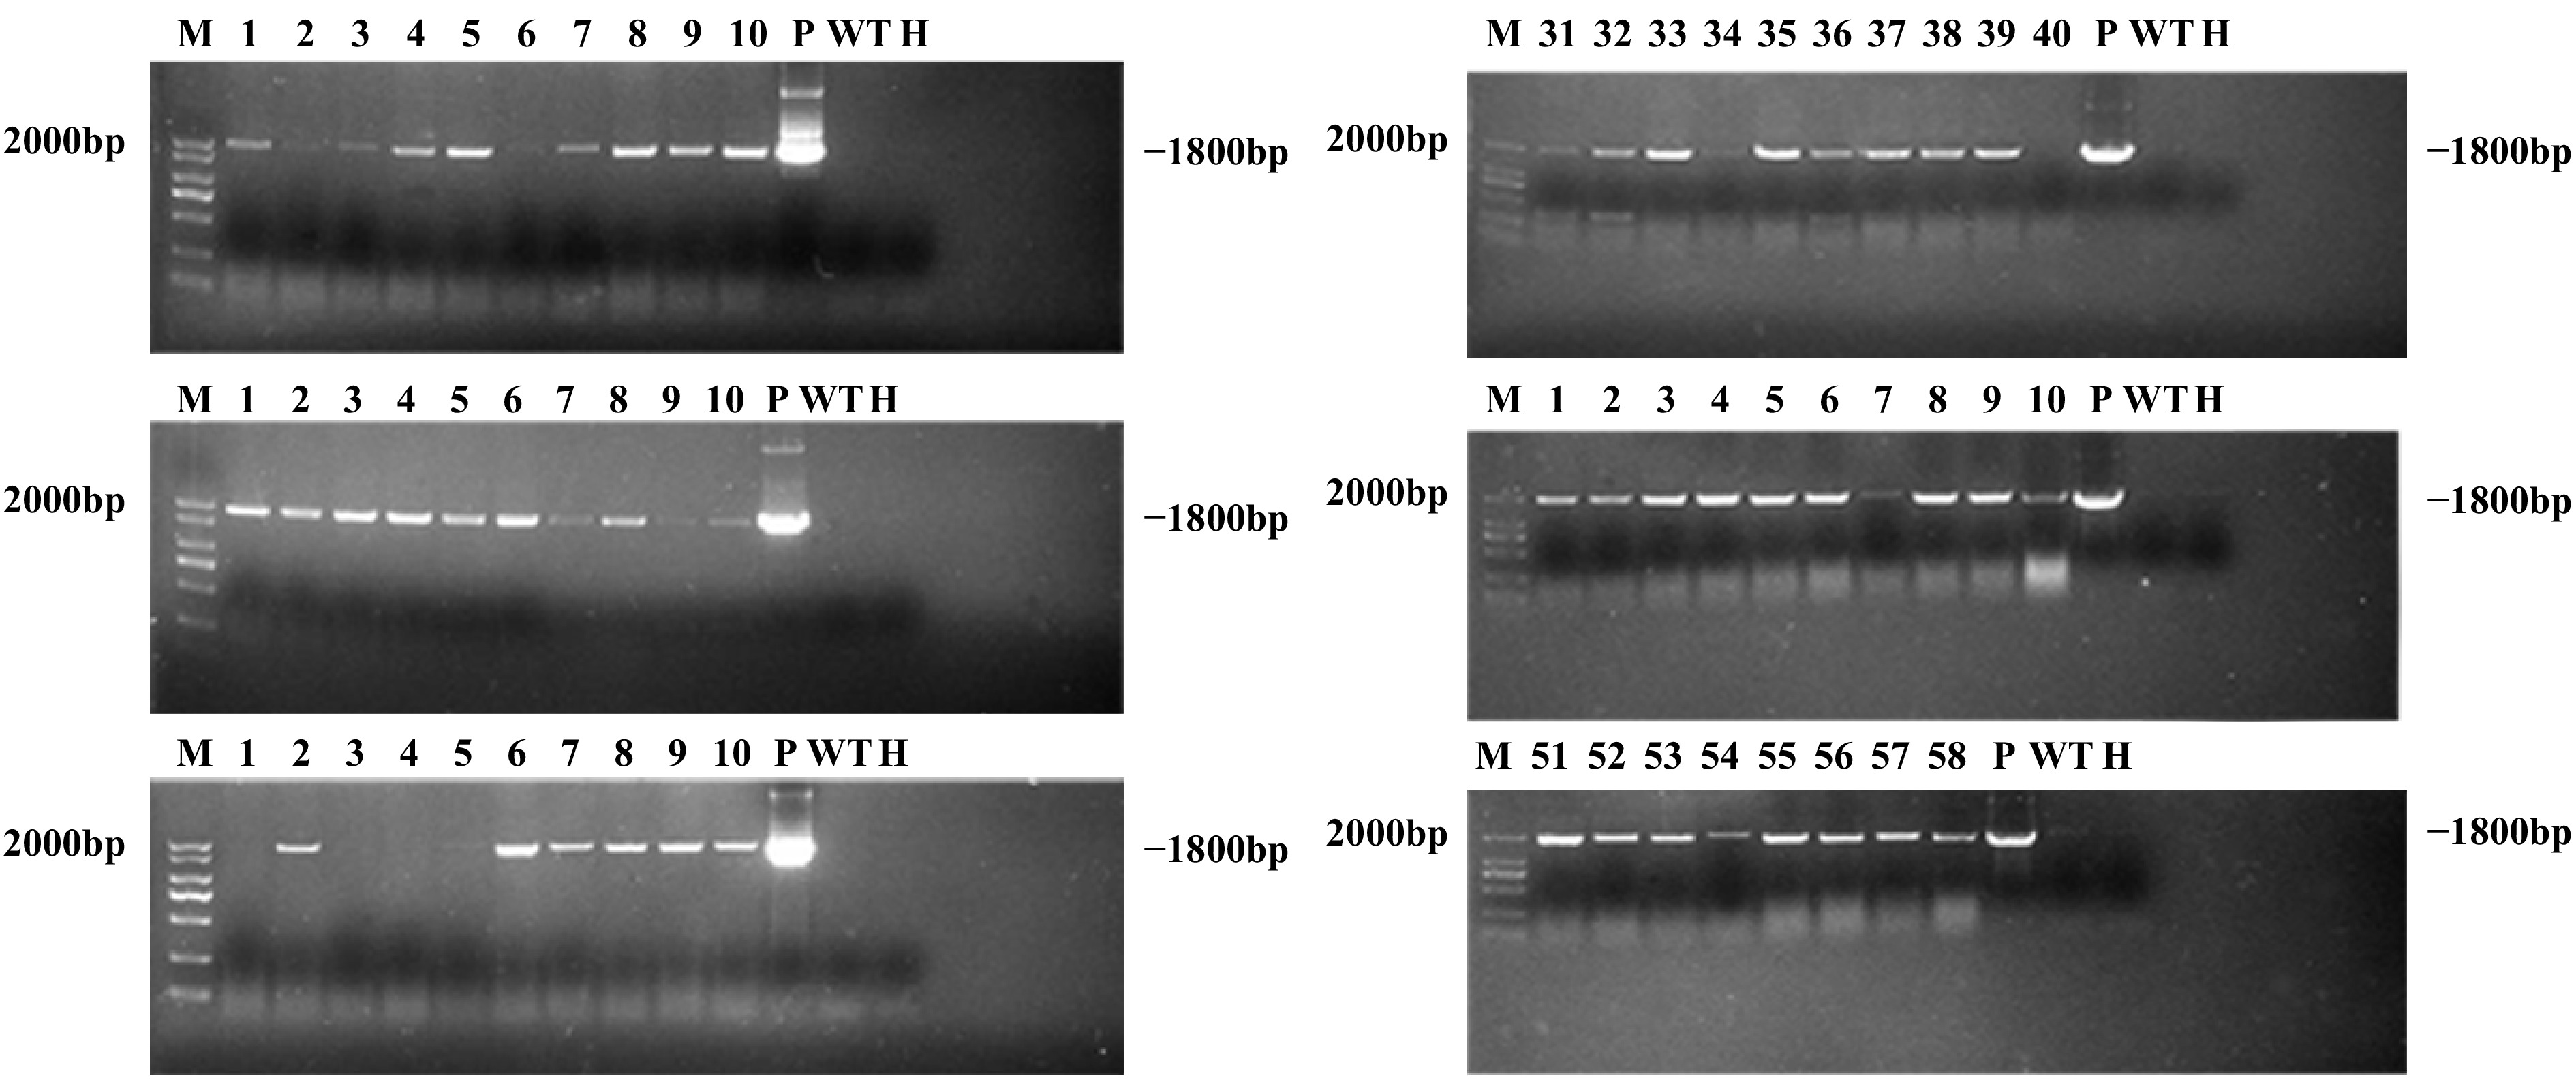
Figure 5.
PCR analysis of GUS gene in transgenic lines. Lane M, DNA marker; Lanes 1–58, 58 putative transgenic lines; Lane WT, wild-type plant; Lane P, plasmid control; Lane H, ddH2O.
-

Figure 6.
Histochemical GUS staining of transgenic lines. (a) Wild-type plant. (b)–(d) PCR-positive transgenic plants.
-

Figure 7.
Transformants regeneration on medium with Kan. (a) Leaf regeneration of PCR-positive transgenic lines under Kan selective pressure. (b) Non-transformed plants (control).
-
Media code Concentration (mg·L−1) Callus induction rate (%) Shoot regeneration rate (%) Shoot no. per explant TDZ BA IBA A1C1 1 0.1 21.1 ± 1.91 i 9.1 ± 2.08 j 0.11 ± 0.04 gh A1C2 1 0.2 94.2 ± 2.14 ab 37.8 ± 1.91 e 0.40 ± 0.09 e A1C3 1 0.3 61.1 ± 1.91 e 0.0 ± 0.00 l 0.0 ± 0.00 i A2C1 2 0.1 80.0 ± 2.00 c 79.0 ± 3.60 c 1.47 ± 0.08 c A2C2 2 0.2 97.8 ± 0.57 a 97.3 ± 0.58 a 2.52 ± 0.09 a A2C3 2 0.3 64.5 ± 3.87 de 4.4 ± 1.93 k 0.07 ± 0.03 hi A3C1 3 0.1 25.6 ± 1.96 h 17.8 ± 1.91 h 0.19 ± 0.02 fg A3C2 3 0.2 92.1 ± 1.82b 89.5 ± 0.50 b 1.96 ± 0.07 b A3C3 3 0.3 62.2 ± 3.89 e 20.3 ± 0.58 g 0.25 ± 0.09 f A4C1 4 0.1 67.8 ± 1.91 d 0.0 ± 0.00 l 0.0 ± 0.00 i A4C2 4 0.2 45.6 ± 1.96 g 0.0 ± 0.00 l 0.0 ± 0.00 i A4C3 4 0.3 7.1 ± 2.54 j 0.0 ± 0.00 l 0.0 ± 0.00 i B1C1 1 0.1 5.6 ± 1.93 j 0.0 ± 0.00 l 0.0 ± 0.00 i B1C2 1 0.2 5.6 ± 1.93 j 0.0 ± 0.00 l 0.0 ± 0.00 i B1C3 1 0.3 27.8 ± 1.91 h 0.0 ± 0.00 l 0.0 ± 0.00 i B2C1 2 0.1 27.8 ± 1.91 h 0.0 ± 0.00 l 0.0 ± 0.00 i B2C2 2 0.2 47.7 ± 1.31 fg 14.3 ± 2.31 i 0.13 ± 0.05 gh B2C3 2 0.3 67.8 ± 1.91 d 66.7 ± 3.51 d 0.6 ± 0.10 d B3C1 3 0.1 25.2 ± 2.54 h 0.0 ± 0.00 l 0.0 ± 0.00 i B3C2 3 0.2 4.5 ± 1.91 j 0.0 ± 0.00 l 0.0 ± 0.00 i B3C3 3 0.3 50 ± 3.30 f 34.4 ± 1.96 f 0.35 ± 0.08 e B4C1 4 0.1 5.6 ± 1.91 j 0.0 ± 0.00 l 0.0 ± 0.00 i B4C2 4 0.2 8.9 ± 5.06 j 0.0 ± 0.00 l 0.0 ± 0.00 i B4C3 4 0.3 8.3 ± 1.67 j 0.0 ± 0.00 l 0.0 ± 0.00 i Values represent mean ± SE; Different lowercase letters indicate significant differences among treatments according to the LSD test (P < 0.05). Table 1.
Effect of different PGRs on regeneration of F. nilgerrensis leaf discs at 45 d of culture.
-
CH concentration (g·L−1) No. of leaf discs Rate of callus induction (%) Rate of Type I callus (%) Rate of Type II callus (%) 0.0 60 75.56 ± 0.96 c 6.11 ± 0.96 e 69.44 ± 0.96 a 0.2 60 91.11 ± 0.96 b 81.11 ± 0.96 b 10.00 ± 1.67 d 0.5 60 96.67 ± 1.67 a 87.23 ± 1.93 a 9.44 ± 1.93 d 0.7 60 71.11 ± 1.92 d 21.67 ± 1.67 c 49.45 ± 2.54 b 1.0 60 62.78 ± 0.96 e 17.22 ± 0.96 d 45.56 ± 1.93 c Values represent mean ± SE; Different lowercase letters indicate significant differences among treatments according to the LSD test ( P < 0.05). Table 2.
The rates of Type I and II callus on the medium with different CH concentrations of F. nilgerrensis leaf discs at 45 d of culture.
-
Kan concentration (mg·L−1) No. of leaf discs Rate of regeneration (%) 0 60 98.32 ± 2.01a 5 60 51.36 ± 1.62b 10 60 0.08 ± 0.01c 15 60 0.00c Values represent mean ± SE; Different lowercase letters indicate significant differences among treatments according to the LSD test (P < 0.05). Table 3.
The regeneration rates in different Kan concentrations of F. nilgerrensis leaf discs at 45 d of culture.
-
Kan concentration
(mg·L−1)No. of infected explants Rate of resistant shoot regeneration (%)
at 65 d post-infectionPercentage of transformation (%)
at 130 d post-infection10 60 24.74 ± 0.62a 10.98 ± 0.13a 20 60 10.25 ± 0.18b 9.22 ± 0.20b 30 60 3.33 ± 0.14c 3.22 ± 0.25c 40 60 1.67 ± 0.01d 1.67 ± 0.01d 50 60 0.00e 0.00e Values represent mean ± SE; Different lowercase letters indicate significant differences among treatments according to the LSD test (P < 0.05). Table 4.
Effect of Kan concentrations on Agrobacterium-mediated transformation of F. nilgerrensis leaf discs.
-
Procedure Media composition Duration Agrobacterium infection MS liquid medium, 100 μmol·L−1 AS, 5 g·L−1 glucose and 15 g·L−1 sucrose 10 min Co-culture MS, 2.0 mg·L−1 TDZ, 0.2 mg·L−1 IBA, 0.5 g·L−1 CH, 7 g·L−1 agar, 5 g·L−1 glucose and 30 g·L−1 sucrose 3 d Delayed-selection culture MS, 2 mg·L−1 TDZ, 0.2 mg·L−1 IBA, 0.5 g·L−1 CH, 7 g·L−1 agar, 30 g·L−1 sucrose, 250 mg·L−1 Tim and 250 mg·L−1 Cef 4 d Selection and regeneration culture MS, 2.0 mg·L−1 TDZ, 0.2 mg·L−1 IBA, 0.5 g·L−1 CH, 7 g·L−1 agar, 30 g·L−1 sucrose, 250 mg·L−1 Tim, 250 mg·L−1 Cef and 10/20 mg·L−1 Kan 60 d Shoot elongation culture MS, 2.0 mg·L−1 TDZ, 0.2 mg·L−1 IBA, 0.5 g·L−1 CH, 7 g·L−1 agar, and 30 g·L−1 sucrose, 250 mg·L−1 Cef and 10 mg·L−1 Kan 60−90 d Rooting culture 1/2 MS, 0.1 mg·L−1 IBA, 15 g·L−1 sucrose and 5 g·L−1 agar 30 d Table 5.
Composition of media used for genetic transformation of F. nilgerrensis leaf discs.
Figures
(7)
Tables
(5)