-
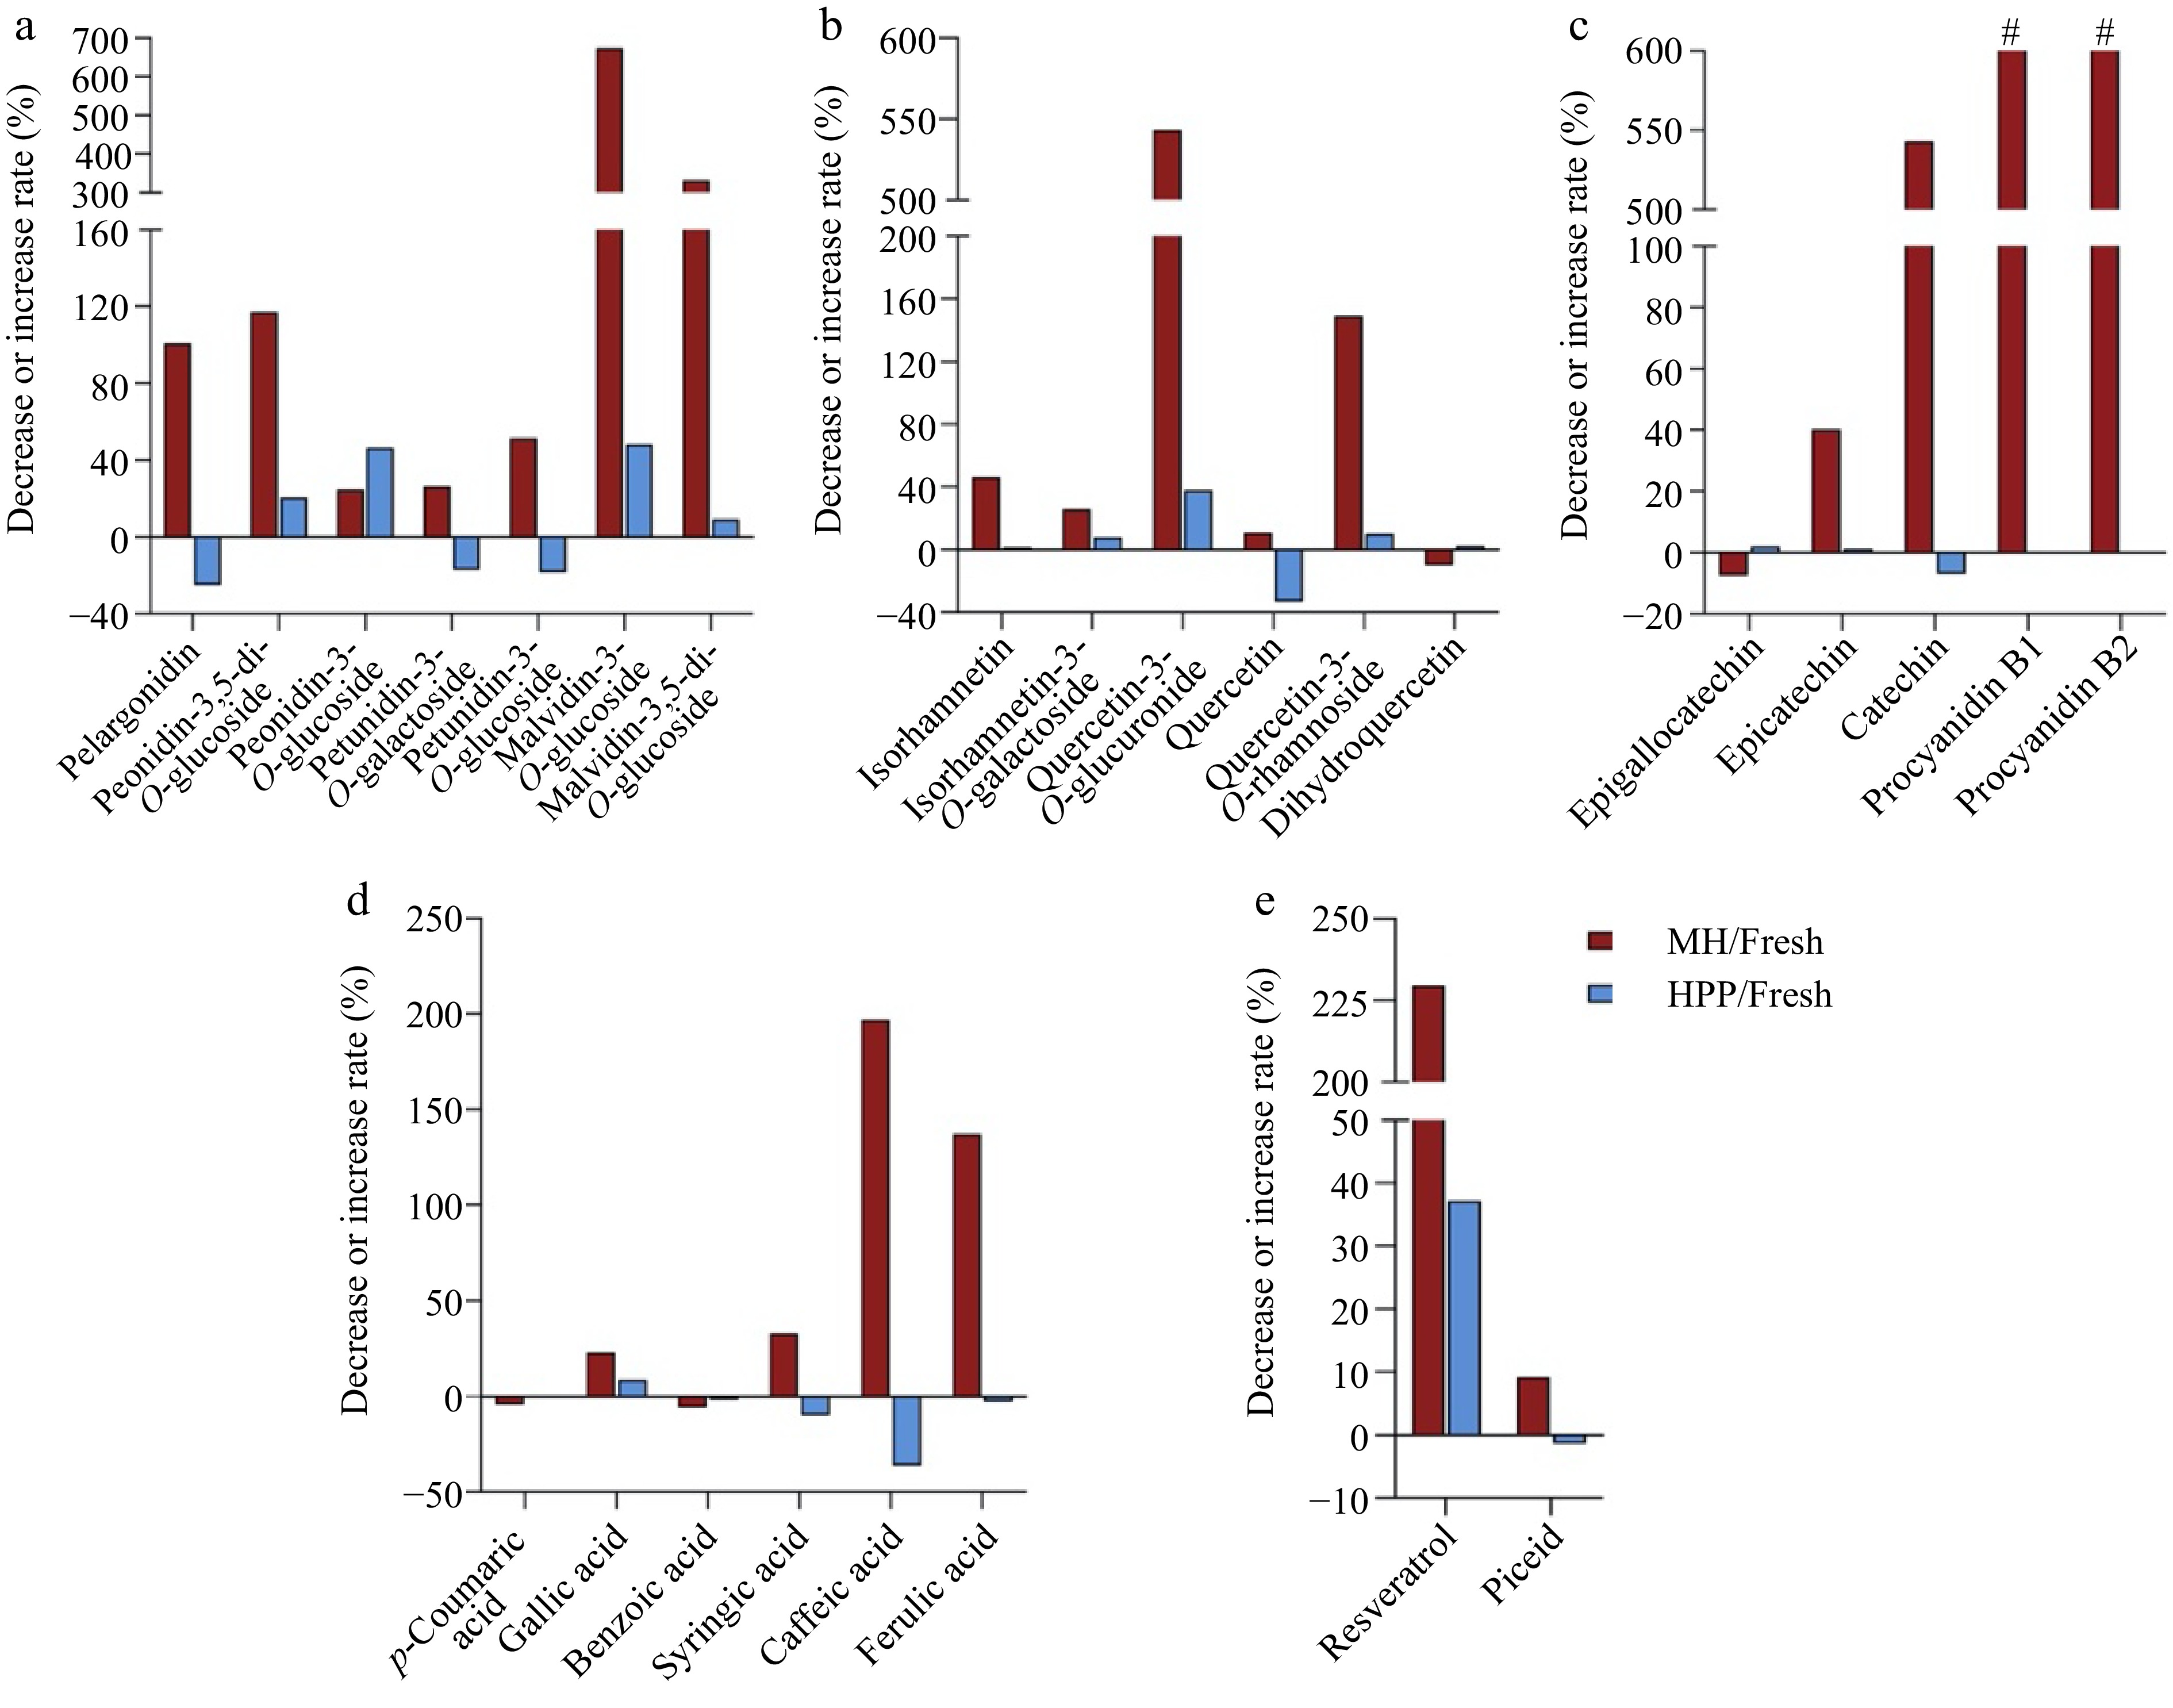
Figure 1.
The increase or decrease rates of phytochemical compounds (compared with fresh group) in MH-and HPP-processed NFC spine grape juice. (a) Anthocyanins, (b) Flavonols, (c) Flavan-3-ols, (d) Phenolic acids, (e) Stilbenes. # indicate compounds only detected in the MH group.
-
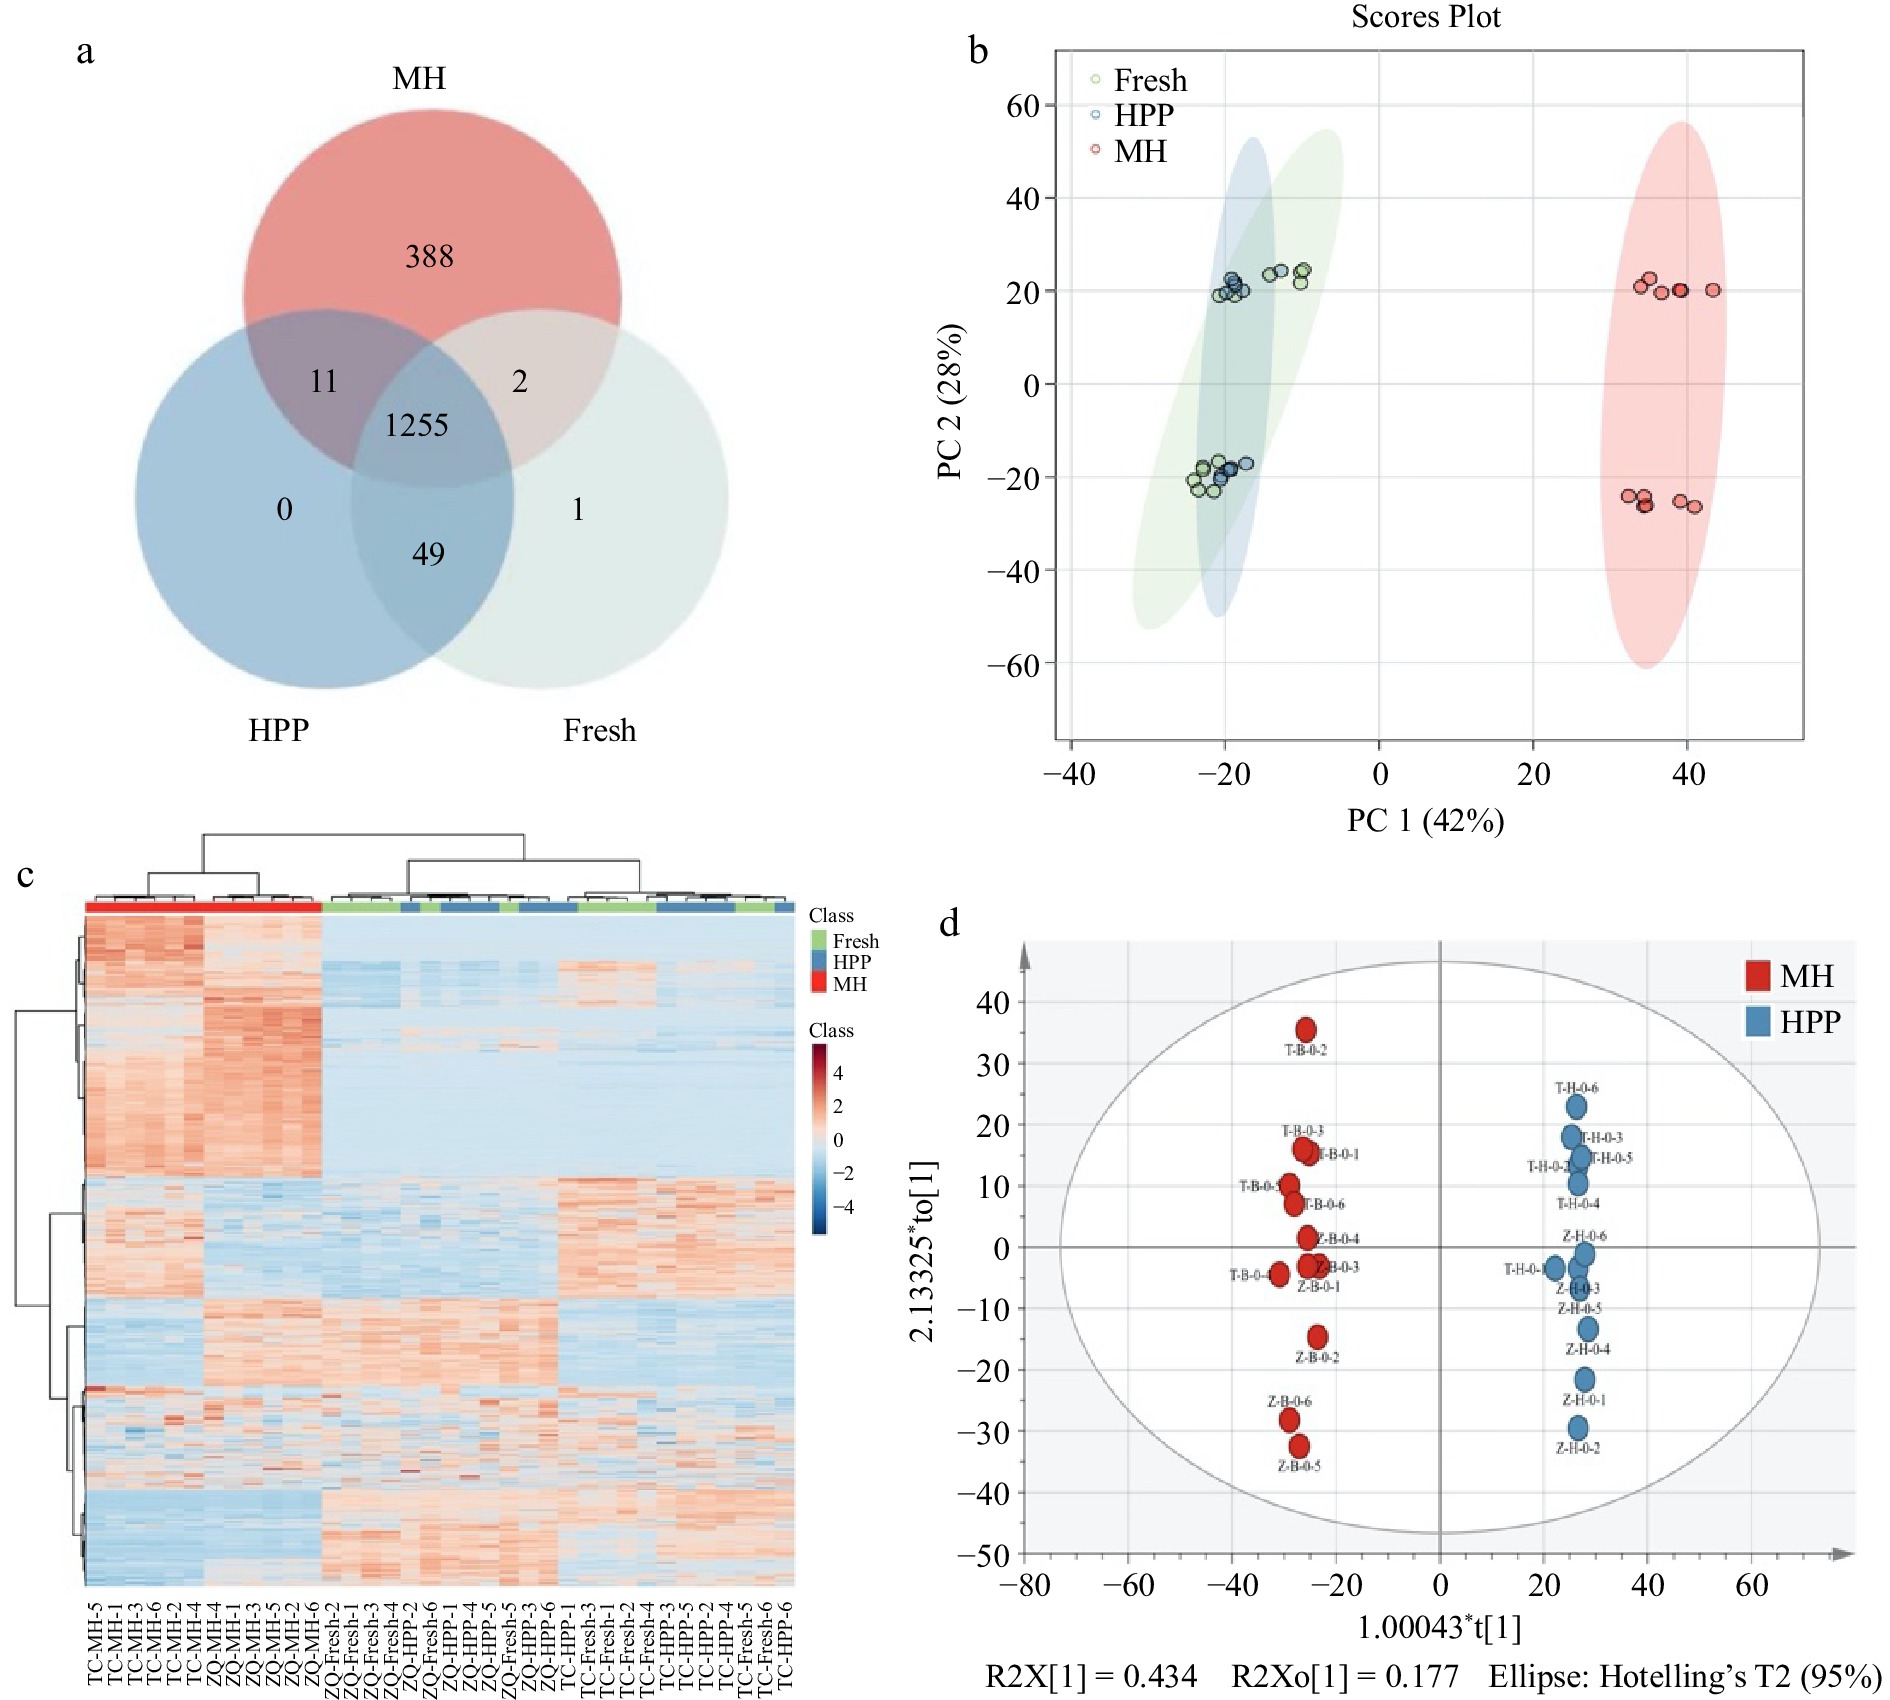
Figure 2.
Multivariate analysis based on metabolomics data. (a) Venn plot for MS1 feature quantities in MH, HPP, and fresh, (b) PCA score plot, (c) Heatmap, (d) OPLS-DA model.
-
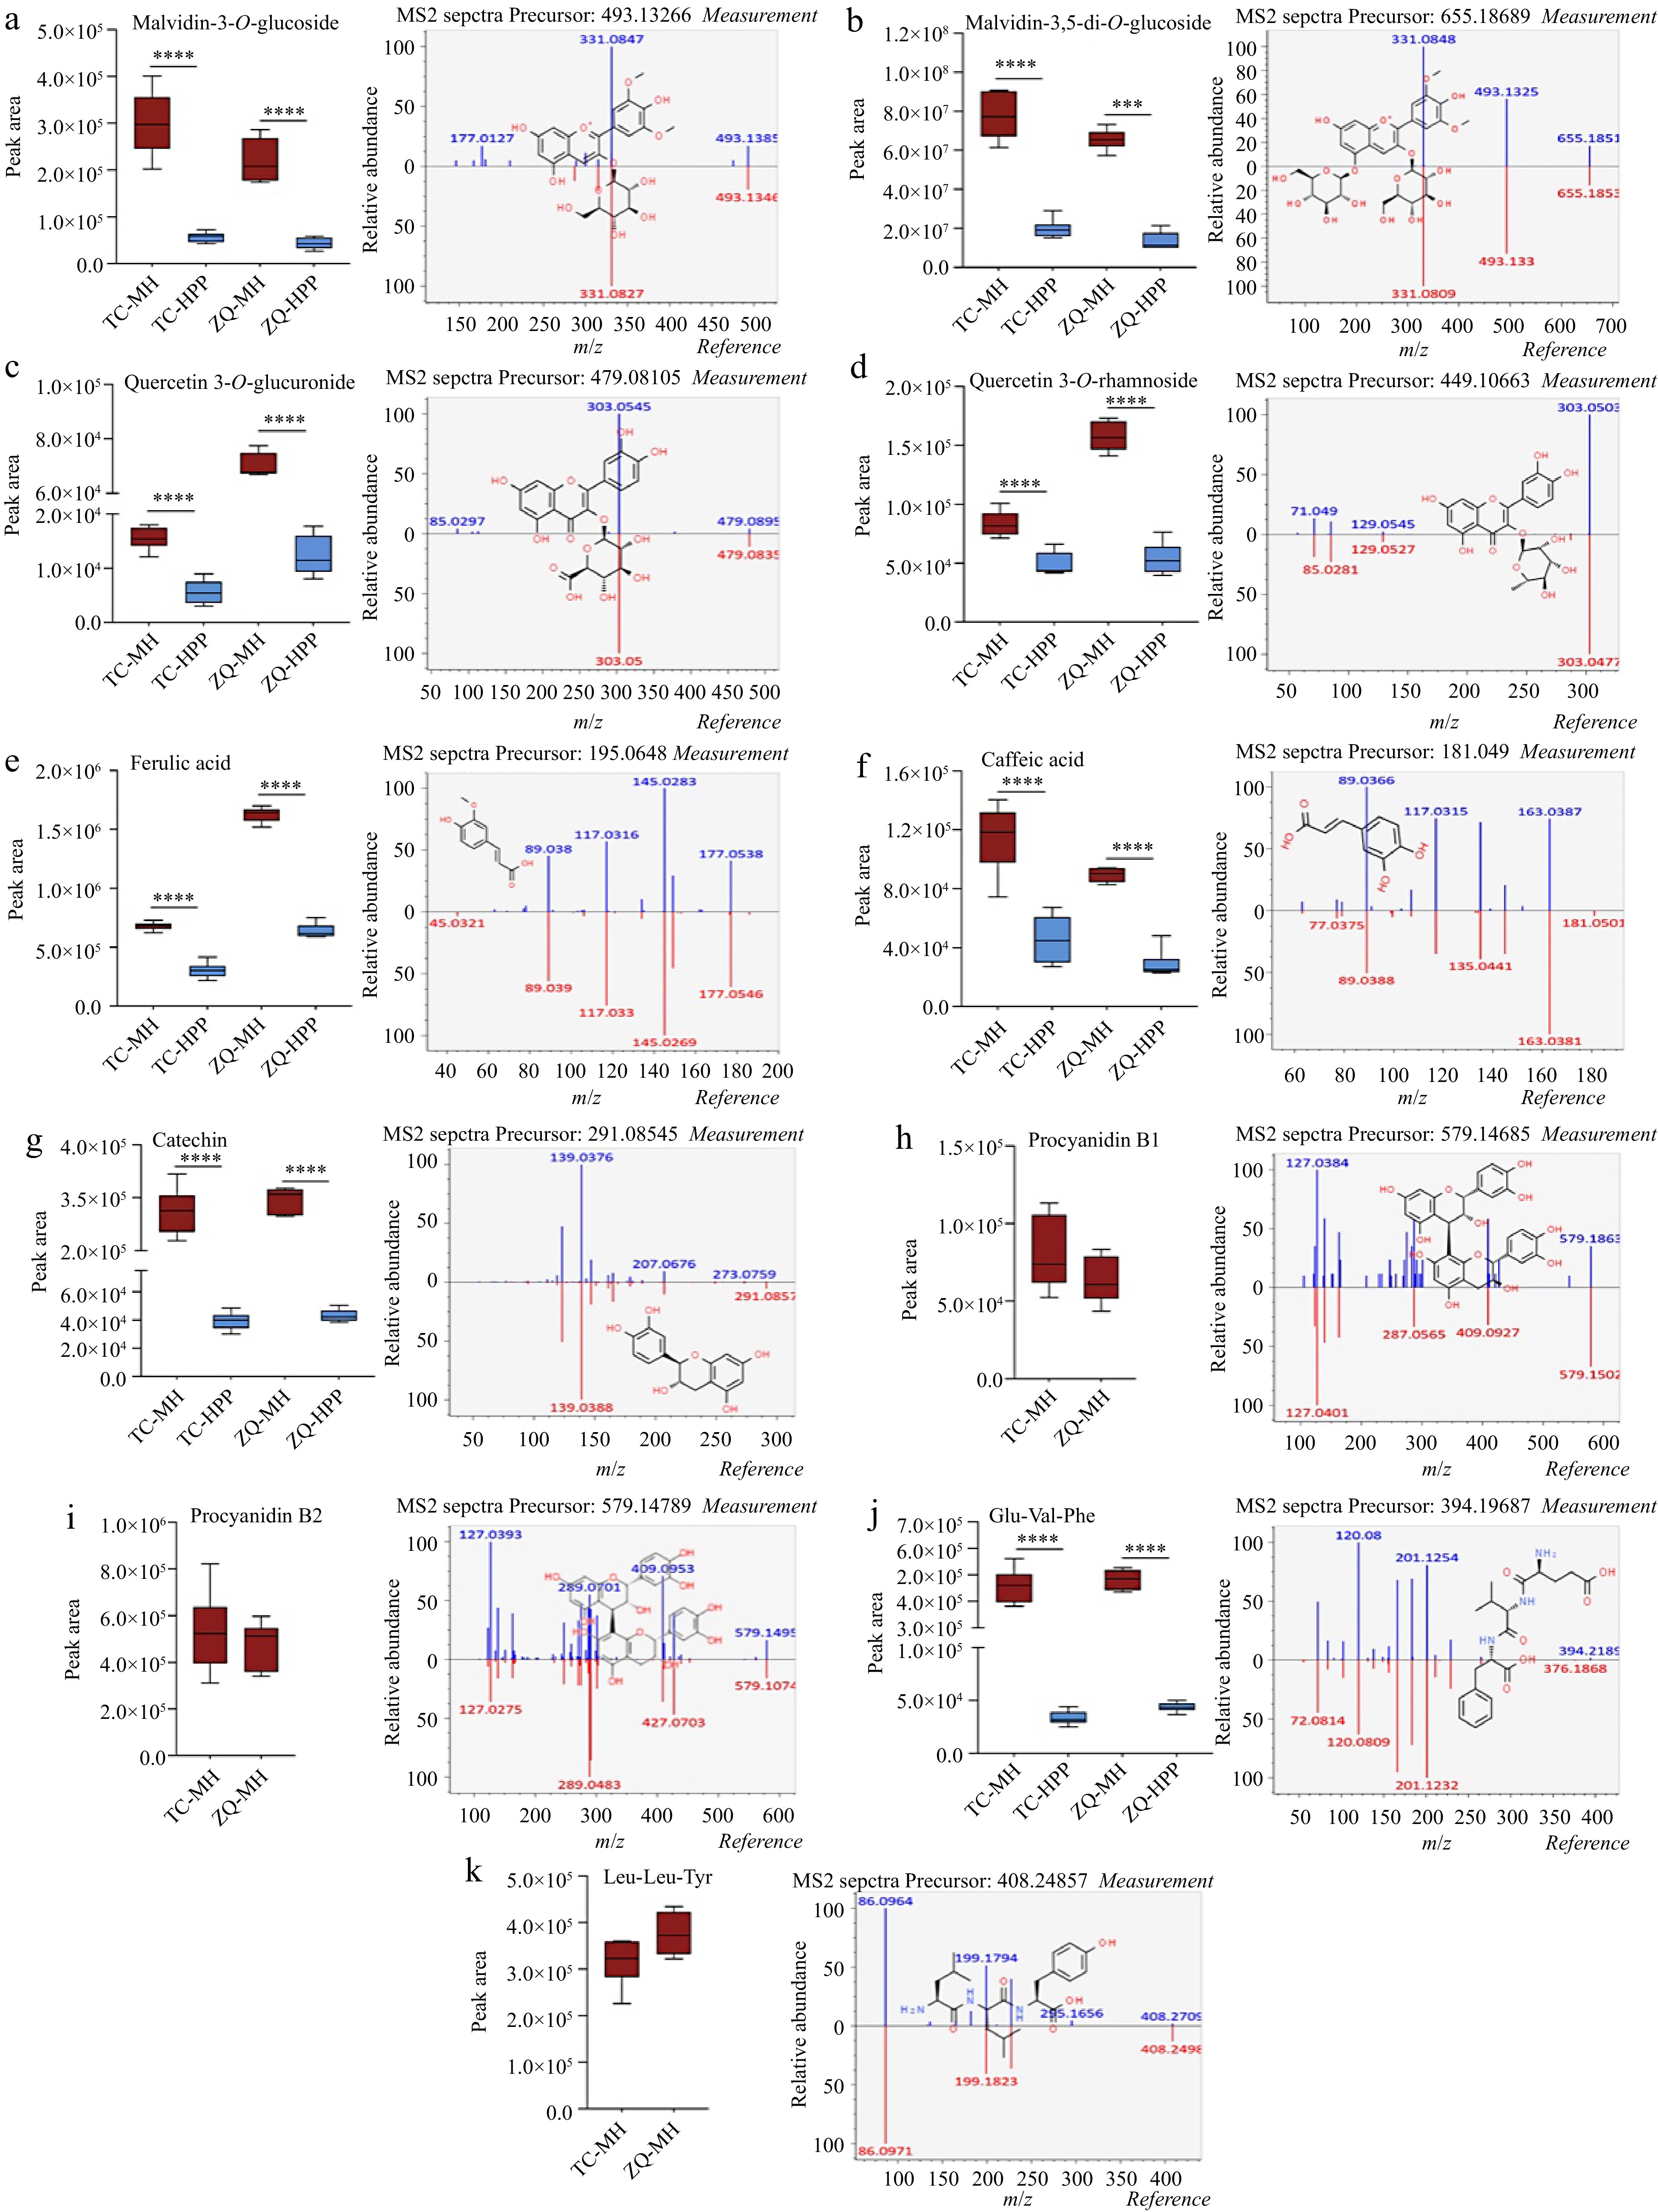
Figure 3.
The putative annotated markers between MH- and HPP-processed NFC spine grape juice. The left are the box-plots, and the right are the chemical structures of individual biomarkers. (a) Malvidin-3-O-glucoside, (b) Malvidin-3,5-di-O-glucoside, (c) Quercetin-3-O-glucuronide, (d) Quercitrin-3-O-rhamnoside, (e) Ferulic acid, (f) Caffeic acid, (g) Catechin, (h) Procyanidin B1, (i) Procyanidin B2, (j) Glu-Val-Phe, (k) Leu-Leu-Tyr. Procyanidin B1, procyanidin B2 and Leu-Leu-Tyr only detected in the MH group.
-
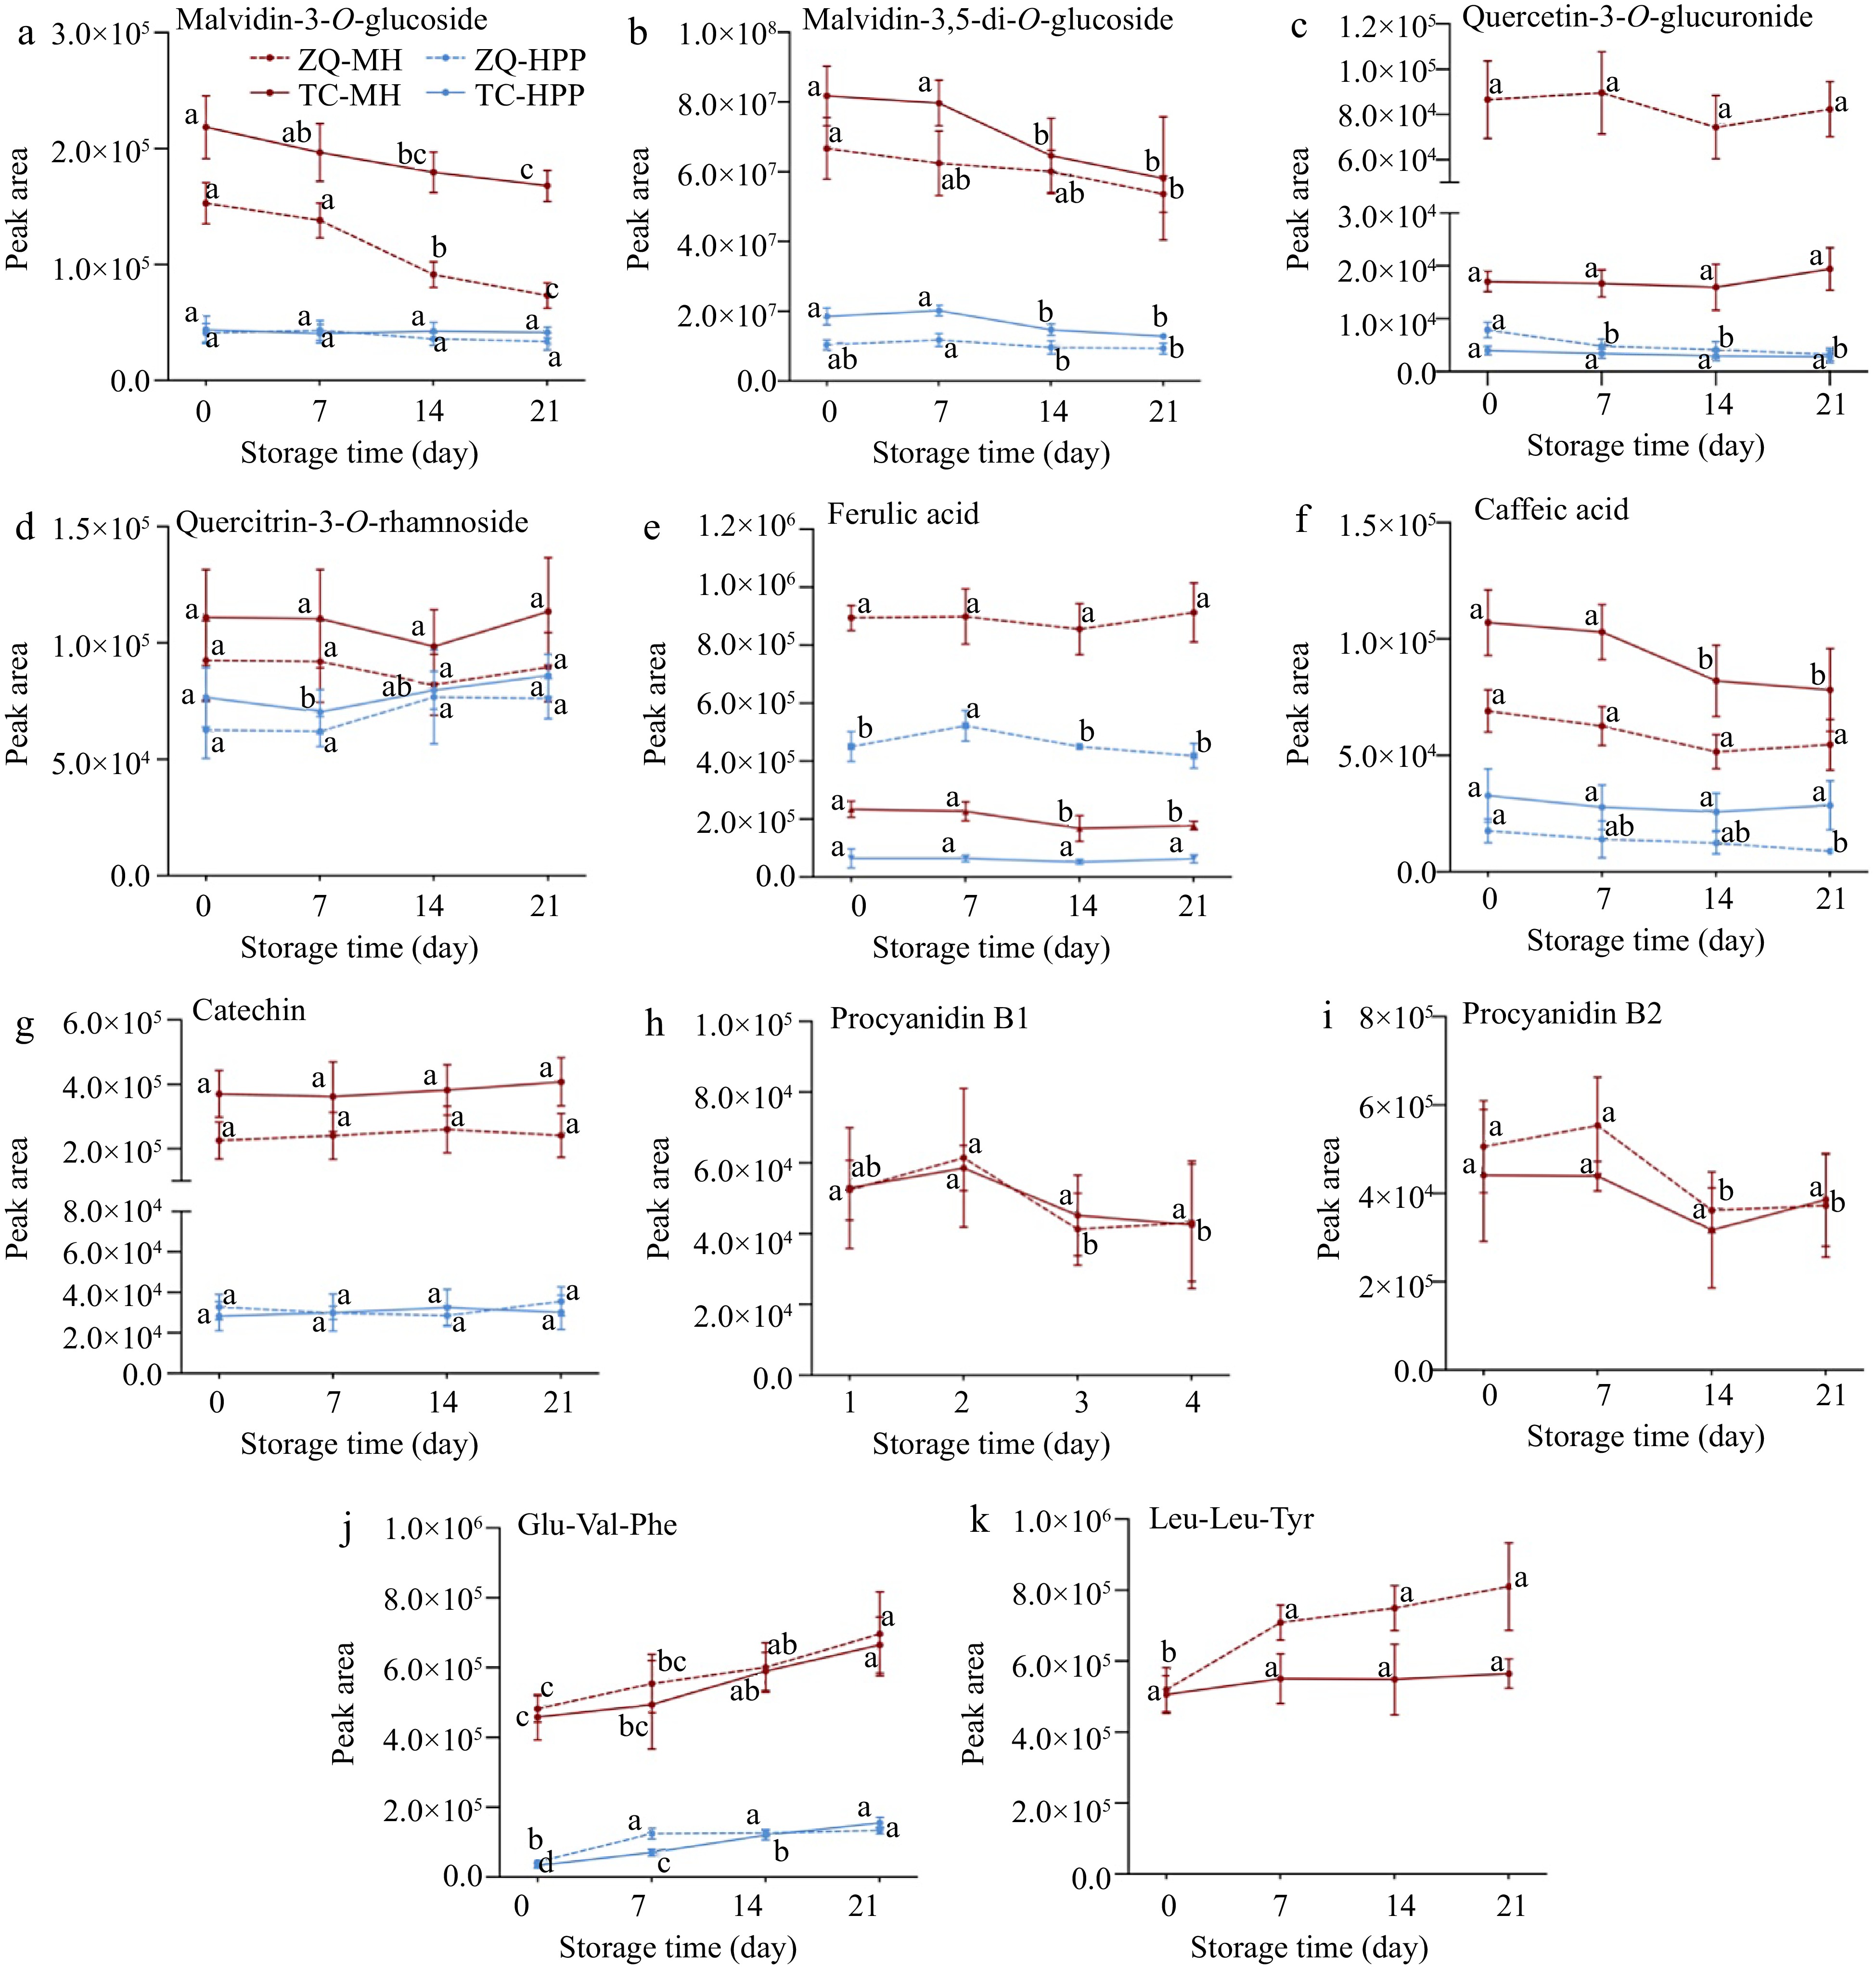
Figure 4.
Changes of annotated markers during storage. (a) Malvidin-3-O-glucoside, (b) Malvidin-3,5-di-O-glucoside, (c) Quercetin-3-O-glucuronide, (d) Quercitrin-3-O-rhamnoside, (e) Ferulic acid, (f) Caffeic acid, (g) Catechin, (h) Procyanidin B1, (i) Procyanidin B2, (j) Glu-Val-Phe, (k) Leu-Leu-Tyr. The solid and dotted lines represent different grape varieties. Different letters indicated significant difference between storage day.
-
Variety TC ZQ Processing method Fresh MH HPP Fresh MH HPP pH 3.45 ± 0.02a 3.45 ± 0.04a 3.60 ± 0.03b 3.71 ± 0.03b 3.57 ± 0.04c 3.84 ± 0.03a TSS (%) 14.60 ± 0.10a 14.43 ± 0.06a 14.50 ± 0.10a 14.27 ± 0.38a 14.57 ± 0.15a 14.27 ± 0.12a Glucose (g/L) 71.59 ± 2.03a 70.43 ± 4.76a 68.14 ± 2.83a 71.66 ± 1.69a 68.85 ± 2.32a 68.86 ± 1.71a Fructose (g/L) 72.79 ± 2.36a 71.07 ± 3.23a 71.90 ± 2.56a 74.17 ± 2.93a 70.07 ± 2.53a 70.21 ± 1.87a Tartaric acid (mg/L) 4,822.08 ± 285.58a 4,925.37 ± 380.44a 2,810.97 ± 50.57b 4,262.18 ± 141.90a 4,446.3 ± 438.02a 2,791.82 ± 231.73b Malic acid (mg/L) 472.13 ± 20.71a 456.06 ± 5.99a 343.91 ± 30.30b 668.52 ± 12.53a 536.71 ± 31.26b 498.85 ± 19.84c Critic acid (mg/L) 128.07 ± 2.72a 125.07 ± 2.29a 126.05 ± 2.07a 212.59 ± 2.76a 217.04 ± 3.51a 211.67 ± 2.04a TPC (mg/L) 593.42 ± 29.22c 983.12 ± 58.29a 671.82 ± 14.00b 611.68 ± 25.68c 1031.53 ± 58.94a 726.75 ± 24.23b TAC (mg/L) 156.87 ± 4.91b 299.77 ± 4.59a 179.92 ± 6.01b 115.74 ± 10.81b 269.08 ± 6.63a 134.40 ± 5.01b L 25.64 ± 0.6c 28.75 ± 0.66a 26.59 ± 0.46b 24.36 ± 0.21c 29.27 ± 1.02a 27.56 ± 0.61b a 6.03 ± 0.23b 9.57 ± 0.42a 6.34 ± 0.75b 3.98 ± 0.14c 8.28 ± 0.18b 4.24 ± 0.27b b −2.46 ± 0.17b −2.30 ± 0.14b −1.94 ± 0.08a −2.47 ± 0.09a −2.34 ± 0.13a −2.28 ± 0.13a Table 1.
The traditional index of MH- and HPP-processed NFC spine grape juice.
-
ID Metabolites Formula Adduct type Rt (min) Average m/z Reference m/z ppm p-value log2Fold change Being identified in targeted analysis log2Fold change (in storage) 14109 Malvidin-3,5-O-diglucoside C29H34O17 [M+H]+ 3.798 655.1869 655.1869 0.00 0.012 1.8 √ > 1.0 10725 Malvidin-3-O-glucoside C23H25O12 [M]+ 5.766 493.1338 493.1335 0.57 0.012 2.6 √ > 1.0 10254 Quercetin-3-O-glucuronide C21H18O13 [M+H]+ 6.829 479.0808 479.082 −2.54 0.00 2.2 √ < 1.0 9283 Quercitrin-3-O-rhamnoside C21H20O11 [M+H]+ 7.707 449.1088 449.10779 2.15 0.00 1.2 √ > 1.0 1216 Caffeic acid C9H8O4 [M+H]+ 3.373 181.0494 181.0495 −0.61 0.00 2.0 √ > 1.0 1560 Ferulic acid C10H10O4 [M+H]+ 4.708 195.06523 195.0643 4.76 0.00 1.3 √ < 1.0 4046 Catechin C15H14O6 [M+H]+ 4.061 291.086 291.086 −0.10 0.00 3.9 √ > 1.0 12875 Procyanidin B1 C30H26O12 [M+H]+ 3.530 579.159 579.1497 0.38 − − √ > 1.0 12873 Procyanidin B2 C30H26O12 [M+H]+ 4.515 579.1506 579.1497 0.16 − − √ > 1.0 7503 Glu-Val-Phe C19H27N3O6 [M+H]+ 5.265 394.1969 394.1971 −0.61 0.015 3.1 × > 1.0 7954 Leu-Leu-Tyr C21H33N3O5 [M+H]+ 6.293 408.2488 408.2493 −1.35 − − × > 1.0 Procyanidin B1, procyanidin B2 and Leu-Leu-Tyr only detected in the MH group. Table 2.
The putative annotated markers of MH- and HPP-processed NFC spine grape juice.
Figures
(4)
Tables
(2)