-
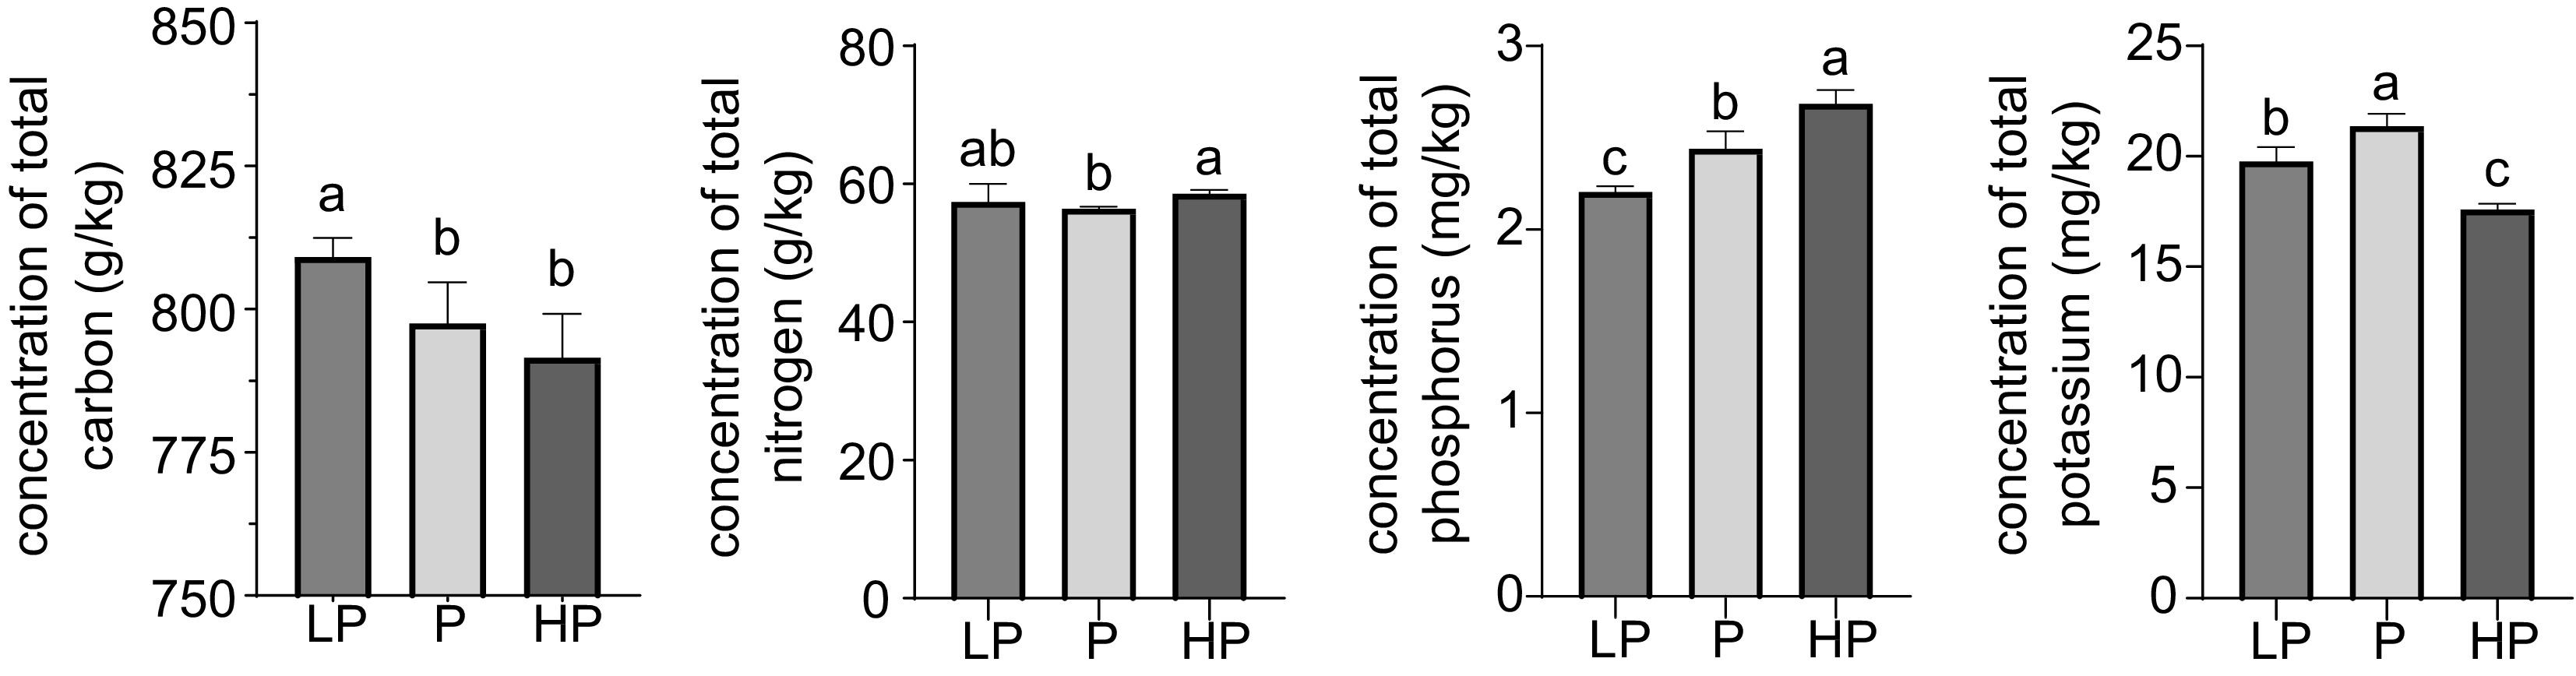
Figure 1.
Effect of phosphorus treatments on total carbon, nitrogen, phosphorus, and potassium content in young shoots of tea plants. LP, no phosphorus fertilizer applied (control); P, 3 g calcium superphosphate applied per pot; HP, 10 g calcium superphosphate applied per pot. Bars and error bars indicate the mean ± SD (n = 3). Different lowercase letters above bars indicate a significant difference between treatments (p < 0.05, LSD test).
-
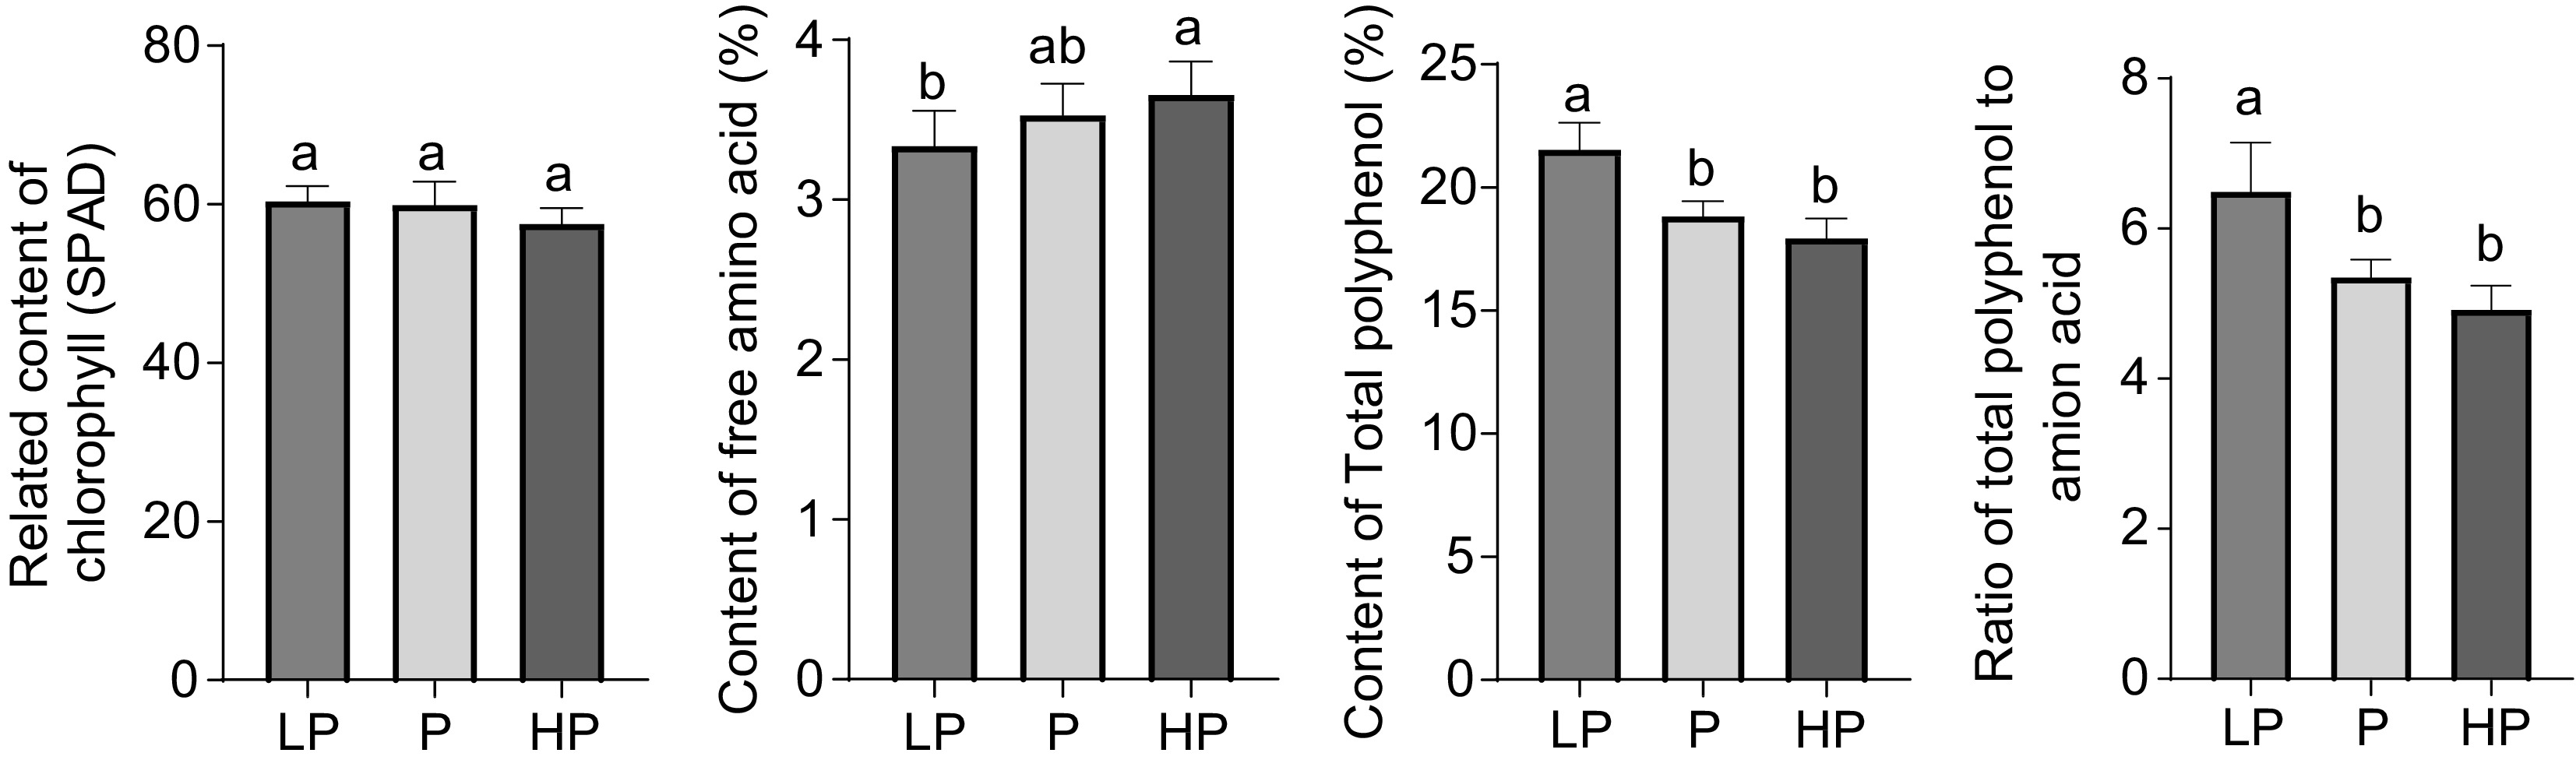
Figure 2.
Effect of phosphorus treatments on the content of chlorophyll, free amino acids, total polyphenols, and the ratio of total polyphenols to amino acids in young shoots of tea plants. LP, no phosphorus fertilizer applied (control); P, 3 g calcium superphosphate applied per pot; HP, 10 g calcium superphosphate applied per pot. Bars and error bars indicate the mean ± SD (n = 3). Different lowercase letters above bars indicate a significant difference between treatments (p < 0.05, LSD test).
-
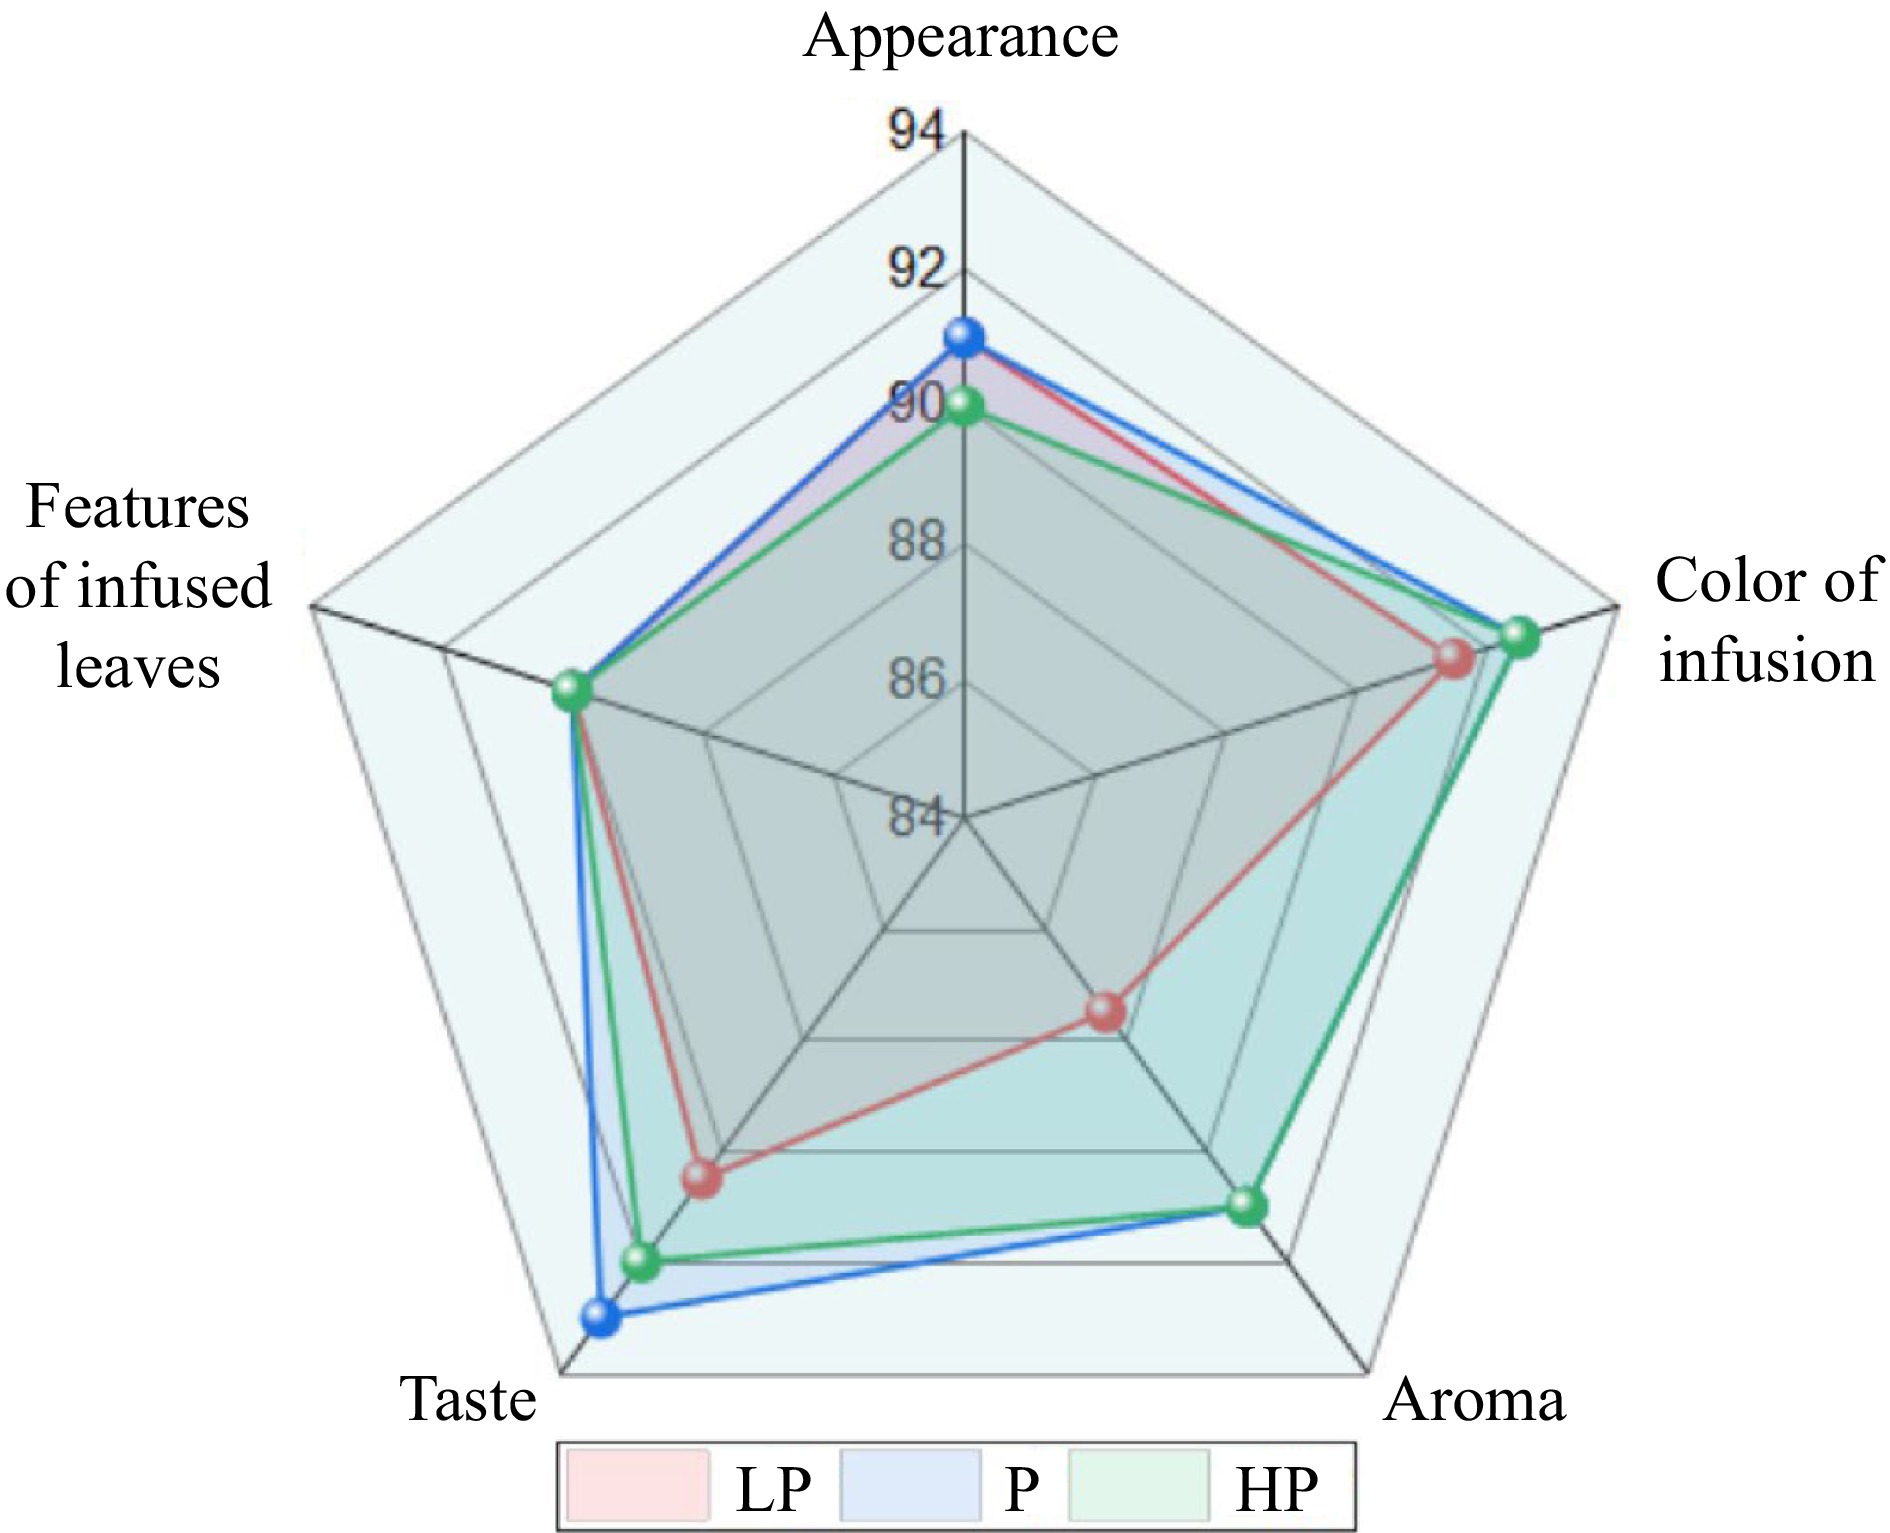
Figure 3.
Effect of phosphorus treatments on the sensory quality of infusions prepared from young tea shoots. LP, no phosphorus fertilizer applied (control); P, 3 g calcium superphosphate applied per pot; HP, 10 g calcium superphosphate applied per pot.
-
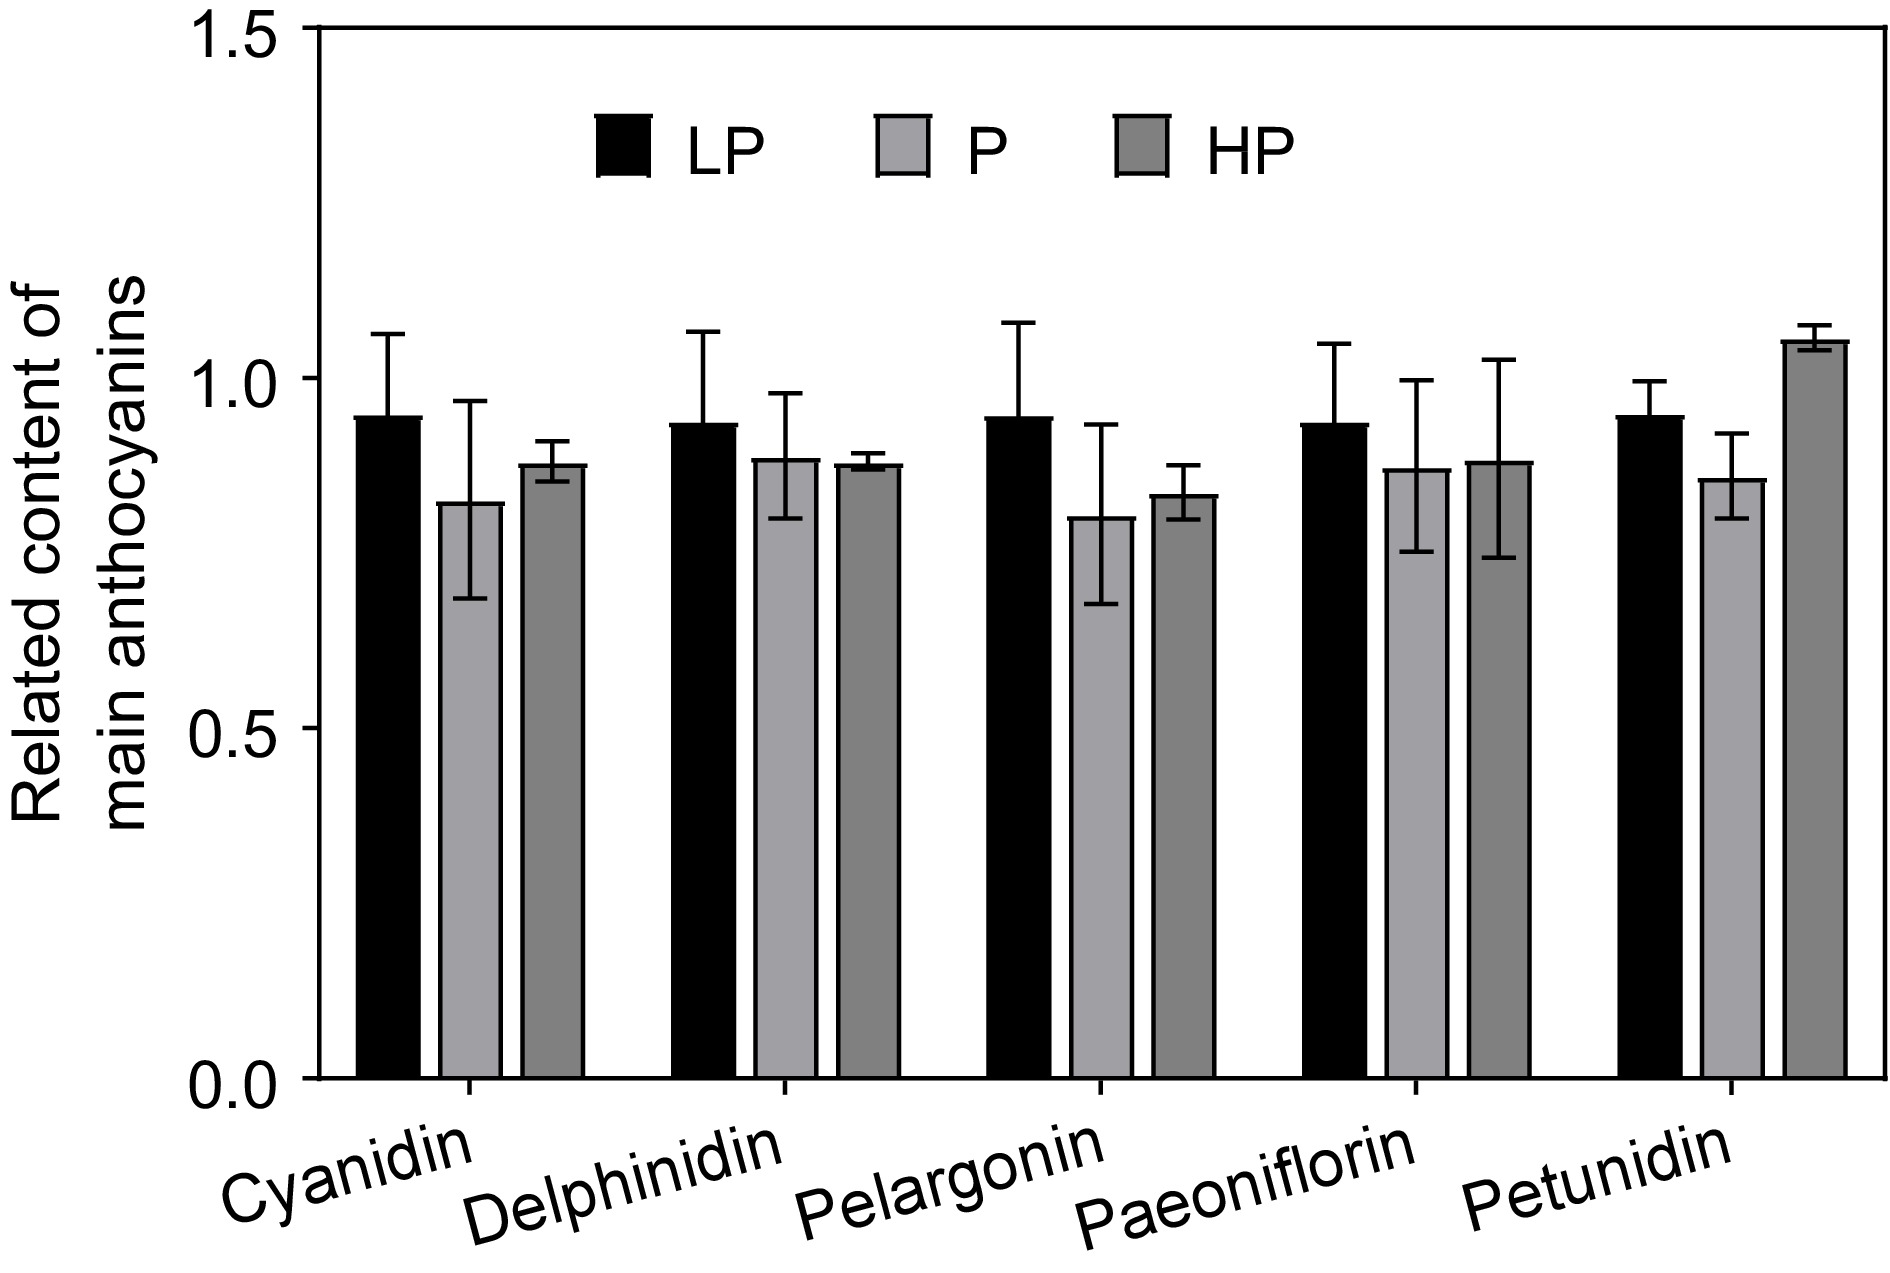
Figure 4.
Effect of phosphorus treatments on the relative content of the main anthocyanins detected in young shoots of tea plants. LP, no phosphorus fertilizer applied (control); P, 3 g calcium superphosphate applied per pot; HP, 10 g calcium superphosphate applied per pot. Bars and error bars indicate the mean ± SD (n = 3).
-
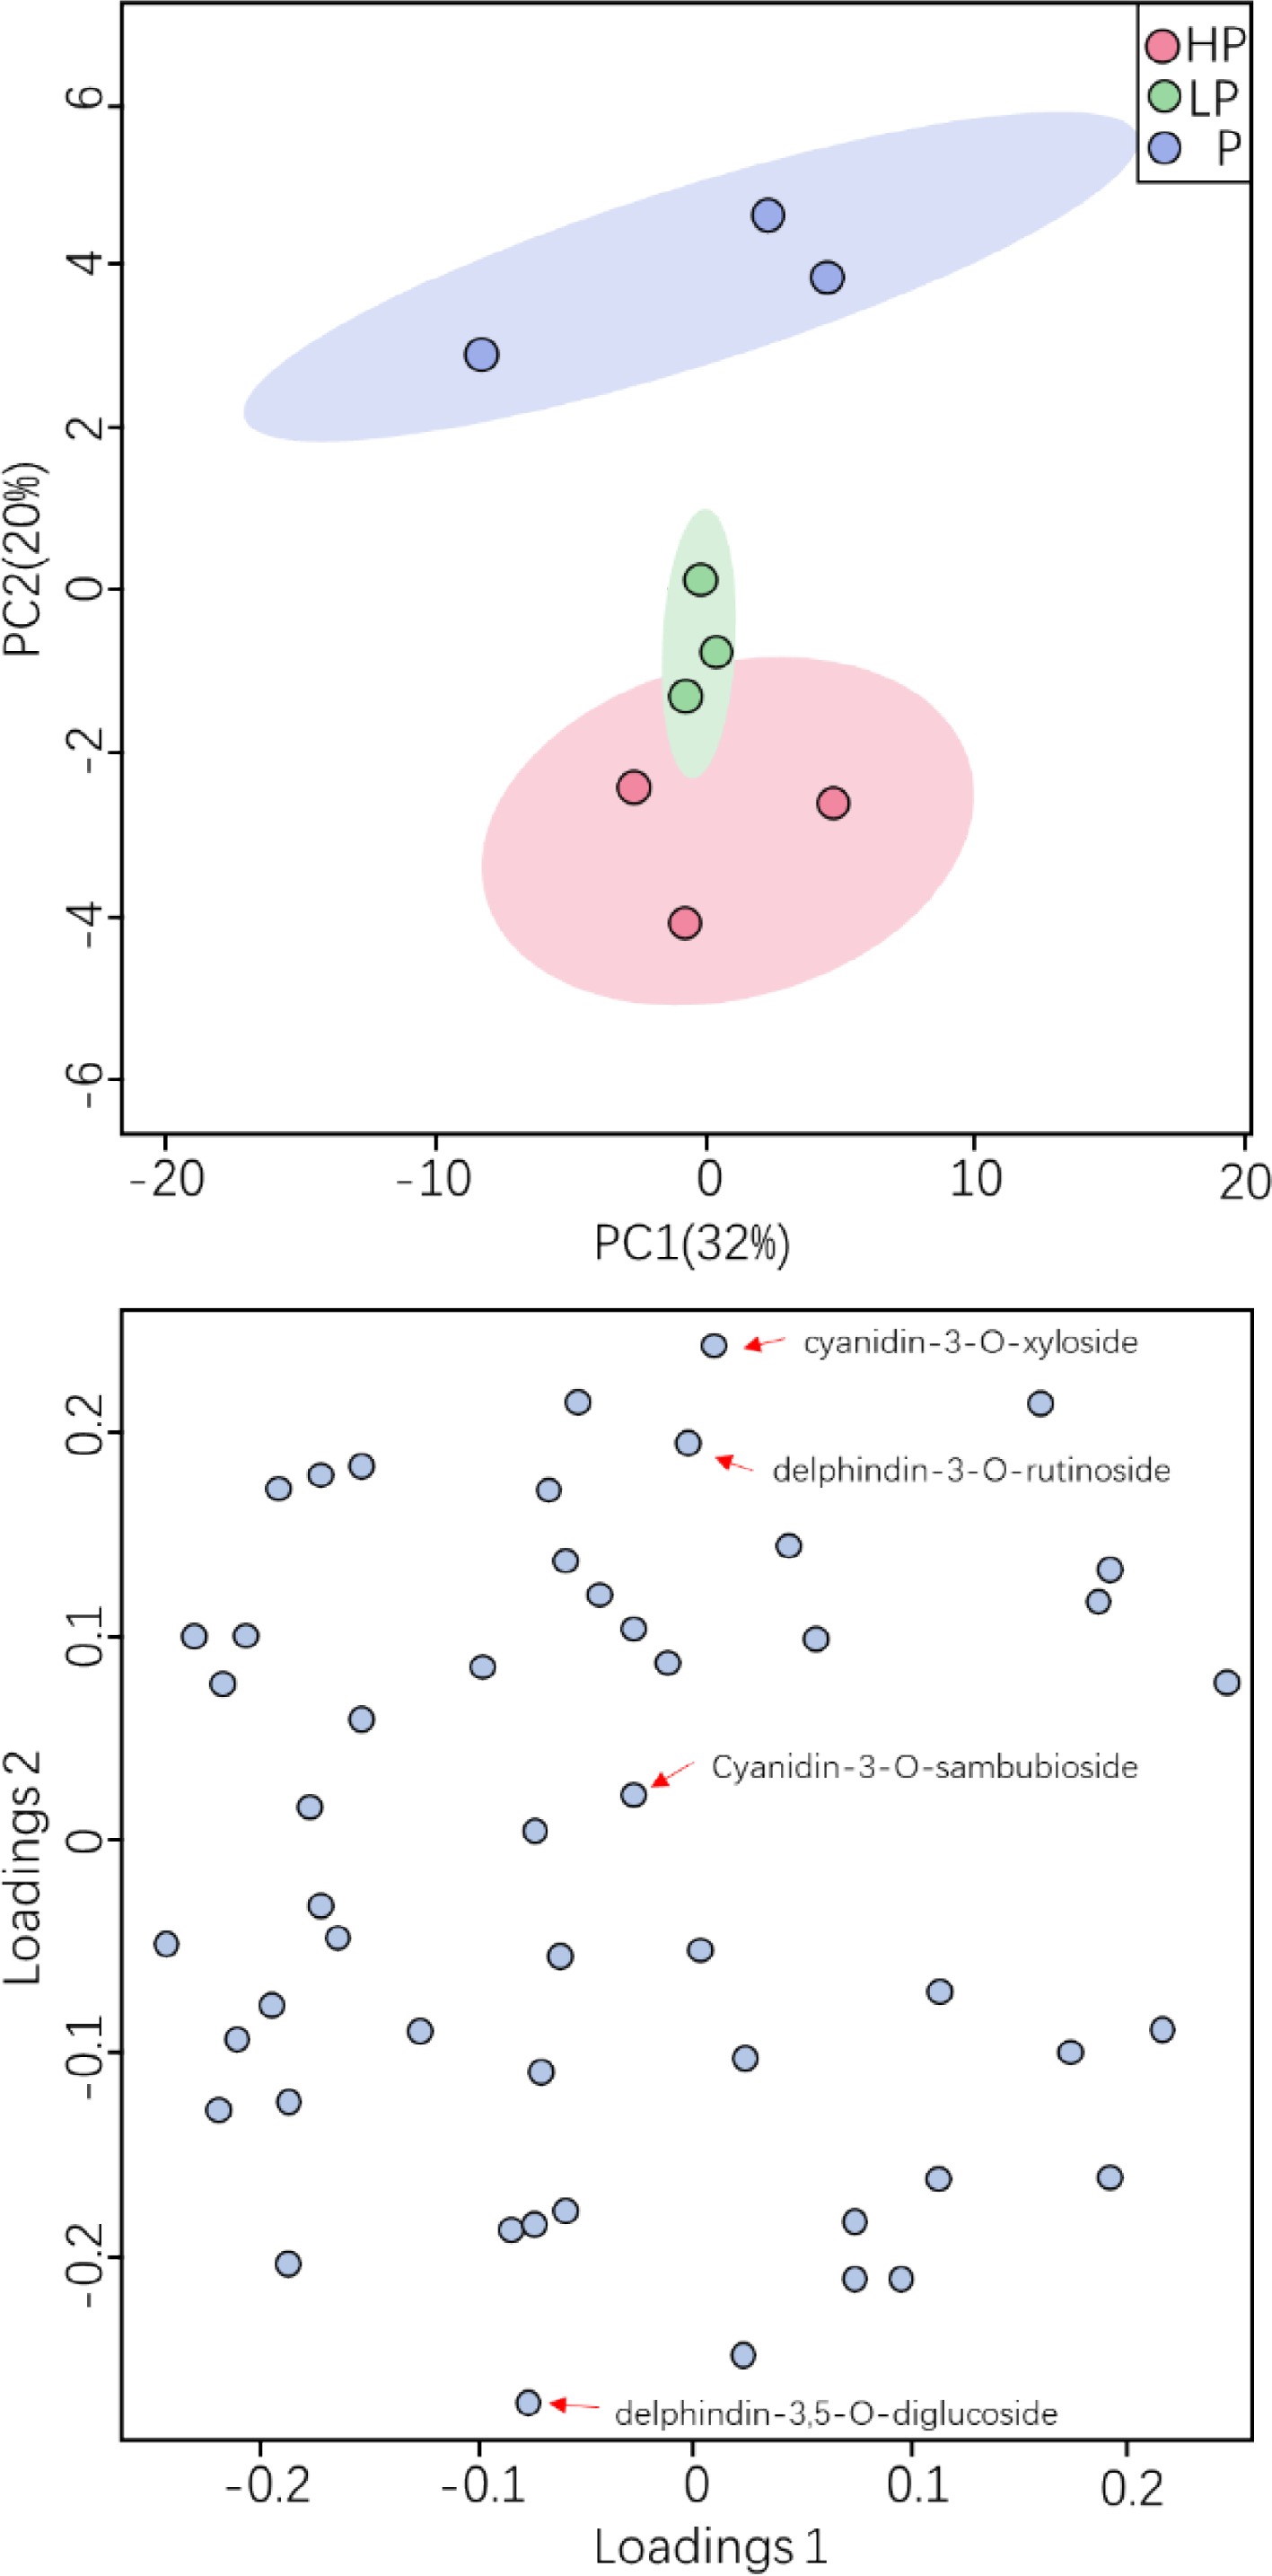
Figure 5.
Effect of phosphorus treatments on anthocyanin metabolites in young shoots of tea plants.
-
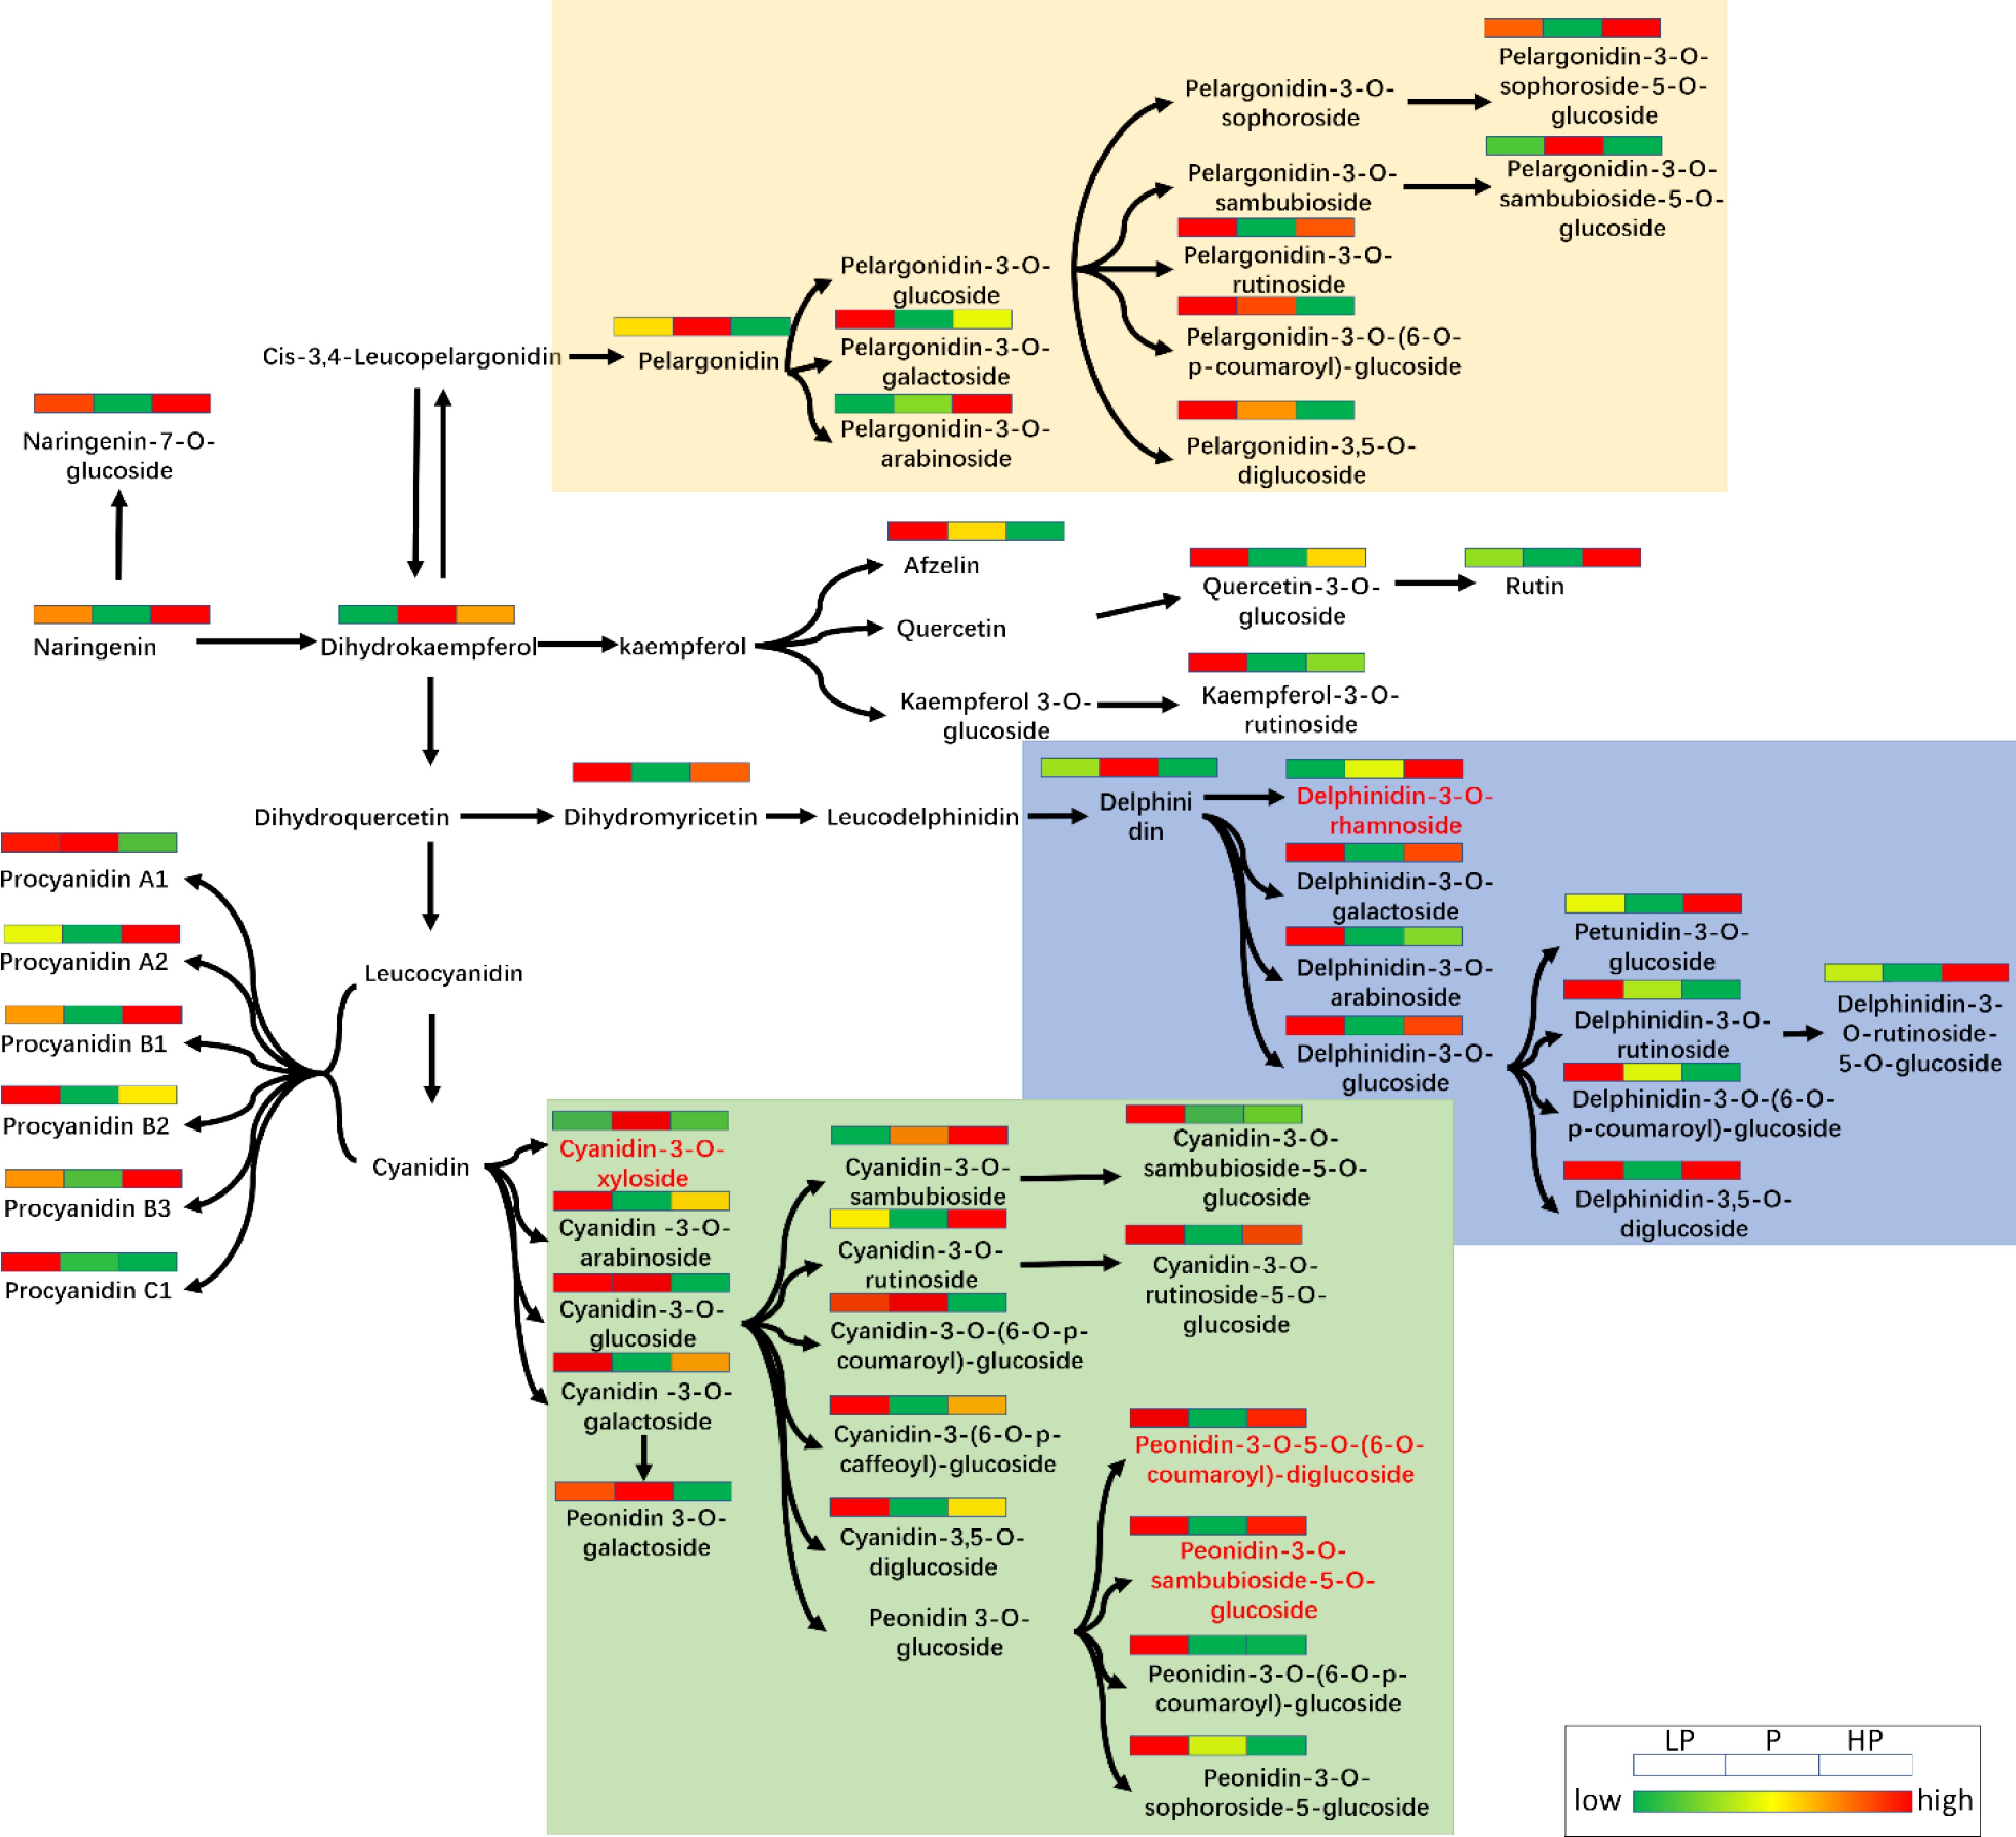
Figure 6.
Schematic diagram of anthocyanin metabolic pathways in young shoots of tea plants under three relative phosphorus fertilizer treatments.
Figures
(6)
Tables
(0)