


-
Tea is a major cash crop in Asian and African countries, such as China, India, Japan, Sri Lanka and Kenya. Over many years, optimization of cultivation practices, especially nutrient management strategy, had a substantial impact on improvement of tea yield and quality. However, Ruan et al. reported that 30% of tea plantations in China applied excessive fertilizer quantities, and for 80% of tea plantations fertilizer was applied irrationally, and research also has shown that insufficient and excessive soil phosphorus nutrition are both widespread in tea production[1]. Zhang suggested that the effective phosphorus content of high-quality and high-yield tea garden soil was usually higher than 25 mg/kg, soil available phosphorus content in the tea plantation varied from 12.0 to 49.7 mg/kg, and the average value was 29.6 mg/kg[2]. Yuan et al.[3] and Sun et al.[4] also reported soil phosphorus richin the area where compound fertilizer excessively applied in recent years.
Inorganic phosphate (Pi) is a structural component of nucleic acids, phosphate esters, and phospholipids. It is involved in physiological processes, such as photosynthesis and respiration in plants[5,6], promotes the growth of plant roots and improves the adaptability of plants to the external environment[7], plays a decisive role in cell metabolism and signal transduction pathways[8], and regulates cell growth and cell-cycle progression in specific environments[9,10]. Morphologically, plants with insufficient phosphorus supply increase the root surface area and root-to-shoot ratio. Changes in gene expression levels, and protein and metabolite contents under phosphorus deficiency have been extensively studied[11−15]. Metabolic profile studies have shown that phosphorus restriction leads to a decrease in phosphorylated metabolites, but an increase in the contents of carbohydrates, organic acids, amino acids, and nitrogenous compounds[11,15−18]. The application of phosphorus fertilizer promotes the growth of wheat, soybean, rape, and other crops, and significantly increases yield. As with most crops, fertilizer use is a material basis to increase the yield and quality of tea plants. Inorganic phosphate affects the yield and quality of tea by affecting root growth, and the decomposition and metabolism of minerals and metabolites in the plant[19−22]. The influence of Pi on tea quality is mainly reflected in two aspects: aroma and taste. Rational application of phosphate fertilizer can increase the content of polyphenols and water-soluble compounds, especially gallocatechin and epicatechin[23], which has a favorable effect on the aroma and taste of tea. Conversely, phosphorus deficiency can lead to a decrease in the concentrations of total polyphenols, flavonoids, total free amino acids, theanine, and aspartic acid in green tea[24,25].
Flavonoids are secondary metabolites with antioxidant activity, whereas anthocyanins, synthesized as an extension of the flavonoid biosynthetic pathway, have antioxidant, immunostimulatory, and anti-cancer properties[26]. The metabolism and synthesis of anthocyanins in plants are affected by environmental factors[27,28], such as light intensity[29], temperature[30], and humidity[31]. Previous research on the anabolic factors affecting tea plant anthocyanins mainly focused on light and temperature. However, more recent studies have shown that nutrients, such as nitrogen and phosphorus, have an important impact on anthocyanin anabolism[32]. Under Pi stress, the balance between synthetic and catabolic carbon metabolism is disturbed, and phosphorus restriction often leads to upregulation of gene expression, and accumulation of the secondary metabolites phenylpropanoids, flavonoids and their glycosides, and anthocyanins[11,33]. Mo et al. observed that phosphorus deficiency increases the expression level of anthocyanin-related synthetic genes, which leads to an increase in anthocyanin synthesis[34]. Nutrient elements are an environmental factor that affect the metabolism and synthesis of anthocyanins in tea leaves, although few studies have been published. In particular, studies are lacking on the role of phosphorus, as one of these elements, in the metabolism and synthesis of tea plant anthocyanins.
In this study, we conducted a pot simulation method to analyze the quality of tea leaves and the metabolic accumulation of quality-related components, such as polyphenols and anthocyanins, in young tea leaves under three phosphorus nutrition treatments. The aim was to evaluate the effect of inappropriate phosphorus nutrition on tea quality and anthocyanin accumulation. The results will help to optimize the phosphorus nutrition management strategy in tea plantations.
-
The pot trial was conducted at the Shengzhou Comprehensive Experiment Station (29°46′23″ N, 120°48′52.97″ E) of the Tea Research Institute, Chinese Academy of Agricultural Sciences (China). Four tea seedlings (Camellia sinensis 'Zhongcha108', 2 years old) were planted in each pot and each pot was filled with 10 gallons of soil. Thirty pots of seedlings of uniform growth that had been precultured for nutrient depletion were selected. The available phosphorus content in the soil before the experiment was 0.898 mg/kg. The seedlings were divided into three groups of 10 plants each in the fall of 2020. Two groups were treated with 3 g (P group) or 10 g (HP group) of calcium superphosphate per pot, respectively, whereas the remaining group was treated with no phosphorus fertilizer as a control (LP). The area of pot we used is 0.0962 m2 (diameter is 0.35 m), and the P level we treated as reasonable group (3 g) amount to 46.78 kg·hm−2 (0.003 × 0.15/0.0962 × 10,000), the same is the HP level as illogicality group (10 g) amount to 155.92 kg·hm−2 (0.01 × 0.15/0.0962 × 10,000) in the field. At the end of the experiment, the soil available phosphorus content of the P and HP groups was 24.12 and 145.34 mg/kg, respectively. Young shoot tips (comprising a bud and the first leaf) were selected and harvested randomly, and then processed into green tea using a standard procedure (including fixing, rolling, and drying). Fresh young shoot samples were crushed with a plant crusher in liquid nitrogen, vacuum freeze-dried, and used for determination of the biochemical quality of the tea leaves. Fresh soil was sampled from 0~20 cm depth of each pot for each treatment. The soil was air dried and sieved through a 100-mesh sieve for analysis of the effective content of phosphorus in the soil.
Determination of chlorophyll, total polyphenol, and total free amino acid contents
-
The relative chlorophyll content was estimated with a SPAD meter (single-photon avalanche diode, SPAD-520 Plus, Tokyo, Japan). Measurements were recorded in the distal, central, and proximal portions of each leaf and the mean value were calculated. The total polyphenol content in new leaves was determined using the ferrous tartrate colorimetric method (Chinese Standard GB/T 8313-2018). The total free amino acid content was determined using the ninhydrin colorimetric method (Chinese Standard GB/T 8314-2013).
Nutrient element content determination
-
Total phosphorus and total potassium contents in the leaves were determined by dry digestion with inductively coupled plasma–atomic emission spectrometry (ICP-AES). The effective phosphorus content in the soil was determined using the hydrochloric acid–ammonium fluoride method. Organic carbon and total nitrogen contents in the leaves were determined using an elemental analyzer (vario MACRO cube).
Quantitative determination of anthocyanins and related metabolites
-
A sample (50 mg) of leaf powder was dissolved in 500 μL extraction solution (50% aqueous methanol solution containing 0.1% hydrochloric acid), vortexed for 5 min, and sonicated for 5 min. After centrifugation for 3 min at 12,000 r/min at 4 °C, the supernatant was aspirated, and the process was repeated. The two supernatants were combined, filtered through a microporous membrane (0.22 μm pore size), and stored in an injection vial for liquid chromatography–tandem mass spectrometry (LC-MS/MS, Framingham, MA, USA) analysis. The data acquisition instrumentation system consisted primarily of an ultra-performance liquid chromatograph (ExionLC™ AD, Framingham, MA, USA) and tandem mass spectrometer (QTRAP® 6500+, Framingham, MA, USA).
The mass spectrometric data were processed using Analyst 1.6.3 software. The retention time of the detection and the ion flow intensity of the ion detection were recorded. Then, the mass spectrometric data were processed using MultiQuant 3.0.3 software, the retention time and peak shape information of the standards were referenced, and the peaks detected in different samples of the analytes were corrected for integration to ensure the accuracy of the qualitative and quantitative analysis. Next, standard solutions of different concentrations were prepared (0.01, 0.05, 0.1, 0.5, 1, 5, 10, 50, 100, 500, 1,000, 2,000, and 5,000 ng/mL). The chromatographic peak intensity data for the corresponding quantitative signals for each standard concentration were recorded. A standard curve for each substance was plotted with the standard concentration as the independent variable (x-axis coordinate) and the peak area as the dependent variable (y-axis coordinate). The integrated peak areas of all detected samples were substituted into the linear equation for the standard curve for calculation and further substituted into the calculation formula to determine the content of the substance in the samples.
Sensory quality analysis
-
The sensory quality of infusions prepared from the leaf samples was blindly assessed according to a standardized procedure (Chinese Standard GB/T 23776-2009). The appearance, taste, aroma, and color of the infusions, as well as key features of the infused leaves, were assessed and scored by a tasting panel that consisted of five officially certified tea tasters. The infusion process comprised infusion of 3 g leaf samples in 150 mL freshly boiled water for 4 min. The total score per sample was calculated by summing the individual taster’s scores for the above-mentioned attributes first adjusted by weighting factors of 0.25, 0.30, 0.25, 0.10, and 0.10, respectively.
Data processing
-
All experimental data were collated and mean values calculated using Microsoft Excel 2010 software. Statistical analysis and calculation of the standard deviation were conducted using SPSS 18.0 statistical software. The least significant difference (LSD) method was used to test the significance of differences between means (p < 0.05) GraphPad Prism 8.3.0 and OriginPro 2021 software were used for graphic presentation of the data. Principal component analysis (PCA) and partial least squares–discriminant analysis (PLS-DA) were used to analyze and visualize the metabolomic differences among the treatments after mean centering and unit variance. Identified metabolites were annotated using Kyoto Encyclopedia of Genes and Genomes (
www.kegg.jp/kegg/ , accessed on 5 November 2021). -
Significant reduction (p < 0.05) in the carbon content of new shoots was observed in the P and HP treatments compared with that of the control (LP) (Fig. 1). Notably, no significant difference (p > 0.05) in carbon content was detected between the P and HP treatments. No significant difference (p > 0.05) in nitrogen content was observed between the LP and P treatments, and between the LP and HP treatments. The phosphorus content was significantly (p < 0.05) higher in the HP treatment than in the P treatment, and significantly (p < 0.05) higher in the P and HP treatments than in the control (LP). The P treatment had the highest potassium content in new shoots, whereas the LP-treated group had a higher leaf potassium content than the HP-treated group.
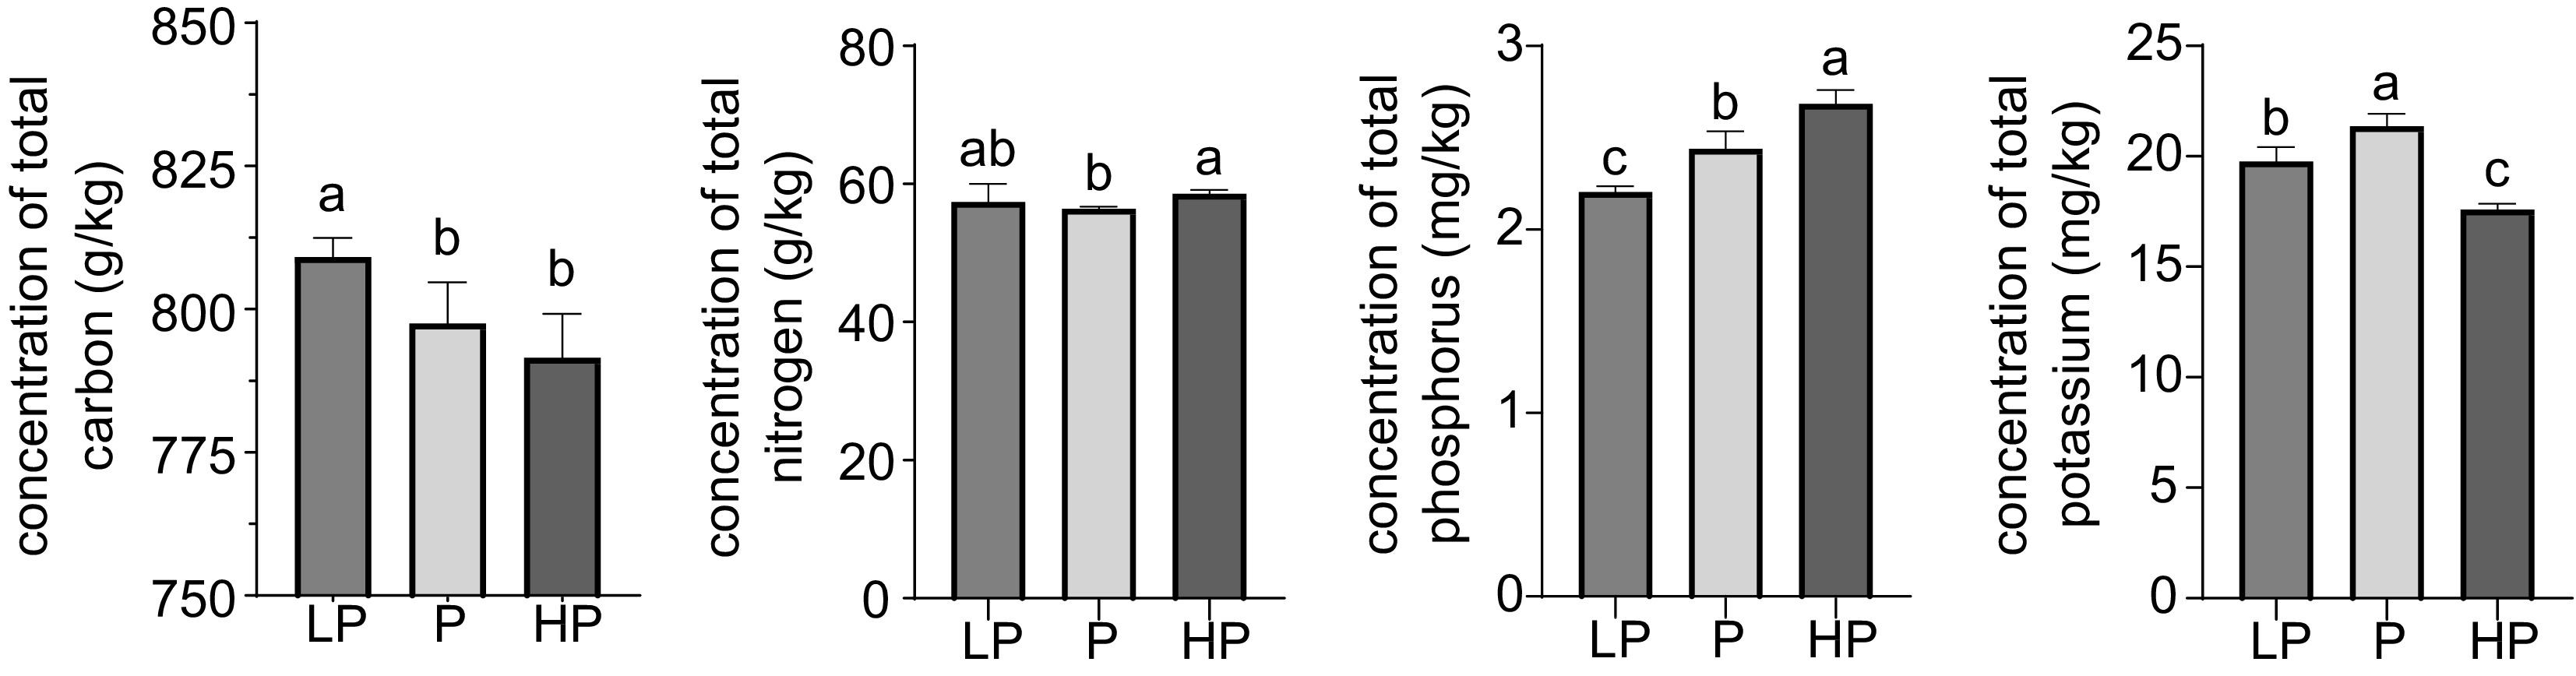
Figure 1.
Effect of phosphorus treatments on total carbon, nitrogen, phosphorus, and potassium content in young shoots of tea plants. LP, no phosphorus fertilizer applied (control); P, 3 g calcium superphosphate applied per pot; HP, 10 g calcium superphosphate applied per pot. Bars and error bars indicate the mean ± SD (n = 3). Different lowercase letters above bars indicate a significant difference between treatments (p < 0.05, LSD test).
Biochemical quality of new shoots
-
No significant difference (p > 0.05) was observed in the relative chlorophyll content of leaves between treatments (Fig. 2). The free amino acid content of new shoots was significantly higher in the HP treatment than in the LP treatment (p < 0.05). It is noteworthy that the total polyphenol content of new shoots was significantly lower in the P and HP treatments compared with that of the LP treatment (p < 0.05), but no significant difference was detected between the P and HP treatments (p > 0.05). The ratio of total polyphenols to amino acids was consistent with the results for the total polyphenol content.
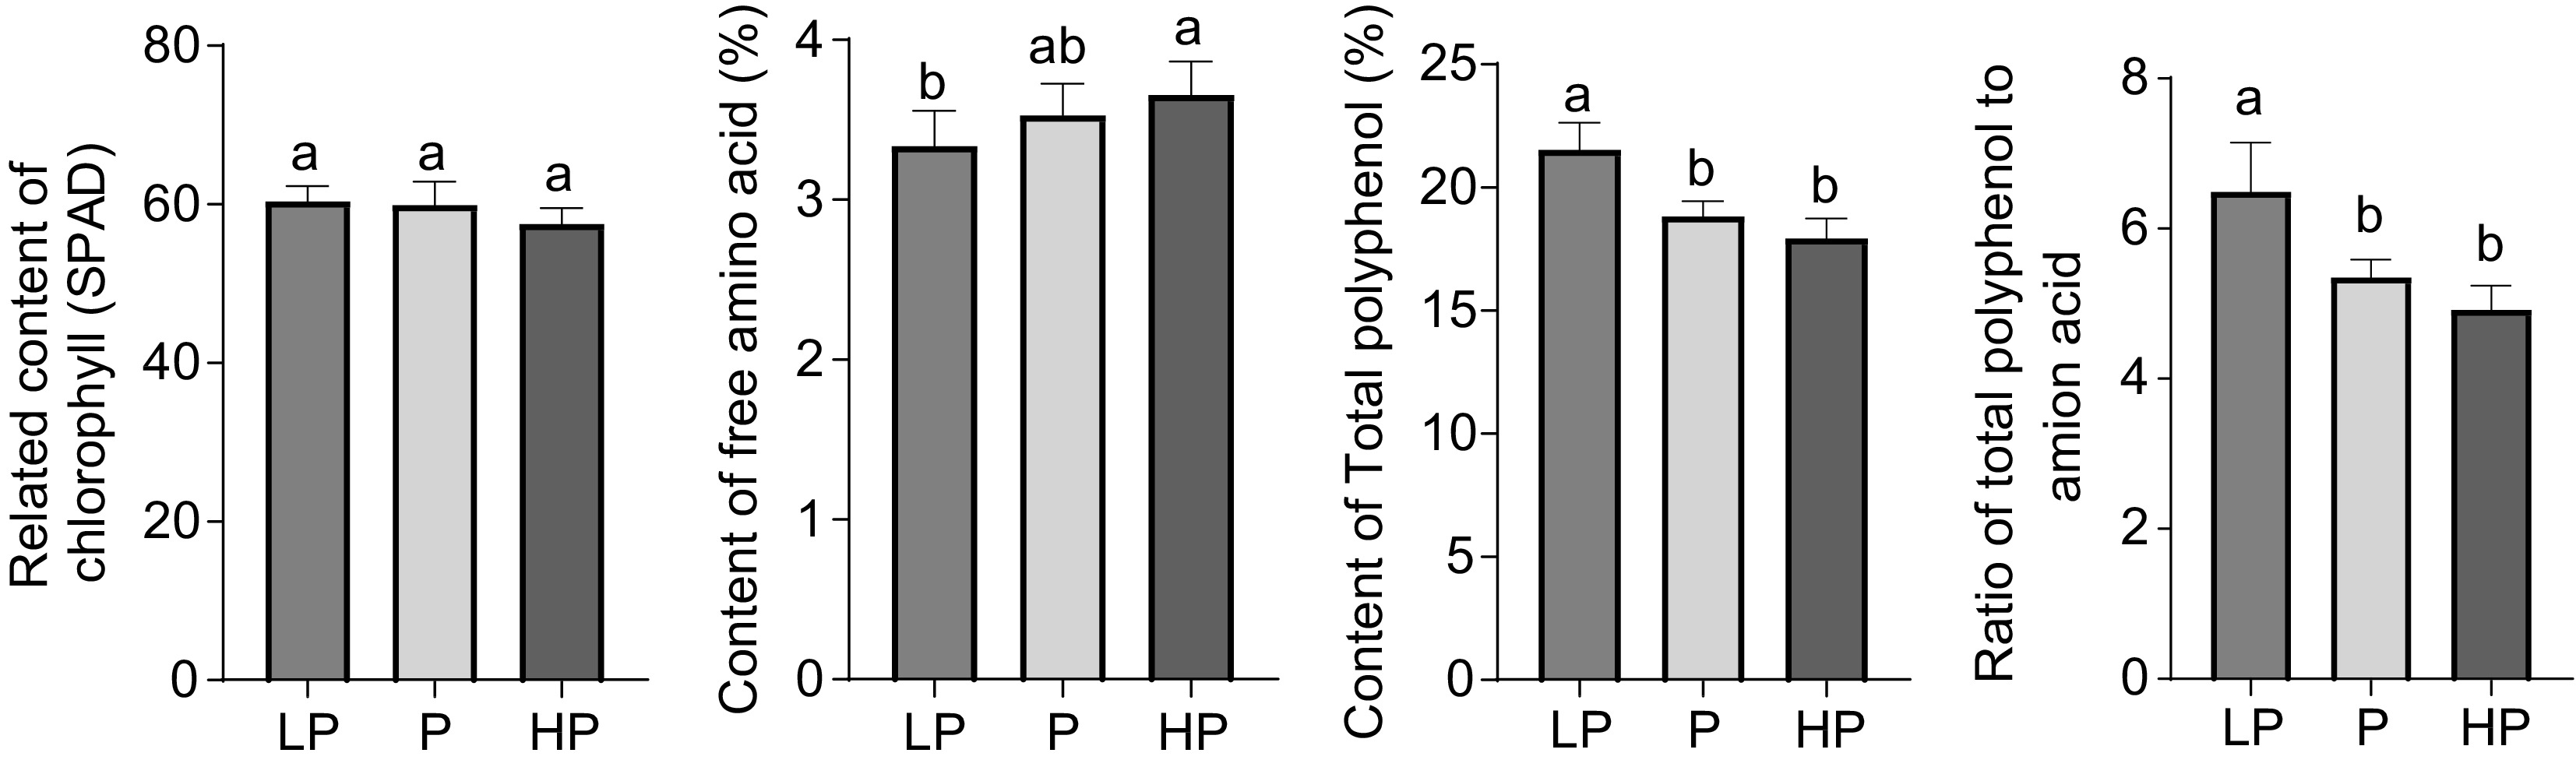
Figure 2.
Effect of phosphorus treatments on the content of chlorophyll, free amino acids, total polyphenols, and the ratio of total polyphenols to amino acids in young shoots of tea plants. LP, no phosphorus fertilizer applied (control); P, 3 g calcium superphosphate applied per pot; HP, 10 g calcium superphosphate applied per pot. Bars and error bars indicate the mean ± SD (n = 3). Different lowercase letters above bars indicate a significant difference between treatments (p < 0.05, LSD test).
Sensory quality of tea leaf infusions
-
The highest score for the sensory quality of tea infusions was awarded for the P treatment with 91.65, followed by the HP treatment with 91.35 and the LP treatment with 89.925 ( Fig. 3 ). Compared with the scores for the infusions from the P treatment, the color, aroma, and taste of the infusions for the LP treatment were reduced, and the appearance and taste of the tea from the HP treatment were reduced.
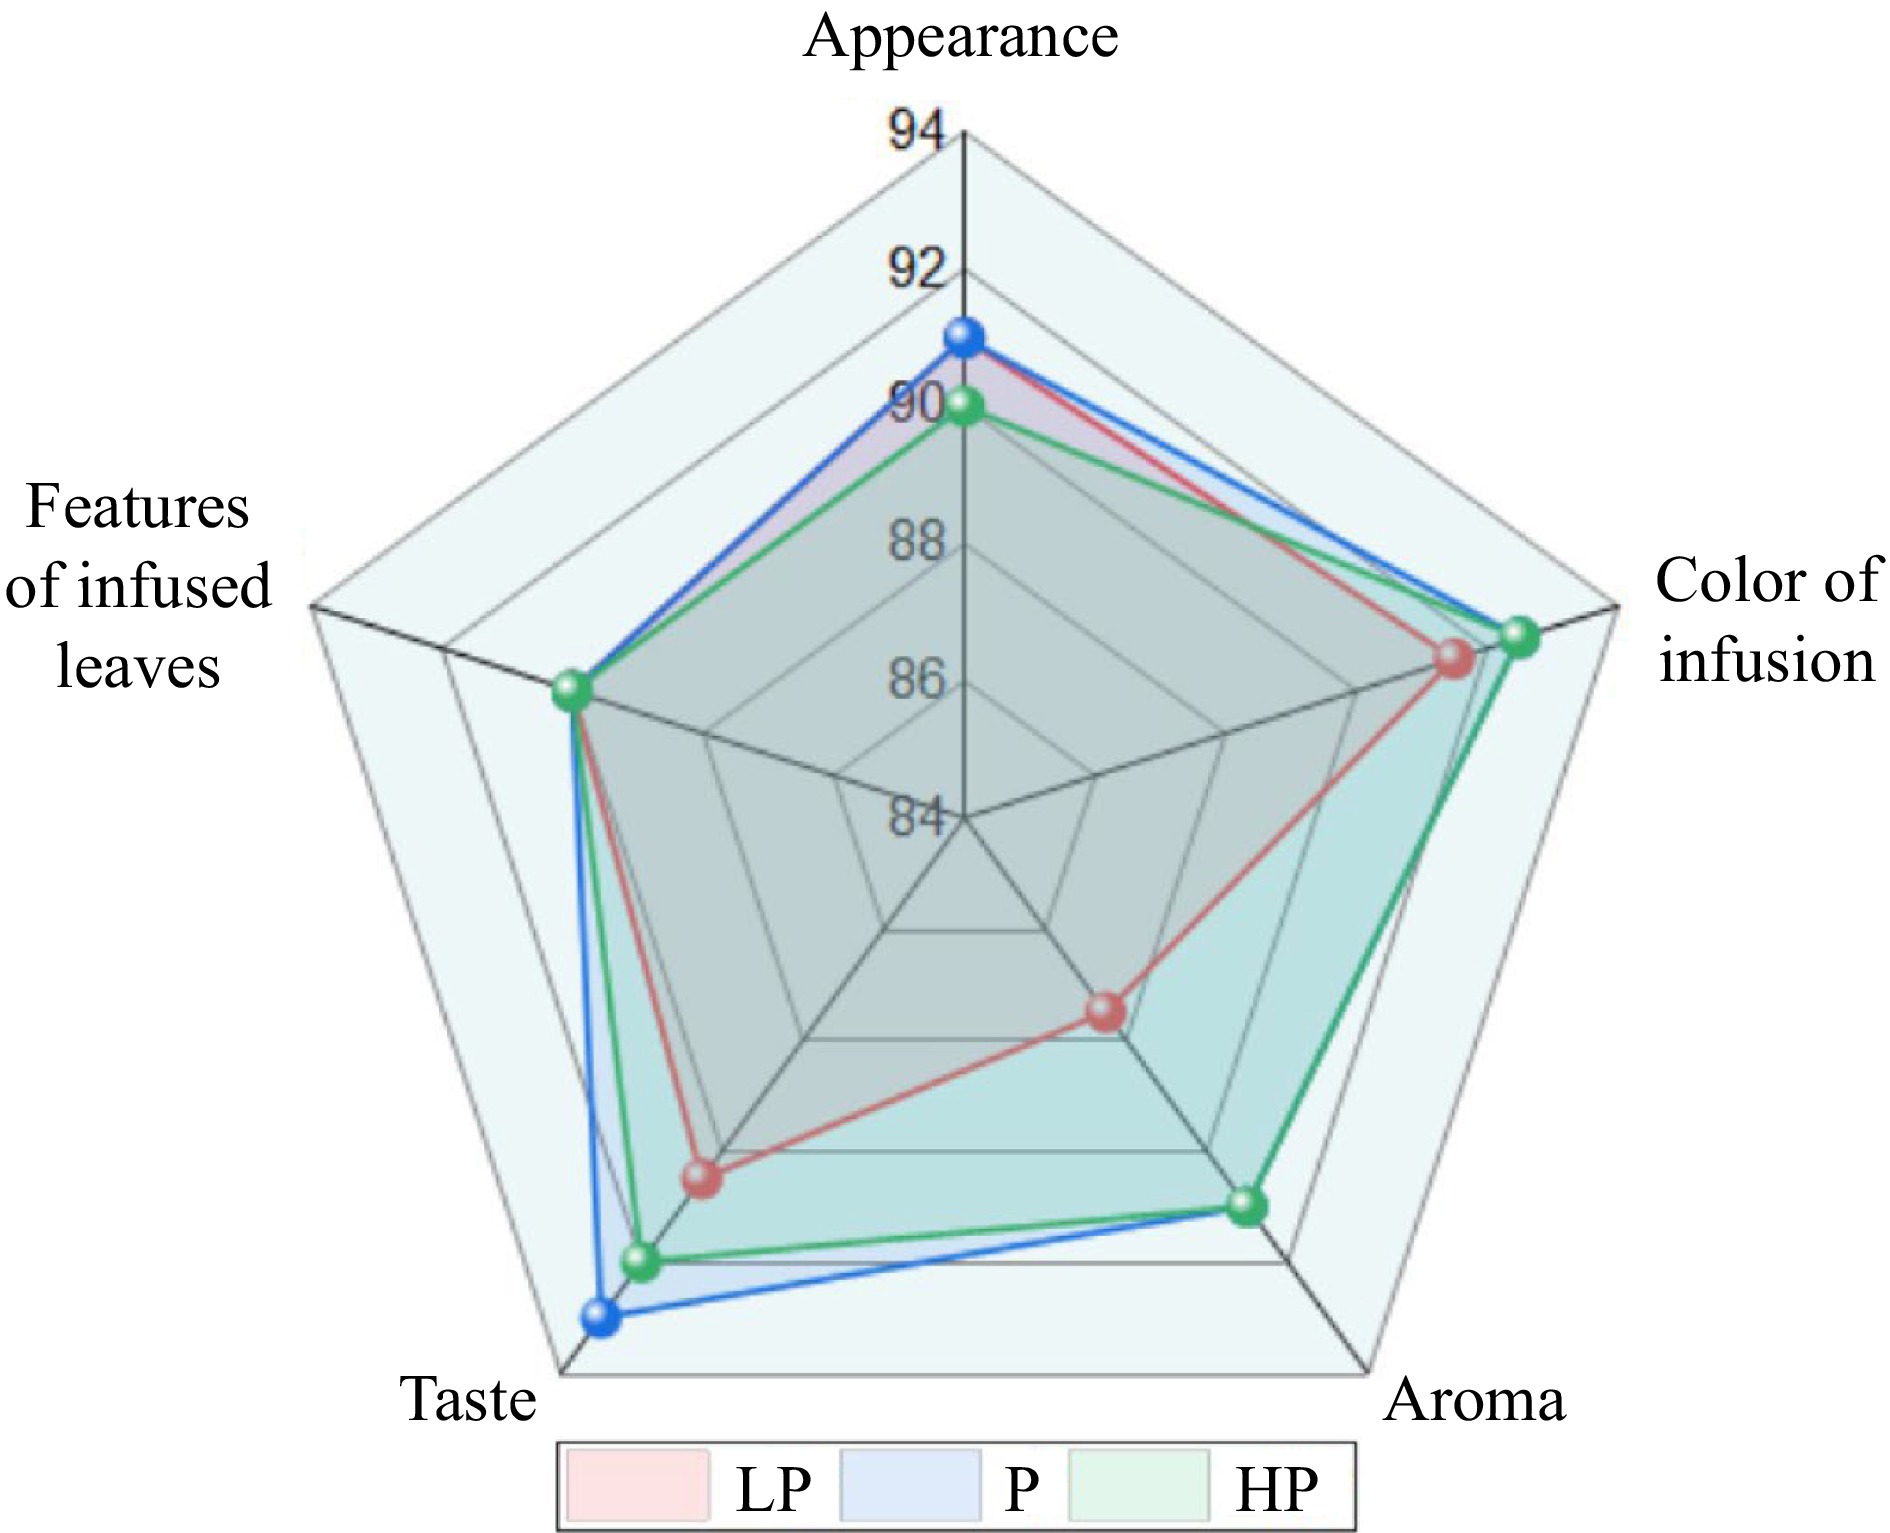
Figure 3.
Effect of phosphorus treatments on the sensory quality of infusions prepared from young tea shoots. LP, no phosphorus fertilizer applied (control); P, 3 g calcium superphosphate applied per pot; HP, 10 g calcium superphosphate applied per pot.
Anthocyanin metabolism
-
To investigate the effect of the three phosphorus concentration treatments on the relative content of anthocyanins in young shoots, five anthocyanins were analyzed qualitatively and quantitatively, comprising delphinidin, cyanidin, pelargonidin, peonidin, and petunidin (Fig. 4). The highest content detected was for delphinidin (36.72 μg/g), followed by pelargonidin, cyanidin, and peonidin, and the lowest content was of petunidin. Except for petunidin-like anthocyanins, the total amount of each type of anthocyanin was highest in the LP treatment. Compared with the P treatment, the content of each anthocyanin type was not significantly reduced in the HP treatment.
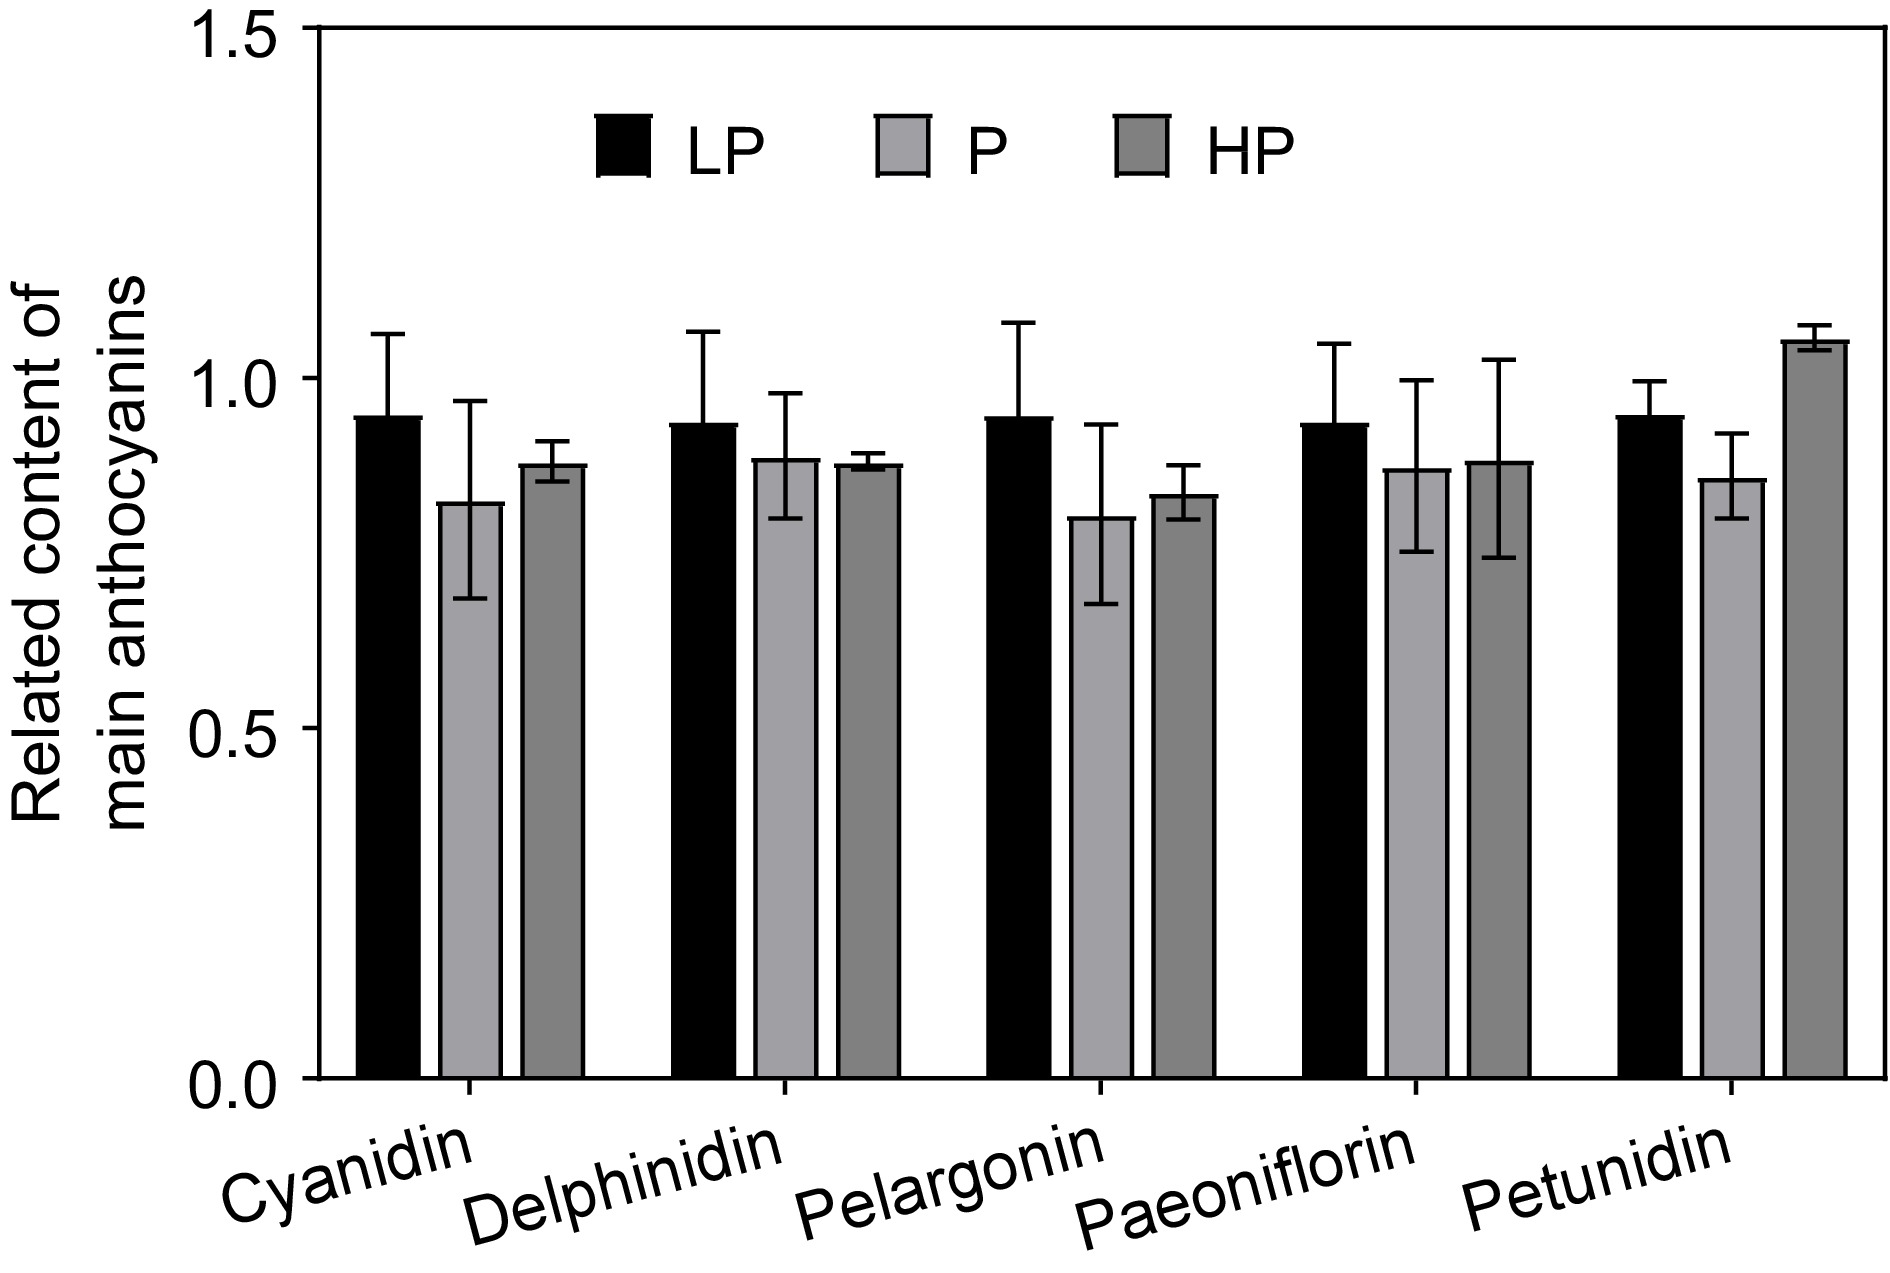
Figure 4.
Effect of phosphorus treatments on the relative content of the main anthocyanins detected in young shoots of tea plants. LP, no phosphorus fertilizer applied (control); P, 3 g calcium superphosphate applied per pot; HP, 10 g calcium superphosphate applied per pot. Bars and error bars indicate the mean ± SD (n = 3).
Multivariate statistical analysis of metabolomic data was conducted. Scatterplots of the first and second principal components (PC1 and PC2; Fig. 5) showed that the anthocyanin metabolites of the replicate samples within a fertilization treatment were more aggregated, and the reproducibility of samples within a treatment was good, whereas more distinct separation of the anthocyanin metabolites between the treatments was observed. Thus, the PCA indicated that there were more distinct differences in metabolites between the fertilization treatments than among the replicate samples within a treatment. The PC1 and PC2 explained 32% and 20% of the total variance, and thus about 52% of the representative characteristics of tea plant metabolites were better clustered. The typical compounds corresponding to the characteristics of samples from each treatment, as indicated by the PCA loadings, were cyanidin-3-O-xyloside, cyanidin-3-O-sambubioside, delphinidin-3-O-rutinoside, and delphinidin-3,5-O-diglucoside (Fig. 5).
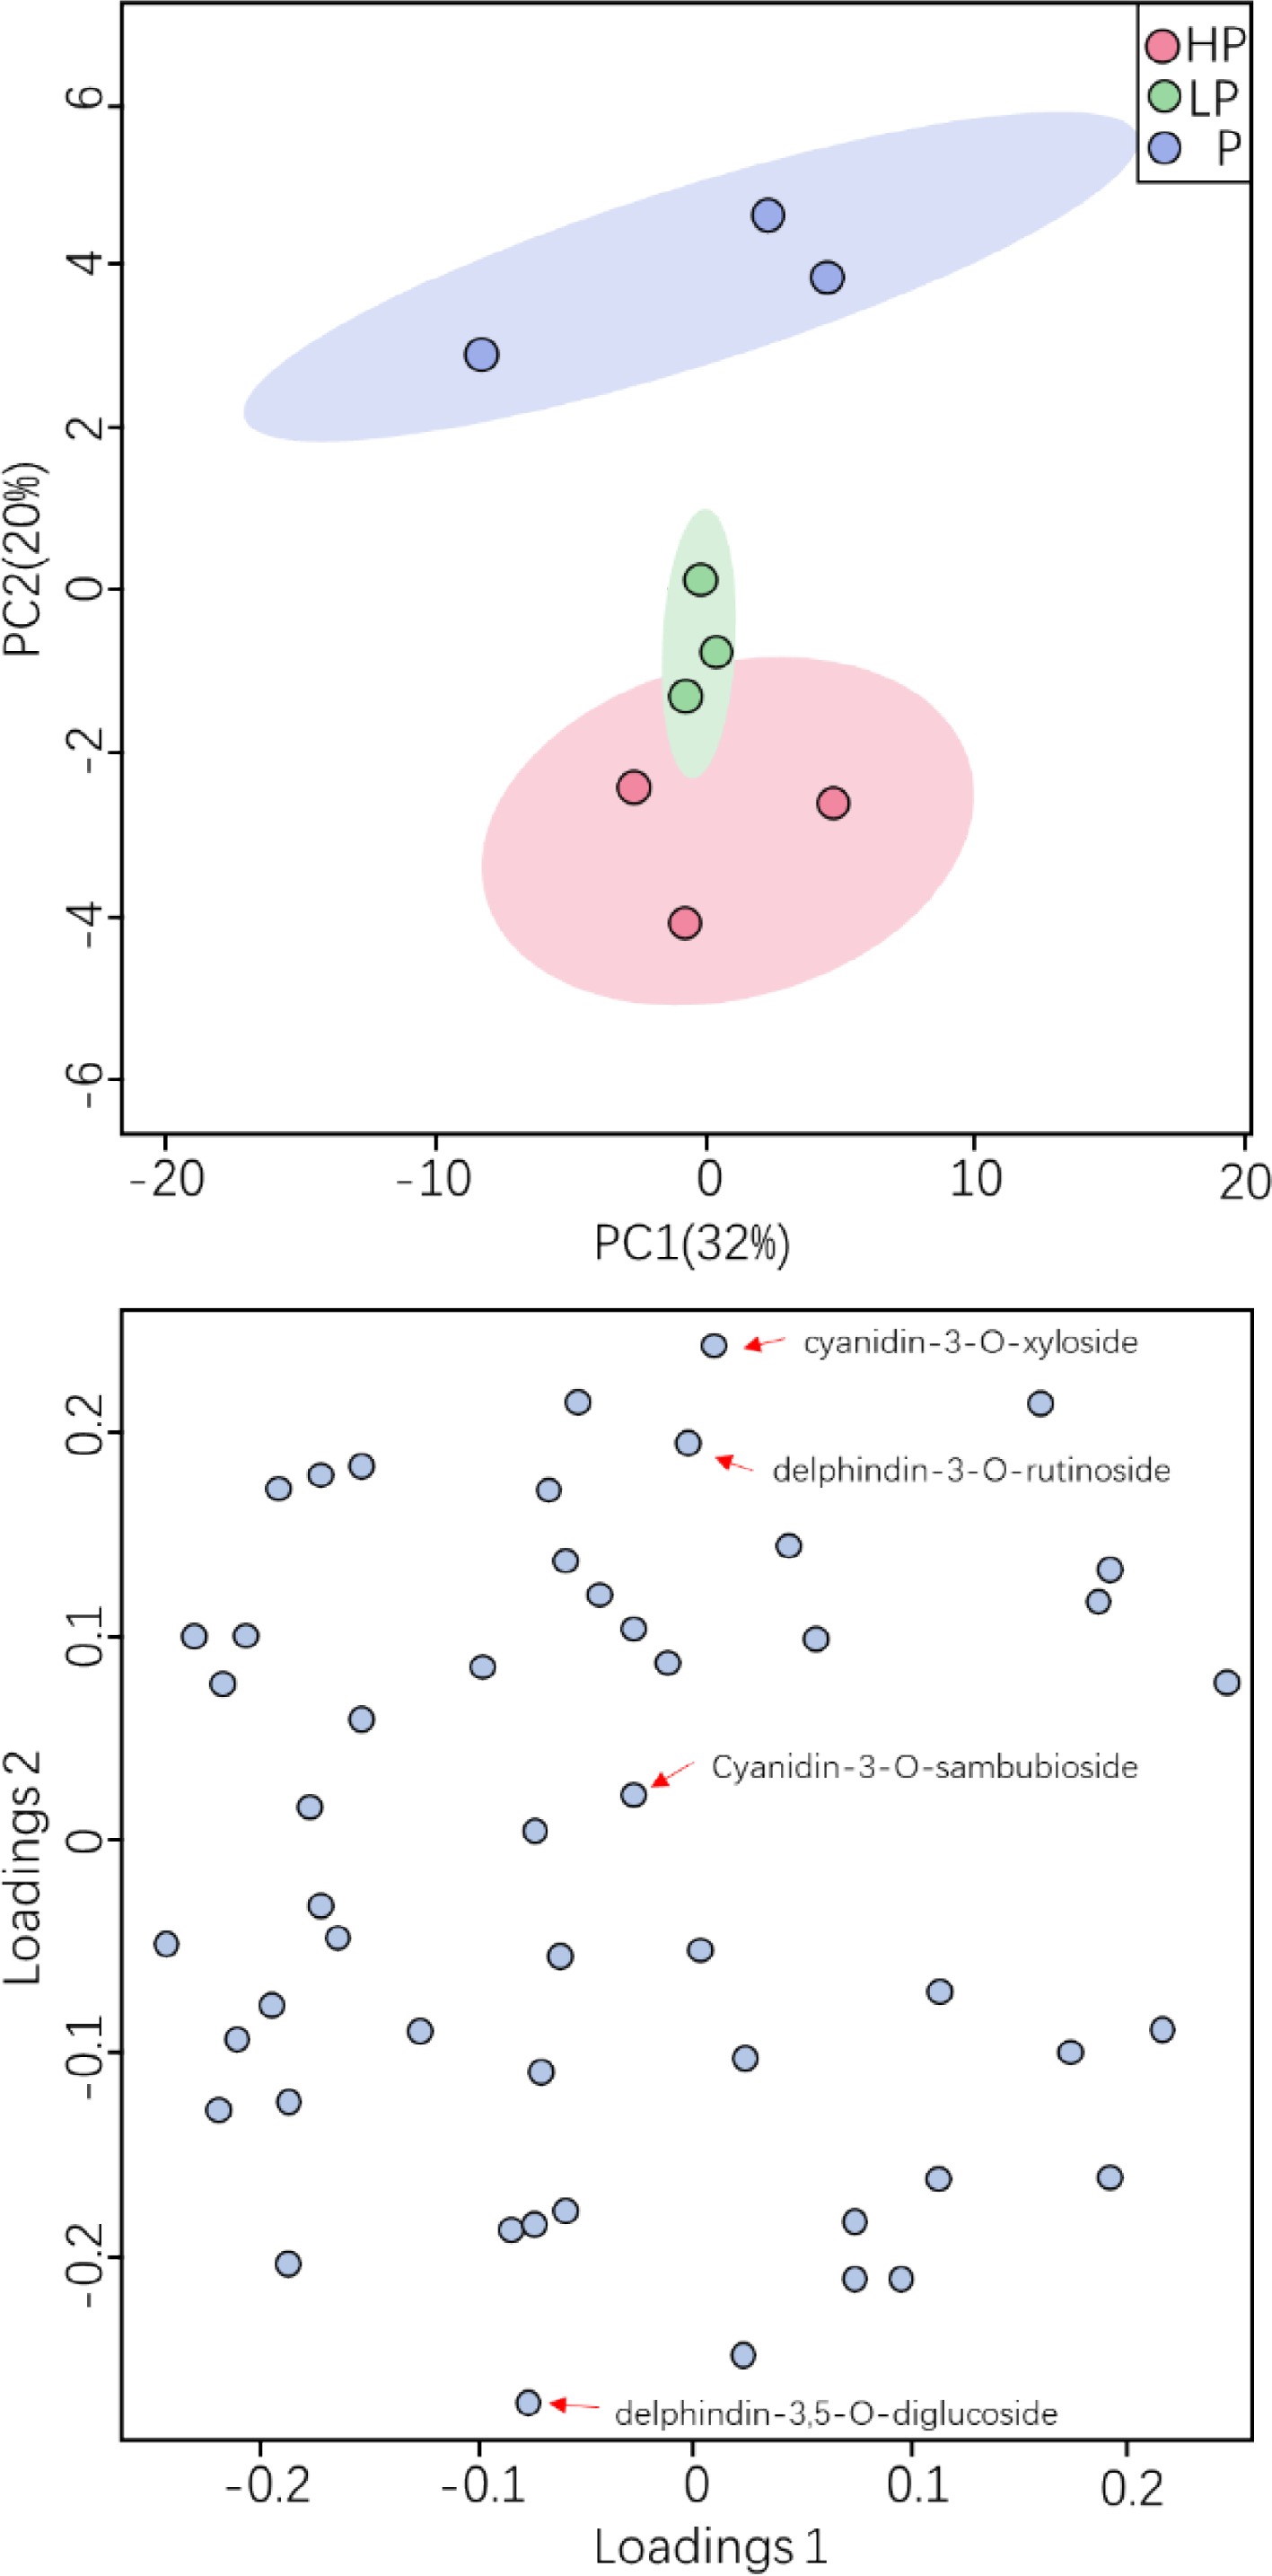
Figure 5.
Effect of phosphorus treatments on anthocyanin metabolites in young shoots of tea plants.
To identify the metabolites differentially accumulated between fertilized and nonfertilized tea plants as well as between tea plants of each fertilization treatment, OPLS-DA was performed based on the PCA (Fig. S1, S2 ). The predictive parameters of the OPLS-DA evaluation model were R2X (the rate of explanation of the X matrix by the proposed model), R2Y (the rate of explanation of the Y matrix by the proposed model), and Q2 (the predictive power of the model) with values of 0.728, 0.539, and 0.23, indicating that the model fit was average.
Compared with the P treatment, in the phosphorus-deficient treatment (LP) peonidin-3-O-sambubioside-5-O-glucoside and peonidin-3-O-5-O-(6-O-p-coumaroyl)-glucoside accumulation was up-regulation by 1.692- and 1.992-fold, respectively, and cyanidin-3-O-xyloside accumulation was down-regulated by 1.424-fold ( Fig. 6 ). Peonidin-3-O-sambubioside-5-O-glucoside and peonidin-3-O-5-O-(6-O-p-coumaroyl)-diglucoside accumulation was up-regulated under excess phosphorus application compared with the P treatment by 1.641- and 1.915-fold, respectively.
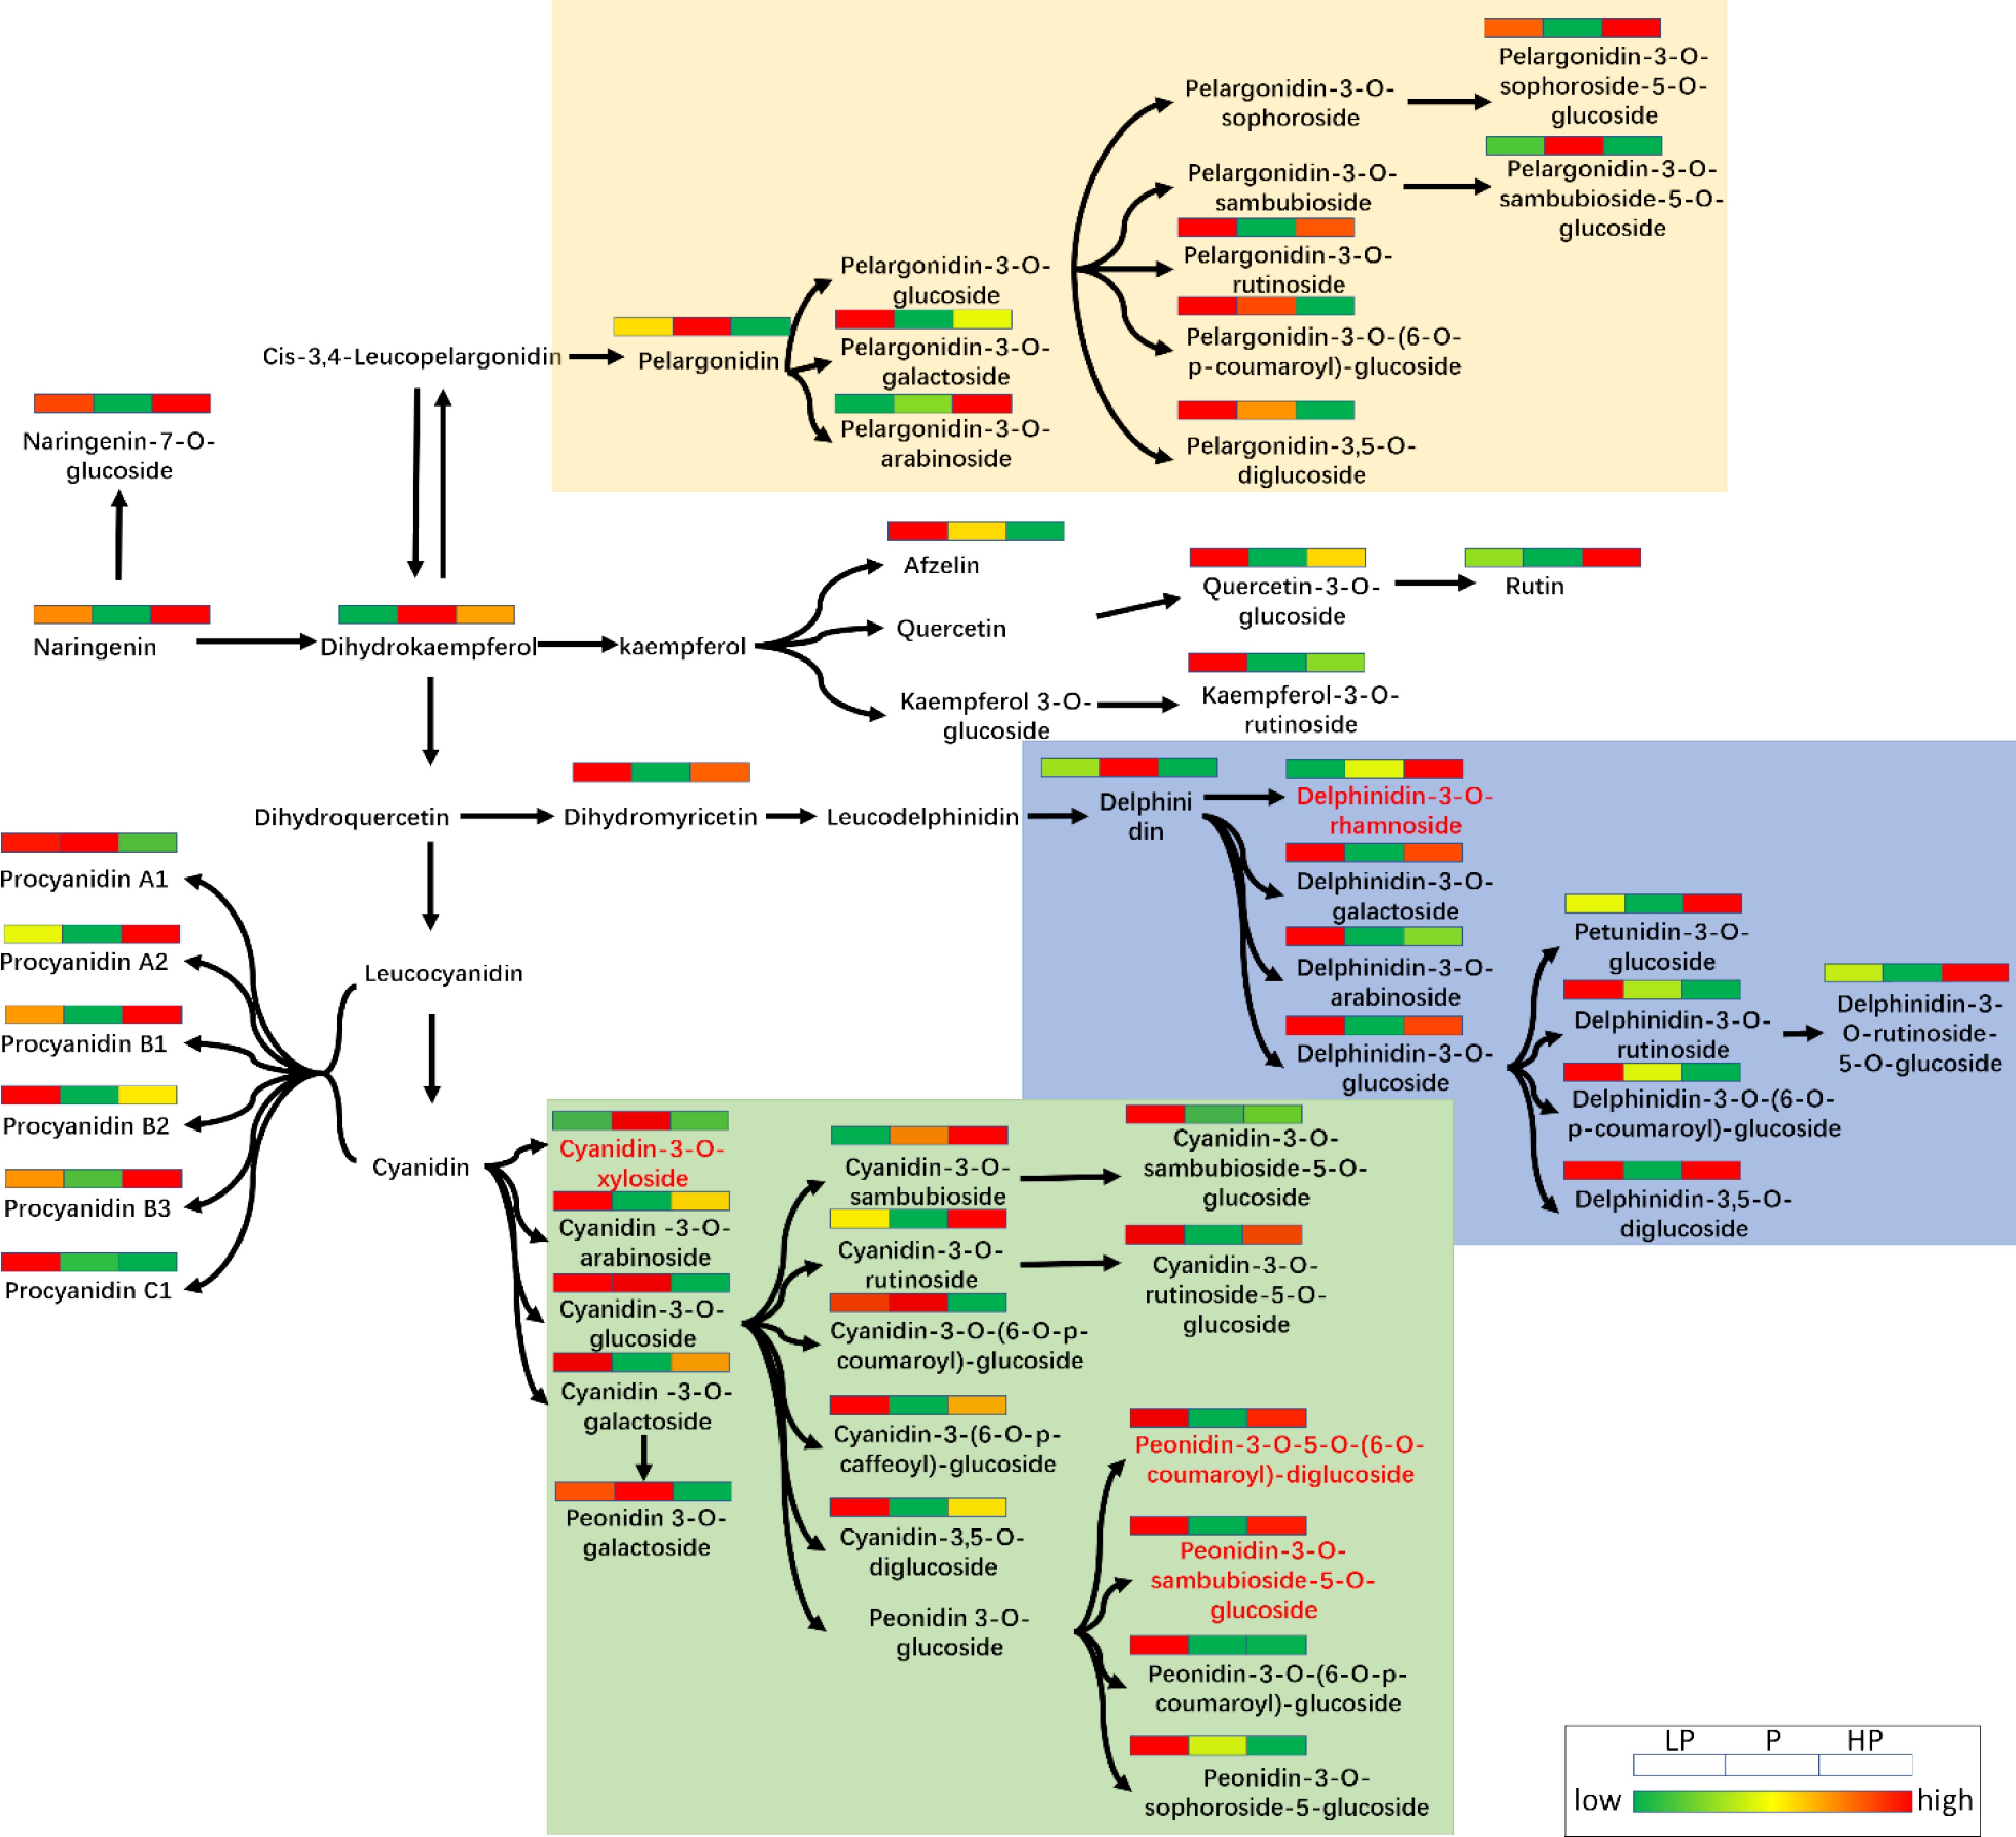
Figure 6.
Schematic diagram of anthocyanin metabolic pathways in young shoots of tea plants under three relative phosphorus fertilizer treatments.
-
Phosphorus nutrient supply has an important influence on tea quality. Phosphorus deficiency suppresses plant leaf growth and aboveground biomass, but promotes plant root growth[35−37]. Under phosphorus stress, the production of endogenous hormones and root secretions by plants is promoted[38,39]. Kavanová et al. observed that phosphorus deficiency resulted in reduced leaf epidermal cell division and elongation in perennial ryegrass[40], reducing leaf elongation by 39%. Phosphorus deficiency not only leads to abnormalities in plant growth and physiology, but also the accumulation of polyphenols in plants. Sarker & Karmoker reported that sugar accumulation was reduced in leaves and stems but increased in the roots of lentil under phosphorus deficiency, which further caused increase in the contents of proline and phenolic compounds in the roots and stems and of anthocyanins in the leaves compared with those of the control[39]. In the tea plant, phosphorus deficiency promotes increase in the content of polyphenols[24]. In the present experiment, the polyphenol content in tea leaves under phosphorus deficiency was significantly higher compared with that under normal phosphorus supply. More importantly, the sensory quality assessment indicated that tea leaves prepared from phosphorus-deficient tea plants were of the poorest quality. In addition, phosphorus deficiency significantly increased the contents of pelargonin and paeoniflorin in the young shoots, and these anthocyanins had an important effect on the color and/or taste of the tea infusion, thereby reducing the sensory quality of the tea product.
Similar to insufficient phosphorus fertilizer supply, excessive phosphorus fertilizer input is also a frequent issue in current tea production[1]. Excessive inputs of phosphorus fertilizer have proved to be highly inhibitory of plant growth[41] and reduce fruit palatability[42]. Excessive phosphorus concentrations lead to the production of shallow root systems and reduce primary root growth, root apical meristem size, and meristem activity in plants[43]. The relative phosphorus content in different organs of tea plants is root > leaf > stem. Phosphorus application significantly increases the phosphorus content of tea plants and increases yield, but at a certain phosphorus concentration in the soil, tea plant biomass ceases to increase with continued phosphorus application[44,45]. In the present study, excessive phosphorus fertilizer input resulted in accumulation of active-state phosphorus in the soil but did not increase the quality of tea leaves; instead, the taste and color of the tea infusion were reduced compared with those under normal phosphorus supply. Although no significant difference in total polyphenol content was detected, changes were observed in other plant nutrient contents, such as potassium. Interestingly, an increase in anthocyanin accumulation under excessive phosphorus fertilizer input was observed. Based on the findings of previous studies, we speculate that this may be associated with nutrient partitioning and nutrient interactions[46−48].
-
We have revealed the effects of phosphorus fertilizer concentration on tea quality and metabolism of key quality components in a pot experiment. Our results showed that irrational (excessive or deficient) phosphate fertilization reduced the sensory quality of tea product, and induced the accumulation of certain anthocyanins. The results provide a scientific basis for formulation of a rational phosphate fertilization strategy in tea plantations.
The work was financially supported by the National Key Research and Development Program of China (2021YFD1601105), the Chinese Academy of Agricultural Sciences through Agricultural Sciences Innovation Project (CAAS-ASTIP-2017-TRICAAS) and China Agriculture Research System of MOF and MARA (CARS-19).
-
The authors declare that they have no conflict of interest.
- Supplemental Fig. S1 OPLS-DA score plot.
- Supplemental Fig. S2 The permutation test diagram for model validation of OPLS-DA.
- Copyright: © 2023 by the author(s). Published by Maximum Academic Press, Fayetteville, GA. This article is an open access article distributed under Creative Commons Attribution License (CC BY 4.0), visit https://creativecommons.org/licenses/by/4.0/.
-
About this article
Cite this article
Zhang H, Li C, Wei K, Liu M, Shi Y, et al. 2023. The reduction of tea quality caused by irrational phosphate application is associated with anthocyanin metabolism. Beverage Plant Research 3:10 doi: 10.48130/BPR-2023-0010 

The reduction of tea quality caused by irrational phosphate application is associated with anthocyanin metabolism
- Received: 24 December 2022
- Revised: 27 March 2023
- Accepted: 28 March 2023
- Published online: 28 April 2023
Abstract: Phosphorus (P) is the second most limiting nutrient for plant growth. Previous studies suggested that P substantially affects the yield and quality of tea by affecting root growth, the decomposition and metabolism of minerals and metabolites in plants. Thus, the environmental pollution and degradation of crop quality caused by irrational fertilization is of increasing interest for researchers worldwide. To understand the effects of P fertilization on tea quality and metabolism of key quality components, three P fertilization levels (excessive, appropriate, and deficient application) were applied to tea plants using pot experiments. Content of P, potassium, polyphenols, amino acids and anthocyanins in the leaves or soil were quantified. The sensory quality of tea infusion was reduced under irrational (excessive or deficient) P fertilization. Under P deficiency, the total content of polyphenols and anthocyanins in the leaves were strongly increased compared with those of the control. A high soil P content (excessive) inhibited polyphenol accumulation, but induced the accumulation of certain anthocyanins, such as peonidin-3-O-sambubioside-5-O-glucoside and peonidin-3-O-5-O-(6-O-p-coumaryl)-diglucoside. These results suggest that the reduction of tea quality caused by irrational P application is associated with anthocyanin metabolism, which provides a scientific basis for improving P fertilization strategies in tea plantations.
-
Key words:
- Phosphate fertilizer /
- Anthocyanidin /
- Tea quality /
- Metabolome