-
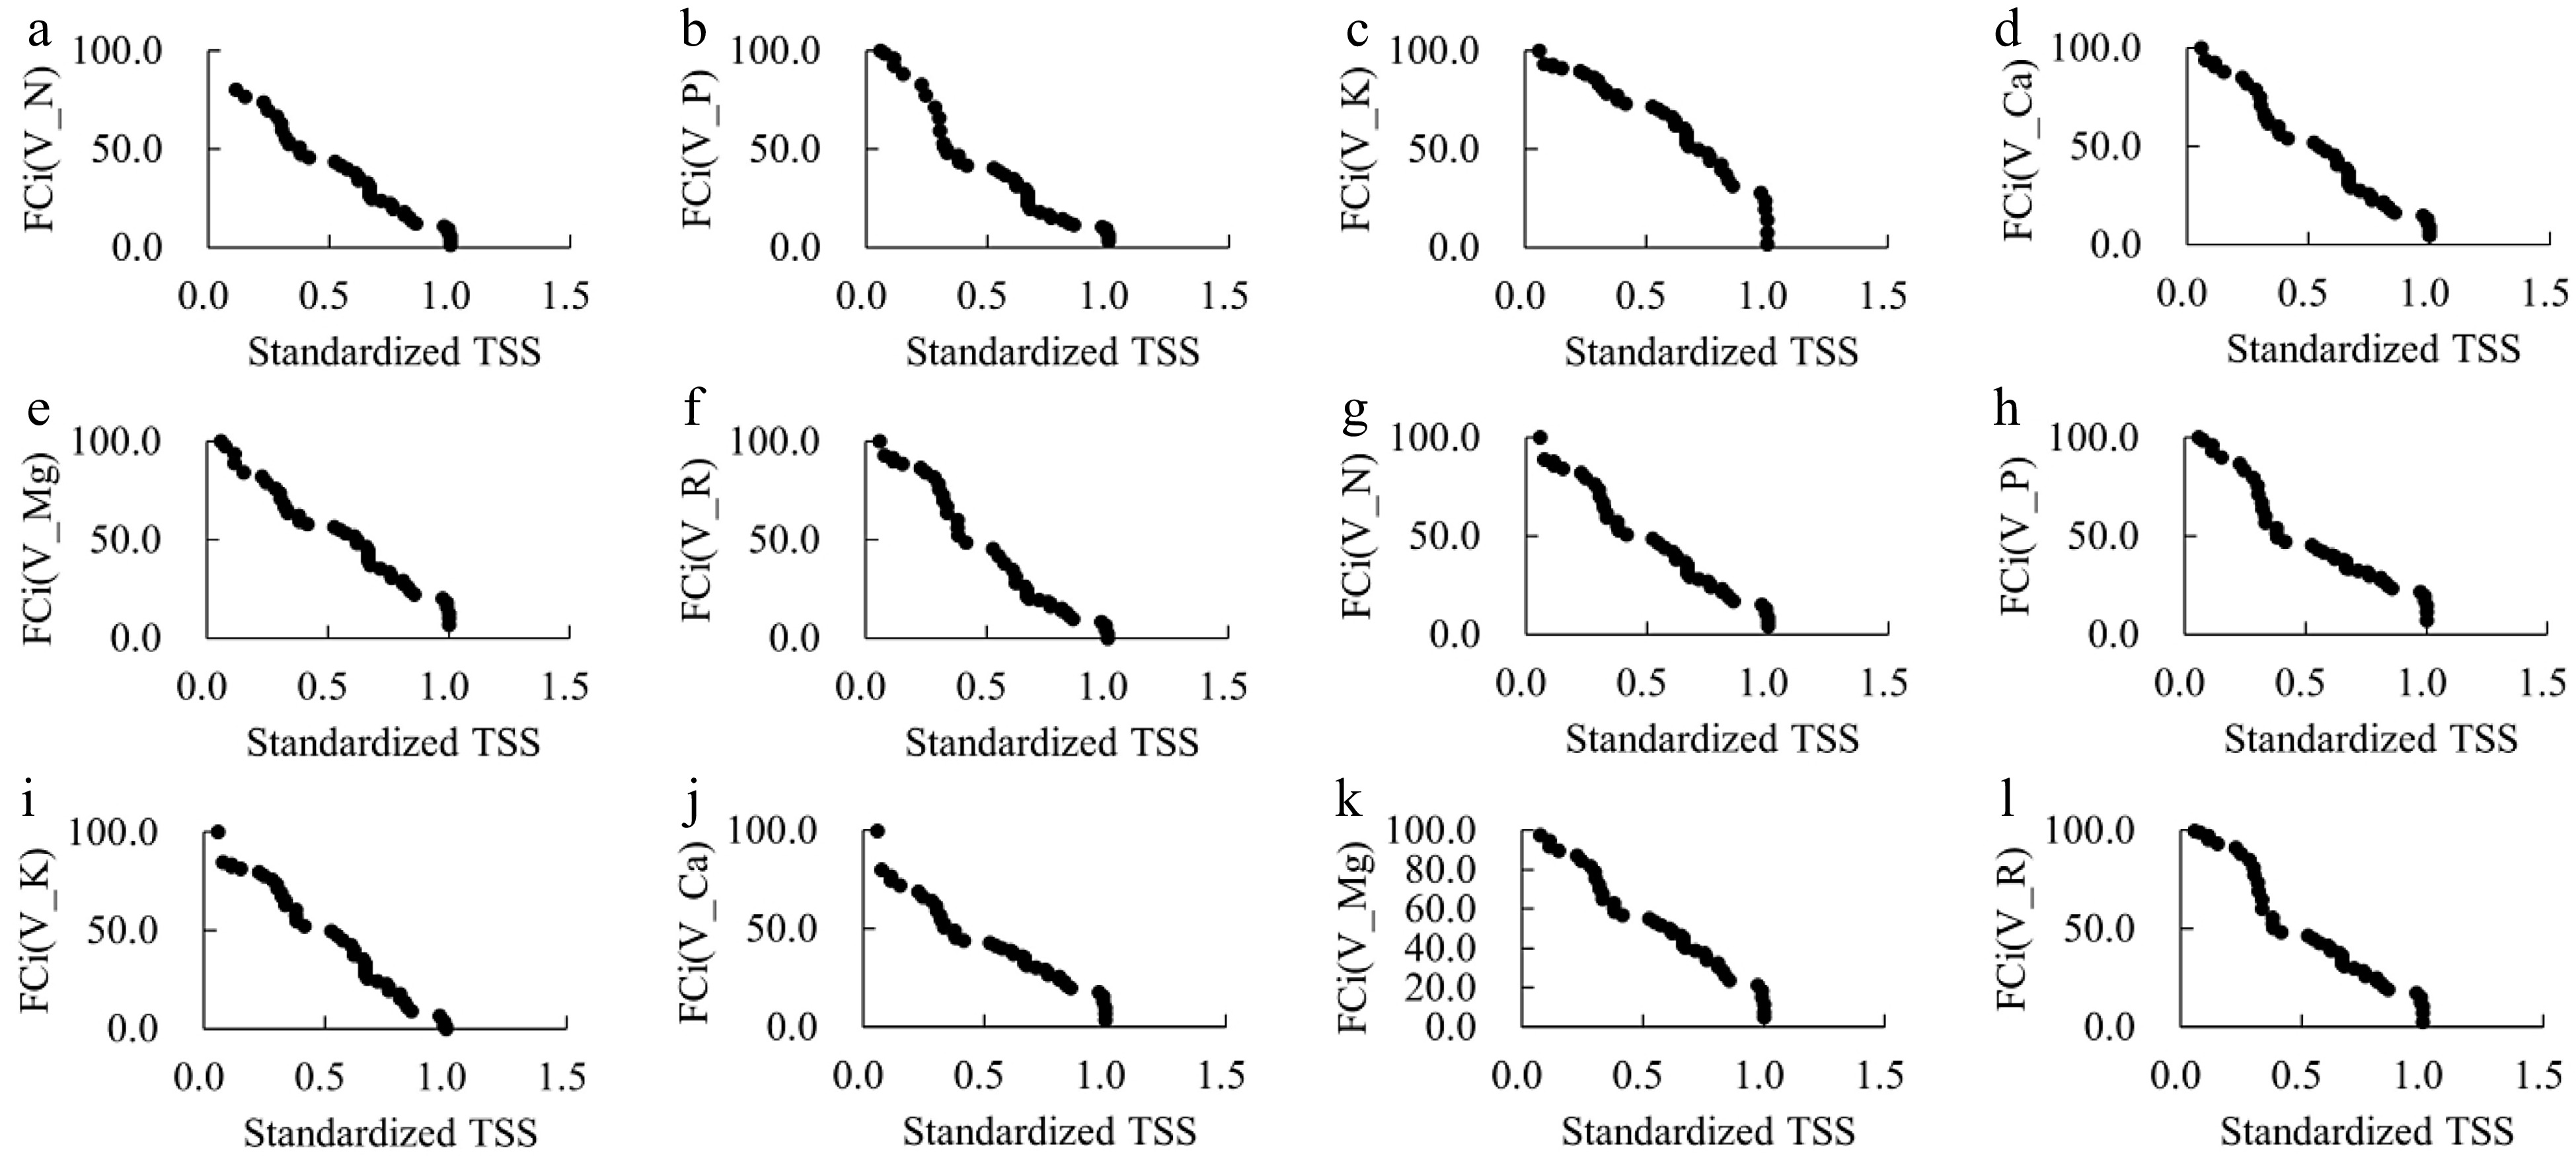
Figure 1.
The relationship between the cumulative variance function of each element and standardized TSS. (a)−(f) represent cumulative variance function of FBS_L_N, MS_L_P, FBS_L_K, MS_F_Ca, FBS_P_Mg and R of plants, respectively. (g)−(l) represent GS_N, GS_P, IFS_K, VS_Ca, MS_Mg and R of soil, respectively.
-
Treatment Year 2019-TSS % 2020-TSS % 2021-TSS % T1 23.7 ± 0.8d 22.6 ± 0.8bc 19.3 ± 0.9abc T2 26.5 ± 0.5a 24.3 ± 1.2a 19.4 ± 0.6ab T3 25.8 ± 1.1abc 22.4 ± 0.8bc 19.2 ± 0.1abcd T4 25.5 ± 0.0abc 21.9 ± 0.7bc 19.3 ± 0.2abc T5 25.8 ± 0.0abc 21.6 ± 1.0c 19.7 ± 0.4a T6 25.2 ± 1.0bc 21.8 ± 0.7bc 18.4 ± 0.1cde T7 26.4 ± 0.9a 22.7 ± 0.1bc 19.1 ± 0.9abcd T8 26.4 ± 0.4ab 22.6 ± 0.6bc 18.9 ± 0.3abcd T9 26.4 ± 0.8ab 22.4 ± 0.1bc 18.7 ± 0.6bcd T10 25.2 ± 0.0bc 23.1 ± 0.7b 18.8 ± 0.1abcd T11 25.5 ± 0.2abc 22.3 ± 0.2bc 19.0 ± 0.4abcd T12 23.8 ± 0.4d 21.8 ± 0.7bc 17.6 ± 0.4e T13 24.9 ± 0.9c 21.9 ± 0.4bc 18.3 ± 0.6de T14 22.6 ± 0.6e 22.0 ± 0.7bc 18.3 ± 0.5de T15 25.1 ± 0.5c 22.5 ± 1.1bc 19.0 ± 0.4abcd T16 25.2 ± 0.7bc 22.2 ± 0.3bc 18.9 ± 0.6abcd Different lowercase letters in the same column of data indicate the significant difference between different treatments at the P < 0.05 level. Table 2.
Effects of fertilization treatments on fruit TSS in 2019−2021.
-
Type Factors FCi(Vx) = AY3 + BY2 + CY + D R2 Determined cutoff Optimum range mg/g Plant FBS_L_N FCi(VN) = −31.736Y3 + 84.935Y2 − 145.17Y + 97.153 0.9809 0.8921 22.728−42.140 MS_L_P FCi(VP) = −70.578Y3 + 203.17Y2 − 244.62Y + 118.04 0.9738 0.9596 0.273−8.227 FBS_L_K FCi(VK) = −53.314Y3 + 25.432Y2 − 58.365Y + 99.83 0.9788 0.1590 7.850−25.124 MS_F_Ca FCi(VCa) = 14.076Y3 + 7.8741Y2 − 118.67Y + 105.49 0.9836 −0.1865 3.192−39.975 FBS_P_Mg FCi(VMg) = −69.267Y3 + 124.76Y2 − 150.6Y + 107.08 0.9825 0.6004 5.529−19.833 R FCi(VR) = 130.83Y3 − 165.36Y2 − 63.877Y + 102.51 0.9862 0.4213 − Soil GS_N FCi(VN) = −0.8414Y3 + 32.934Y2 − 126.17Y + 103.08 0.9840 13.0473 0.042−0.084 GS_P FCi(VP) = −72.966Y3 + 183.23Y2 − 211.59Y + 116.63 0.9716 0.8371 0.043−0.204 IFS_K FCi(VK) = 56.913Y3 − 89.616Y2 − 60.861Y + 94.554 0.9860 0.5249 0.093−0.681 VS_Ca FCi(VCa) = −128.32Y3 + 242.71Y2 − 204.96Y + 100.36 0.9757 0.6305 2.303−6.535 MS_Mg FCi(VMg) = −82.797Y3 + 147.21Y2 − 164.05Y + 111.59 0.9800 0.5927 0.272−0.680 R FCi(VR) = −7.0219Y3 + 62.55Y2 − 158.89Y + 114.17 0.9685 2.9693 − Table 3.
Estimation of standardized TSS based on the cumulative variance of log ratio of nutrients from 48 vineyards.
Figures
(1)
Tables
(2)