


-
The cultivated area of fruit trees is about 1.26 × 10⁷ hm2, and the total yield of fruit reached 2.87 × 10⁸ t in China[1]. High fruit yield and quality are very important for growers to guarantee their return on investment. For the production of fruit trees, fertilization is considered one of the most effective ways to increase fruit yield and improve its quality[2]. The nutrients of fertilizer taken up by fruit trees are to meet their nutritional requirements and to provide the necessary nutrients for growth and development. Fertilizer inputs and utilization directly affect the fruit tree yields, producer income, and environmental quality[3]. Establishing theoretical approaches and further improvements are necessary to address the issue of explaining the relationships among soil nutrients, plant nutrients, fertilization and fruit quality in China's agricultural sustainability strategy. In terms of extensive management of the fruit trees in China, the guidance on agricultural production is limited due to the lack of advanced precision fertilization techniques. Low fertilization may reduce fruit production due to insufficient nutrients, and soil replenishment of nutrients in this condition is necessary for sustainable agricultural development. However, excessive fertilization raises production costs, and leads to soil degradation and salt accumulation that hampers the expansion of agriculture[4].
The yield and quality of fruit trees are influenced by various factors, including cultivars, environmental conditions and management practices such as soil fertility and fertilization, irrigation, pruning, and plant protection[5]. As the key macronutrients required for plant growth and development, nitrogen (N)[6, 7], phosphate (P)[8], potassium (K)[9, 10], calcium (Ca)[11] and magnesium (Mg)[12] have been extensively studied and added to soil as synthetic fertilizers. The main approach to increase production is to compare nutritional inputs of N, P, K, Ca and Mg with nutrient removal from the field by fruit trees based on the nutrient content present in the soil. The relationships among soil mineral content, plant tissue mineral content, fertilization and fruit quality are very complex. Effective utilization of existing nutrient content in soil to achieve optimal fruit yield and quality has become an essential direction in fruit tree cultivation, which is strongly nonlinear and a black-box in character and difficult to quantify using conventional analytic methods[13]. Various emerging theories and algorithms have been applied to study the relationship between soil nutrients, plant nutrients, fertilization and fruit yield, among which the '3414' design scheme[14] for N, P, and K has been considered as the best fertilizer effect test scheme in China, after nationwide promotion and demonstration trials of the project. However, the fertilization patterns for multi-nutrients (N, P, K, Ca and Mg) and nutritional diagnostic criteria of plant and soil, and fruit quality need to be investigated comprehensively. It is obvious that the '3414' design scheme cannot meet the needs of practical application.
In this paper, we propose a method for precision fertilization of fruit trees based on fruit quality analysis, with the existing '5416' experimental data of 'Cabernet sauvignon' wine grape used as a typical example for preliminary modeling. Based on the fertilization patterns in fruit trees, '5416' precision fertilization technology aims to obtain high-quality fruit under the targeted yield. Field fertilizer efficiency experiments consist of five fertilization factors (N, P, K, Ca and Mg), four fertilization levels (1, 2, 3, and 4), and 16 treatments. In the national soil testing and fertilizer application work, the advantages of '5416' precise fertilization technology are to optimize experimental design with fewer steps, more fertilizer factors to achieve high efficiency. It has important guiding significance in high fruit quality, high production efficiency, and better environmental protection.
-
Twenty one fruit trees were selected and numbered prior to destructive harvest, of which three were selected for dissection at each stage of germination stage (GS), initial flowering stage (IFS), end bloom stage (EBS), seed development stage (SDS), veraison stage (VS), maturation stage (MS) and deciduous stage (DS). The plant was divided into root, trunk, main stem, shoot, leaf, petiole, inflorescence/fruit, and the N, P, K, Ca and Mg contents of each tissue were analyzed. The demand and ratio for N, P, K, Ca and Mg were calculated in IFS-GS, EBS-IFS, SDS-EBS, VS-SDS, MS-VS, DS-MS, respectively, according to the following formula (1) − (4).
(1) Amount of mineral element in the whole plant, g (AWP) = ∑(Concentration of mineral element in each tissue × Dry mass of the corresponding tissue)
(2) The demand of mineral element between any two growth stages, g (DTS) = AWPlater stage − AWPprevious stage
(3) The ratio of mineral element between any two growth stages, % (RTS) = DTS/ DTSGS-DS
(4) The demand of mineral element to produce 100 kg fruit, g (DPF100 kg) = (DTSDS-GS/Yield) × 100
Annual nutrient supplements of orchard soil
-
Firstly, six fruit trees with the same growth stage in the non-fertilized region were selected and numbered before GS, of which three were dissected at GS to calculate the AWPGS. Secondly, the nutrient content of fruit produced by the other three fruit trees was determined at MS to calculate AWPMS_F. Finally, all the fallen leaves were collected during DS, and the nutrient content of each tissue was measured by dissecting to calculate AWPDS. The annual nutrient supplement of orchard soil was calculated according to the following formula (5).
(5) ANS, Annual nutrient supply of orchard soil, g·ha−1 (ANS) = (AWPDS + AWPMS_F − AWPGS) × cultivation density (number of plants·ha−1)
Nutrient content and utilization of fertilizer
-
The nutrient content of chemical fertilizer and commercial organic fertilizer (NCF, mg/kg) was determined according to the instructions on the factory package. The nutrient content of manure was determined based on the analyzed values. The nutrient utilization rate of fertilizer was calculated using the following formula (6) through field fertilization experiment.
(6) Nutrient utilization rate of fertilizer, % (NUR) = ((DTSGS-DP in fertilized region − DTSGS-DP in non-fertilized region)/Total amount of nutrient in fertilizer applied to the fruit trees) × 100
Fertilization treatment
-
In a '5416' design scheme, it is assumed that there are ten factors that influence fruit quality: soil N, P, K, Ca and Mg fertilizer input and N, P, K, Ca and Mg concentrations. In the '5416' experiment, 5, 4, 16 respectively denote the five nutrients (N, P, K, Ca and Mg), the four fertilization rate levels, and 16 treatments. In the four fertilization rate levels, level 1 refers to no fertilizer input, level 2 = level 3 × 0.5, level 3 is the approximation value of the local optimum fertilization rate, and level 4 = level 3 × 1.5 (this level refers to excessive fertilizer input). The '5416' experimental scheme is shown in Table 1.
Table 1 shows the total amount of N, P, K, Ca and Mg fertilizer applied in the whole year, where level 3 was calculated according to the following formula (7). During the experiment, the application amount of N, P, K, Ca and Mg at different growth stages were calculated according to the following formula (8).
(7) Total amount of fertilizer applied by level 3 in the whole year, g·ha−1 (TFY3) = ( (Yield/100) × DPF100 kg − ANS)/(NCF × NUR)
(8) Total amount of fertilizer applied in each stage, g·ha−1 (TFS) = TFY3 × RTS
Optimum amount and influence order of mineral element
-
Based on analysis of fruit quality at MS, the optimum amount and influence order of N, P, K, Ca and Mg fertilizer applied for the whole year were obtained using SAS. Correlation analysis was performed by SPSS software 26.0.
Plant and soil nutrition diagnosis standards
-
Firstly, the tissue samples (Inflorescence or fruits/F, Leaves/L, and Petioles/Pe) from three different development stages (Full-bloom stage/FBS, VS and MS) and the soil samples (0−20 cm and 20−40 cm) from five different development stages (GS, IFS, EBS, VS and MS), respectively, were collected under '5416' fertilization treatments. Secondly, the Pearson correlation was performed to study correlations between plant and soil nutrients and fruit quality. The significant correlation was taken as the criterion to determine the diagnostic factors of plant and soil nutrients. Finally, the nutritional diagnostic criteria of plant and soil were developed by compositional nutrient diagnosis (CND)[15] method. Optimal fertilizer amount was calculated based on nutritional diagnostic criteria to achieve high quality of fruits based on targeted yield.
Application of '5416' experiment to grape
-
The data used in the modeling of this paper originates from 16 wine grape field experiments in Junding Winery Co., Ltd. of Penglai city in China, which is a typical zone of Cabernet sauvignon wine grape, and a '5416' experiment was conducted on the same field from 2019 to 2021. All treatments had consistent conditions such as soil type, crop variety, and climate. The average concentration of alkali-hydrolyzed N, available P, available K, exchangeable Ca, exchangeable Mg in each experimental filed were 69.0, 288.1, 104.2, 2.7, and 329.6 mg·kg−1, respectively. The fertilizer application amount and ratios of each treatment at different stages are shown in Supplemental Table S1. In this experiment, the typical fertilizer is calculated based on the yield target of 7,500 kg fruit per hectare, optimal application amounts of N, P2O5, K2O, CaO, and MgO were assumed as 124.5, 46.5, 112.5, 112.5, and 46.5 kg/hm2, respectively, at a ratio of 2.7:1:2.4:2.4:1. A fertilizer ditch with a depth of 15−20 cm at a distance of 30 cm from grape roots was opened. The fertilizer was fully dissolved in water and poured evenly into the ditch, and then the ditch was covered with the soil and filled with water. At MS, 30 ears of fruit were randomly selected from each treatment, and 720 fruit grains were randomly collected from the upper, middle and lower parts of fruit. The total soluble solid (TSS) content of the fruit was determined by hand-held glucose meter. All treatments were arranged in a randomized complete block design with three replications.
-
The effects of '5416' fertilization on TSS content for three consecutive growing seasons are shown in Table 2, which clarified that TSS in fruit was significantly affected by the studied fertilization treatments. In 2019, except for treatment T1, T12, and T14, the high contents of TSS were found in the other treatments, which were 5.1%−11.5% higher than T1. In 2020, the TSS content in T2 was significantly different from all other treatments that were statistically identical. In 2021, the TSS content in T5 was the highest, which recorded non-significant value higher than all the treatments except for T6, T9, T12, T13 and T14. Overall, the TSS content decreased significantly from 2019 to 2021, which may be caused by meteorological factors such as temperature and rainfall.
Table 2. Effects of fertilization treatments on fruit TSS in 2019−2021.
Treatment Year 2019-TSS % 2020-TSS % 2021-TSS % T1 23.7 ± 0.8d 22.6 ± 0.8bc 19.3 ± 0.9abc T2 26.5 ± 0.5a 24.3 ± 1.2a 19.4 ± 0.6ab T3 25.8 ± 1.1abc 22.4 ± 0.8bc 19.2 ± 0.1abcd T4 25.5 ± 0.0abc 21.9 ± 0.7bc 19.3 ± 0.2abc T5 25.8 ± 0.0abc 21.6 ± 1.0c 19.7 ± 0.4a T6 25.2 ± 1.0bc 21.8 ± 0.7bc 18.4 ± 0.1cde T7 26.4 ± 0.9a 22.7 ± 0.1bc 19.1 ± 0.9abcd T8 26.4 ± 0.4ab 22.6 ± 0.6bc 18.9 ± 0.3abcd T9 26.4 ± 0.8ab 22.4 ± 0.1bc 18.7 ± 0.6bcd T10 25.2 ± 0.0bc 23.1 ± 0.7b 18.8 ± 0.1abcd T11 25.5 ± 0.2abc 22.3 ± 0.2bc 19.0 ± 0.4abcd T12 23.8 ± 0.4d 21.8 ± 0.7bc 17.6 ± 0.4e T13 24.9 ± 0.9c 21.9 ± 0.4bc 18.3 ± 0.6de T14 22.6 ± 0.6e 22.0 ± 0.7bc 18.3 ± 0.5de T15 25.1 ± 0.5c 22.5 ± 1.1bc 19.0 ± 0.4abcd T16 25.2 ± 0.7bc 22.2 ± 0.3bc 18.9 ± 0.6abcd Different lowercase letters in the same column of data indicate the significant difference between different treatments at the P < 0.05 level. The optimum amount and influence order of mineral elements
-
To eliminate the influence of inter-annual differences on nutritional diagnosis, the TSS here was in three consecutive growing seasons normalized by Min-Max Normalization[16] (Supplemental Table S2). For TSS, the influence order of each element was Mg > N > Ca > P > K, the optimal fertilization ratio of each element was N1P3K2Ca2Mg2. Thus, the optimal fertilizer amount for high TSS was 0 kg·ha−1 N, 46.5 kg·ha−1 P2O5, 56.3 kg·ha−1 K2O, 56.3 kg·ha−1 CaO, 23.3 kg·ha−1 MgO.
Nutritional diagnostic factors for plants and soil
-
We used correlation analyses to evaluate relationships between standardized TSS and mineral element concentrations in plant tissues and soils of various fruit developmental stages (Supplemental Table S3). The strength of these associations was estimated using Pearson's r correlation coefficient, where the correlation between the two factors is much stronger, which allowed us to effectively separate FBS_L_N, MS_L_P, FBS_L_K, MS_F_Ca, and FBS_P_Mg in plant, and GS_N, GS_P, IFS_K, VS_Ca and MS_Mg in soil to be as nutritional diagnostic factors (Table 3).
Table 3. Estimation of standardized TSS based on the cumulative variance of log ratio of nutrients from 48 vineyards.
Type Factors FCi(Vx) = AY3 + BY2 + CY + D R2 Determined cutoff Optimum range mg/g Plant FBS_L_N FCi(VN) = −31.736Y3 + 84.935Y2 − 145.17Y + 97.153 0.9809 0.8921 22.728−42.140 MS_L_P FCi(VP) = −70.578Y3 + 203.17Y2 − 244.62Y + 118.04 0.9738 0.9596 0.273−8.227 FBS_L_K FCi(VK) = −53.314Y3 + 25.432Y2 − 58.365Y + 99.83 0.9788 0.1590 7.850−25.124 MS_F_Ca FCi(VCa) = 14.076Y3 + 7.8741Y2 − 118.67Y + 105.49 0.9836 −0.1865 3.192−39.975 FBS_P_Mg FCi(VMg) = −69.267Y3 + 124.76Y2 − 150.6Y + 107.08 0.9825 0.6004 5.529−19.833 R FCi(VR) = 130.83Y3 − 165.36Y2 − 63.877Y + 102.51 0.9862 0.4213 − Soil GS_N FCi(VN) = −0.8414Y3 + 32.934Y2 − 126.17Y + 103.08 0.9840 13.0473 0.042−0.084 GS_P FCi(VP) = −72.966Y3 + 183.23Y2 − 211.59Y + 116.63 0.9716 0.8371 0.043−0.204 IFS_K FCi(VK) = 56.913Y3 − 89.616Y2 − 60.861Y + 94.554 0.9860 0.5249 0.093−0.681 VS_Ca FCi(VCa) = −128.32Y3 + 242.71Y2 − 204.96Y + 100.36 0.9757 0.6305 2.303−6.535 MS_Mg FCi(VMg) = −82.797Y3 + 147.21Y2 − 164.05Y + 111.59 0.9800 0.5927 0.272−0.680 R FCi(VR) = −7.0219Y3 + 62.55Y2 − 158.89Y + 114.17 0.9685 2.9693 − Nutritional diagnostic criteria of plants and soil
-
To determine the optimal range of mineral elements for high TSS, we built an independent model between the cumulative variance function of each element and standardized TSS (Table 3 and Fig. 1). The cutoff values determined for plant and soil nutrient diagnosis for vineyard with high TSS were 0.8921 and 0.8371, respectively. Six and eight vineyards with high TSS were selected, based on the determined cutoff values of plant and soil, respectively, and the optimum ranges for each element were displayed in Table 3. To further determine the nutritional diagnostic criteria, the vineyards (treated by 2019-T2, 2020-T2, 2021-T5, 2019-T7, 2019-T9, and 2019-T8) diagnosed according to plant nutrition were identified as criteria, and the diagnostic conditions of soil nutrition were calculated as follows: GS_N 0.042−0.084 mg/g, GS_P 0.043−0.171 mg/g, IFS_K 0.118−0.681 mg/g, VS_Ca 2.303−6.535 mg/g, and MS_Mg 0.272−0.680 mg/g.
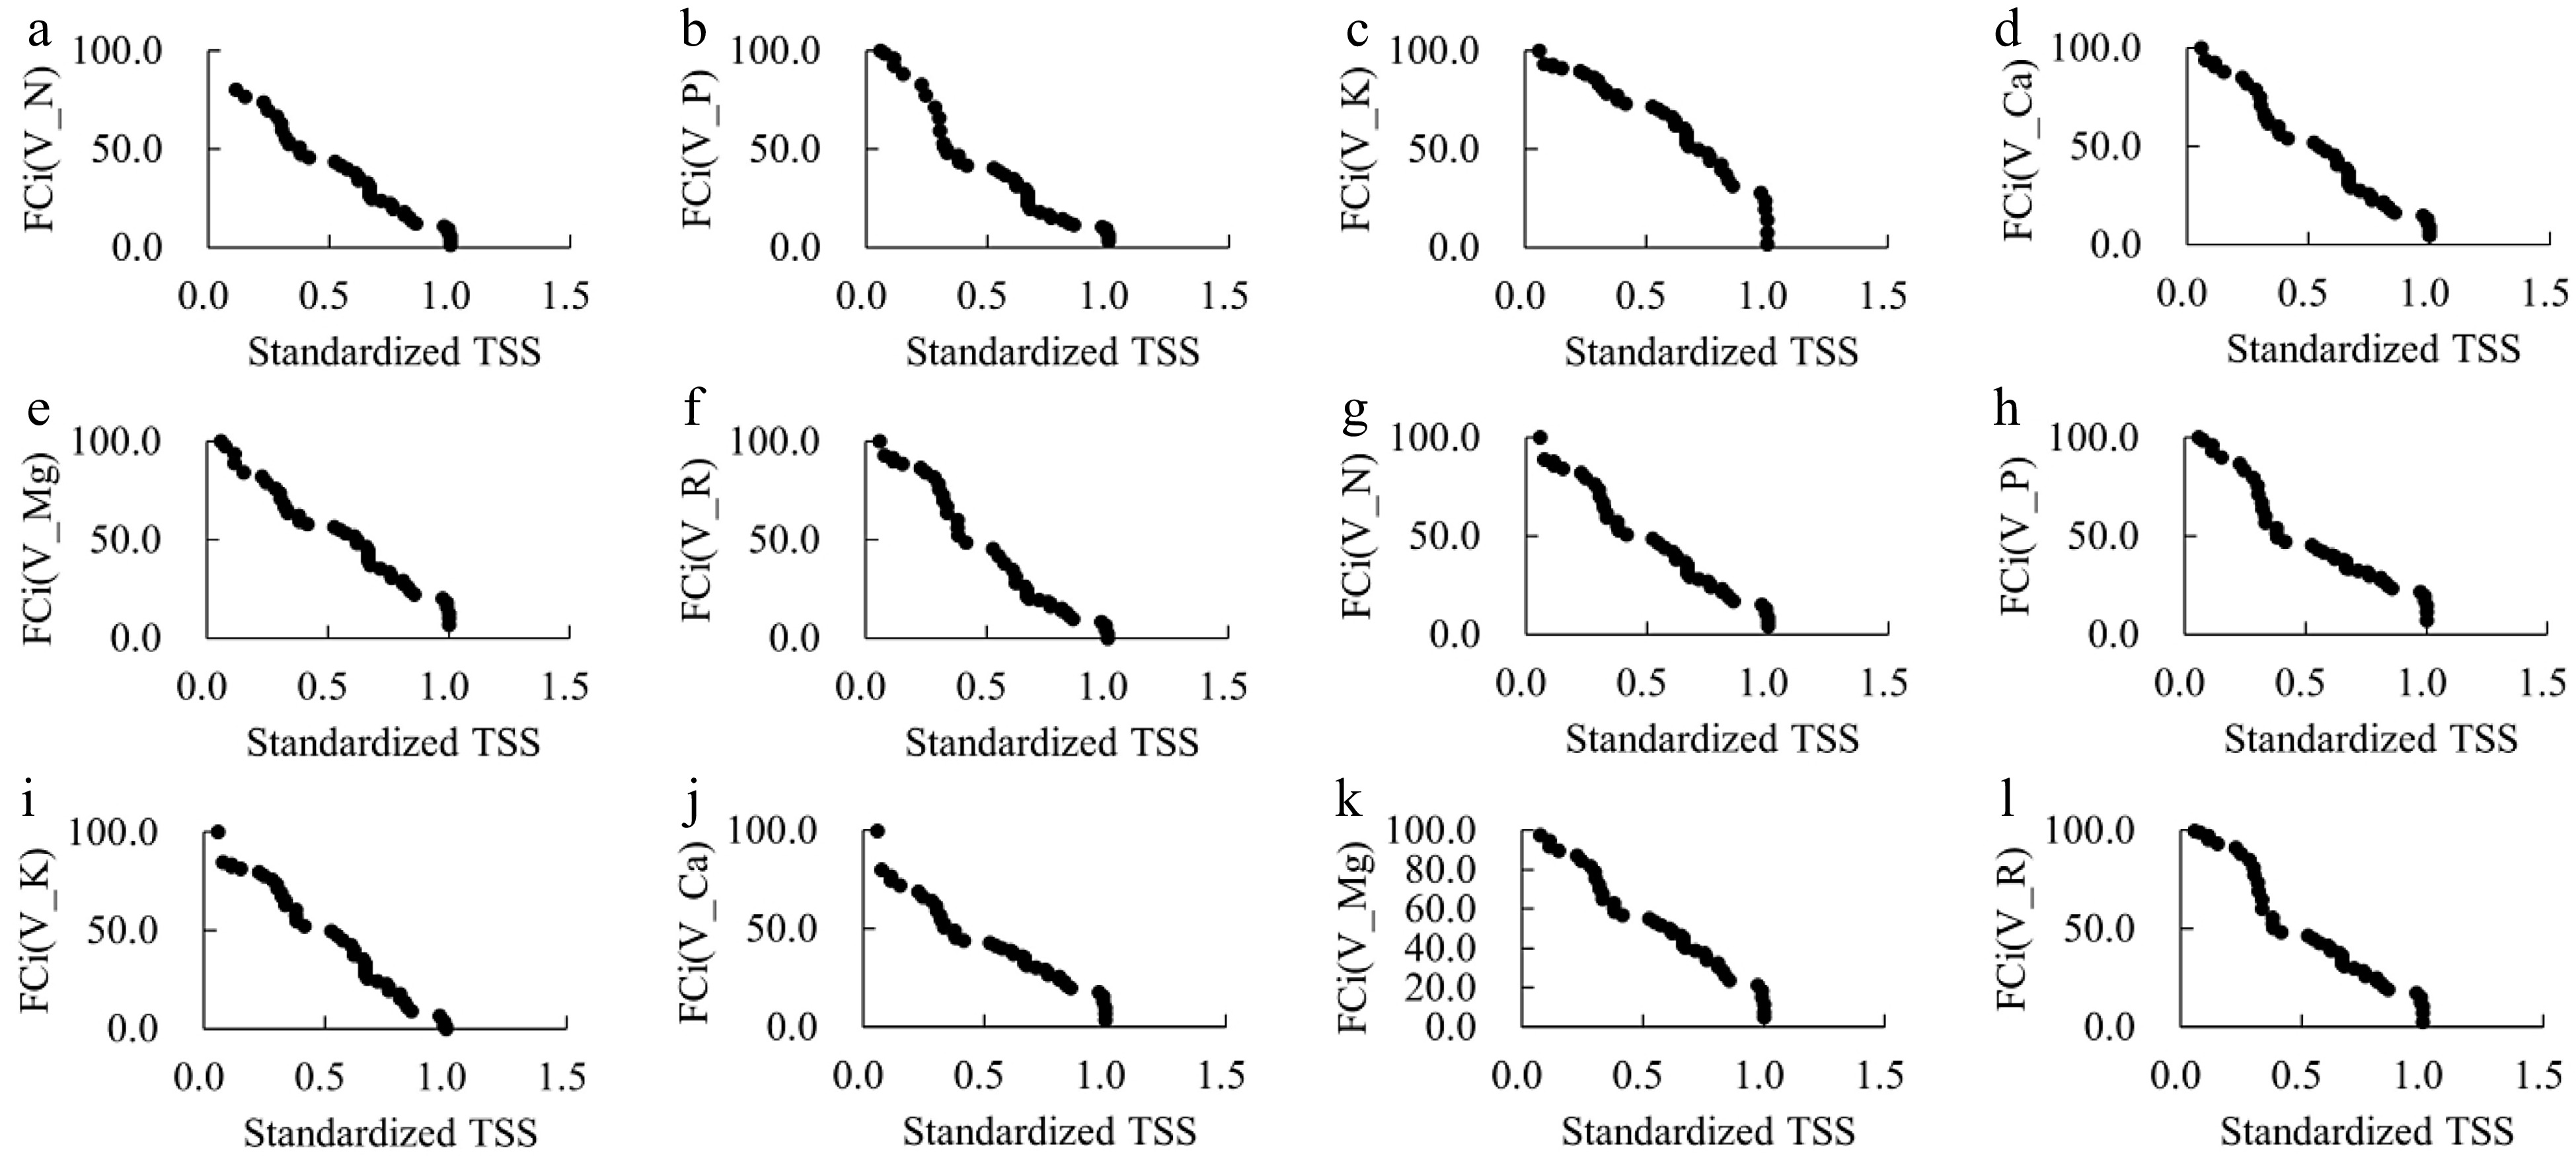
Figure 1.
The relationship between the cumulative variance function of each element and standardized TSS. (a)−(f) represent cumulative variance function of FBS_L_N, MS_L_P, FBS_L_K, MS_F_Ca, FBS_P_Mg and R of plants, respectively. (g)−(l) represent GS_N, GS_P, IFS_K, VS_Ca, MS_Mg and R of soil, respectively.
-
In an attempt to improve accuracy by integrating the algorithms of precise fertilization[17−21], many researchers have classified them according to their evolutionary basis, design routines and number of objectives[22−26]. The recent efficient variants of swarm intelligence optimization algorithms are simulated annealing algorithm[27], gravitational search algorithm[28], fruit fly optimization algorithm[29], moth-flame optimization[30], sine cosine algorithm[31, 32], grasshopper optimization algorithm[33], salp swarm algorithm[34], etc. Meanwhile, there are many corresponding improvement algorithms[35, 36], such as enhanced comprehensive learning particle swarm optimization[37], chaotic moth-flame optimization[38], double adaptive random spare reinforced whale optimization algorithm[39], hybridizing grey wolf optimization[40], balanced whale optimization algorithm[41], chaotic mutative moth-flame-inspired optimizer[42], etc. However, these methods require considerable computational effort due to computationally complex mathematical operations.
According to the complicated relationship between soil nutrients, plant nutrients, fertilization and fruit quality, an optimization method based on fruit quality analysis is proposed and applied to the practical problem of precision fertilization in wine grape. It is short and easy to complete, and therefore suitable for use in studies of other fruit crops.
Develop fertilizer recommendations based on plant nutrient diagnosis
-
If the content of a nutrient in a plant is lower than the nutritional diagnostic criteria NDC, it indicates that the nutrient is deficient, and fertilizer containing the nutrient at different stage should be applied according to formula (9) .
(9) Recommended amount of fertilizer at different stage, g·ha−1 (RAF) = RTS × (TFY3 + (((P1−P2) × P3 × P4)/(NCF × NUR)), P1 represents the minimum of NDC, P2 represents the content of a nutrient in tissue referenced by nutritional diagnostic factors, P3 represents the dry weight of tissue referenced by nutritional diagnostic factors, P4 represents the nutrient content ratio of whole plant to the tissue of nutritional diagnostic factors.
If the content of a nutrient in a plant is within the range of NDC, it means that the nutrient is normal, and the fertilizer should be applied according to formula (10).
(10) RAF = RTS × TFY3 × (((P5 − P2)/(P5 − P1))/(NCF × NUR)), P5 represents the maximum of NDC.
If the content of a nutrient in a plant and soil are higher than respective NDC, it indicates that the fertilizer containing the nutrient should not be applied.
If the content of a nutrient in a plant is higher than NDC, and that in the soil is within the range of NDC, indicating that the application of fertilizer containing the nutrient should be reduced and fertilizer containing the nutrient at different stage should be applied according to formula (11).
(11) RAF = RTS × (TFY3 − (((P2 − P5) × P3 × P4)/(NCF × NUR))).
Develop fertilizer recommendations based on nutrient diagnosis of soil
-
If the content of a nutrient in soil is lower than NDC, it indicates that the nutrient is deficient, and fertilizer containing the nutrient at different stage should be applied according to formula (12).
(12) RAF = RTS × (TFY3 + (((S1 − S2) × S3 × S4 × S5)/(NCF × NUR))), S1 represents the minimum of NDC in soil, S2 represents the content of a nutrient in soil referenced by nutritional diagnostic factors, S3 represents the bulk density of soil, S4 represents the distribution area of root, S5 represents the depth of root distribution.
If the content of a nutrient in soil is within the range of NDC, it means that the nutrient is normal, and the fertilizer at different stage should be applied according to formula (13).
(13) RAF = RTS × ((TFY3 × (S6 − S2)/(S6 − S1))/(NCF × NUR)), S6 represents the maximum of NDC in soil.
If the content of a nutrient in a plant and the soil are higher than respective NDC, it indicates that the fertilizer containing the nutrient should not be applied.
If the content of a nutrient in soil is higher than NDC, and that in a plant is within the range of NDC, indicating that the application of fertilizer containing the nutrient should be reduced and fertilizer containing the nutrient at different stage should be applied according to formula (14).
(14) RAF = RTS × (TFY3 − (((S2 − S6) × S3 × S4 × S5)/(NCF × NUR))).
-
In summary, it has been shown that the '5416' precise fertilization technology developed in this study achieves both specificity and timeliness, which combines multi-nutrient diagnosis with fruit quality analysis. The '5416' precise fertilization technology has multiple specificity and achieves high predictive accuracy, which can effectively predict the amount and ratio of a multi-nutrient fertilizer at different stages. This is suitable for fruit tree fertilization forecasting, which provides information for fertilization decision making and practice. The proposed method of the '5416' precise fertilization technology provides a new insight into fertilizer application research and complements the existing fertilization system.
This research was funded by the National Key R&D Program (2018YFD1000200) and The Agricultural Science and Technology Innovation Program of the Chinese Academy of Agricultural Sciences (CAAS-ASTIP-2015-RIP-04).
-
The authors declare that they have no conflict of interest.
- Supplemental Table S1 The proportion of fertilizer applied for each stage (%).
- Supplemental Table S2 standardized TSS treated by Min-Max Normalization.
- Supplemental Table S3 The mineral element content of plant samples in different tissues of fruit developmental stages.
- Copyright: © 2023 by the author(s). Published by Maximum Academic Press, Fayetteville, GA. This article is an open access article distributed under Creative Commons Attribution License (CC BY 4.0), visit https://creativecommons.org/licenses/by/4.0/.
-
About this article
Cite this article
Wang X, Zhang Z, Zhong X, Ji X, Shi X, et al. 2023. Precise fertilization technology of fruit trees based on quality analysis in China. Technology in Horticulture 3:5 doi: 10.48130/TIH-2023-0005 

Precise fertilization technology of fruit trees based on quality analysis in China
- Received: 15 December 2022
- Accepted: 03 April 2023
- Published online: 24 April 2023
Abstract: Precision fertilization is an important cultural practice to balance between plant nutritional needs and environmental sustainability. More importantly, it contributes to maintain sustainability that achieves more and consumes less. Nitrogen, phosphorus, potassium, calcium and magnesium are essential elements for orchard productivity. Conventional fertilization is not able to meet the needs of simultaneous application of various amounts and ratios of each nutrient element at different growth stages, and therefore a simple and accurate precision fertilization technology is needed. In this study, in order to obtain scientifically accurate amounts and ratios of different nutrient elements, a precise fertilization technology, the '5416' experimental field design scheme, has been proposed. The '5416' design scheme was tested based on fruit quality analysis, of the fruit trees in 'Cabernet sauvignon' grape field in Penglai County, Shandong Province (China) using the cumulative variance of nitrogen, phosphorus, potassium, calcium and magnesium as the target function. The experimental results indicated that the '5416' precision fertilization technology could reasonably predict the accurate fertilizer application amounts and ratios in each growth period to produce better quality fruit based on fixed yield. It is a more accurate precision fertilization modeling approach and provides a modern tool for solving interactive effects among soil nutrients, plant nutrients, fertilization and fruit quality.