-
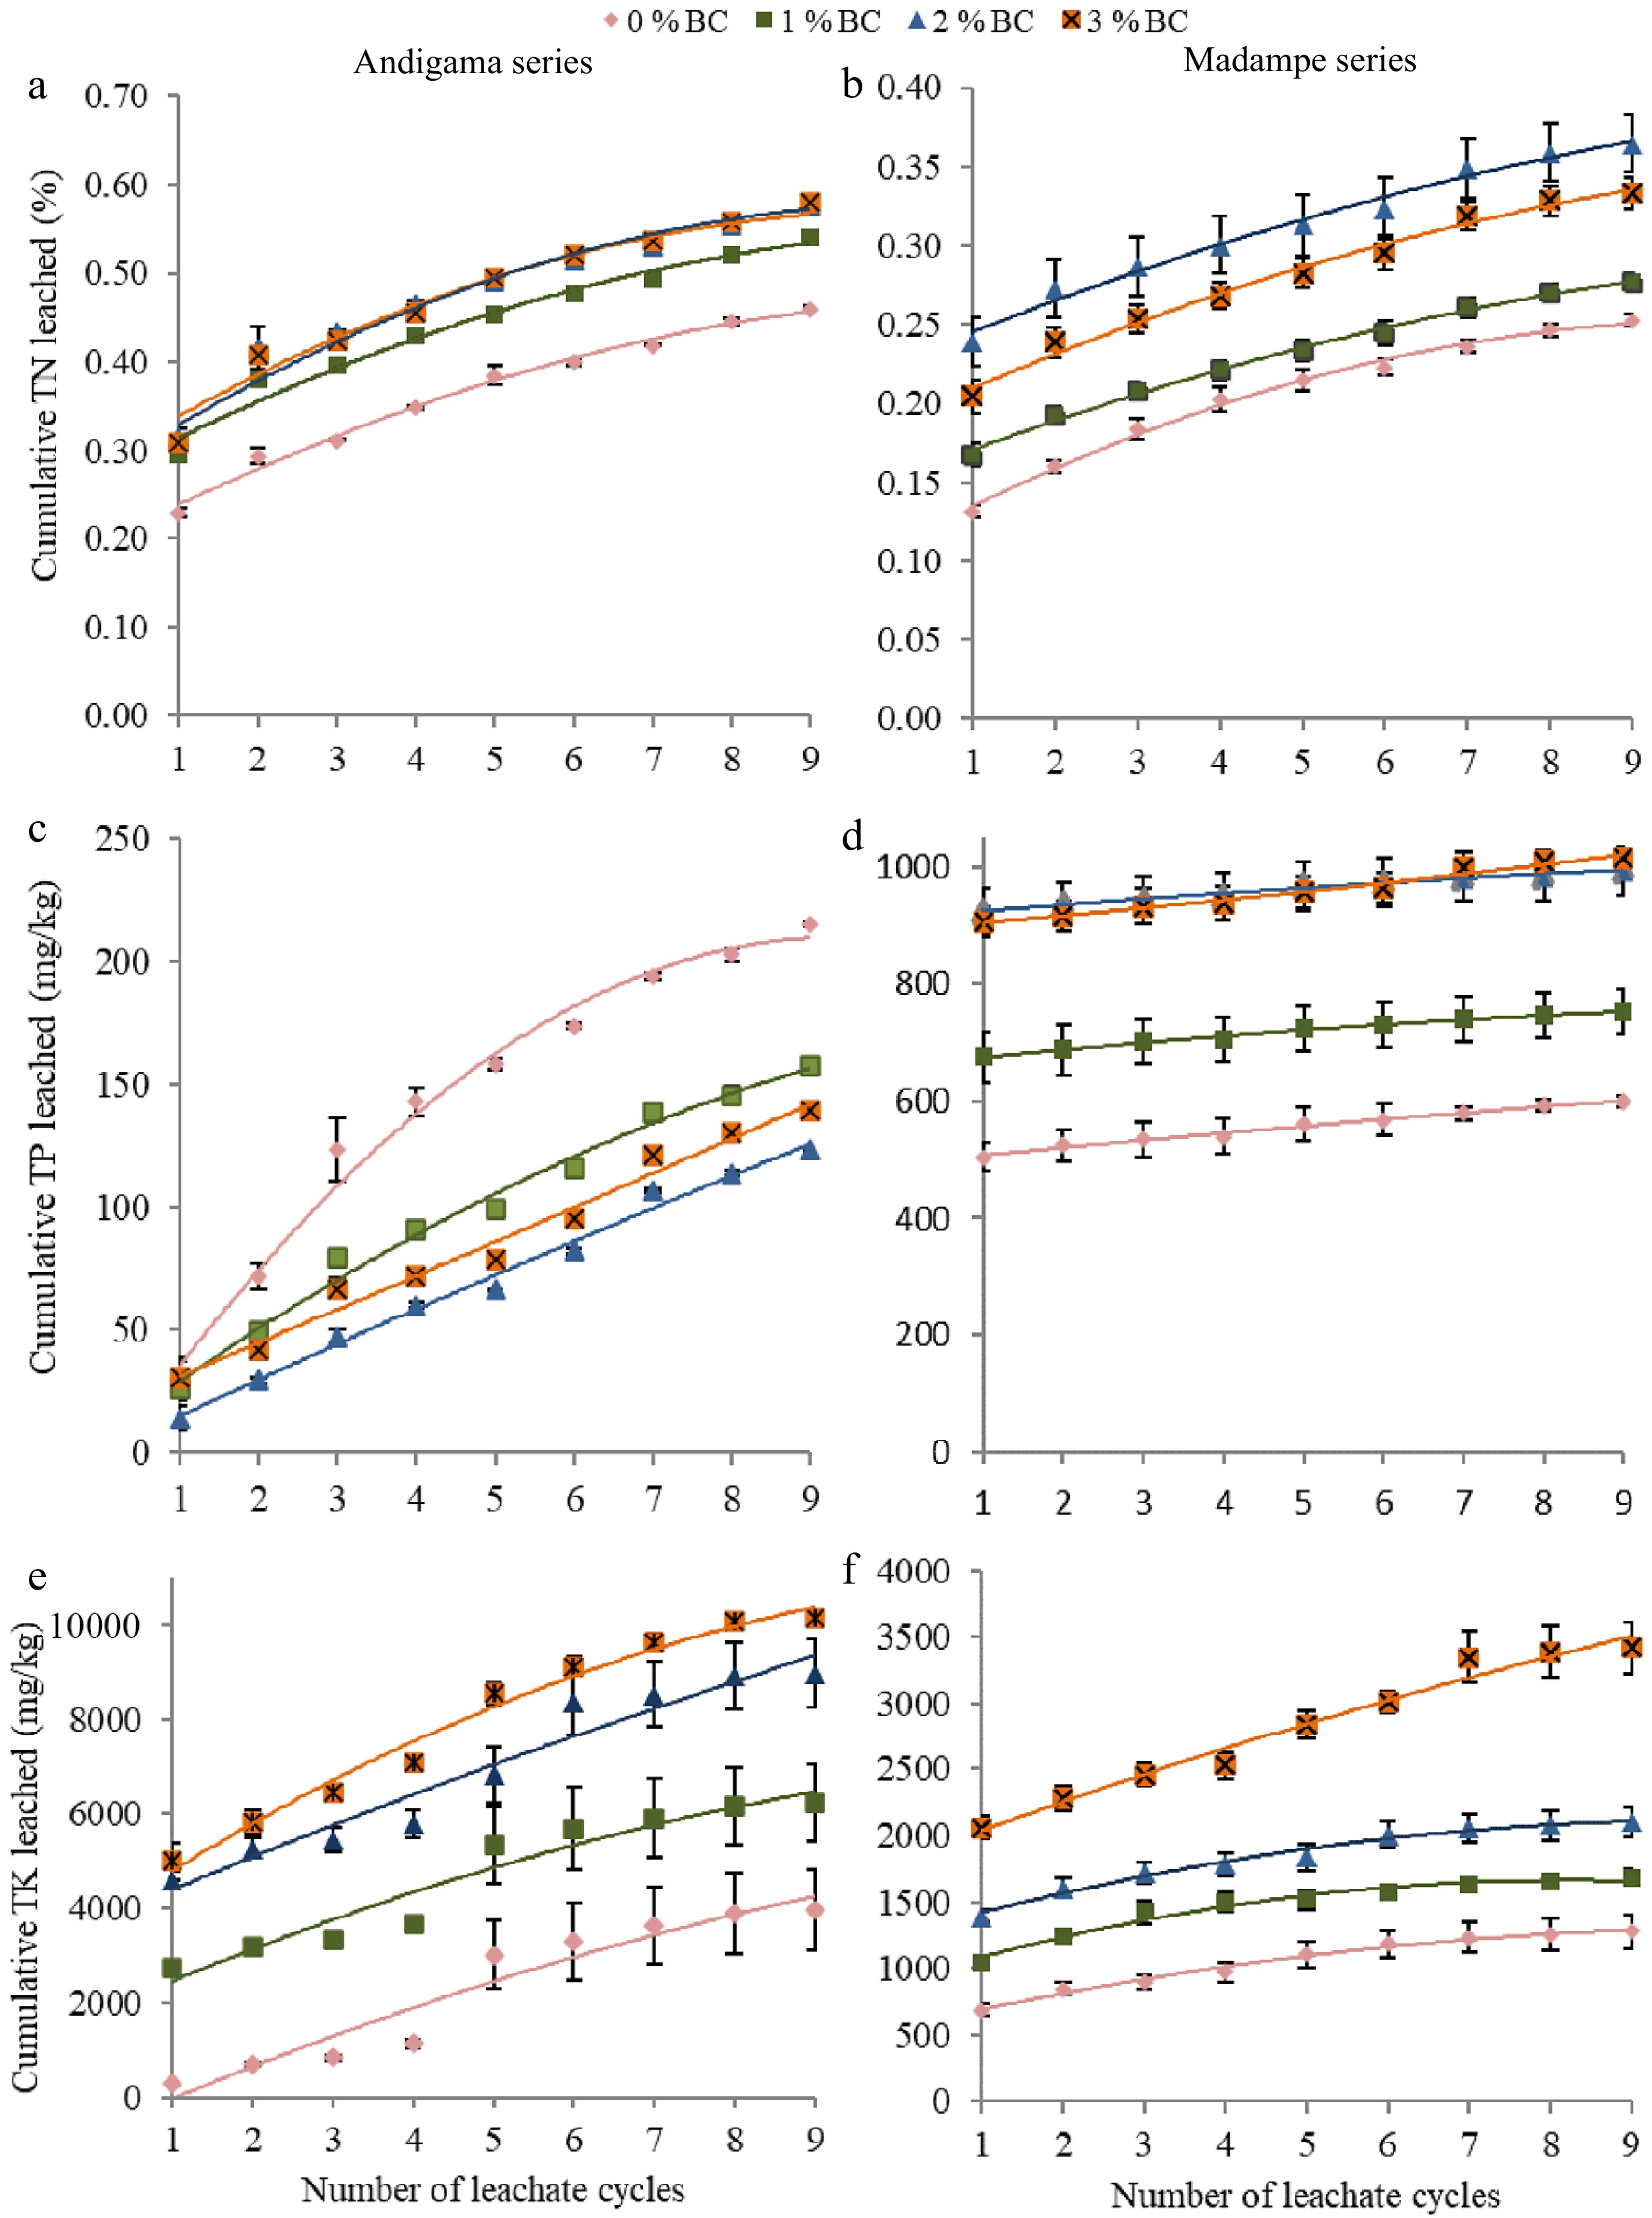
Figure 1.
Mean cumulative nutrient concentrations (N, P, K) leached from the leaching columns in Sandy loam (Andigama series) and Sandy (Madampe series) soils, within two weeks intervals over a five-month period. In the sandy loam soil, (a) cumulative total N leached (%), (c) cumulative total P leached (mg/kg), and (e) cumulative total K leached (mg/kg). In sandy soil, (b) cumulative total N leached (%), (d) cumulative total P leached (mg/kg), and (f) cumulative total K leached (mg/kg). The standard error of samples (n = 3) is indicated by the error bars in the graphs.
-
Soil group Soil weight in
dry basis (g)Type of fertilizer Urea
(g)TSP
(g)MOP
(g)Dolomite
(g)Madampe series 1300 2.39 3.3 2.39 9.55 Andigama series 1600 2.45 3.40 2.45 9.80 * The bulk density of Madampe series soil was 1.53 and 1.75 g/cm in Andigama series soil. Table 1.
Soil and the quantity of inorganic fertilizer applied per leaching column. Soil was filled based on their natural bulk density*.
-
Parameter Unit Gliricidia
biocharAndigama
series soilMadampe
series soilpH 10.4 ± 0.01 6.32 ± 0.10 6.39 ± 0.02 EC dS/m 1.195 ± 0.014 0.027 ± 0.001 0.015 ± 0.001 Total N % 0.78 ± 0.03 0.05 ± 0.002 0.02 ± 0.002 Total P mg/kg 5517 ± 315 6.5 ± 0.4 2.4 ± 0.6 Total K % 5.0 ± 0.3 0.02 ± 0.00 0.0002 ± 0.0000 Total Mg mg/kg 3279 ± 294 200 ± 2 45.6 ± 5.7 Total Ca % 1.15 ± 0.09 0.068 ± 0.00 0.025 ± 0.00 Volatile matter % 8.85 ± 0.3 − − Fixed carbon % 72.9 ± 0.5 − − Ash content % 11.5 ± 0.2 − − Sand % − 72 ± 0.1 92 ± 1.7 Silt % − 8.1 ± 1.2 2.2 ± 0.4 Clay % − 20 ± 1.5 5.8 ± 2.6 Table 2.
Chemical and physical properties of Gliricidia wood biochar, Andigama and Madampe series soils.
-
Treatment pH EC (dS/m) TN (%) TP (mg/kg) TK (mg/kg) TCa (mg/kg) TMg (mg/kg) 0% BC (Control) 6.26b* 39 0.195 1126b 165c 4979 b 2067b 1% BC 6.54b 40 0.193 1027b 222b 4823b 1591b 2% BC 6.99a 49 0.236 2786a 338a 7384a 3557a 3% BC 7.01a 49 0.226 3016a 367a 7008a 3350a P value 0.006 0.542 0.433 0.003 0.000 0.005 0.007 CV 0.05 0.23 0.15 0.49 0.31 0.21 0.35 * Means denoted by the same letter are not significantly different at P < 0.05. EC = Electrical conductivity, TN = Total Nitrogen, TP = Total Phosphorous, TK = Total Potassium, TCa = Total Calcium, TMg = Total Magnesium. Table 3.
Chemical properties of fertilized Andigama series soil after amending with 0%, 1%, 2% and 3% biochar and leached over a five-month period.
-
Treatment pH EC (dS/m) TN (%) TP (mg/kg) TK (mg/kg) Ca (mg/kg) Mg (mg/kg) 0% BC (control) 6.79 24 0.172ab 70b 80 2608ab 1391b 1% BC 6.77 29 0.146b 67b 91 2914a 1783b 2% BC 6.65 14 0.142b 82b 68 1969 b 1937a 3% BC 6.74 20 0.188a 129a 80 2843a 2127a P value 0.09 0.06 0.04 0.00 0.30 0.06 0.03 CV 0.01 0.30 0.04 0.00 0.30 0.00 0.19 * Means denoted by the same letter are not significantly different at P < 0.05. EC = Electrical conductivity, TN = Total Nitrogen, TP = Total Phosphorous, TK = Total Potassium, TCa = Total Calcium, TMg = Total Magnesium. Table 4.
Chemical properties of fertilized Madampe series soils after amending 0%, 1%, 2% and 3% biochar and leached over a five-month period.
Figures
(1)
Tables
(4)