


-
Coconut is a major plantation crop in Sri Lanka, with a land area of 503,000 hectares (ha), accounting for 37% of total arable land[1]. The major coconut-growing great soil groups in Sri Lanka are Sandy Regasols, Red Yellow Latasols, Red Yellow Podzolic, and Alluvial soils. Generally, loamy soils are more fertile than sandy soils, but this is dependent on the nutrient retention capacity attributed to clay mineralogy, the parent material, and the degree of weathering[2]. On the other hand, coconut extracts more nutrients from a limited soil volume because it is a perennial crop with an average 60-year life expectancy, an adventitious root system, and year-round vegetative and reproductive growth. Previous literature suggests that low productivity in coconut lands is mainly due to poor soil fertility and management in coconut growing soils, in addition to environmental variables such as lack of rainfall and heat stress[3]. With an ever-growing number of people to feed and dwindling arable land due to fragmentation for industrial and residential uses, enhancing productivity with existing resources is a timely requirement. Under poor nutrient management, soils with naturally low nutrient stocks lose their productive potential quickly, resulting in a drop in plantation productivity over time[4]. Though growers are encouraged to use organic manure such as compost, cattle manure, and poultry manure, these alone will not provide sufficient levels of potassium (K), magnesium (Mg), and phosphorous (P) requirements of the palm. Even in manured plantations, imbalanced application of nutrients results in nutrient deficiency/toxicity in fertile and infertile soils[5]. Therefore, increasing the inorganic fertilizer dose is not the solution to improve productivity in coconut-growing soils[2].
The majority of coconut-growing soils are sandy soils with high infiltration capacity, decomposition, and leaching[2]. Being a tropical country, Sri Lanka experiences a relatively consistent temperature throughout the year and thereby resulting in soil carbon depletion and low retention of water and nutrients due to rapid decomposition. Long-term conventional agricultural practices that use a considerable amount of inorganic fertilizer have been shown to deplete soil fertility[6]. Several environmentally friendly practices are used in coconut cultivation to improve long-term soil fertility. These include the application of organic manure such as compost, vermicompost, leafy manures such as Gliricidia and Tithonia, and the cultivation of short-term cover crops[7,8]. The Coconut-Gliricidia cropping system is more popular among coconut growers due to its benefits in providing soil nutrients through the capture of atmospheric nitrogen and as a source of fuel for power generation[9].
Gliricidia sepium is a well-known multipurpose tree grown in coconut-based agroforestry systems. A well-grown Gliricidia plant as an intercrop might produce 8−10 t/ha of fresh lopping with three prunings per year. Furthermore, incorporating 30 kg of lopping into the manure circle of a mature coconut palm provides the total nitrogen requirement, and 20% of phosphorus and potassium requirements of the palm[10,11]. Well established Gliricidia–coconut intercropping system gives 9−10 kg/plant/year of wood biomass yield in 6-month lopping intervals whereas 7−8 kg/plant/year for 9-month lopping intervals at 20% moisture content[12]. Because of its high nutrient concentration, the leaf is used as green manure for coconut[13]. However, Gliricidia wood is not considered a soil supplement unless it is used as fuelwood[14]. Therefore, converting this hardwood into a soil amendment such as biochar would be beneficial.
The application of biochar has become a novel trend in agriculture in the recent past[15,16]. The incorporation of biochar has proven to enhance the productivity of degraded lands[17−19]. Biochar is a high-carbon substance produced by slow pyrolysis where heating is generated under low or no oxygen conditions and syngas can be yielded as a by-product during the process[18,19]. Biochar provides additional benefits in the soil because of its intrinsic high surface area to volume ratio, retaining more nutrients and moisture and promoting soil aggregation[20,21]. Continuous application of a large quantity of biochar is needed to fulfill the nutrients and moisture requirement of an adult coconut palm.
According to Somasiri et al.[2], coconut-growing soils can be classified into several suitability classes based on their production potential, agro-ecological region, and inherent soil properties such as texture, depth, and drainage conditions. The soil series used in the current study are Madampe and Andigama and these two-soil series come under S1 and S4 land suitability classes respectively. Suitability class S1 refers to highly suitable soils for coconut cultivation, while S4 refers to moderately suitable soils. The use of different rates of biochar in conjunction with inorganic fertilizer effects on increasing the availability and retention of soil macronutrients. As a result, this study examined the effects of different Gliricidia-based biochar application rates on nutrient availability and soil nutrient retention in two contrasting coconut-growing soils. Additionally, the findings of this study will establish the most effective rate of biochar application on both types of coconut growing soils to boost their fertility status and cut off the additional fertilizer cost.
-
Biochar for the leaching column study was prepared in a limited oxygen environment inside the muffle furnace at 700 °C for about 1.5 h of reaction time until the wood gas flow stopped through the exhaust pipe. Gliricidia stems were cut into pieces, dried, and stored tightly in a metal container with a lid to facilitate the limited oxygen supply. A few holes were made in the top and the bottom of the metal container to release the wood gas generated inside the container. Biochar particles were crushed into small pieces and biochar particles with < 4 mm size were mixed with 0−15 cm topsoil.
Leaching column experiment
-
This experiment was conducted at the Agronomy Division of the Coconut Research Institute of Sri Lanka (CRISL) situated in the Low Country-Intermediate Zone of the country. The leaching study used two major coconut-growing soils to determine the effect of different rates of biochar incorporation. Andigama series soil (Red Yellow Podzolic) and Madampe series soil (Sandy Regasol) were selected as experimental soil groups. Madampe series soils are typically less fertile due to the low Cation Exchange Capacity (CEC) (4.0 cmolc kg−1 soil) caused by the soil's inherent sandy nature (92 %), whereas Andigama series soils contain more nutrients due to the high CEC (7.4 cmolc kg−1 soil) compared to the sandy soil caused by the presence of more clay (20%). For more than 50 years, coconut palms have been growing in both soils.
Leaching columns were made of PVC tubes with 6.3 cm diameter and 35 cm height and the bottom of the tube was closed with a stainless-steel wire mesh and a cotton thread on top to prevent the removal of soil particles through the mesh. Up to 1 cm from the bottom of the column was filled with 50 g of acid-washed sand, and the rest of the soil column was filled with topsoil (0−15 cm) and subsoil (15−30 cm) samples collected separately from the mentioned two soil series. Andigama series soil, considered a Typic Troporthents according to the USDA taxonomy, is a sandy loam soil classified as Red Yellow Podzolic soil with soft and hard laterites[22], was collected from Rathmalagara Research Station, Madampe (7°32'47.11'' N, 79°53'18.64'' E). Madampe series soil considered an Aquic Quartzipsamments according to USDA taxonomy, is a sandy soil classified under Sandy Regosol[22], was collected from Bandirippuwa Research Station, Lunuwila (7°20'7.65" N, 79°52'54.87" E). Two soils were packed according to the soil bulk densities, whereas the bulk density of sandy soil was 1.53 g/cm and the bulk density of clay soil was 1.75 g/cm. According to the treatments assigned, the top 0−15 cm of the column was mixed with inorganic fertilizer (Urea, Triple super phosphate (TSP), Muriate of Potash (MOP), and Dolomite) and biochar and as the control, only inorganic fertilizer was mixed with the soil of 0−15 cm layer without incorporating biochar (Table 1). Different biochar rates; 0% biochar (0% BC), 1% biochar (1% BC), 2% biochar (2% BC), and 3% biochar (3% BC) were mixed with straight fertilizer as per the recommendation of CRISL for basal application. Based on the treatment plan, there were four treatments for each soil type. At two soil depths (0−15 cm and 15−30 cm), both soils were packed into the columns to the bulk density. The top of the column was filled with an extra 50 g of acid-washed sand to reduce soil disturbance during the leaching of the columns.
Table 1. Soil and the quantity of inorganic fertilizer applied per leaching column. Soil was filled based on their natural bulk density*.
Soil group Soil weight in
dry basis (g)Type of fertilizer Urea
(g)TSP
(g)MOP
(g)Dolomite
(g)Madampe series 1300 2.39 3.3 2.39 9.55 Andigama series 1600 2.45 3.40 2.45 9.80 * The bulk density of Madampe series soil was 1.53 and 1.75 g/cm in Andigama series soil. The columns were mounted on a steel rack according to Completely Random Design (CRD) with three replicates and moistened with distilled water until reaching the field capacity. The first leachate was collected two weeks after moistening the columns, followed by every two weeks leaching with 200 ml and total N, P, and K concentrations of the leachate was measured over five months. The topsoil was carefully separated and analyzed for pH, Electrical Conductivity (EC), total N, P, K, Ca, and Mg after the soil had been leached nine times.
Characterization of biochar, soil, and sample analysis
-
The physical and chemical properties of the two soil types and Gliricidia wood biochar used in the study were analyzed following standard analysis protocols. To measure the pH and EC of the samples, a prepared 1:5 solution at 25 °C was shaken for 1 h and kept for equilibration, and analyzed using the pH and EC meters (Edge meter, Hanna, Romania). The total N of all leachates, soil and biochar samples was analyzed using the Kjeldahl method[23]. The modified dry ashing method[24] was used to digest the samples to determine P, K, and Mg concentrations in Gliricidia wood biochar. Extracted solutions were analyzed using the ICP-OES (iCAP PRO, Thermo Scientific, Germany). Soil and the leachate samples were digested using the microwave digestion method[25] (Microwave PRO, Anton Paar, Austria). Extracted solutions were analyzed using the ICP-OES (iCAP PRO, Thermo Scientific, Germany).
All the statistical analysis was carried out using IBM SPSS Statistics 26.0 software. Soil analysis data were evaluated using one-way ANOVA, and the means were separated using Duncan's Multiple Range Test (DMRT). Cumulative nutrient leaching data were analyzed by performing a repeated measure ANOVA test. Time repeated-measures ANOVA was used to determine the significance of leached nutrient concentrations using within-subject as 'weeks', and the fixed effects were the treatments. Mauchly's test of Sphericity was significant (P < 0.05) thus the assumption of Sphericity was not violated and the variances of the differences between the levels of the within-subjects factor were equal.
Availability of data and materials
-
The data and material during the current study are available from the corresponding author upon reasonable request.
-
The chemical and physical properties of Gliricidia wood biochar as well as the properties of two soil types were determined following standard protocols (Table 2). The pH of the Gliricidia wood biochar used to amend the two soils was 10.4, while the pH of the two soil types employed, the Andigama and Madampe series was 6.32 and 6.39, respectively. The pH of biochar has a significant effect on the adsorption or desorption of nutrients and heavy metals in acidic soil. A negatively charged surface is better for binding cations on the surface of biochar with a high pH[26]. The high pH of biochar may be a result of the hydrolysis of carbonates and bicarbonates of base cations such as Ca, Mg, Na, and K present in the source materials[27] and the increased separation of basic cations and organic anions from organic materials was observed as the pyrolysis temperature increases[28].
Table 2. Chemical and physical properties of Gliricidia wood biochar, Andigama and Madampe series soils.
Parameter Unit Gliricidia
biocharAndigama
series soilMadampe
series soilpH 10.4 ± 0.01 6.32 ± 0.10 6.39 ± 0.02 EC dS/m 1.195 ± 0.014 0.027 ± 0.001 0.015 ± 0.001 Total N % 0.78 ± 0.03 0.05 ± 0.002 0.02 ± 0.002 Total P mg/kg 5517 ± 315 6.5 ± 0.4 2.4 ± 0.6 Total K % 5.0 ± 0.3 0.02 ± 0.00 0.0002 ± 0.0000 Total Mg mg/kg 3279 ± 294 200 ± 2 45.6 ± 5.7 Total Ca % 1.15 ± 0.09 0.068 ± 0.00 0.025 ± 0.00 Volatile matter % 8.85 ± 0.3 − − Fixed carbon % 72.9 ± 0.5 − − Ash content % 11.5 ± 0.2 − − Sand % − 72 ± 0.1 92 ± 1.7 Silt % − 8.1 ± 1.2 2.2 ± 0.4 Clay % − 20 ± 1.5 5.8 ± 2.6 Gliricidia biochar had high fixed carbon content (73%) and low volatile matter and ash percentage. According to Kumarathilaka & Vithanage, higher fixed carbon content and volatile matter content in Gliricidia biochar are attributed to long-term and short-term soil carbon availability[29]. The ash content in biochar is the combustion residue that contains inorganic minerals. Deenik et al. highlighted that feedstock has a greater impact on the fixed carbon and ash content of biochar[30].
The concentrations of macronutrients (K+, Ca+2, Mg+2, P, and N) vary significantly depending on the chemical composition of the feedstock and the pyrolysis conditions. The pyrolysis temperature is essential in nutritional enrichment in biochar due to the volatilization of nutrients[30]. Pyrolysis at a low temperature (300–400 °C) is preferable for N enrichment, while pyrolysis at a high temperature (700 °C) is preferable for P and K enrichment[31,32]. The produced biochar contained a comparatively higher concentration of K+ (5%), and less N, P, and Mg concentrations at 0.78%, 0.55%, and 0.33%, respectively due to higher pyrolysis temperatures of 700 °C.
The use of biochar changes the pH of the soil in a shorter period. Lehmann et al. explained that the pH results of the soil due to biochar application can be varied from pH below 4 to pH above 12[33]. Generally, biochar with high ash content results in greater pH compared to that with lower ash content. Biochar produced under higher pyrolysis temperatures also has a greater pH value. The pH of applied biochar was 10.4 and application of biochar at 2% and 3% rates have significantly (P < 0.05) increased the soil pH from 6.26 to 7.00 but not at the 1% rate (Table 3). However, total N and the EC have not shown any significant difference (P > 0.05) among the amended soils in the Andigama soil series.
Table 3. Chemical properties of fertilized Andigama series soil after amending with 0%, 1%, 2% and 3% biochar and leached over a five-month period.
Treatment pH EC (dS/m) TN (%) TP (mg/kg) TK (mg/kg) TCa (mg/kg) TMg (mg/kg) 0% BC (Control) 6.26b* 39 0.195 1126b 165c 4979 b 2067b 1% BC 6.54b 40 0.193 1027b 222b 4823b 1591b 2% BC 6.99a 49 0.236 2786a 338a 7384a 3557a 3% BC 7.01a 49 0.226 3016a 367a 7008a 3350a P value 0.006 0.542 0.433 0.003 0.000 0.005 0.007 CV 0.05 0.23 0.15 0.49 0.31 0.21 0.35 * Means denoted by the same letter are not significantly different at P < 0.05. EC = Electrical conductivity, TN = Total Nitrogen, TP = Total Phosphorous, TK = Total Potassium, TCa = Total Calcium, TMg = Total Magnesium. Yao et al. have identified that retention of soil nutrients varies with the biochar type and the ionic form of the nutrient. Increased exchangeable K and other nutrients in amended soil, such as P, Ca, and Mg, also depend on the feedstock material used to produce biochar[34]. However, all the above nutrients have shown a similar trend in terms of retention, as the effect of 2% and 3% biochar rates were not significantly different (P > 0.05), but significantly different (P < 0.05) from 0% and 1% biochar treated soil. The retention capacity of P, K, Ca, and Mg in 2% biochar-applied soil was found to be 147%, 105%, 50%, and 70% greater than the biochar untreated soil, respectively. Similarly, soil amended with 3% of biochar, retained 168%, 122%, 41%, and 62% of P, K, Ca, and Mg, respectively, compared to soil that was not amended with biochar. According to the data, soil amended with 3% biochar retained 21% more P and 17% more K than soil amended with 2% biochar, but 9% and 8% less Ca and Mg, respectively. Additionally, when the retention capacities of each nutrient were examined, the presence of biochar exhibited a distinct preference for binding specific cations and anions in the sandy loam. In both the 2% and 3% biochar treatments, the order of soil nutrient preference was P > K > Mg > Ca.
Biochar, on average, has a greater impact on the exchangeable potassium concentration in the soil. When the soil was amended with biochar, exchangeable potassium was increased significantly in the Andigama series soil. Biochar contains potassium in a readily exchangeable form for plants[35]. It grows proportionately to the application rate of biochar. This increased K+ concentration in soil was facilitated by the presence of high-K materials, most notably due to biochar[32]. The increase in the cations as mentioned above in the soil is directly related to the nutrient content of the biochar feedstock[36].
The behavior of biochar in the sandy soil (Madampe series soil) is different from the sandy loam soil (Andigama series soil), as shown in Table 4. Soil pH and EC have not shown significant differences (P < 0.05) among the treatments. Total N retention was significantly (P < 0.05) higher in 3% biochar application, and it is not significantly different compared to the total N of the control treatment. Lower retention of N in 1% and 2% biochar amended treatment could be due to the acceleration of N mineralization in the soil with the presence of biochar. At higher rates, the retention capacity can be prominent[37]. A similar trend was observed in soil Ca in the presence of biochar, whereas the highest Ca retention capacity was observed in 1% and 3% biochar-applied soils, but they were not significantly different (P < 0.05) from the control treatment.
Table 4. Chemical properties of fertilized Madampe series soils after amending 0%, 1%, 2% and 3% biochar and leached over a five-month period.
Treatment pH EC (dS/m) TN (%) TP (mg/kg) TK (mg/kg) Ca (mg/kg) Mg (mg/kg) 0% BC (control) 6.79 24 0.172ab 70b 80 2608ab 1391b 1% BC 6.77 29 0.146b 67b 91 2914a 1783b 2% BC 6.65 14 0.142b 82b 68 1969 b 1937a 3% BC 6.74 20 0.188a 129a 80 2843a 2127a P value 0.09 0.06 0.04 0.00 0.30 0.06 0.03 CV 0.01 0.30 0.04 0.00 0.30 0.00 0.19 * Means denoted by the same letter are not significantly different at P < 0.05. EC = Electrical conductivity, TN = Total Nitrogen, TP = Total Phosphorous, TK = Total Potassium, TCa = Total Calcium, TMg = Total Magnesium. According to Nguyen et al., sandy soils have a higher increase in K+ when amended with biochar compared to other soil types[38]. However, this increase was not detected in the soil after leaching nine times over five months. Total magnesium retention increased by 40% and 53% when biochar was applied at 2% and 3% rates, respectively, compared to the control (0% biochar) treatment. The significant increase (P < 0.05) in total N, P, Ca, and Mg concentrations in 3% biochar application along with inorganic fertilizer (Urea, TSP, MOP, and Dolomite) can be attributed to biochar retention capacity and the additional supply of nutrients provided by biochar. The retention capacities of total N, P, Ca, and Mg in biochar-applied treatments are 9.3%, 84%, 9.0%, and 53% higher, respectively compared to the control treatment. Therefore, the order of retaining nutrients in the sandy soil can be stated as P > Mg > N = Ca.
Biochar has significantly reduced Mg leaching from both sandy and sandy loam soils (P < 0.05), indicating that Mg ions were more likely to bind to exchange sites of biochar than Ca ions. Nitrogen recovery has not been significantly affected in sandy loam soil, but it was significant (P < 0.05) in sandy soil treated with 3% BC. Nitrogen retention occurs due to the presence of charged exchange sites and increased water holding capacity, limiting N leaching from soil[39].
The leachate analysis data for both the Madampe and Andigama series soils illustrated in Fig. 1 exemplify the behavior of biochar with these two soil types. In the presence of inorganic fertilizer, total nitrogen in the leachates of biochar-amended soils from the Andigama and Madampe series has not exhibited any N retention quality in biochar. However, when biochar was added, total nitrogen availability has been increased significantly (P < 0.05) in both soil types compared to the control treatment. This may be due to increased soil N mineralization and additional N supply via Gliricidia biochar. Figure 1b shows the trend toward N retention in Madampe series soil at the 3% biochar rate compared to the 2% biochar rate. But in the Andigama series soil, the effect of 2% and 3% biochar treatments has not shown any significant difference (P < 0.05) in leached N concentration.
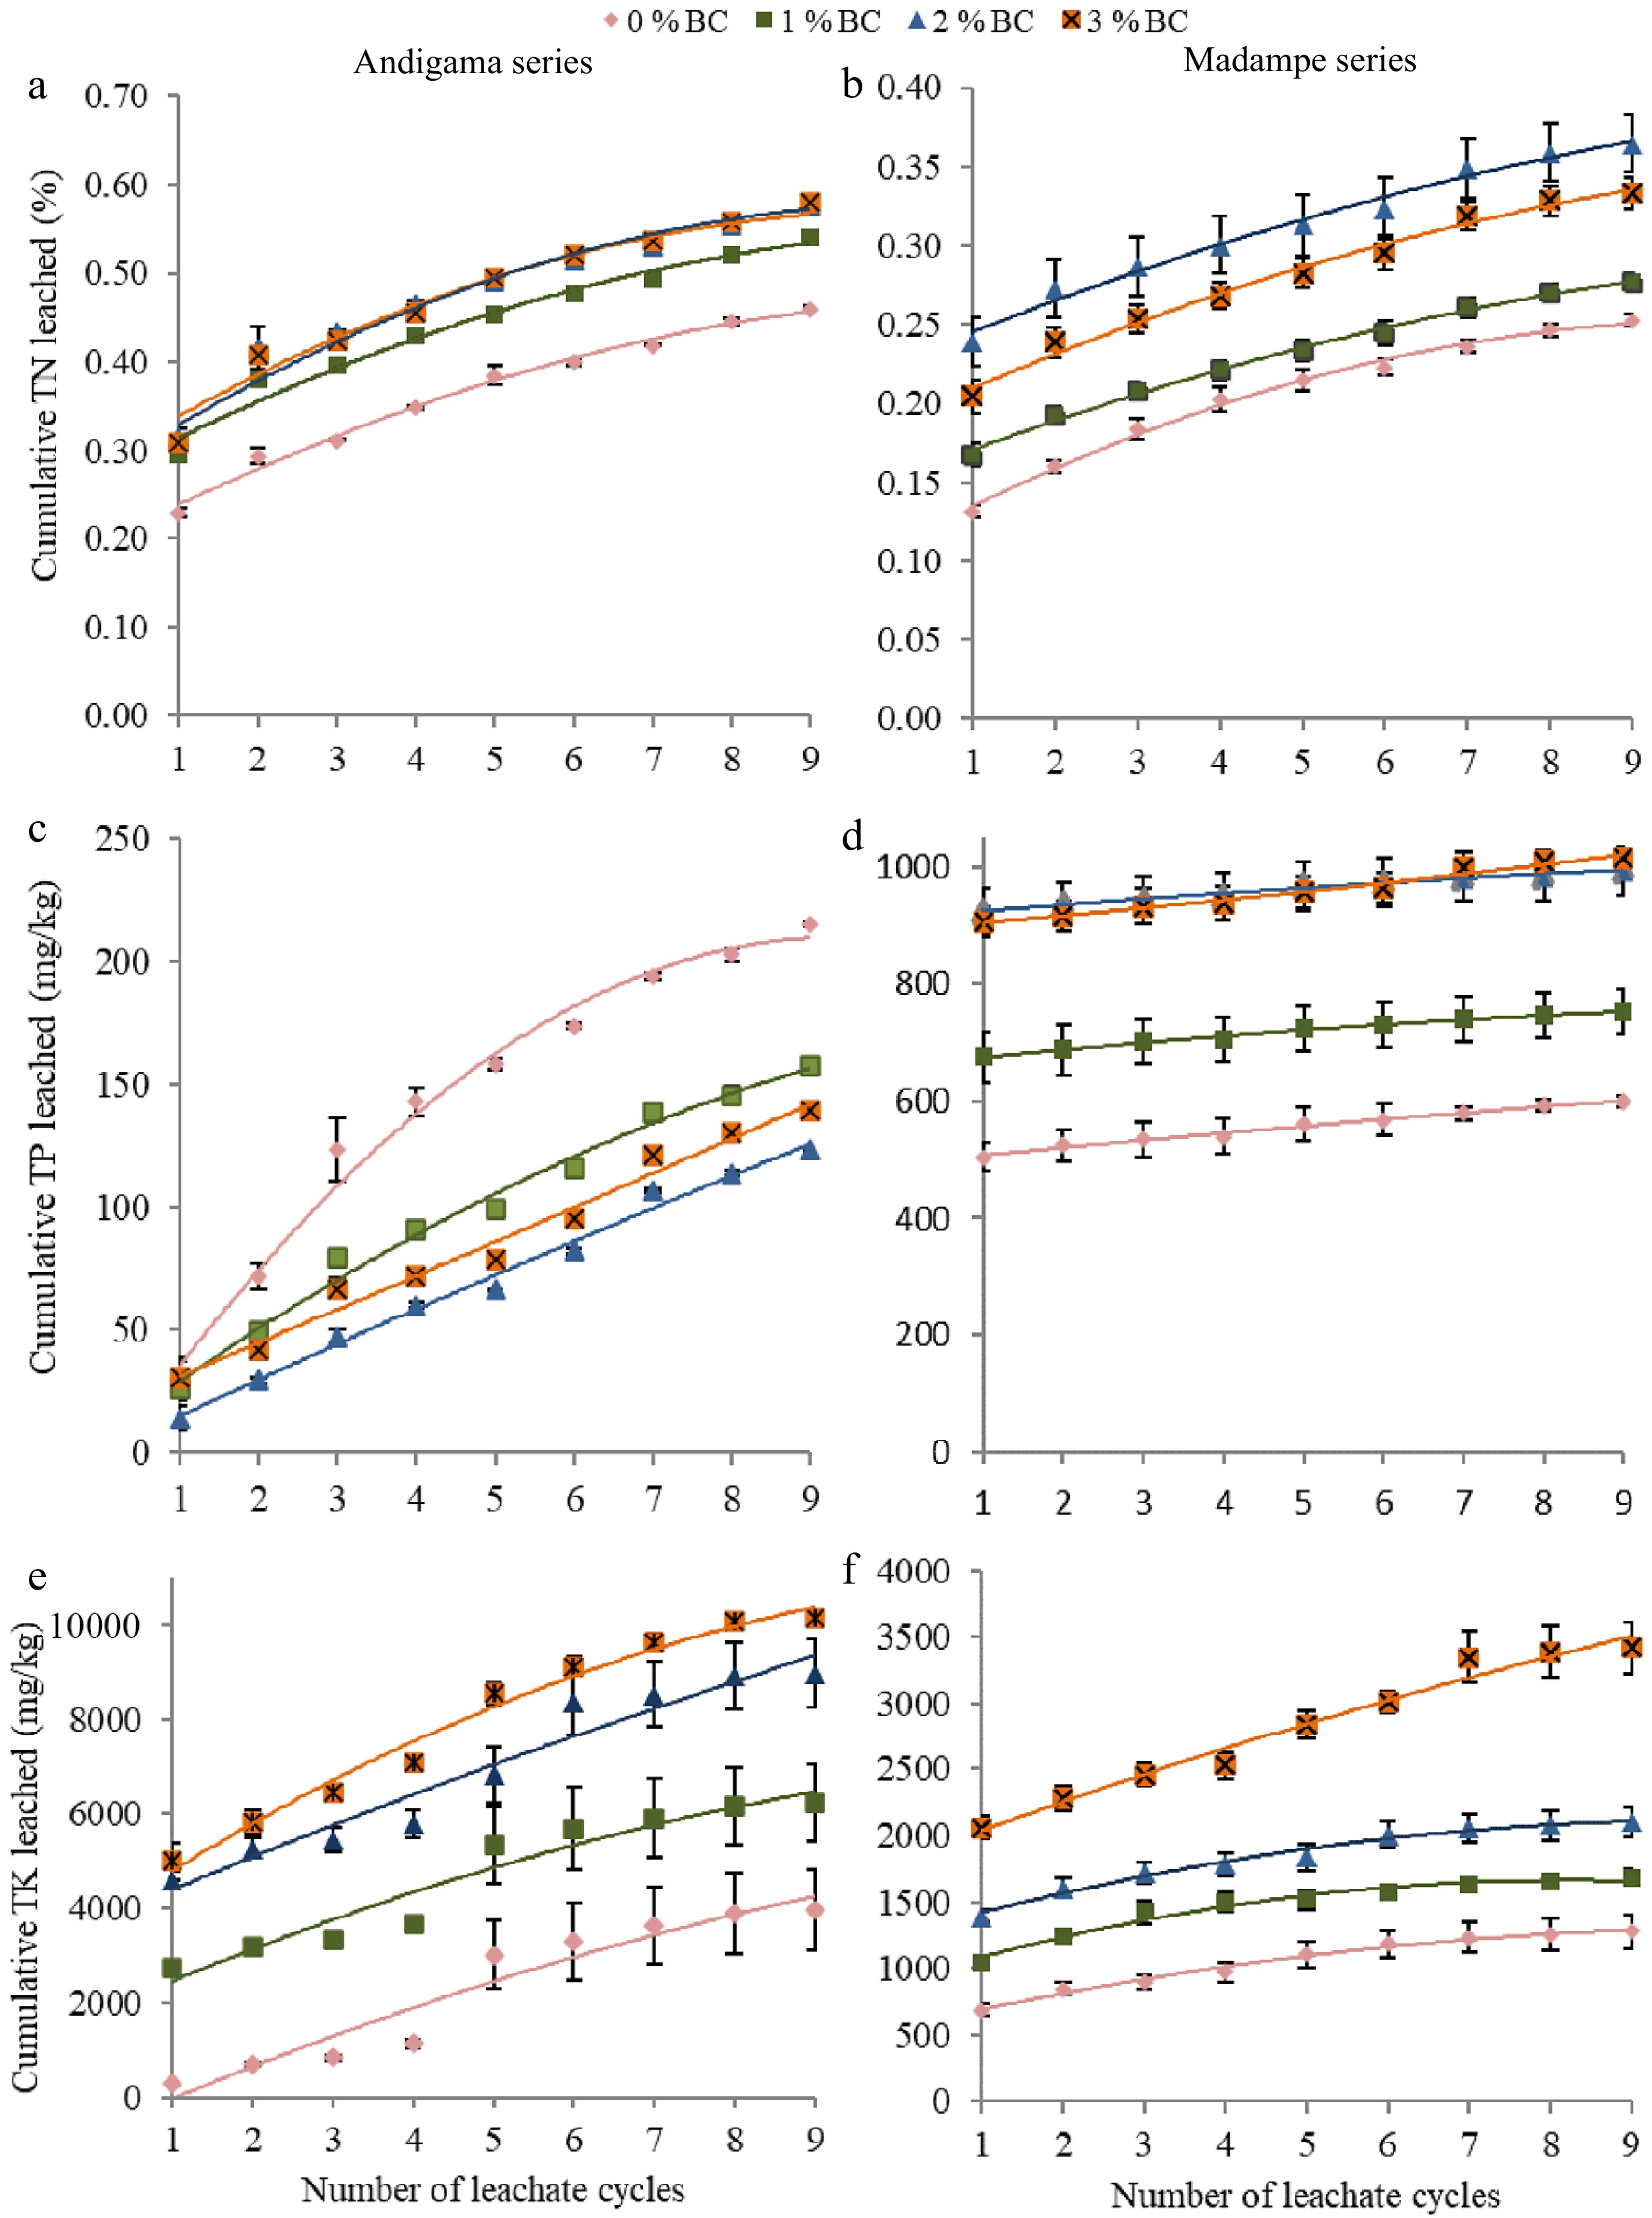
Figure 1.
Mean cumulative nutrient concentrations (N, P, K) leached from the leaching columns in Sandy loam (Andigama series) and Sandy (Madampe series) soils, within two weeks intervals over a five-month period. In the sandy loam soil, (a) cumulative total N leached (%), (c) cumulative total P leached (mg/kg), and (e) cumulative total K leached (mg/kg). In sandy soil, (b) cumulative total N leached (%), (d) cumulative total P leached (mg/kg), and (f) cumulative total K leached (mg/kg). The standard error of samples (n = 3) is indicated by the error bars in the graphs.
Total P leached from two different soil types revealed two separate scenarios that matched with the soil data. In sandy loam soil with the presence of inorganic fertilizer, P was retained, in all three biochar treatments (Fig. 1c & d). However, as the rate of biochar application increases, P availability has increased in sandy soils. The leached P concentration was not significantly different (P < 0.05) in the 2% and 3% biochar treatments. Yao et al. observed that certain biochar types remove phosphates from a solution, and some other biochar types release phosphate into the solution[34]. This indicates that biochar has formed phosphorus complexes with clay or organic matter in sandy loam soil. However, in sandy soil, there is less clay and organic matter to form complexes. According to Nguyen et al., P in biochar, higher soil pH that dissolves insoluble P, and reduced solubility of Al and Fe are some factors for greater P availability in sandy soil[38].
The K release of the two soil types has been increased over the biochar application rate (Fig. 1e & f). All three rates of biochar have shown a significantly greater K+ release than the control treatment, indicating biochar supplies a significant amount of K+ to the soil. Nguyen et al. identified high clay content, organic carbon, and cation exchange capacity restrict the leaching of P, K, Ca, and Mg-like nutrients[38]. This explains the reasons for having more cations and anions bonded in sandy loam soil than in sandy soil in the presence of biochar. Application of biochar may increase the CEC of soil, improve soil physical properties and enhance the activities of soil microbes which affect the binding of anions and cations in the soil[34,38].
In sandy loam soil, retention of macronutrients (P, K, Ca, and Mg) and soil pH were not significantly different at P < 0.05 between treatments containing 2% and 3% biochar, and the retention of macronutrients (P, K, Ca, and Mg) and soil pH was not significantly different (P < 0.05) between treatments containing 1% and 0% biochar. As a result, in terms of nutrient retention, the application of 2% of biochar in sandy loam soil can be recommended. The application of 1% biochar to sandy loam soil will not be sufficient to improve soil fertility.
When comparing the retention of total N, P, and Ca concentrations in sandy soil, treatment amended with 3% biochar showed significantly higher (P < 0.05) retention compared to 1% and 2% biochar treatments, respectively. In contrast, there was no statistically significant difference (P < 0.05) between the 2% and 3% biochar treatments in soil pH, EC, total K, and Mg concentrations. Therefore, a once-in-a-lifetime application of 3% of biochar for coconut-growing sandy soils can be recommended. The downside of this application rate is that it would be unprofitable. Hence, the once-in-a-lifetime application of 2% biochar would be more appropriate for the sandy loam (Andigama series) and sandy (Madmape Series) soils depending on the soil texture.
-
When different macronutrients were supplied with inorganic fertilizer, the retention capacities of the nutrients varied in two different soil types: sandy and sandy loam. In the sandy loam soil, the order of the retention capacity of macronutrients is P > K > Mg > Ca. Biochar application at 2% and 3% (w/w) rates as a percentage of the soil mass have shown similar nutrient retention trends. The order of nutrient retention in sandy soil was P > Mg > N = Ca. In both soil types, phosphorus retention outperformed all other nutrients. Magnesium ions, in addition, were found to be more likely to bind to exchange sites than Ca ions. Even though 3% biochar application outperformed the other two rates of biochar (1% and 2%) in sandy soil, it would be unprofitable from the perception of the grower. For this reason, once-in-a-lifetime application of 2% biochar on both sandy and sandy loam soils can be recommended in terms of macronutrient retention, regardless of the soil type. Future long-term studies should be focused on evaluating the aforementioned biochar application rates in the coconut fields and under a variety of environmental conditions, including drought.
We would like to express our appreciation to the technical staff of the Agronomy Division of the Coconut Research Institute, for their contribution to collecting and analysing samples. Mrs. Asanki Jayamali deserves special recognition for her careful guidance of the supportive staff as well as her enormous contribution toward the timely collection of samples and analysis. We would like to express our deep gratitude to the editor and two anonymous reviewers for their valuable comments and critical evaluation.
-
The authors declare that they have no conflict of interest.
- Copyright: © 2023 by the author(s). Published by Maximum Academic Press, Fayetteville, GA. This article is an open access article distributed under Creative Commons Attribution License (CC BY 4.0), visit https://creativecommons.org/licenses/by/4.0/.
-
About this article
Cite this article
Dissanayake DKRPL, Udumann SS, Dissanayaka DMNS, Nuwarapaksha TD, Atapattu AJ. 2023. Effect of biochar application rate on macronutrient retention and leaching in two coconut growing soils. Technology in Agronomy 3:5 doi: 10.48130/TIA-2023-0005 

Effect of biochar application rate on macronutrient retention and leaching in two coconut growing soils
- Received: 19 December 2022
- Accepted: 30 March 2023
- Published online: 04 May 2023
Abstract: Low nutrient reserves and poor soil fertility management in coconut cultivation have limited coconut productivity. Biochar is one of the best solutions to improve soil nutrient reserves and fertility over time. This study explored the best rate of biochar application in coconut-growing soils to reduce leaching losses and macronutrient enrichment. Two major coconut-growing soil series; Madampe (Sandy) and Andigama (Sandy loam) were used in the experiment. Gliricidia wood biochar (BC) pyrolyzed at 700 °C was used to amend the 0−15 cm topsoil in PVC columns at the rates of 0% BC, 1% BC, 2% BC and 3% BC (w/w) with recommended doses of inorganic fertilizer. Columns were arranged in Completely Random Design (CRD) with three replicates and leached two weeks intervals over five months. Our findings revealed two distinct scenarios for sandy and sandy loam soils. Considering the retention of macronutrients in sandy loam soil treated with 2% and 3% biochar, the order of retention was P > K > Mg > Ca. However, soil N was not altered substantially (P > 0.05) with the amount of biochar amendment. Similarly, in sandy soil, 3% BC treatment demonstrated the sequence P > Mg > N = Ca, although soil K was not differed significantly (P > 0.05) with biochar amendment rate. Albeit a once-in-a-lifetime application of 3% biochar could be recommended on coconut-growing sandy soils, application of this rate would be unprofitable. Thus, the 2% rate will be more appropriate for both sandy and sandy loam soils. These application rates must be validated through long-term field experiments under major coconut-growing soils.
-
Key words:
- Leaching column /
- Nitrogen /
- Phosphorus /
- Potassium /
- Sandy /
- Sandy loam