-
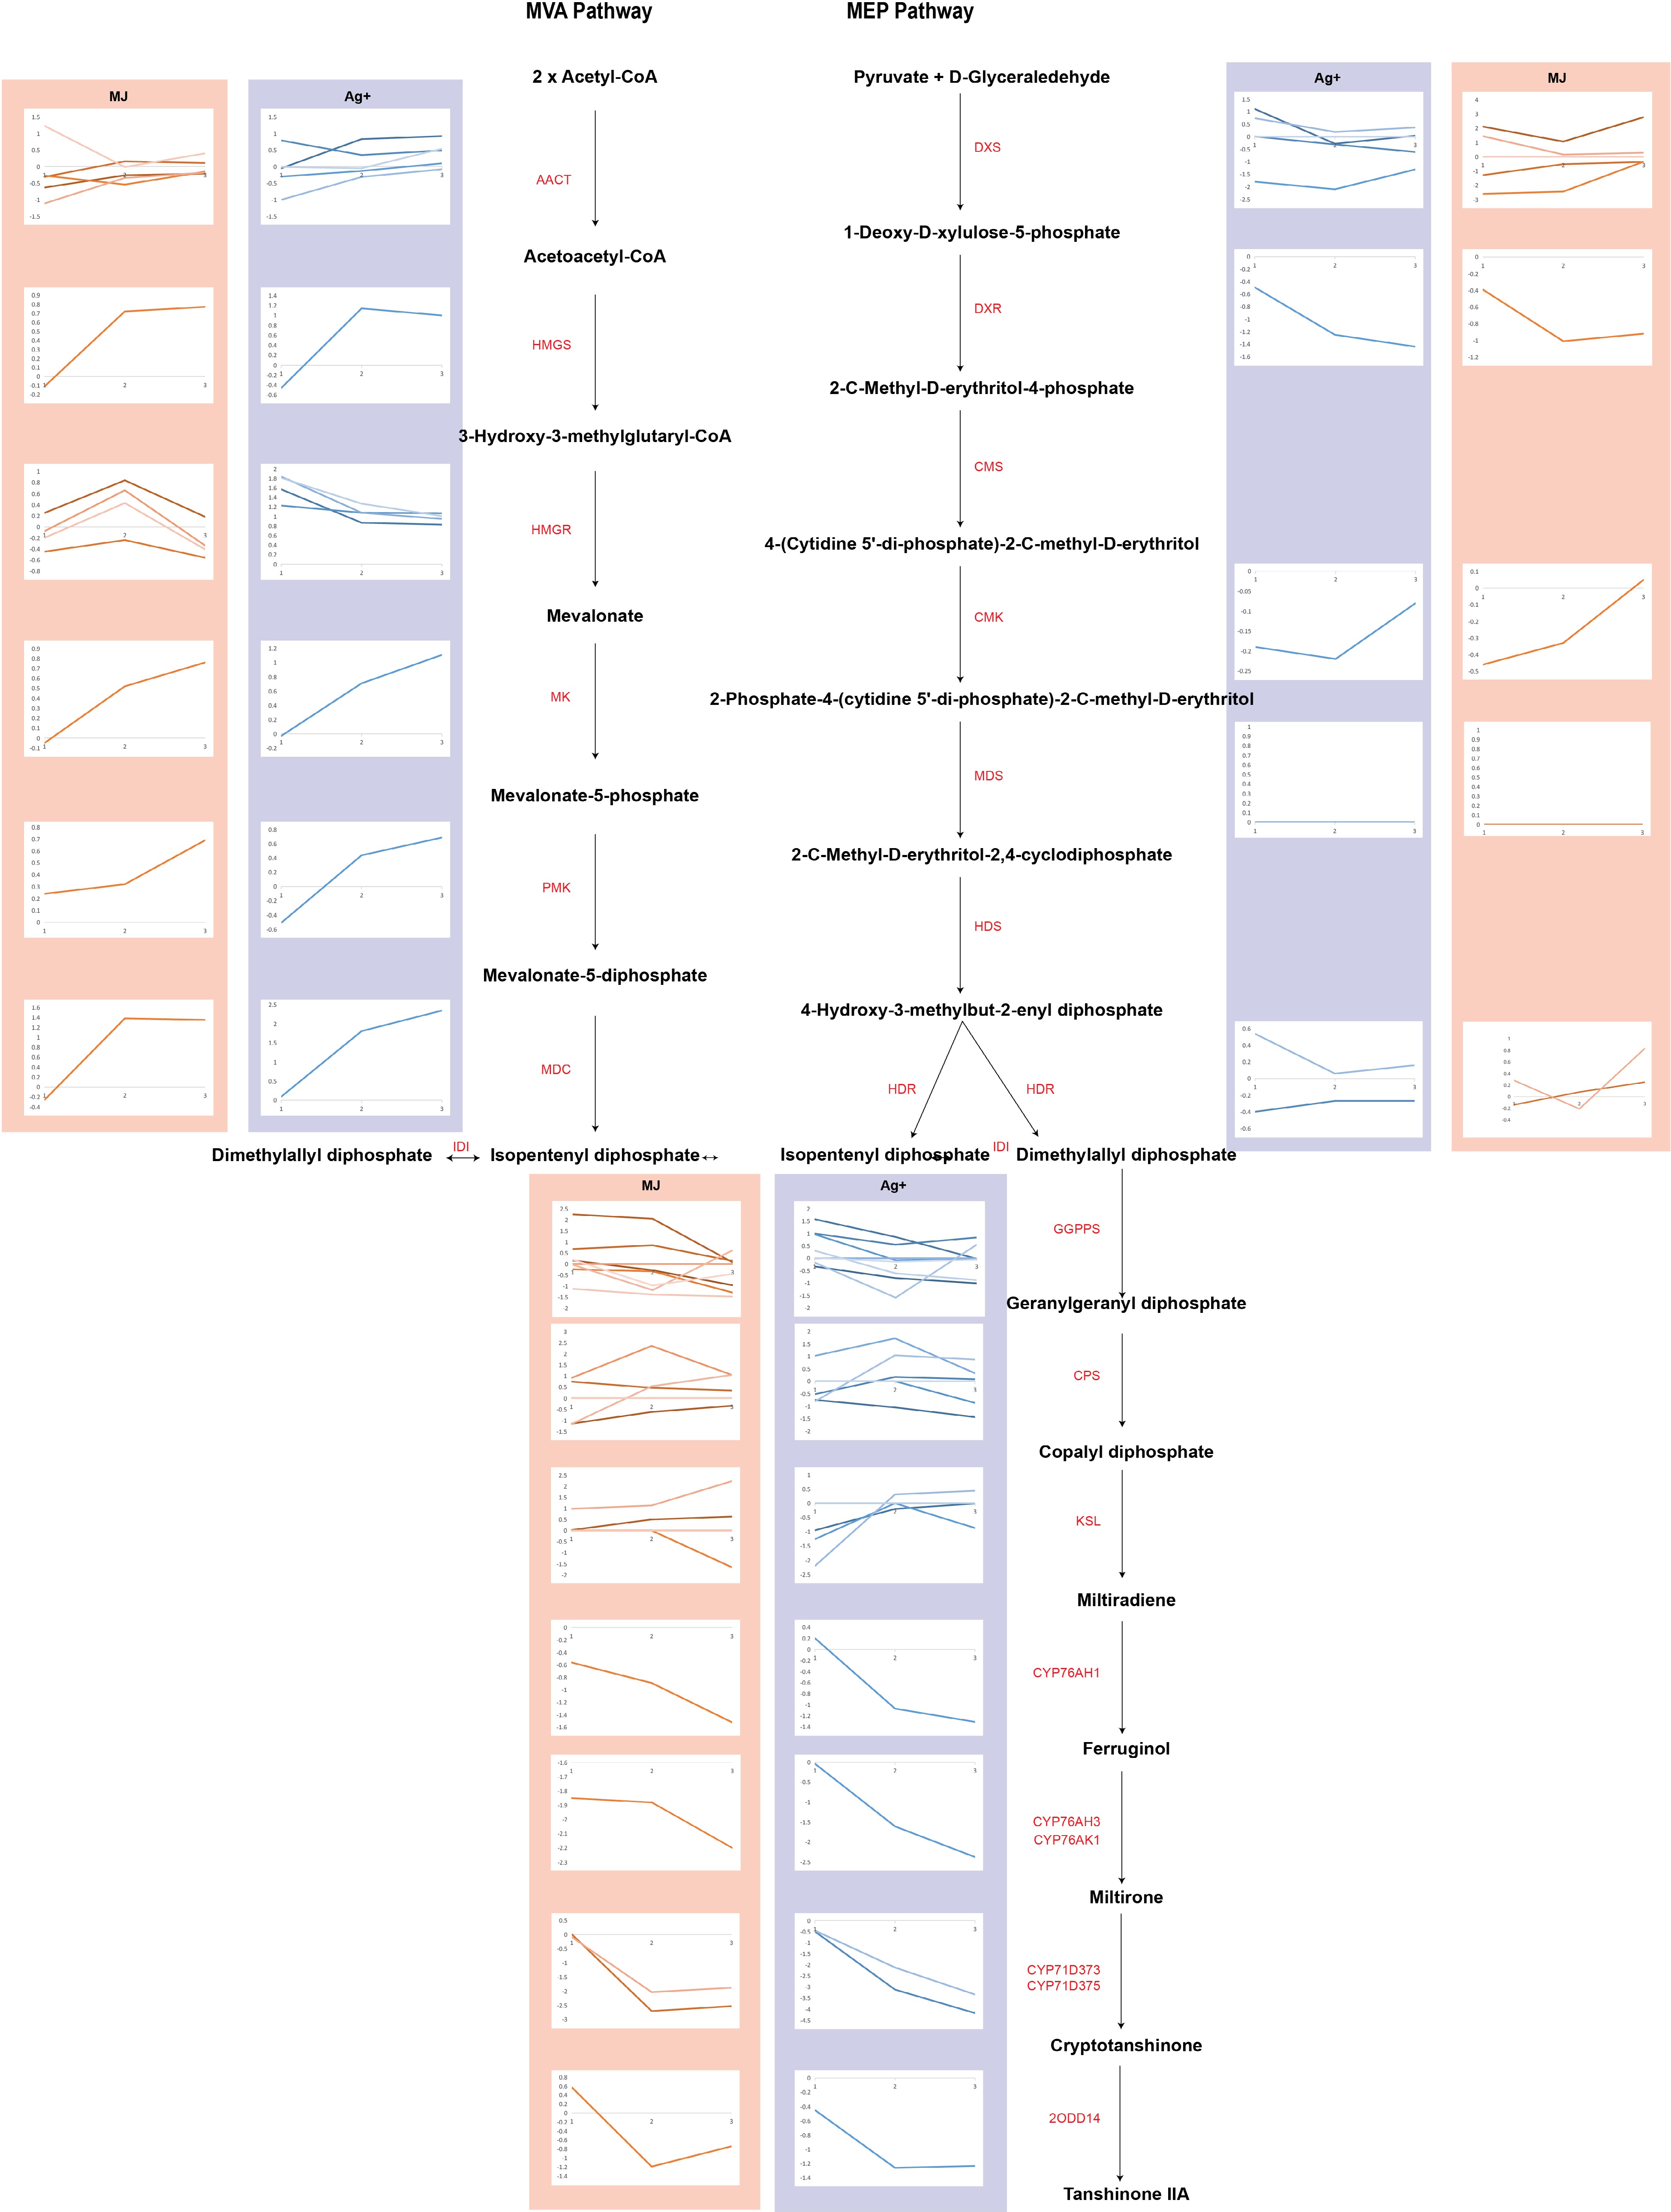
Figure 1.
The expression profiles of genes involved in tanshinone biosynthesis are shown as line charts. Line charts framed in pink represent the expression of genes under the treatment of Ag+, and line charts framed in blue represent the expression of genes under the treatment of MeJA.
-
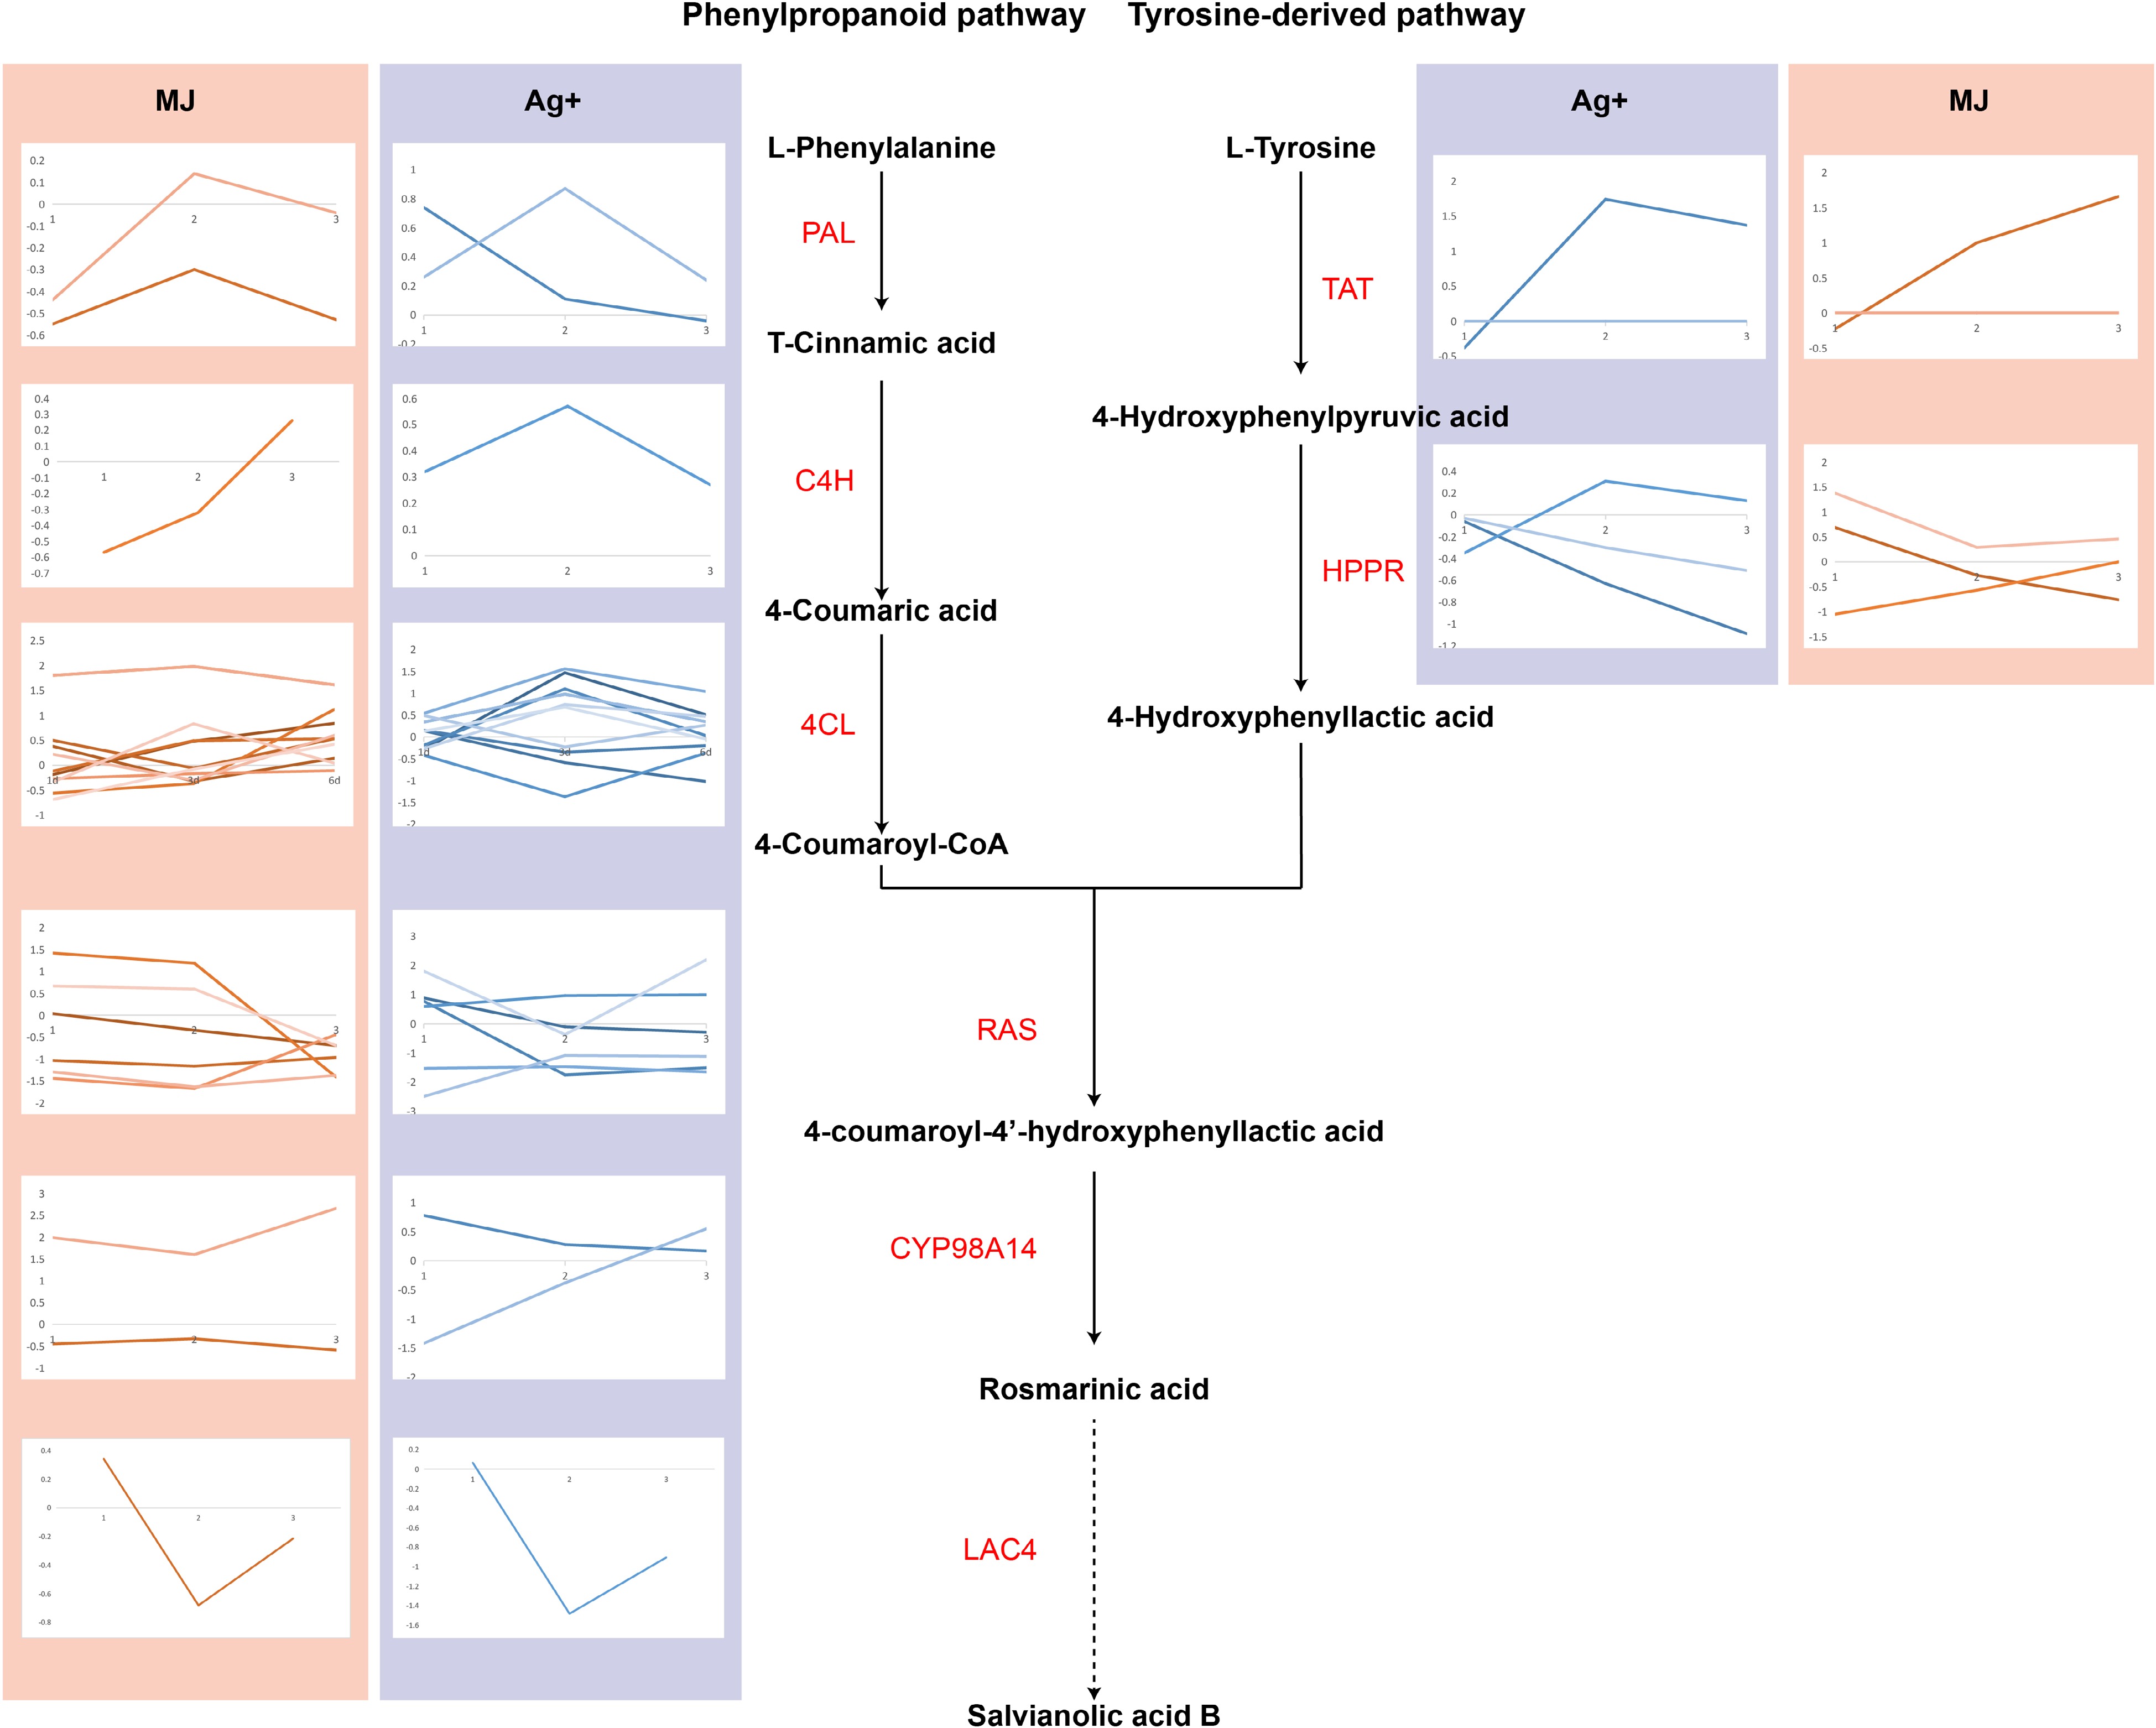
Figure 2.
The expression levels of genes involved in salvianolic acid B biosynthesis are shown using line charts. Line charts framed in pink represent the expression of genes under the treatment of Ag+, and line charts framed in blue represent the expression of genes under the treatment of MeJA.
-
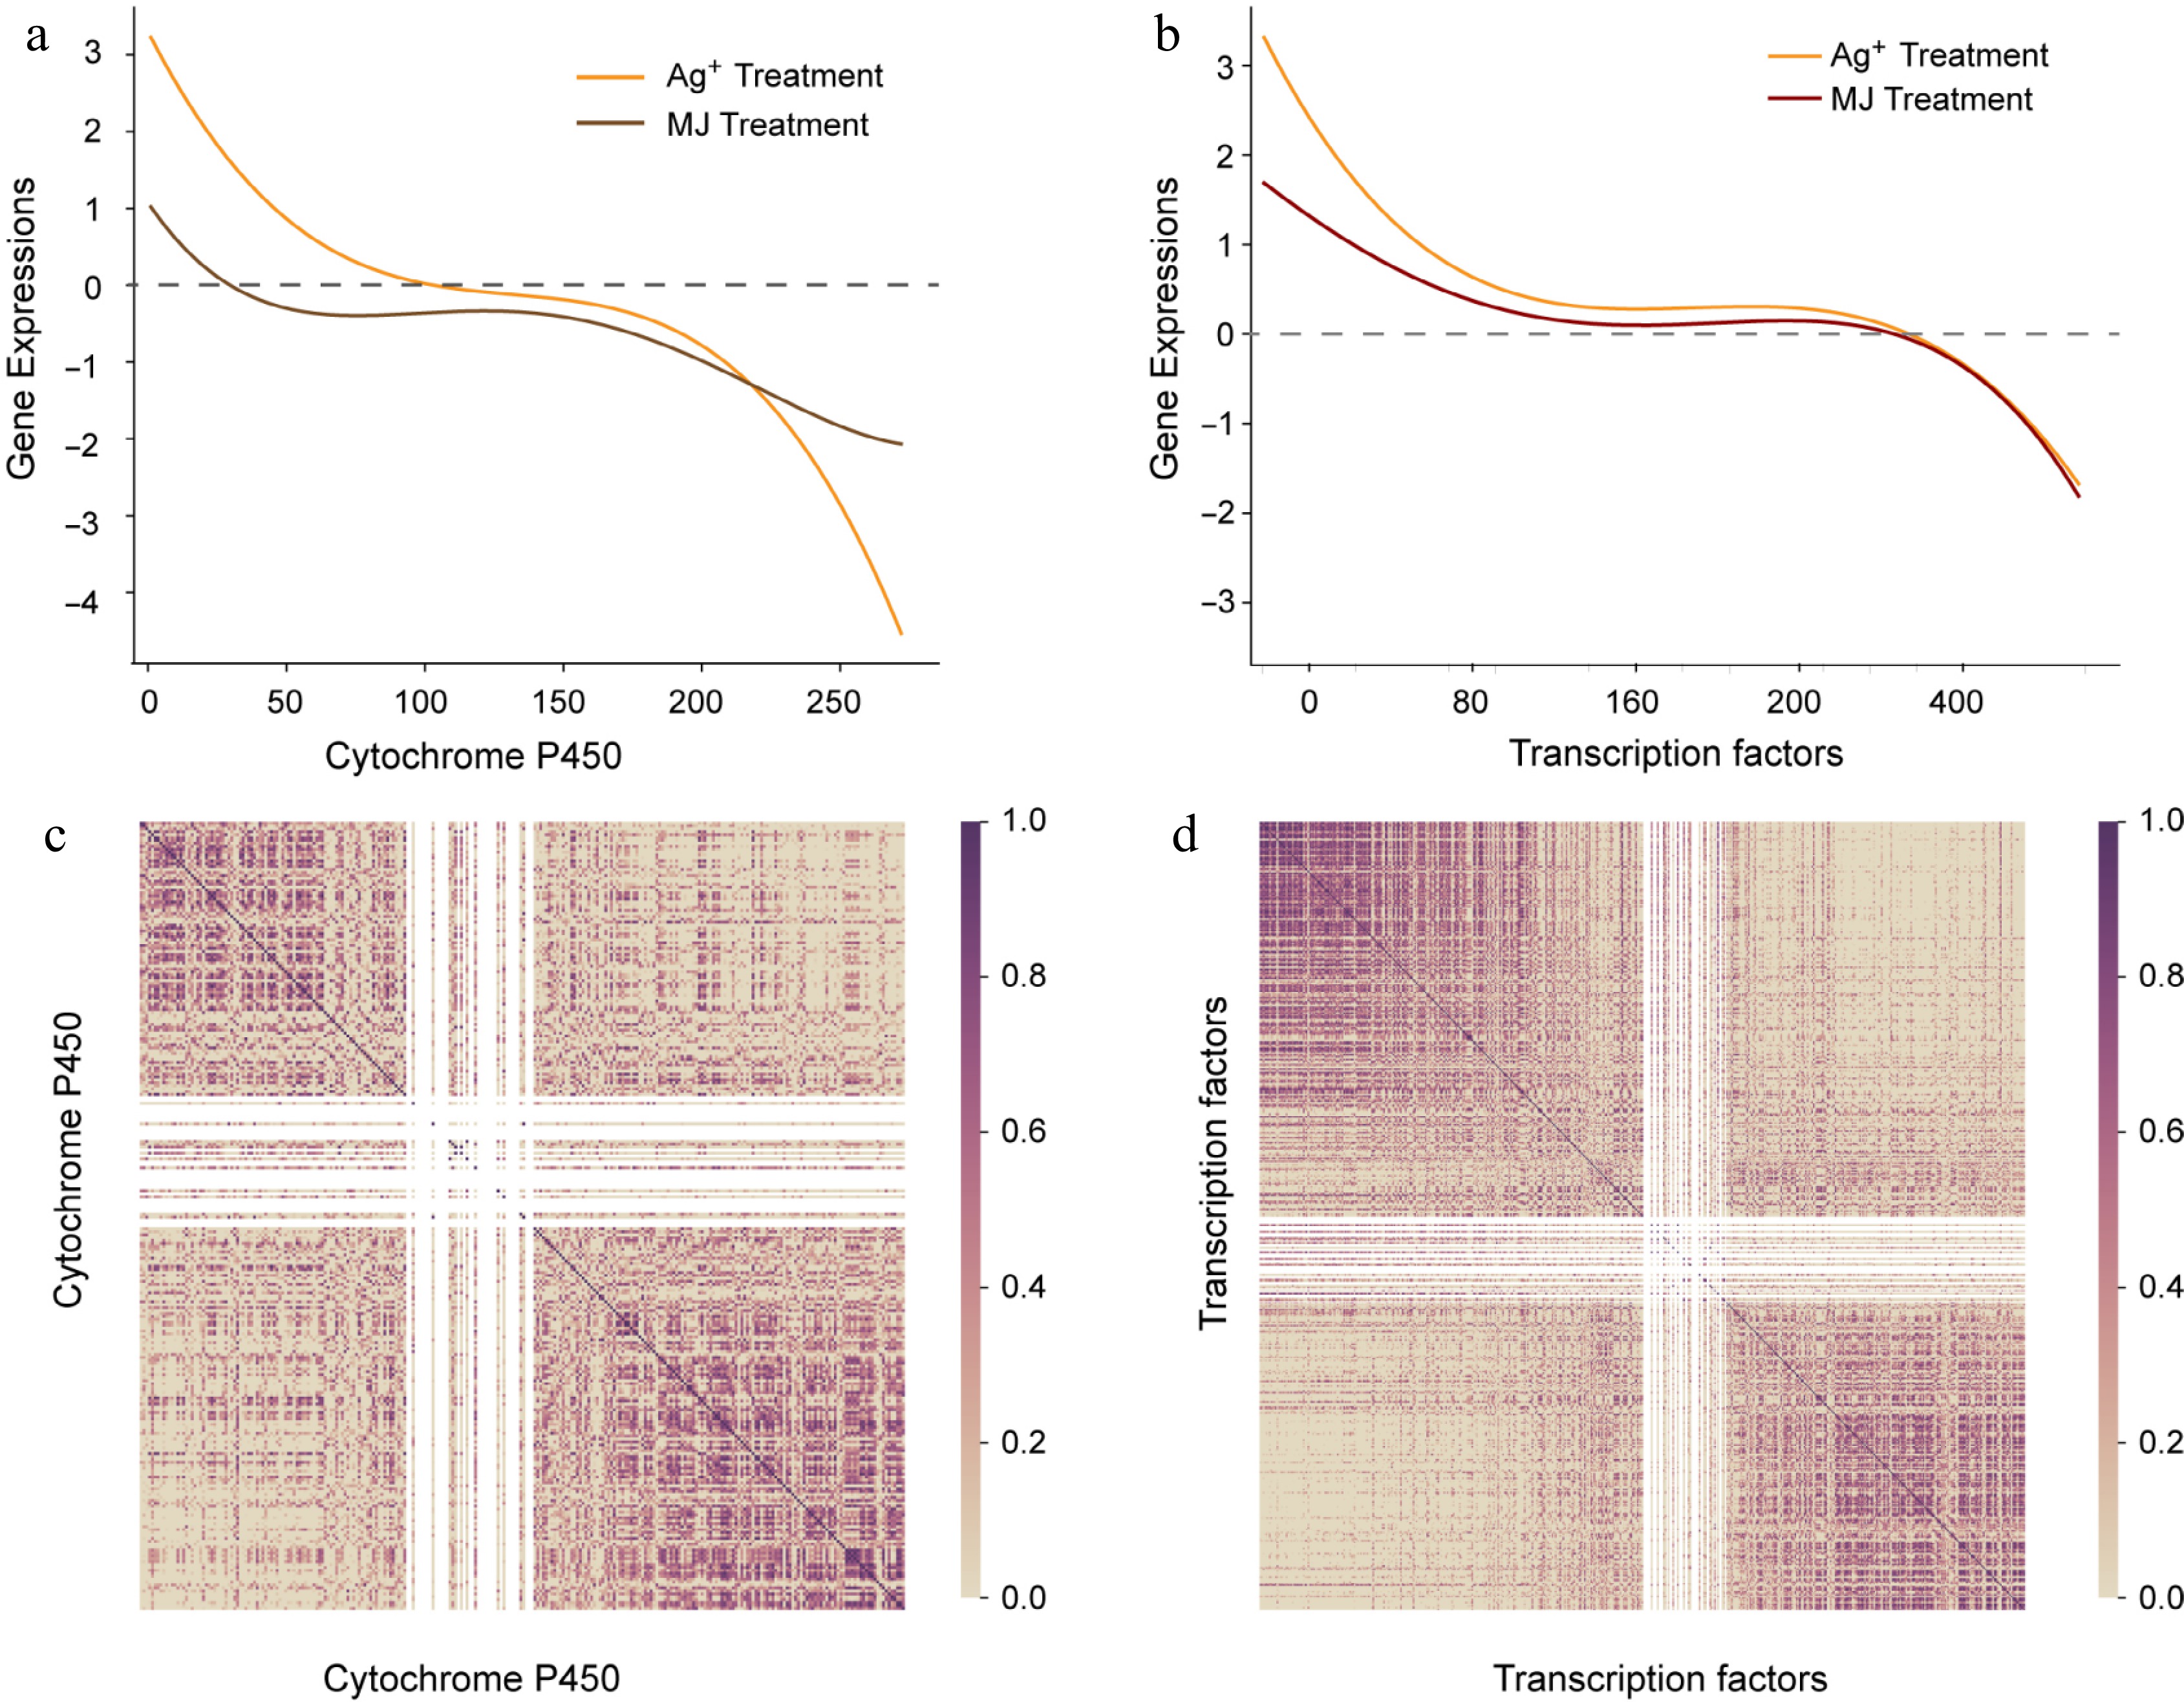
Figure 3.
The expression trend of P450 and transcript factors. (a) Expression trend of P450. X axis represents P450 ordered by descending expression levels, and the gene expression levels are shown with fitted curves. The yellow curve represents expression of P450 with Ag+ treatment, and the red curve represents expression of P450 with MeJA treatment. (b) Pearson correlation coefficient calculated with descending P450, dark purple represents high correlation. (c) The expression trend of transcript factors. (d) Pearson correlation coefficient calculated with descending transcript factors.
-
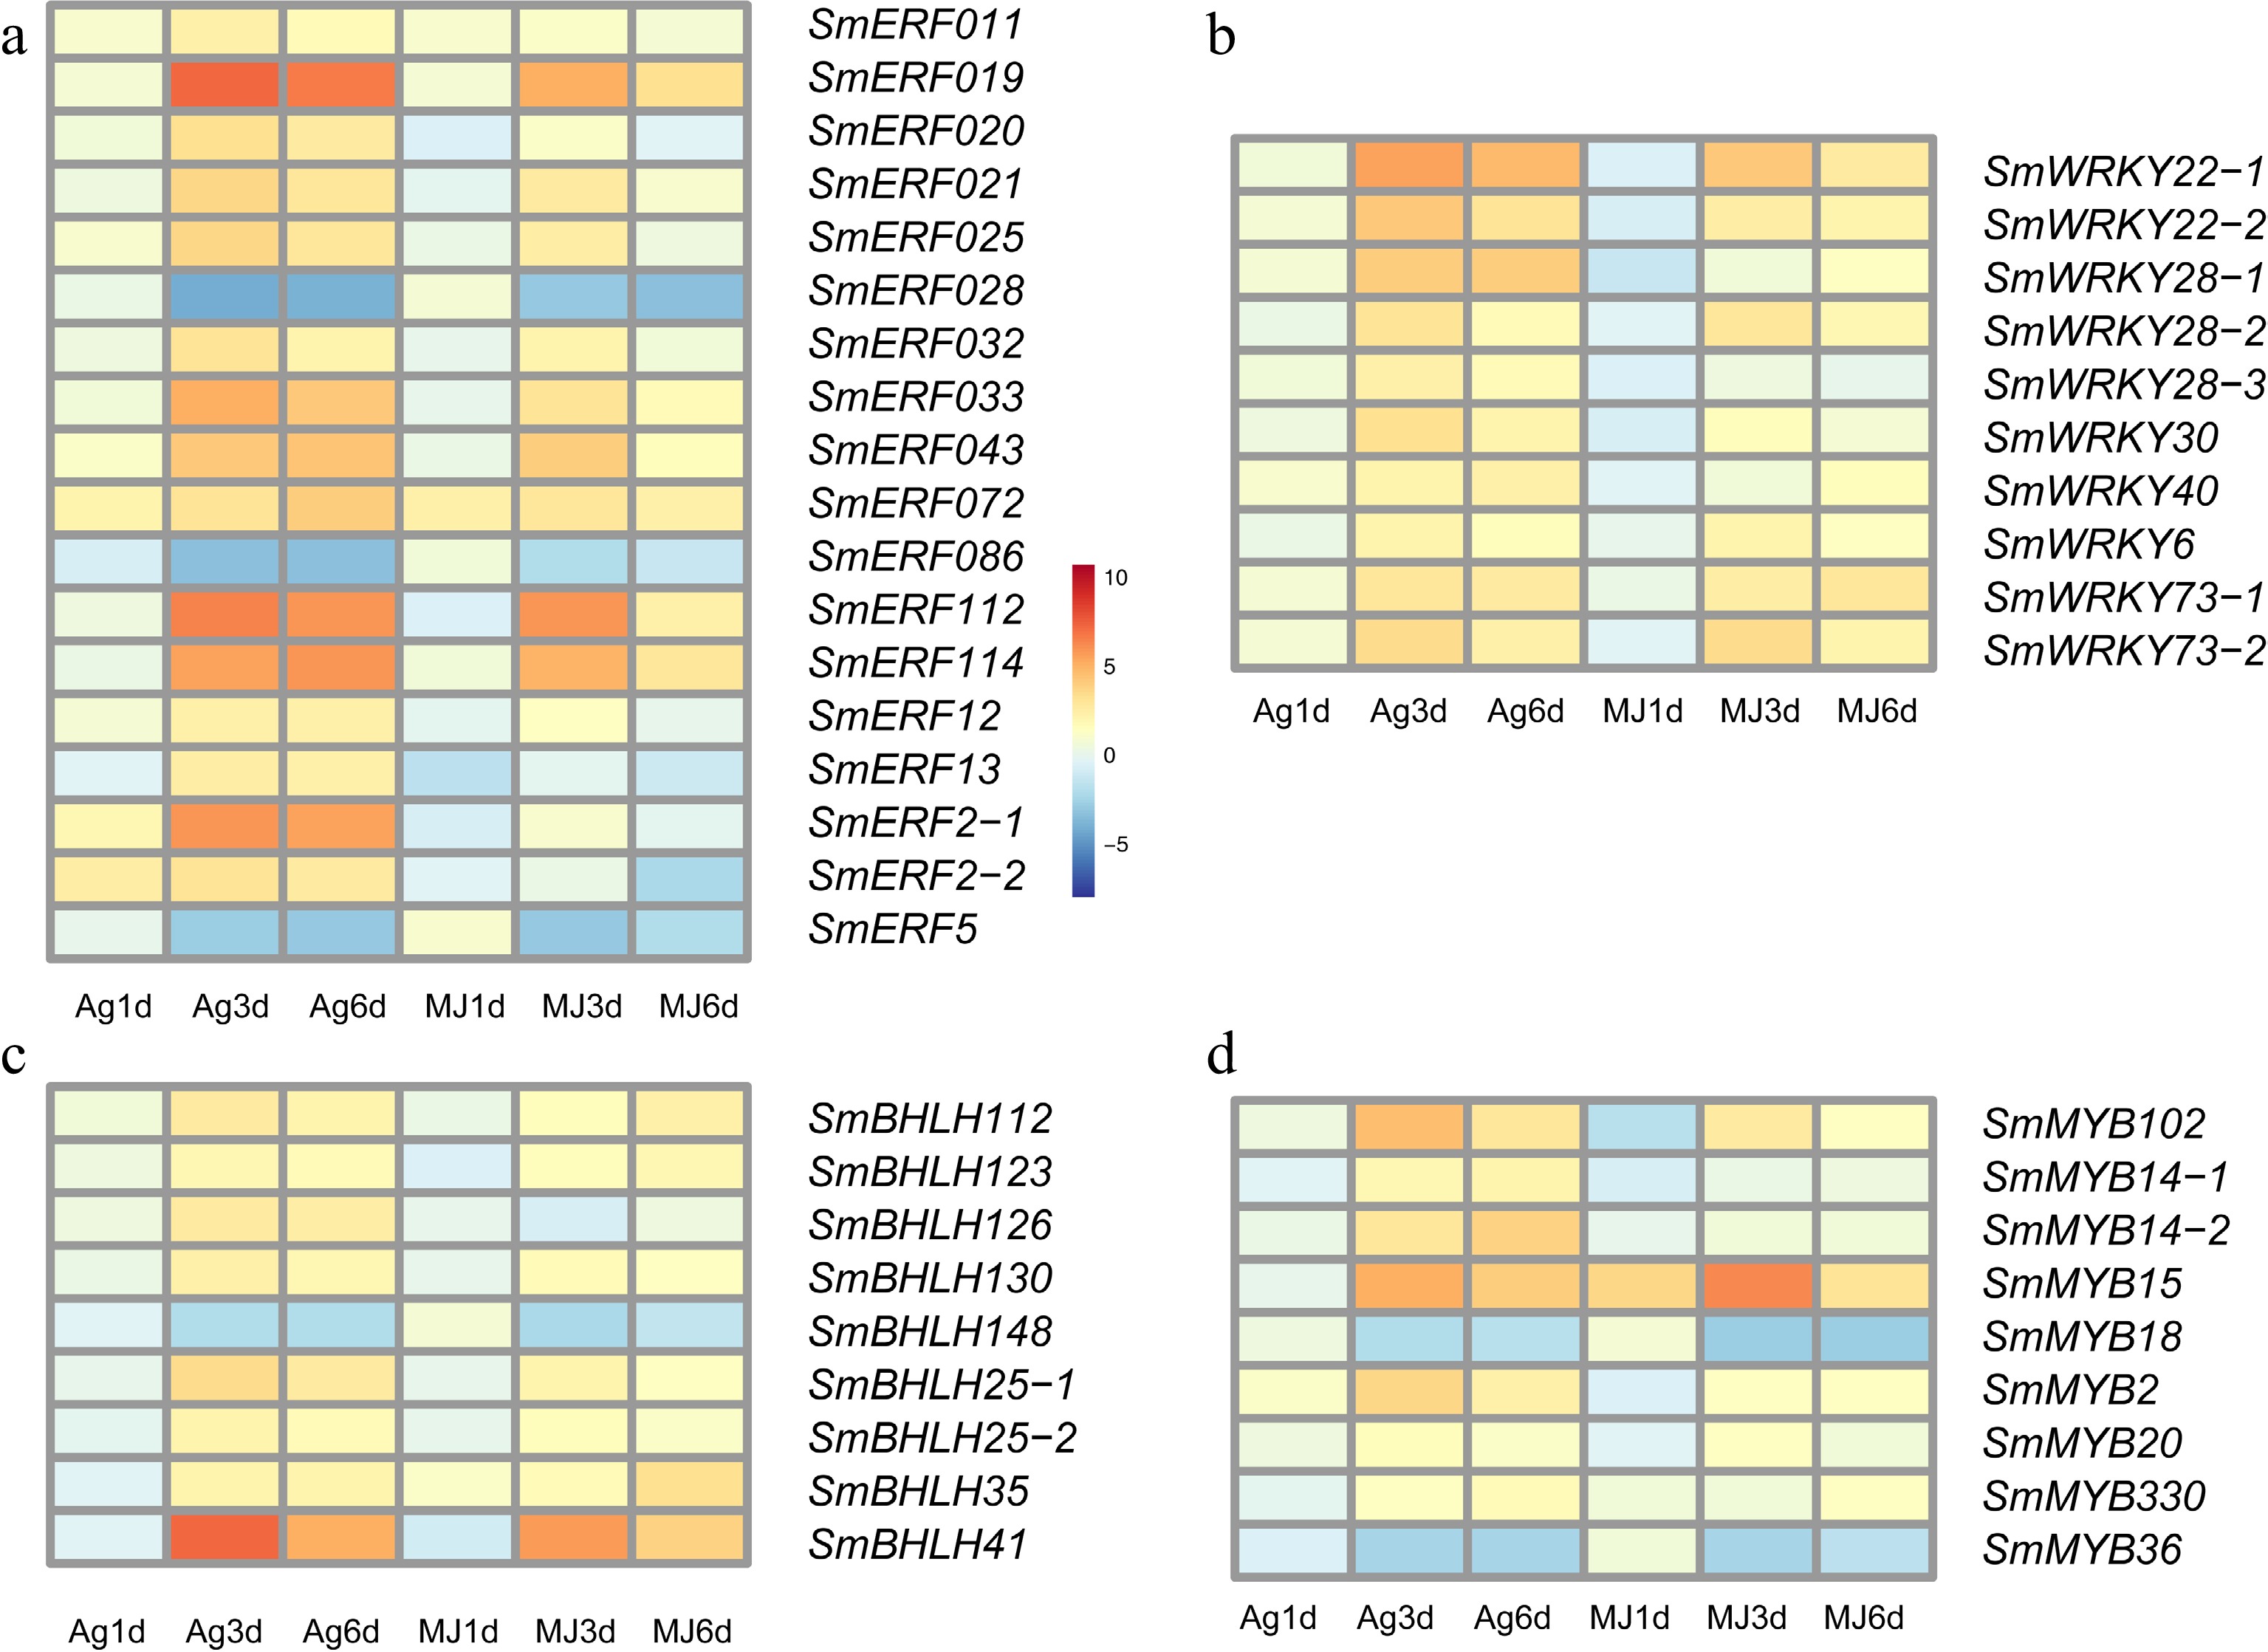
Figure 4.
The expression heatmap of transcript factors differentially expressed under the treatment of Ag+ and MeJA. (a) ERF family, (b) WRKY family, (c) bHLH family and (d) MYB family.
-
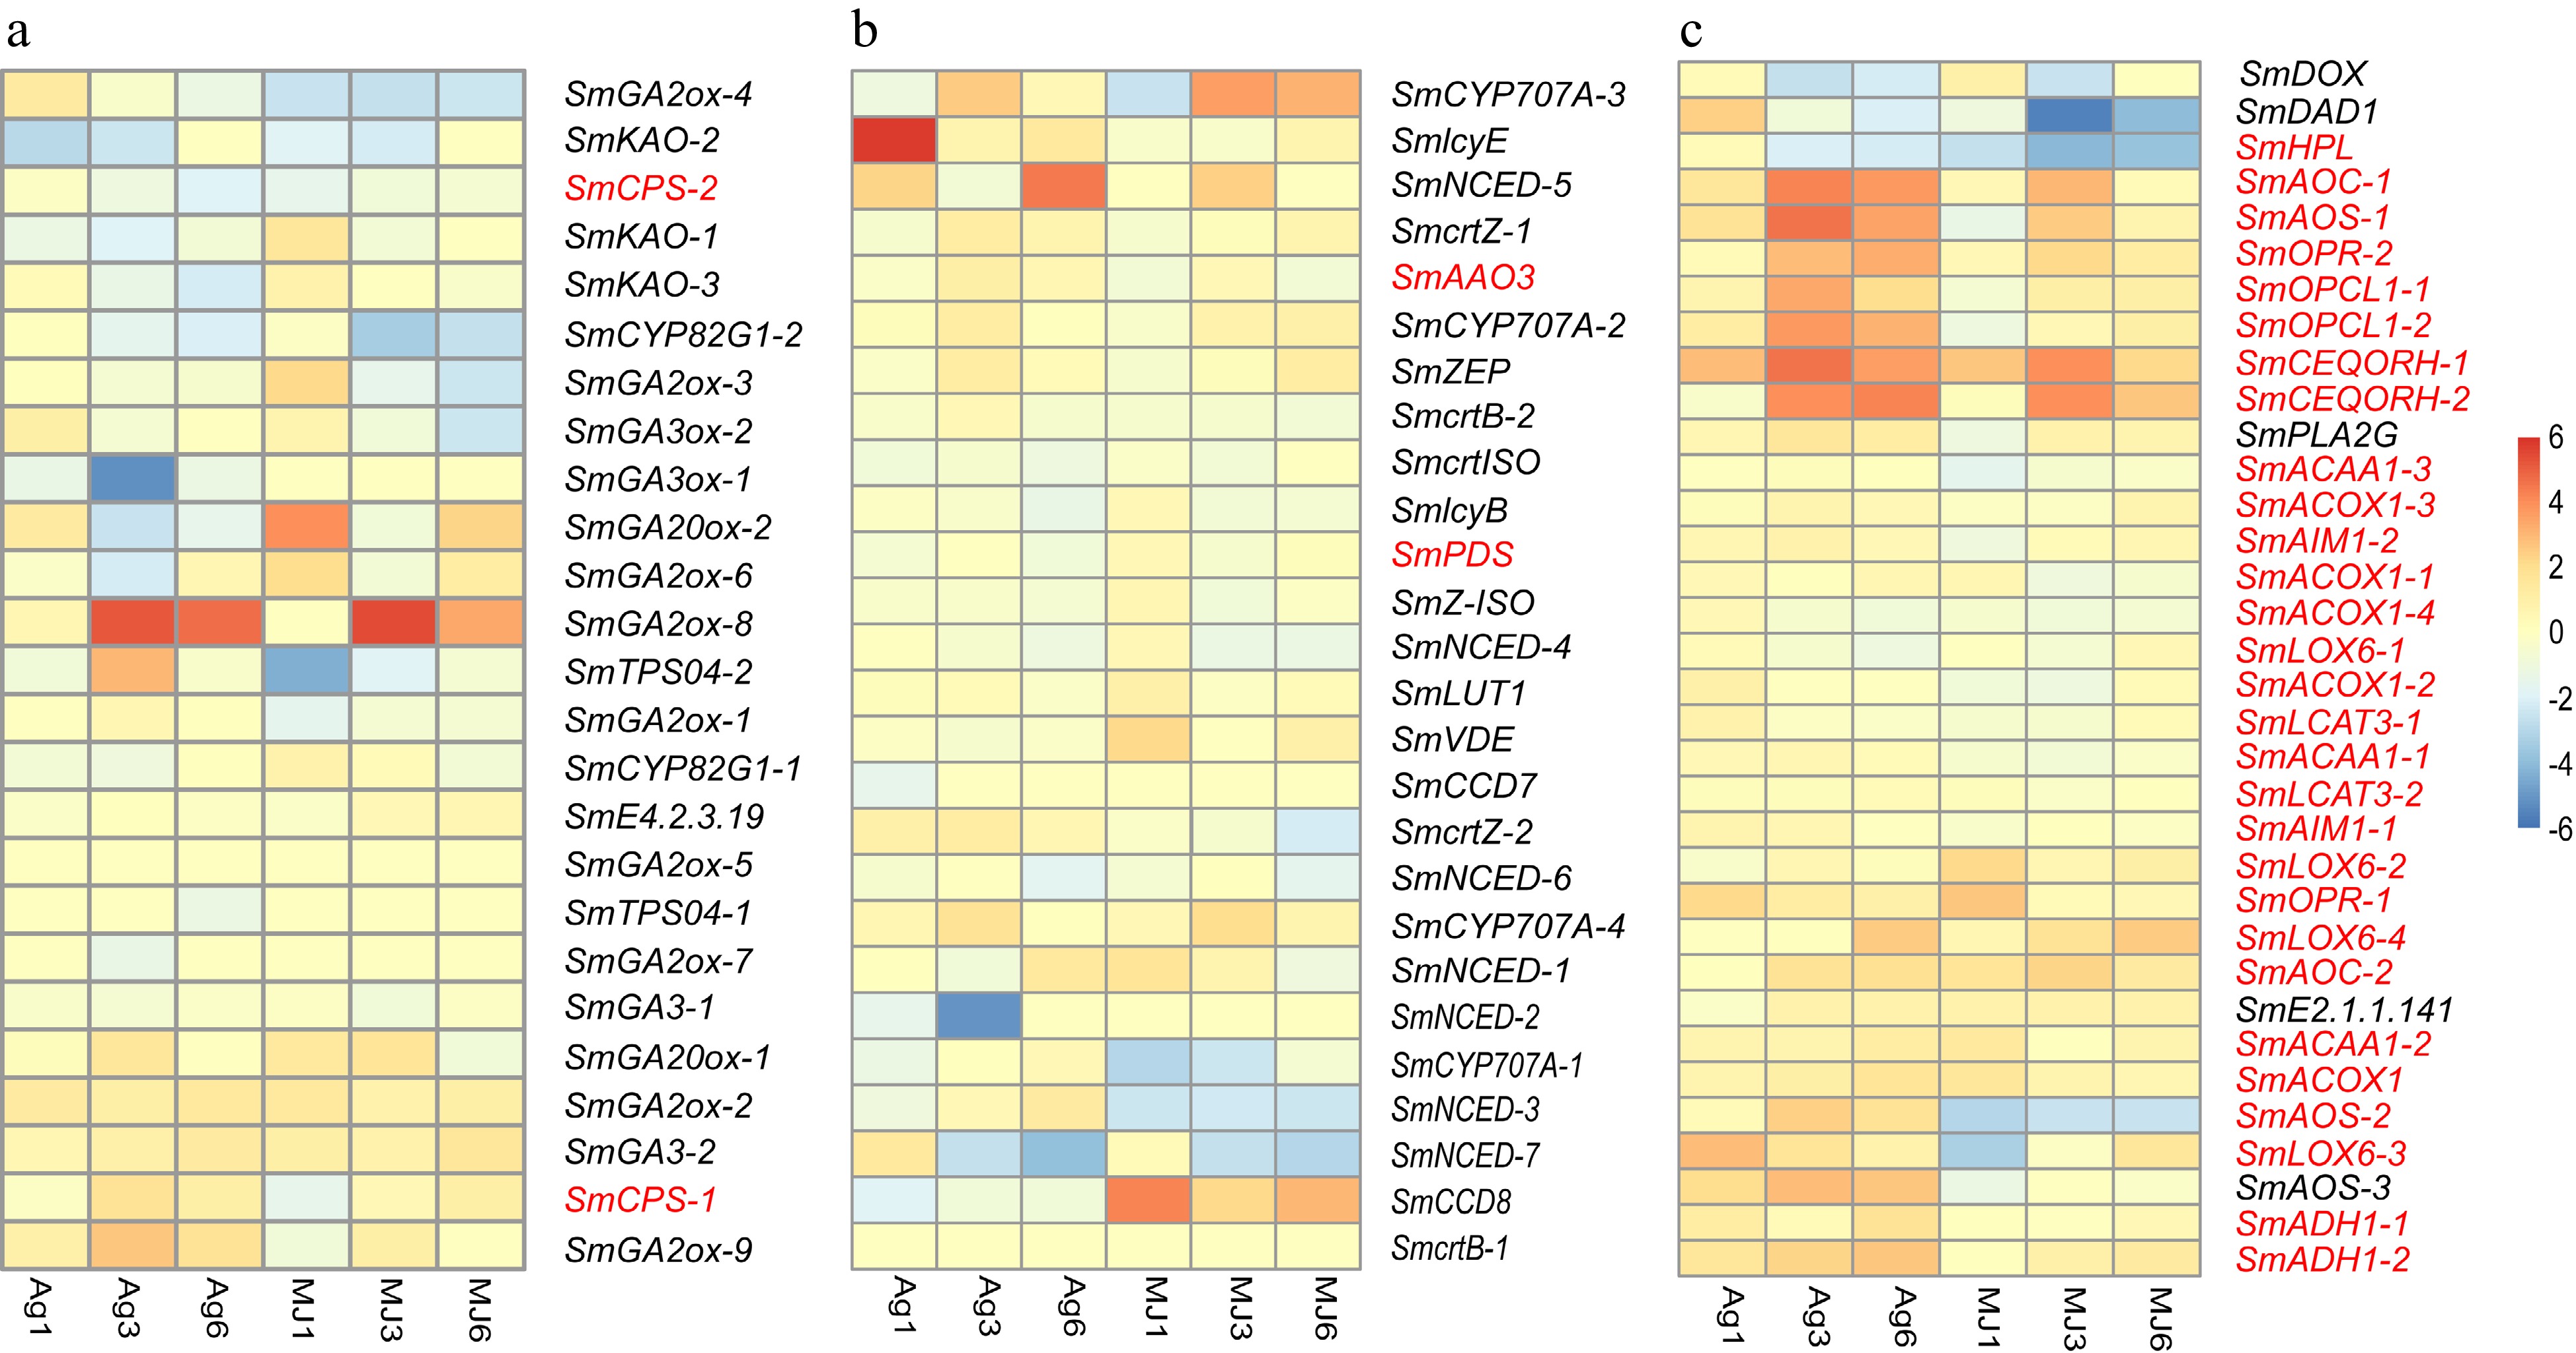
Figure 5.
The expression heatmap of the signaling pathways differentially expressed under the treatment of Ag+ and MeJA. (a) Gibberellin signaling pathway. (b) Abscisic acid signaling pathway. (c) Jasmonic acid signaling pathway.
-
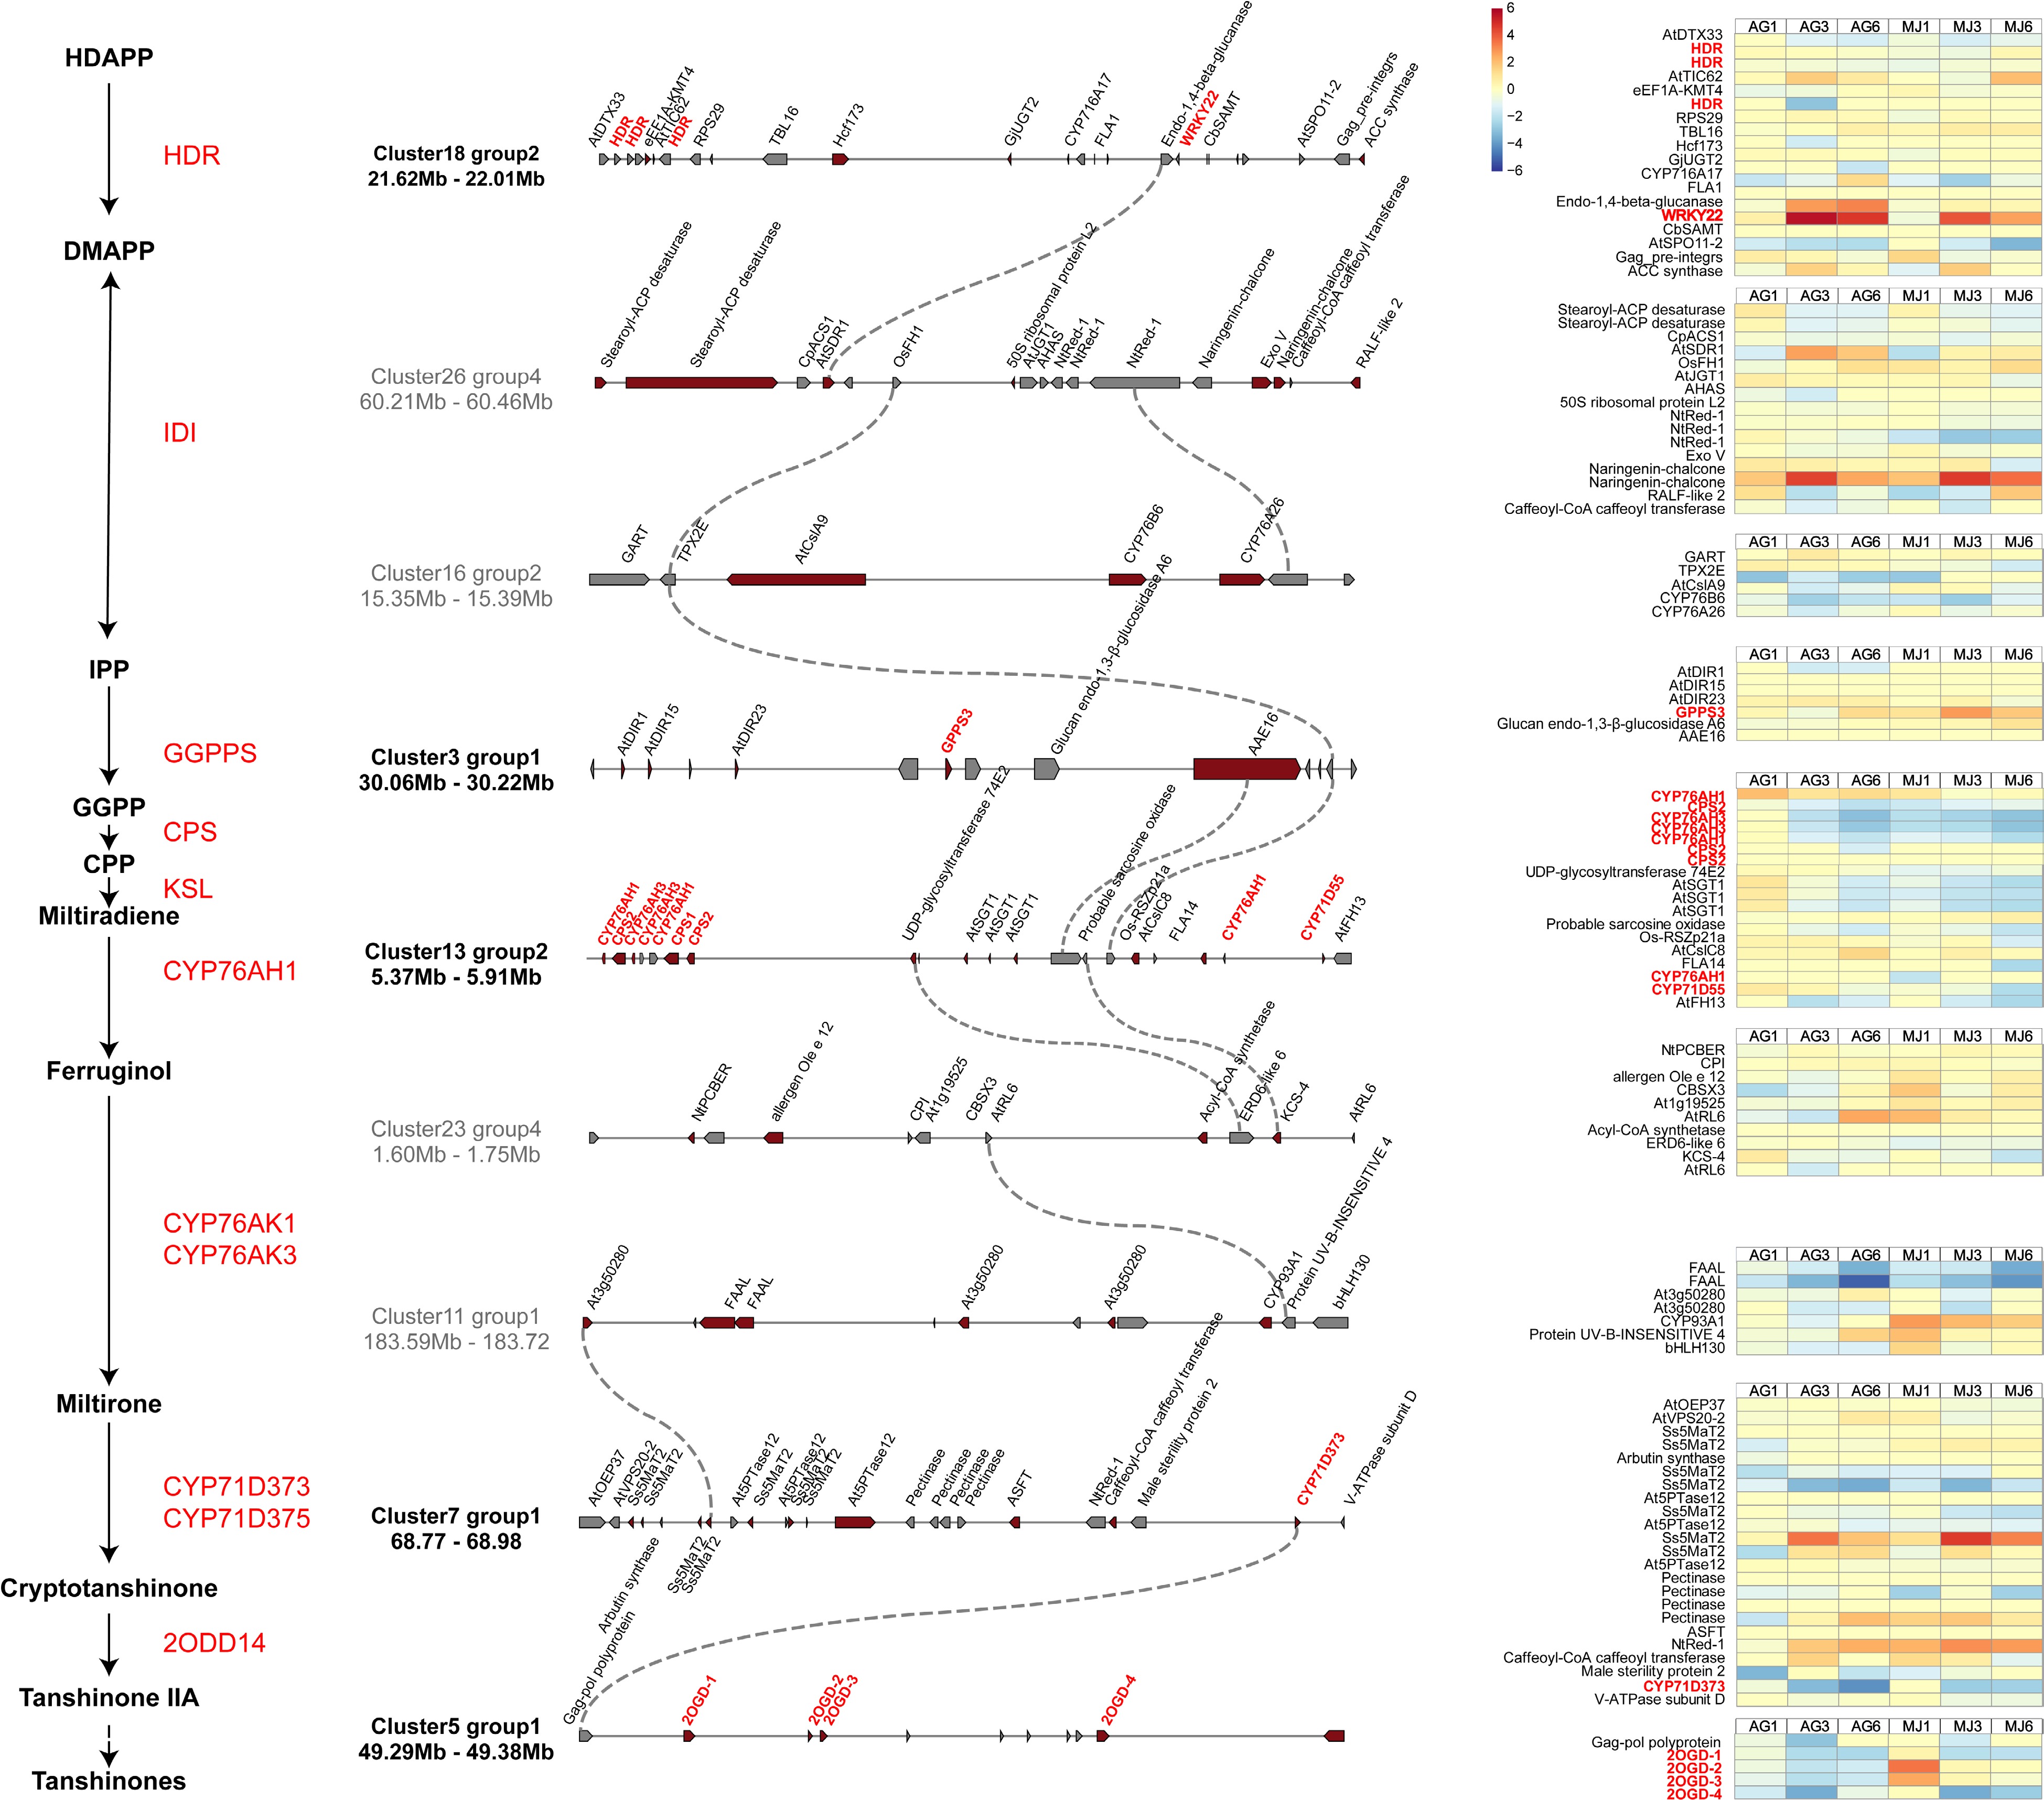
Figure 6.
Gene clusters of S. miltiorrhiza. Left is the downstream pathway of tanshinone biosynthesis. Gene clusters involved in tanshinone biosynthesis were identified by plantiSMASH. Pathway genes and candidate genes are labeled in red, and dotted lines represent co-expressed relationship between genes. The expression of genes in clusters under the treatment of Ag+ and MeJA are on the right of the figure.
Figures
(6)
Tables
(0)