-
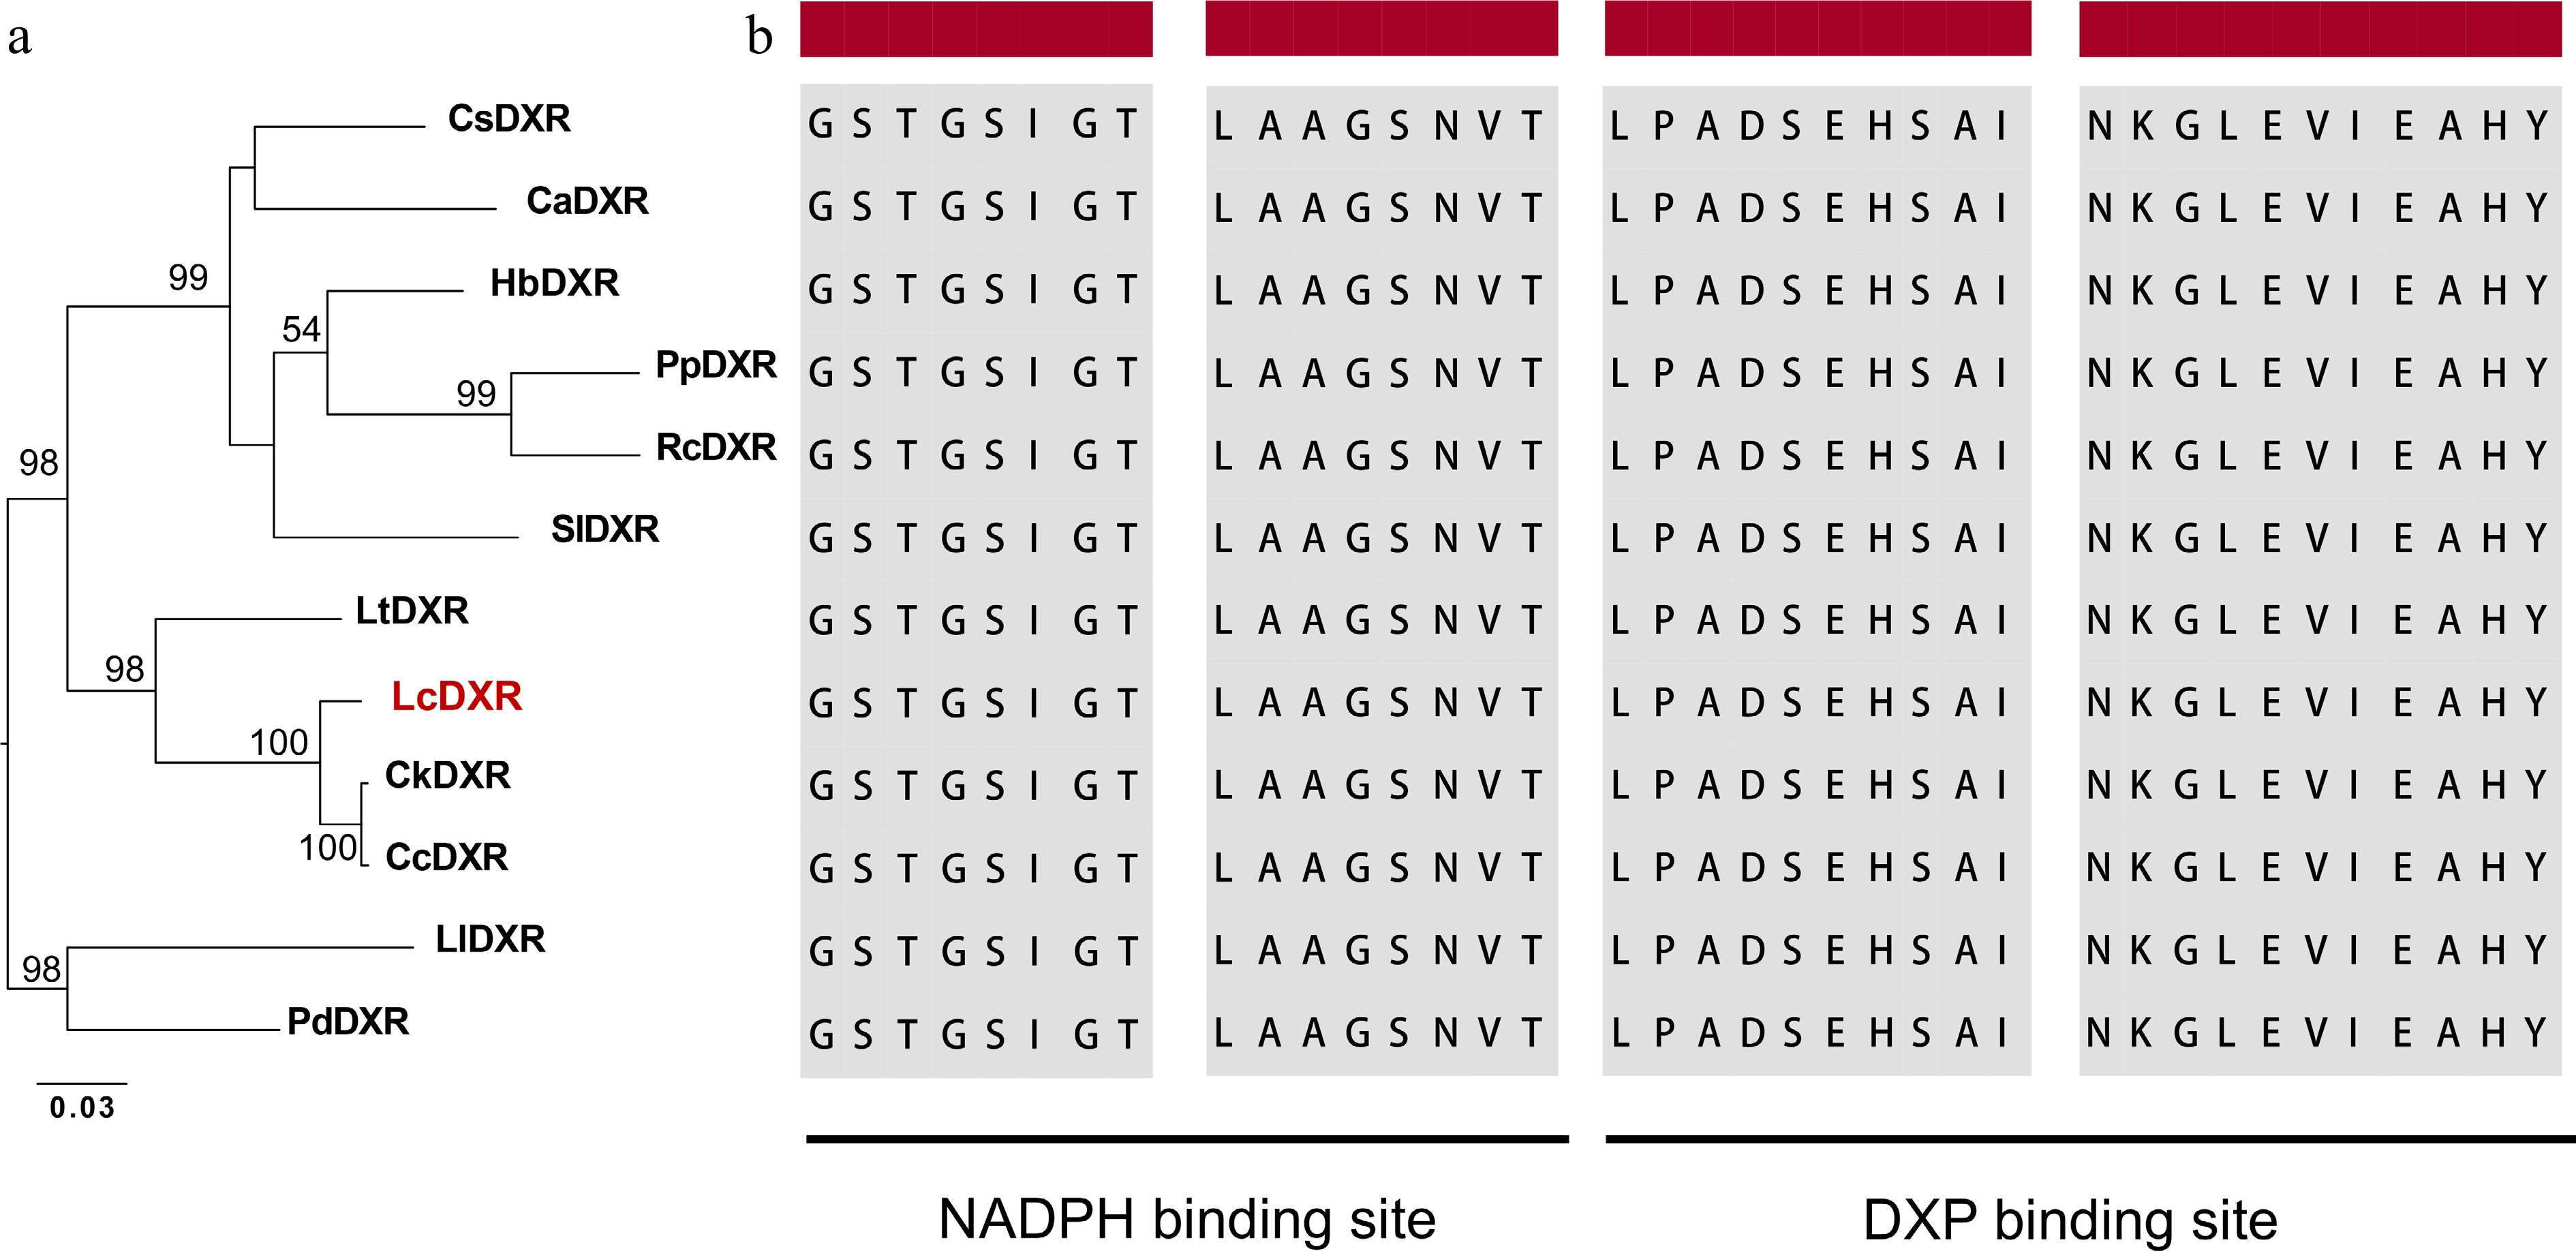
Figure 1.
Sequence analysis of the LcDXR. (a) Maximum-likelihood tree of DXR protein sequences, including LcDXR and other DXRs. The following protein sequences were used for the analysis: CsDXR (XP_028055701), CaDXR (XP_027123133), HbDXR (XP_021669849), PpDXR (XP_007210092), RcDXR (XP_024173969), SlDXR (AAK96063), LtDXR (UOO00992), CkDXR (RWR93981), CcDXR (AOW69227), LlDXR (AHJ57307), PdDXR (XP_008787962). (b) Sequence alignment of DXRs. The black background indicates the NADPH binding domain and the DXP binding domain.
-
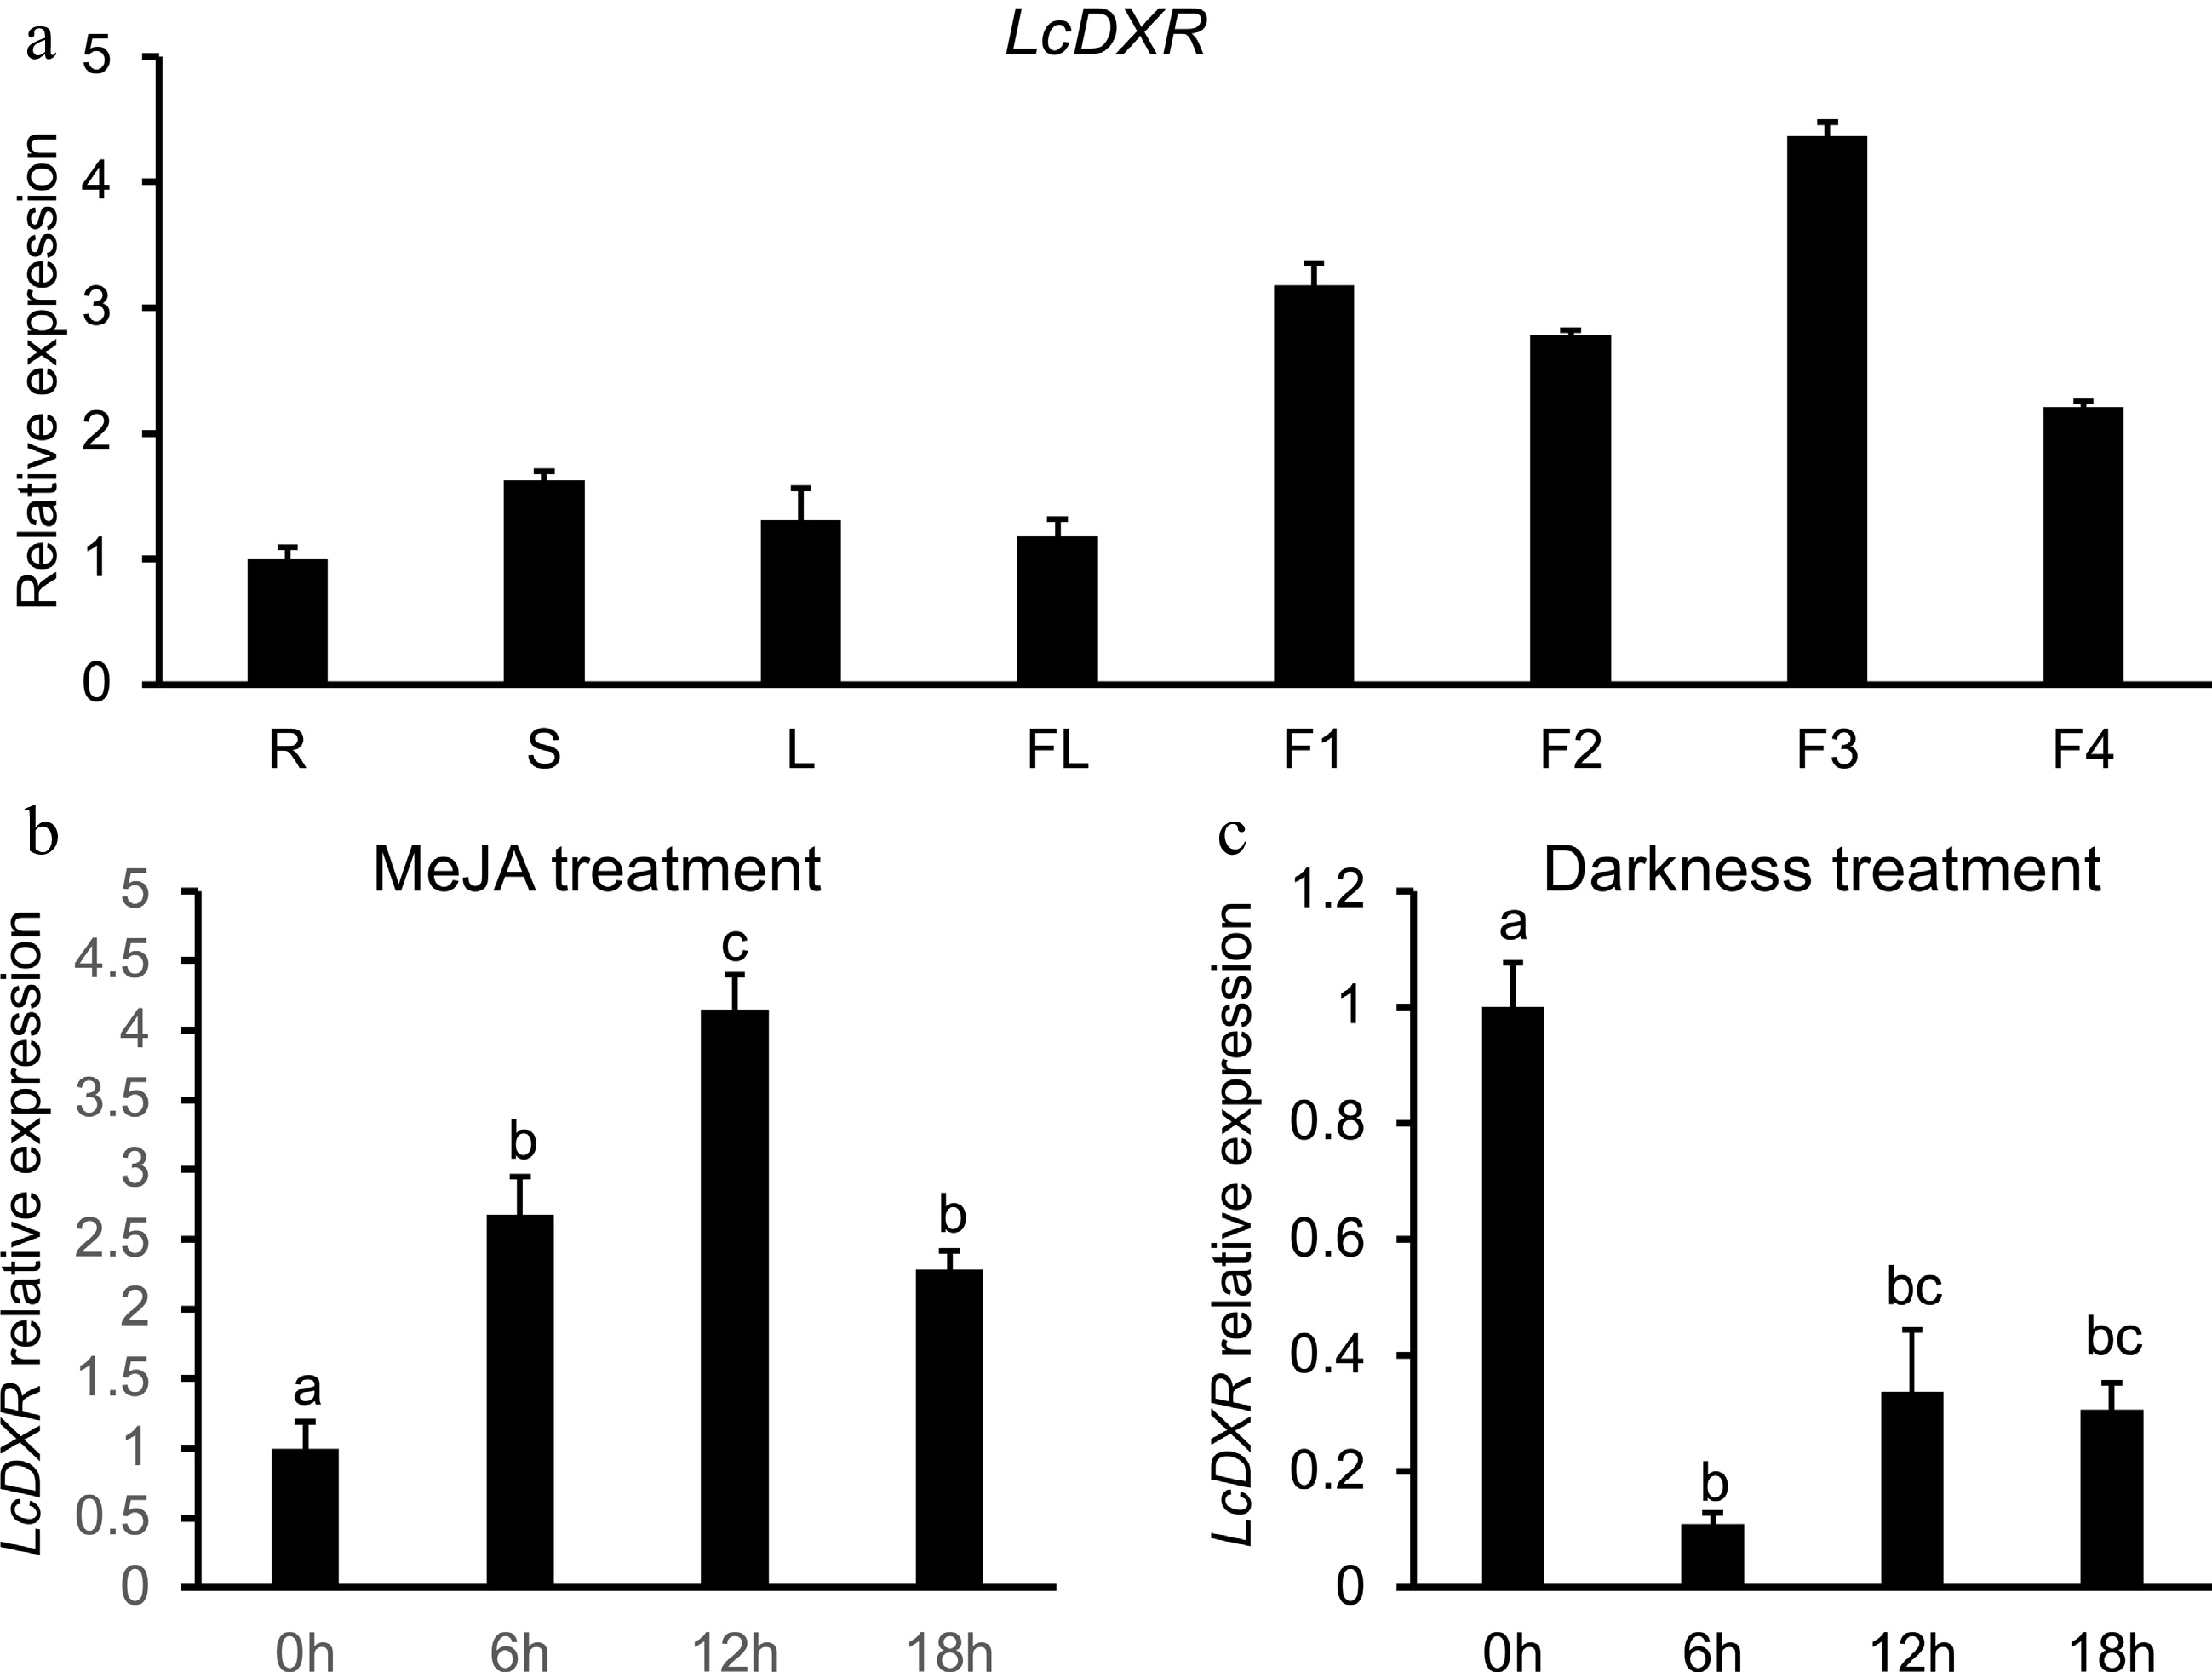
Figure 2.
Tissue specific expression patterns of LcDXR. (a) The transcript levels of LcDXR in different tissues of L. cubeba. R: roots; S: stems; L: leaves; FL: flower; F1, fruits at 60 DAF; F2, fruits at 90 DAF; F3, fruits at 120 DAF; F4, fruits at 150 DAF. (b) The expression levels of LcDXR were induced by MeJA in 60 DAF fruits. (c) The expression levels of LcDXR were repressed by darkness in 60 DAF fruits. Error bars represent ± SD from three biological repeats. The different letters above the bars represent the significant difference (P < 0.01).
-
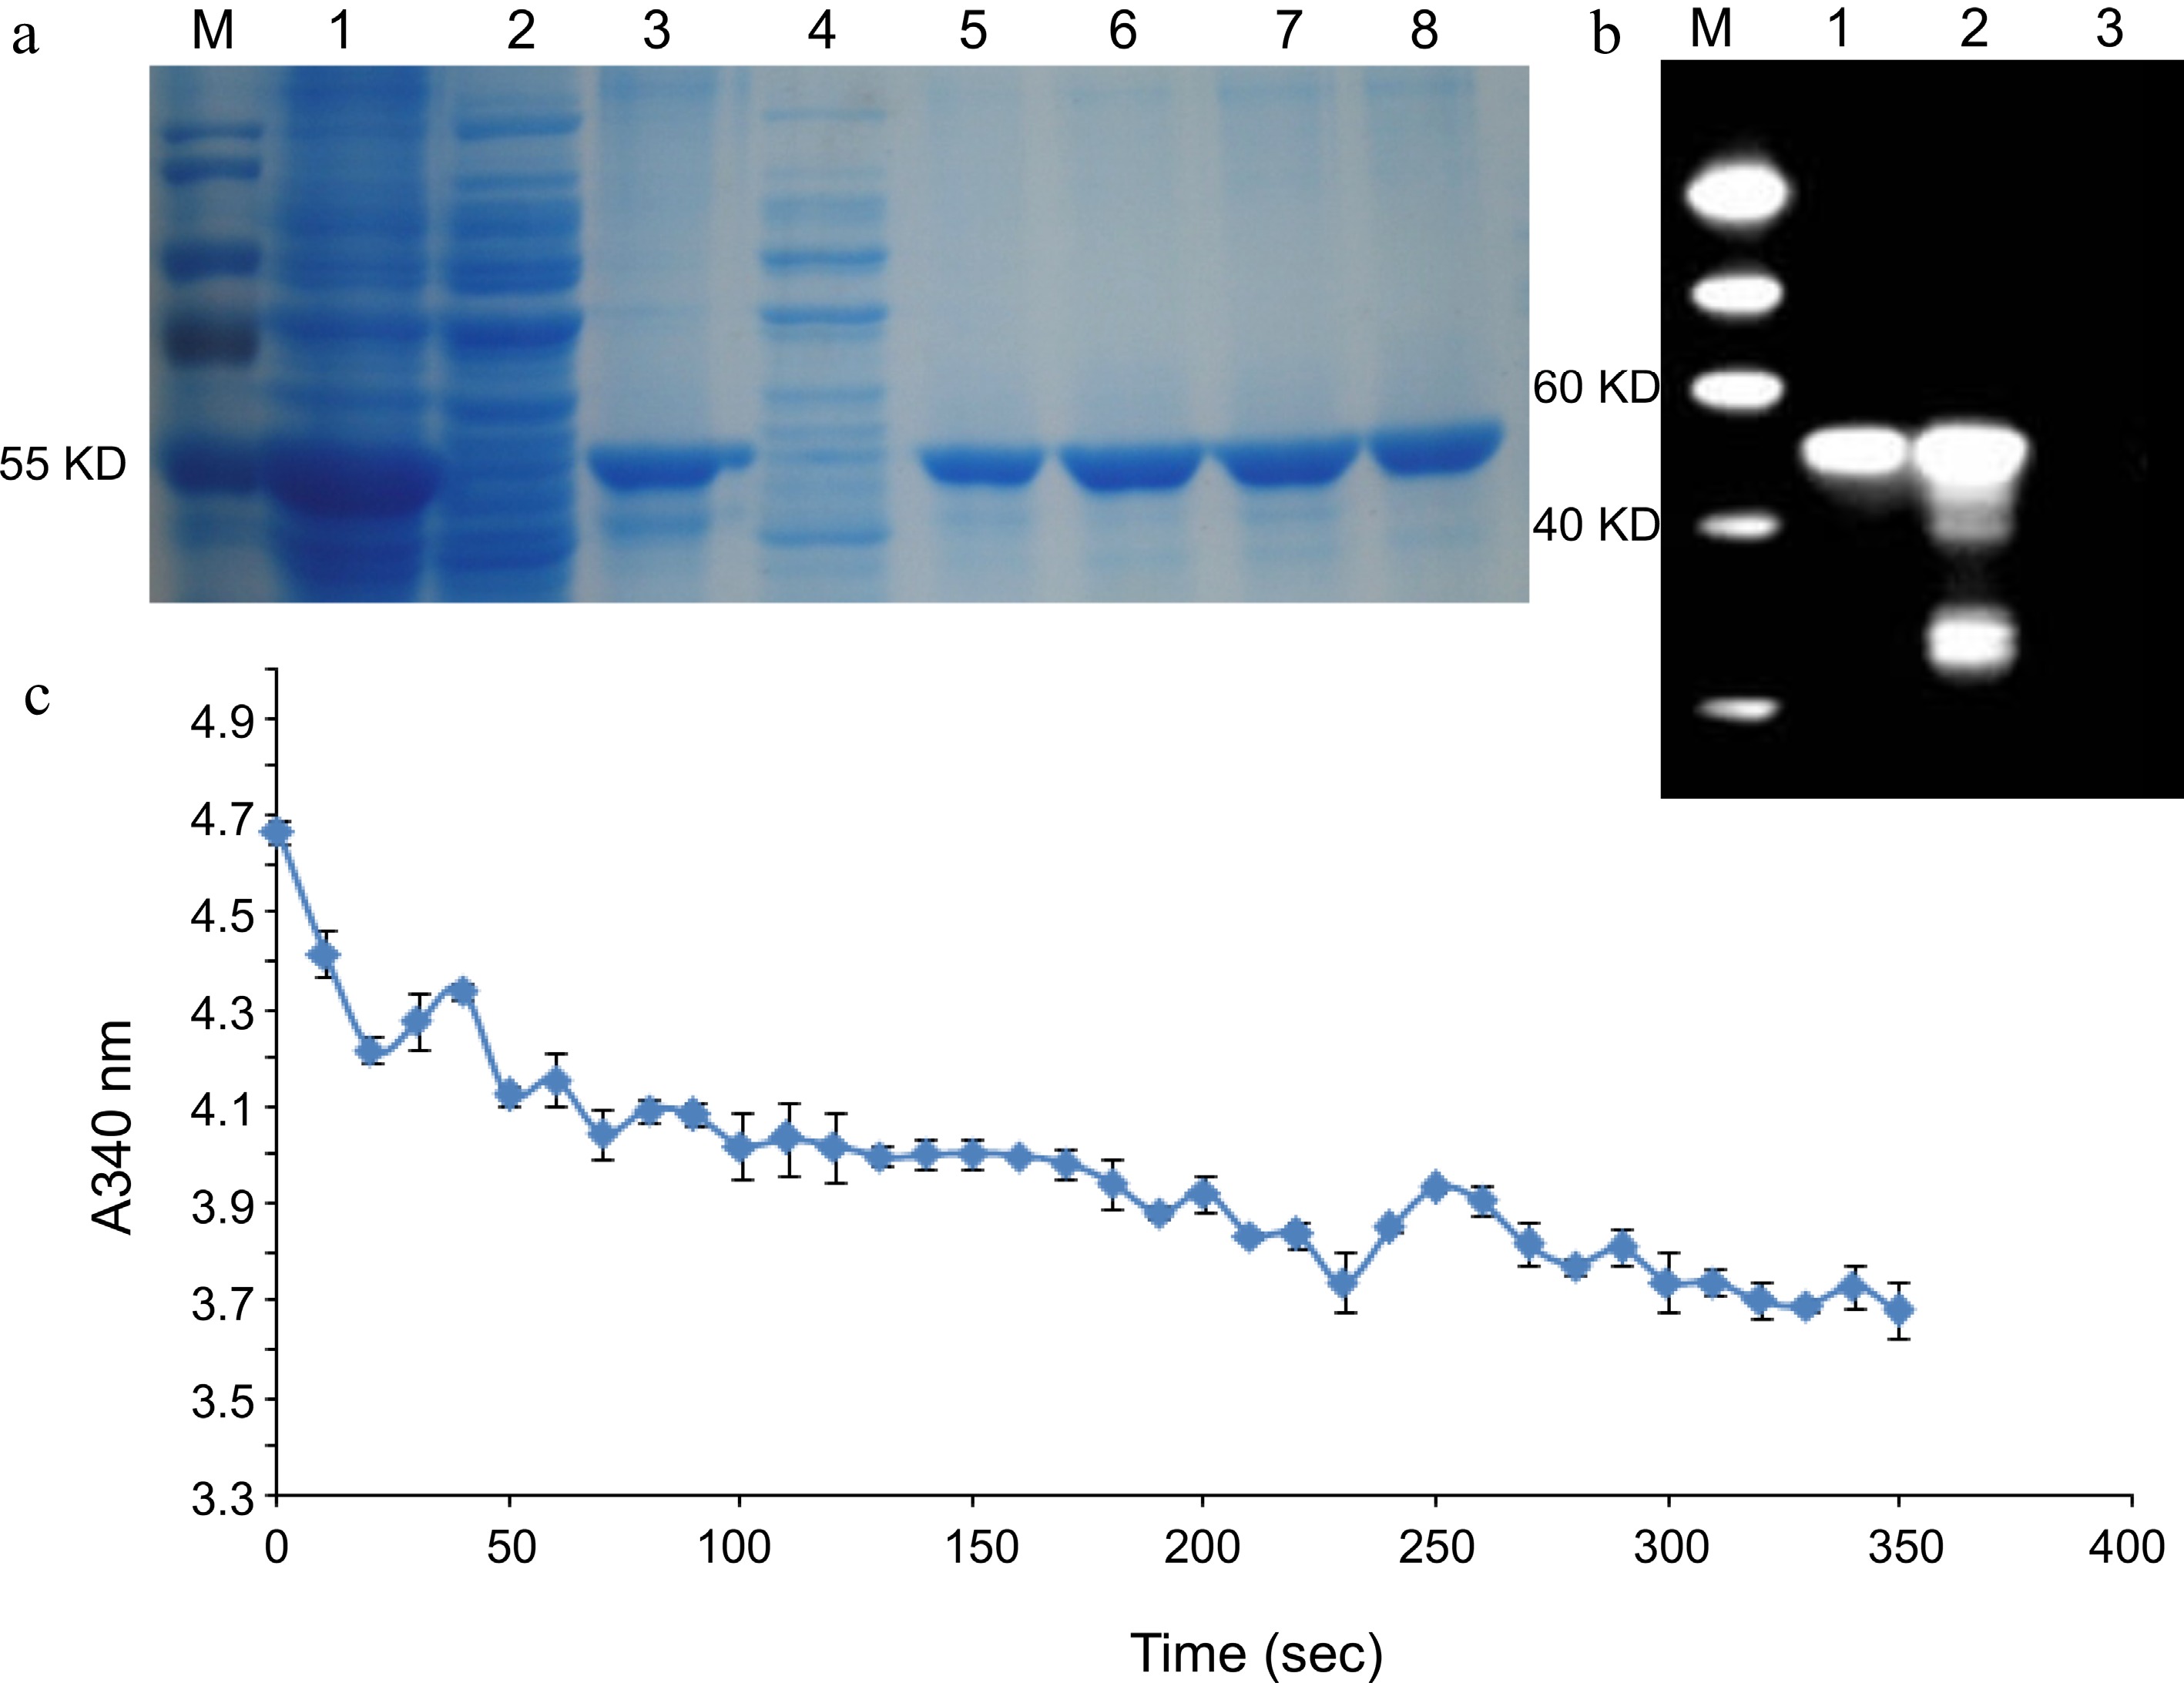
Figure 3.
Enzyme activity of LcDXR. (a) SDS-PAGE analysis of recombination protein with His tag. M: Protein Marker, 1: Insoluble protein before purified, 2: Cell lysate supernatant, 3: Transmission fluid, 4: Washing fluid, 5−8: Elution fluid with protein. (b) Western blot analysis of recombinant LcDXR protein. M: Protein Marker, 1: The inclusion protein, 2: Total protein induced in pET–LcDXR2/Arctic Express, 3: Washing fluid. (c) Enzyme activity assay of recombinant LcDXR. NADPH has a robust ultraviolet absorption peak at A340 and NADP+ does not, while the light absorption value of NADPH at A340 decreases during the catalytic reaction. Data represent the mean ± SEs of three biological replicates.
-
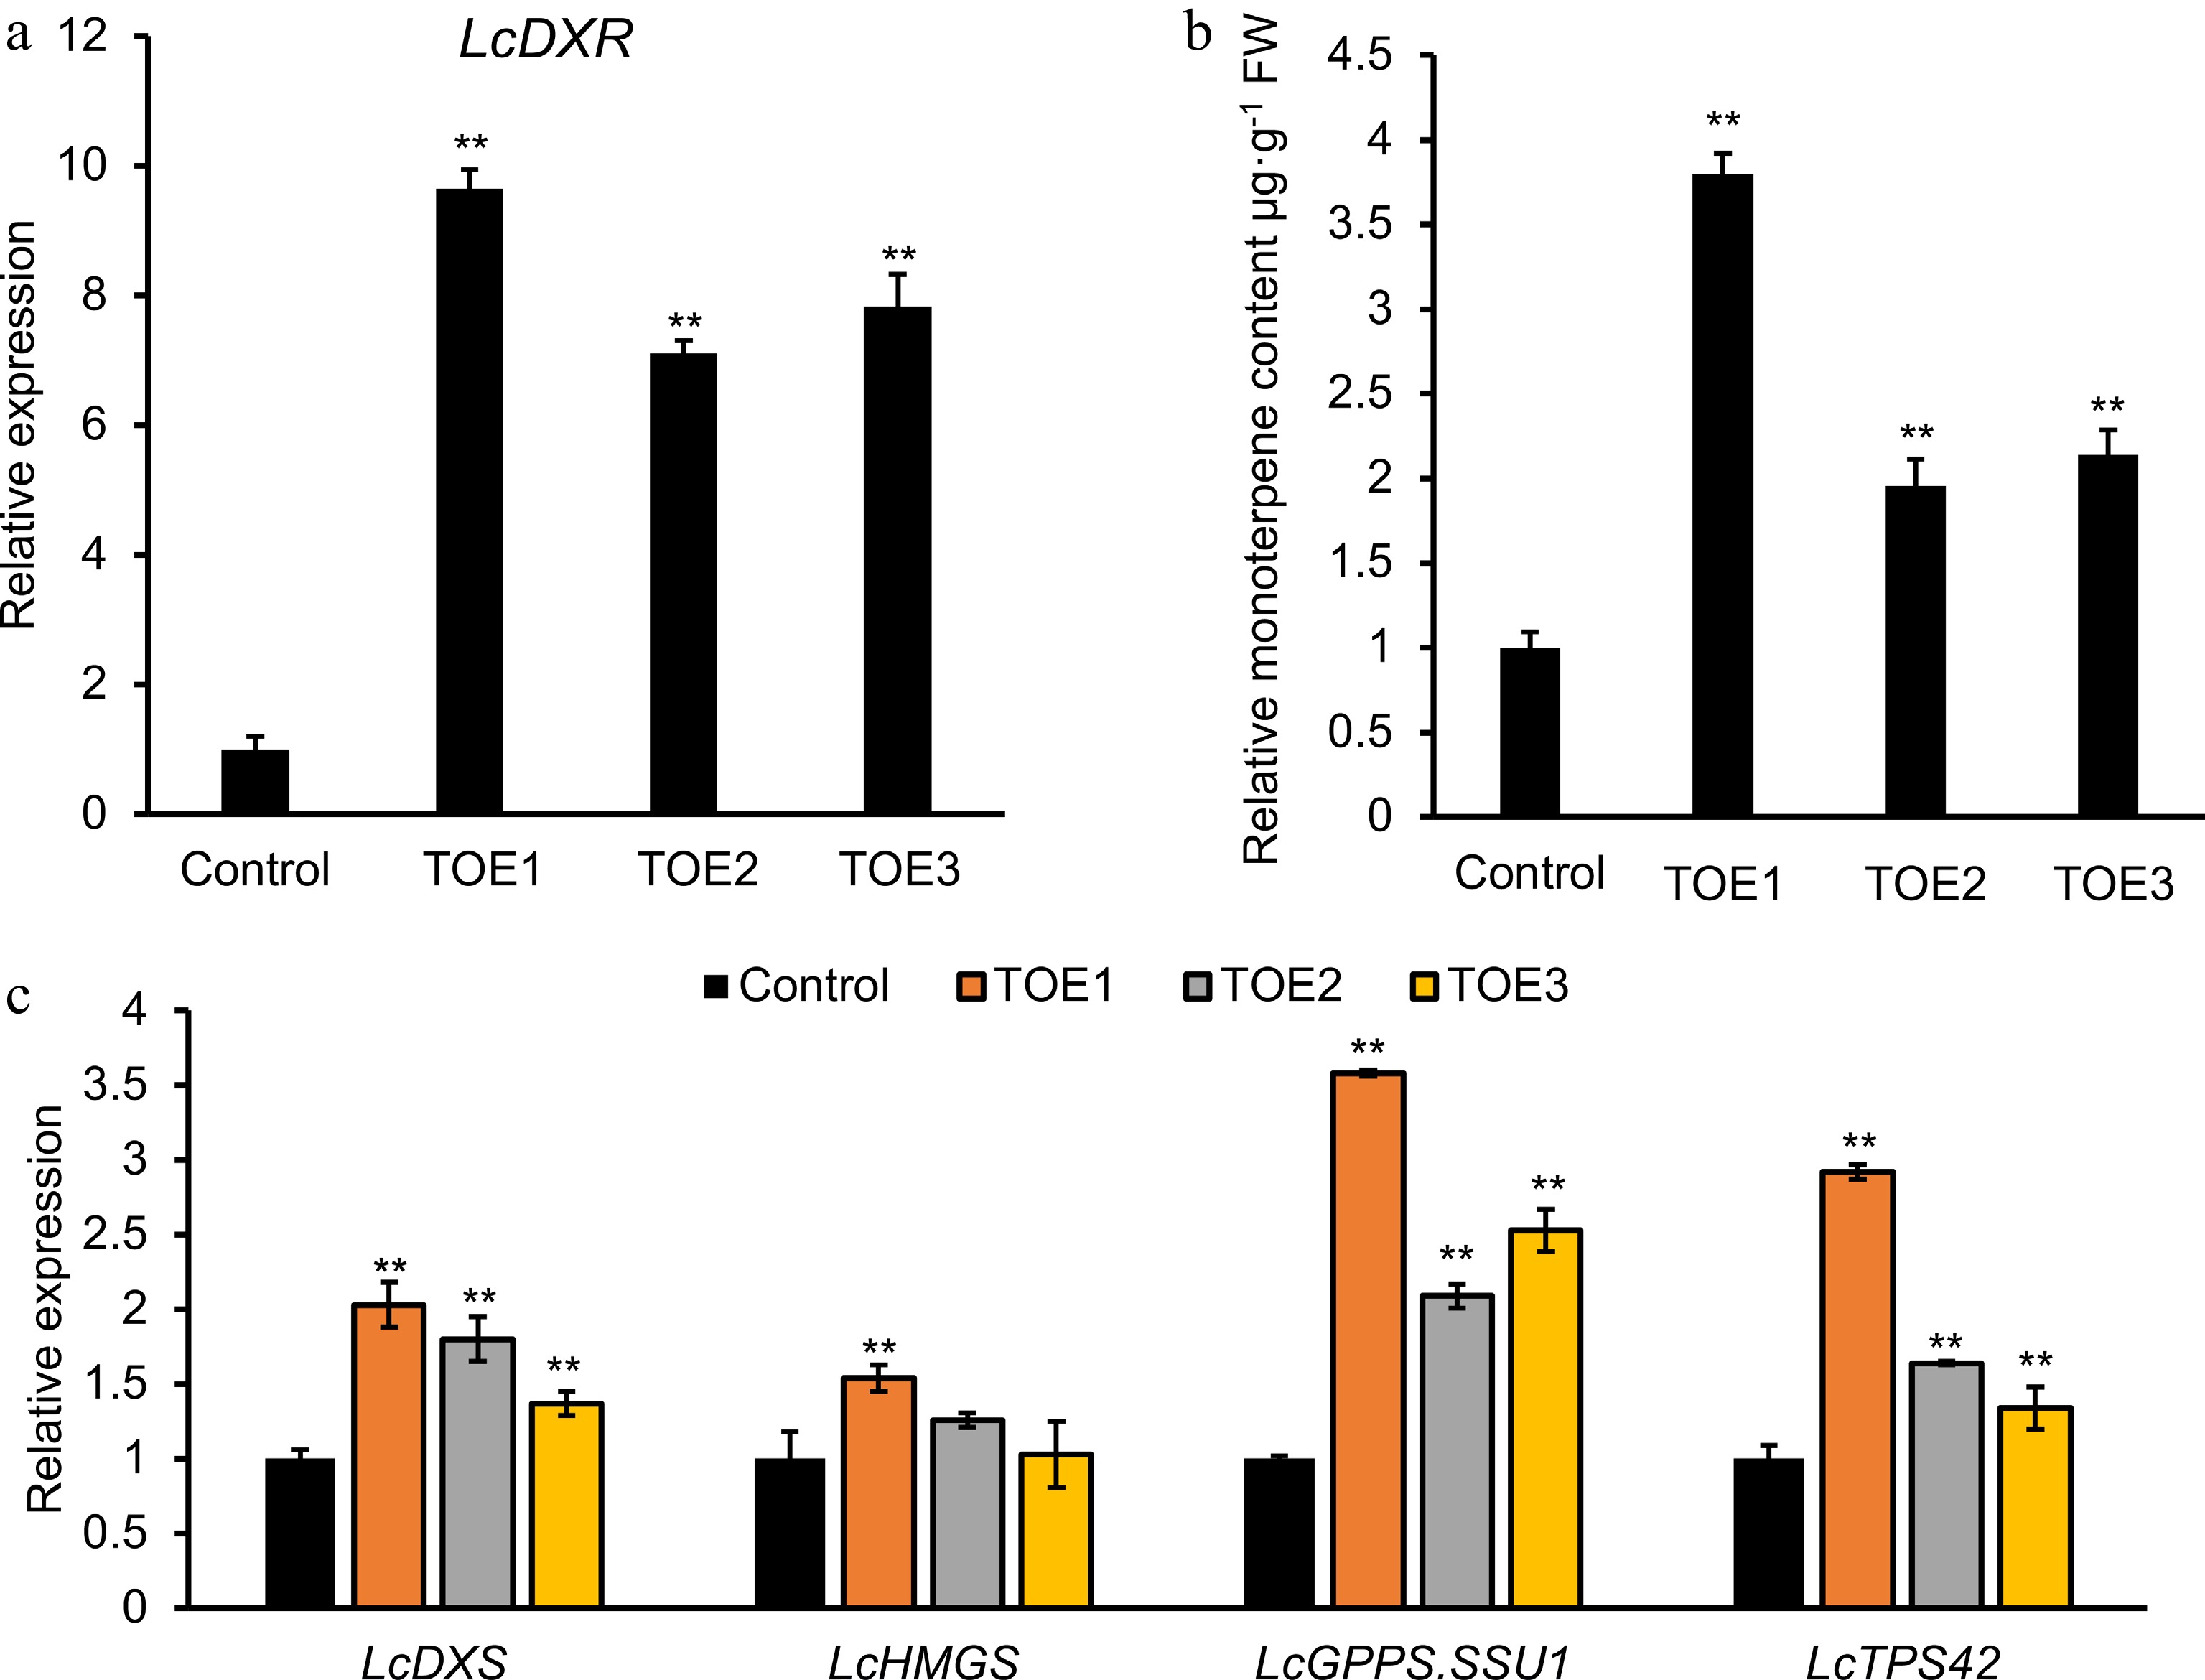
Figure 4.
Transient overexpression of LcDXR in L. cubeba leaves. Leaves were infiltrated with LcDXR under the control of the Cauliflower mosaic virus 35S promoter, and three independent transient overexpression lines (TOE) 1-3 were conducted and grown for 2 d, respectively. (a) Relative expression level of LcDXR in transient overexpressed L. cubeba. (b) The content of monoterpenes in LcDXR transient overexpressed L. cubeba. (c) Relative expression level of key genes involved in MVA and MEP pathway in LcDXR transient overexpressed L. cubeba. Data represent the mean ± SEs of three biological replicates. **, P < 0.01.
-
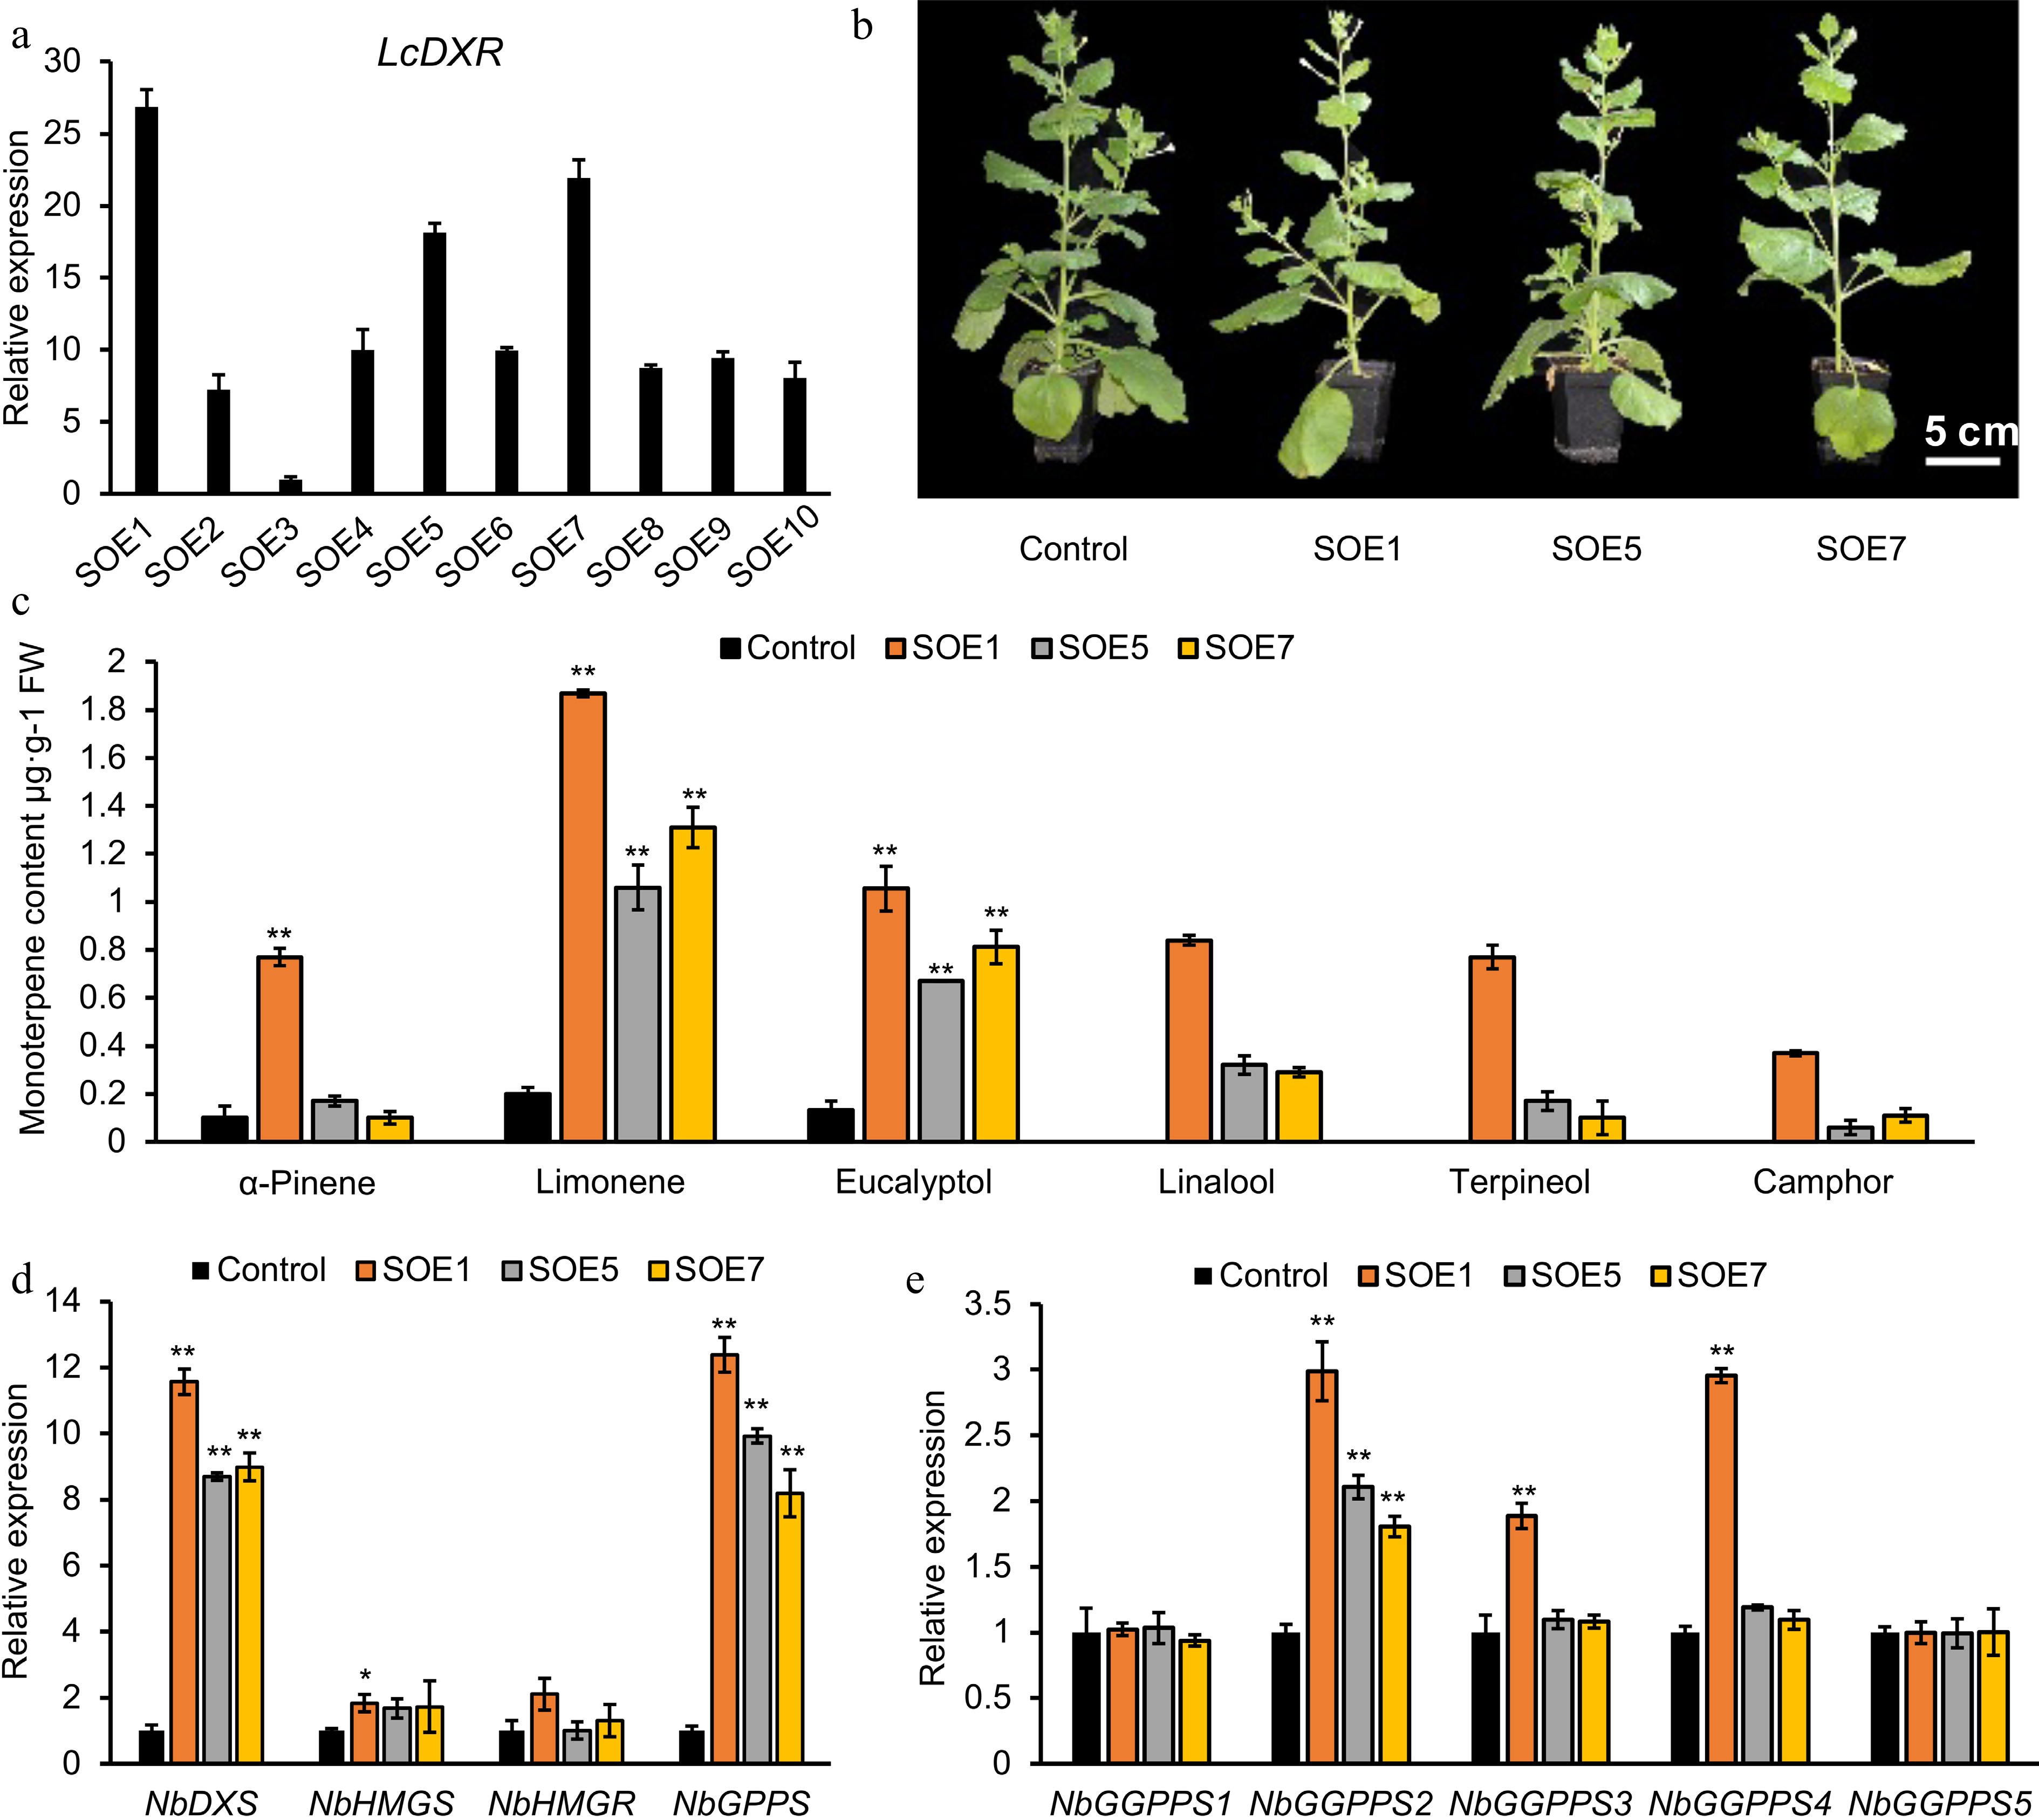
Figure 5.
Monoterpene production was increased by overexpression of LcDXR in transgenic tobacco. (a) Relative expression of LcDXR in ten independent stable overexpression lines (SOE), respectively. (b) The content of monoterpenes in LcDXR transgenic tobacco. (c) Different compounds of monoterpenes in transgenic tobacco. (d) Relative expression levels of key genes involved in MVA and MEP pathway. Data represent the mean ± SEs of three biological replicates. *, P < 0.05; **, P < 0.01.
Figures
(5)
Tables
(0)