-
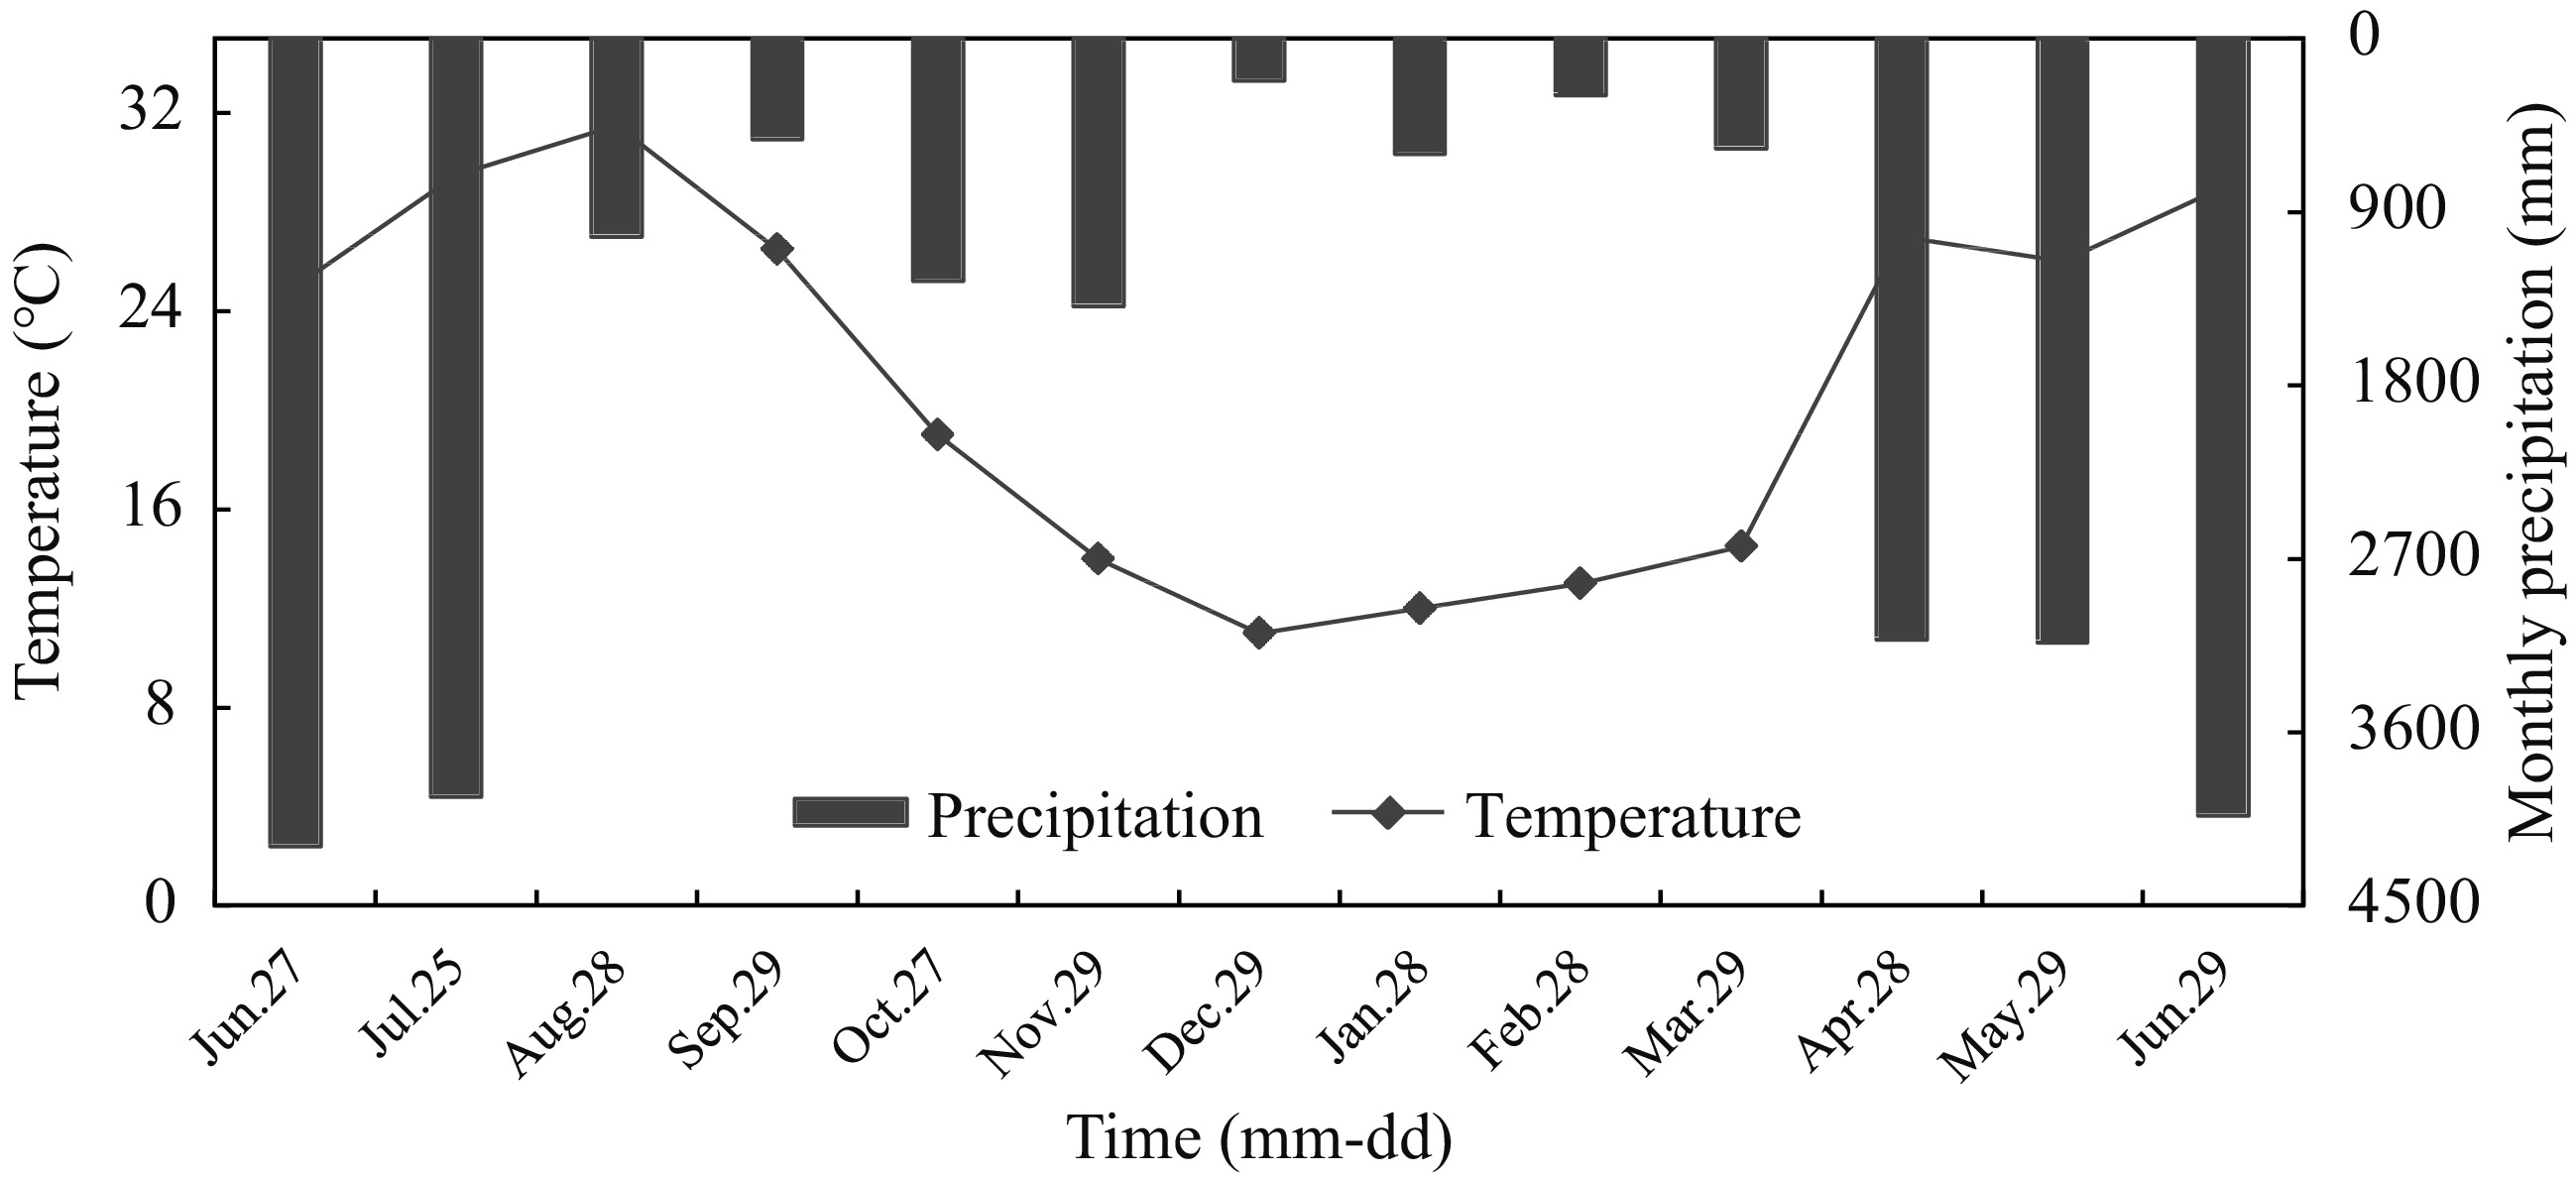
Figure 1.
Temporal variation of environmental temperature and precipitation at the experimental sites.
-
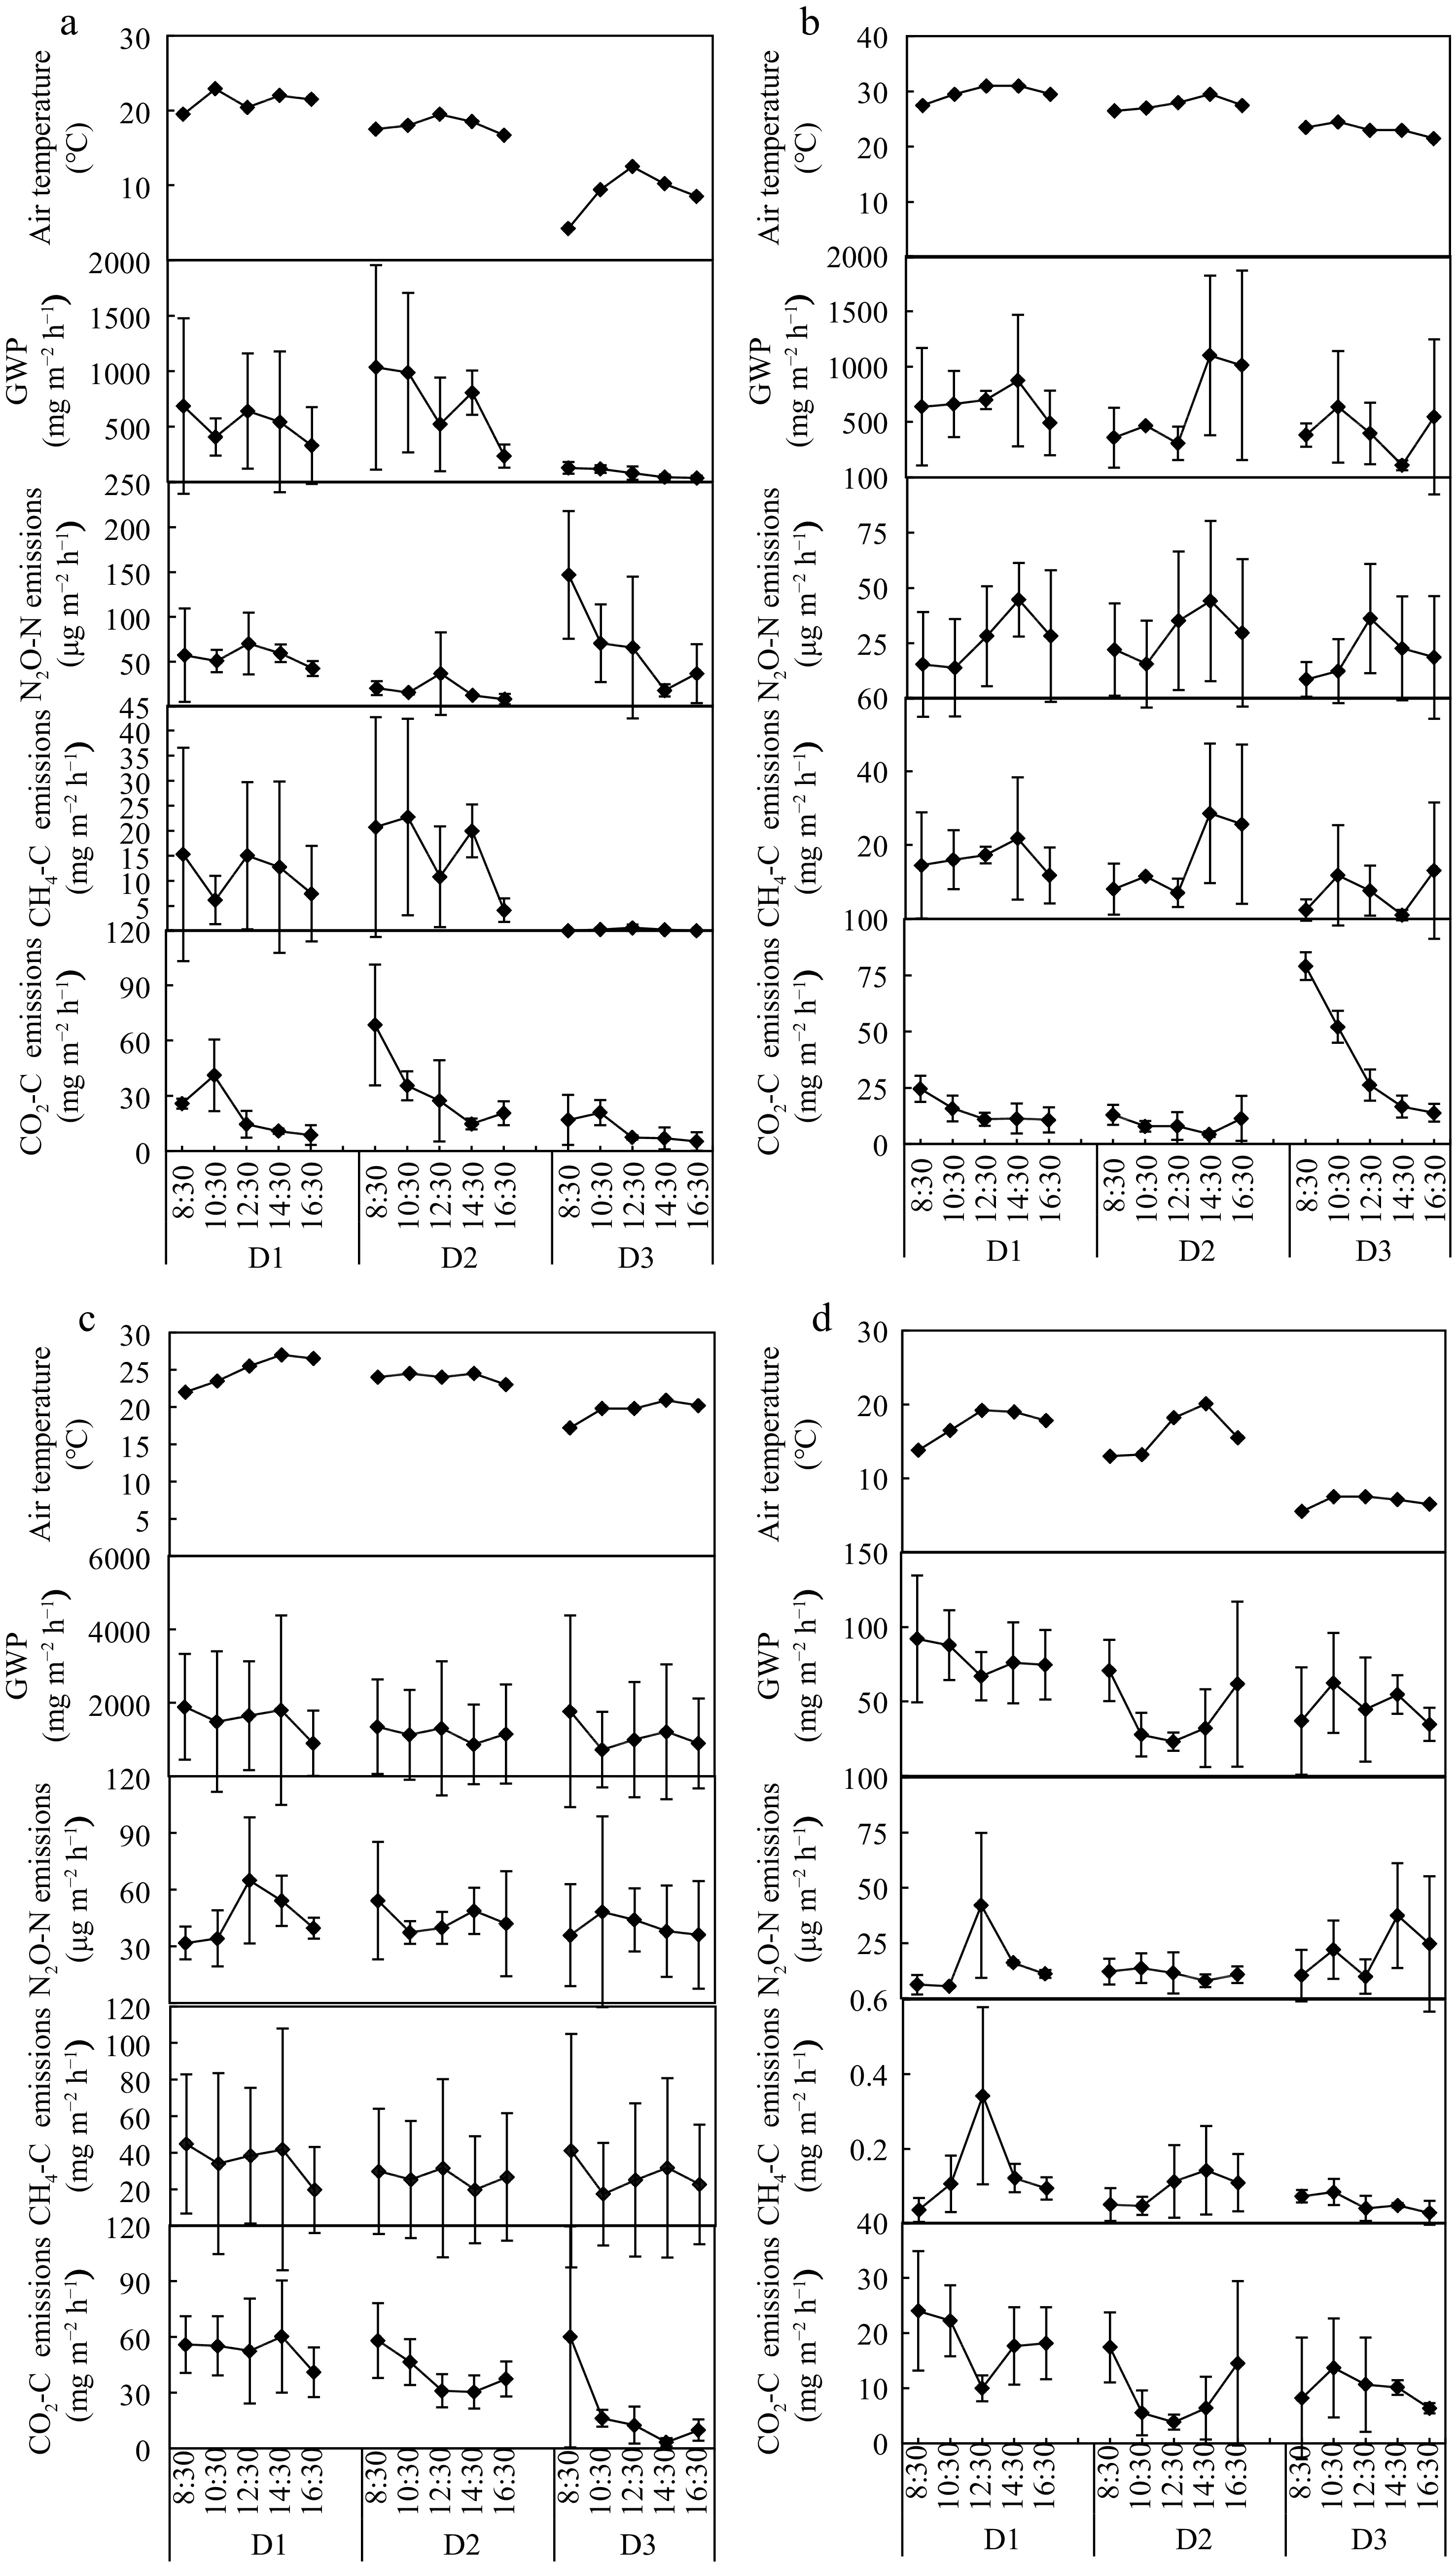
Figure 2.
Diurnal variation of CO2, CH4 and N2O fluxes for (a) CWIA, (b) CWEA, (c) EWIA, (d) NW. D1, D2 and D3 for CWIA were October 16, November 3 and December 9 with daily mean temperature ranging from 21.3 to 9.0 °C; D1, D2 and D3 for CWEA were September 4, September 7, and September 22 with temperatures ranging from 29.7 to 23.1 °C; D1, D2 and D3 for EWIA were September 21, September 22, and October 14 with temperatures ranging from 24.9 to 19.6 °C; D1, D2 and D3 for NW were November 4, November 20, and December 11 with temperatures ranging from 17.6 to 8.4 °C. GWP, the global warming potential.
-
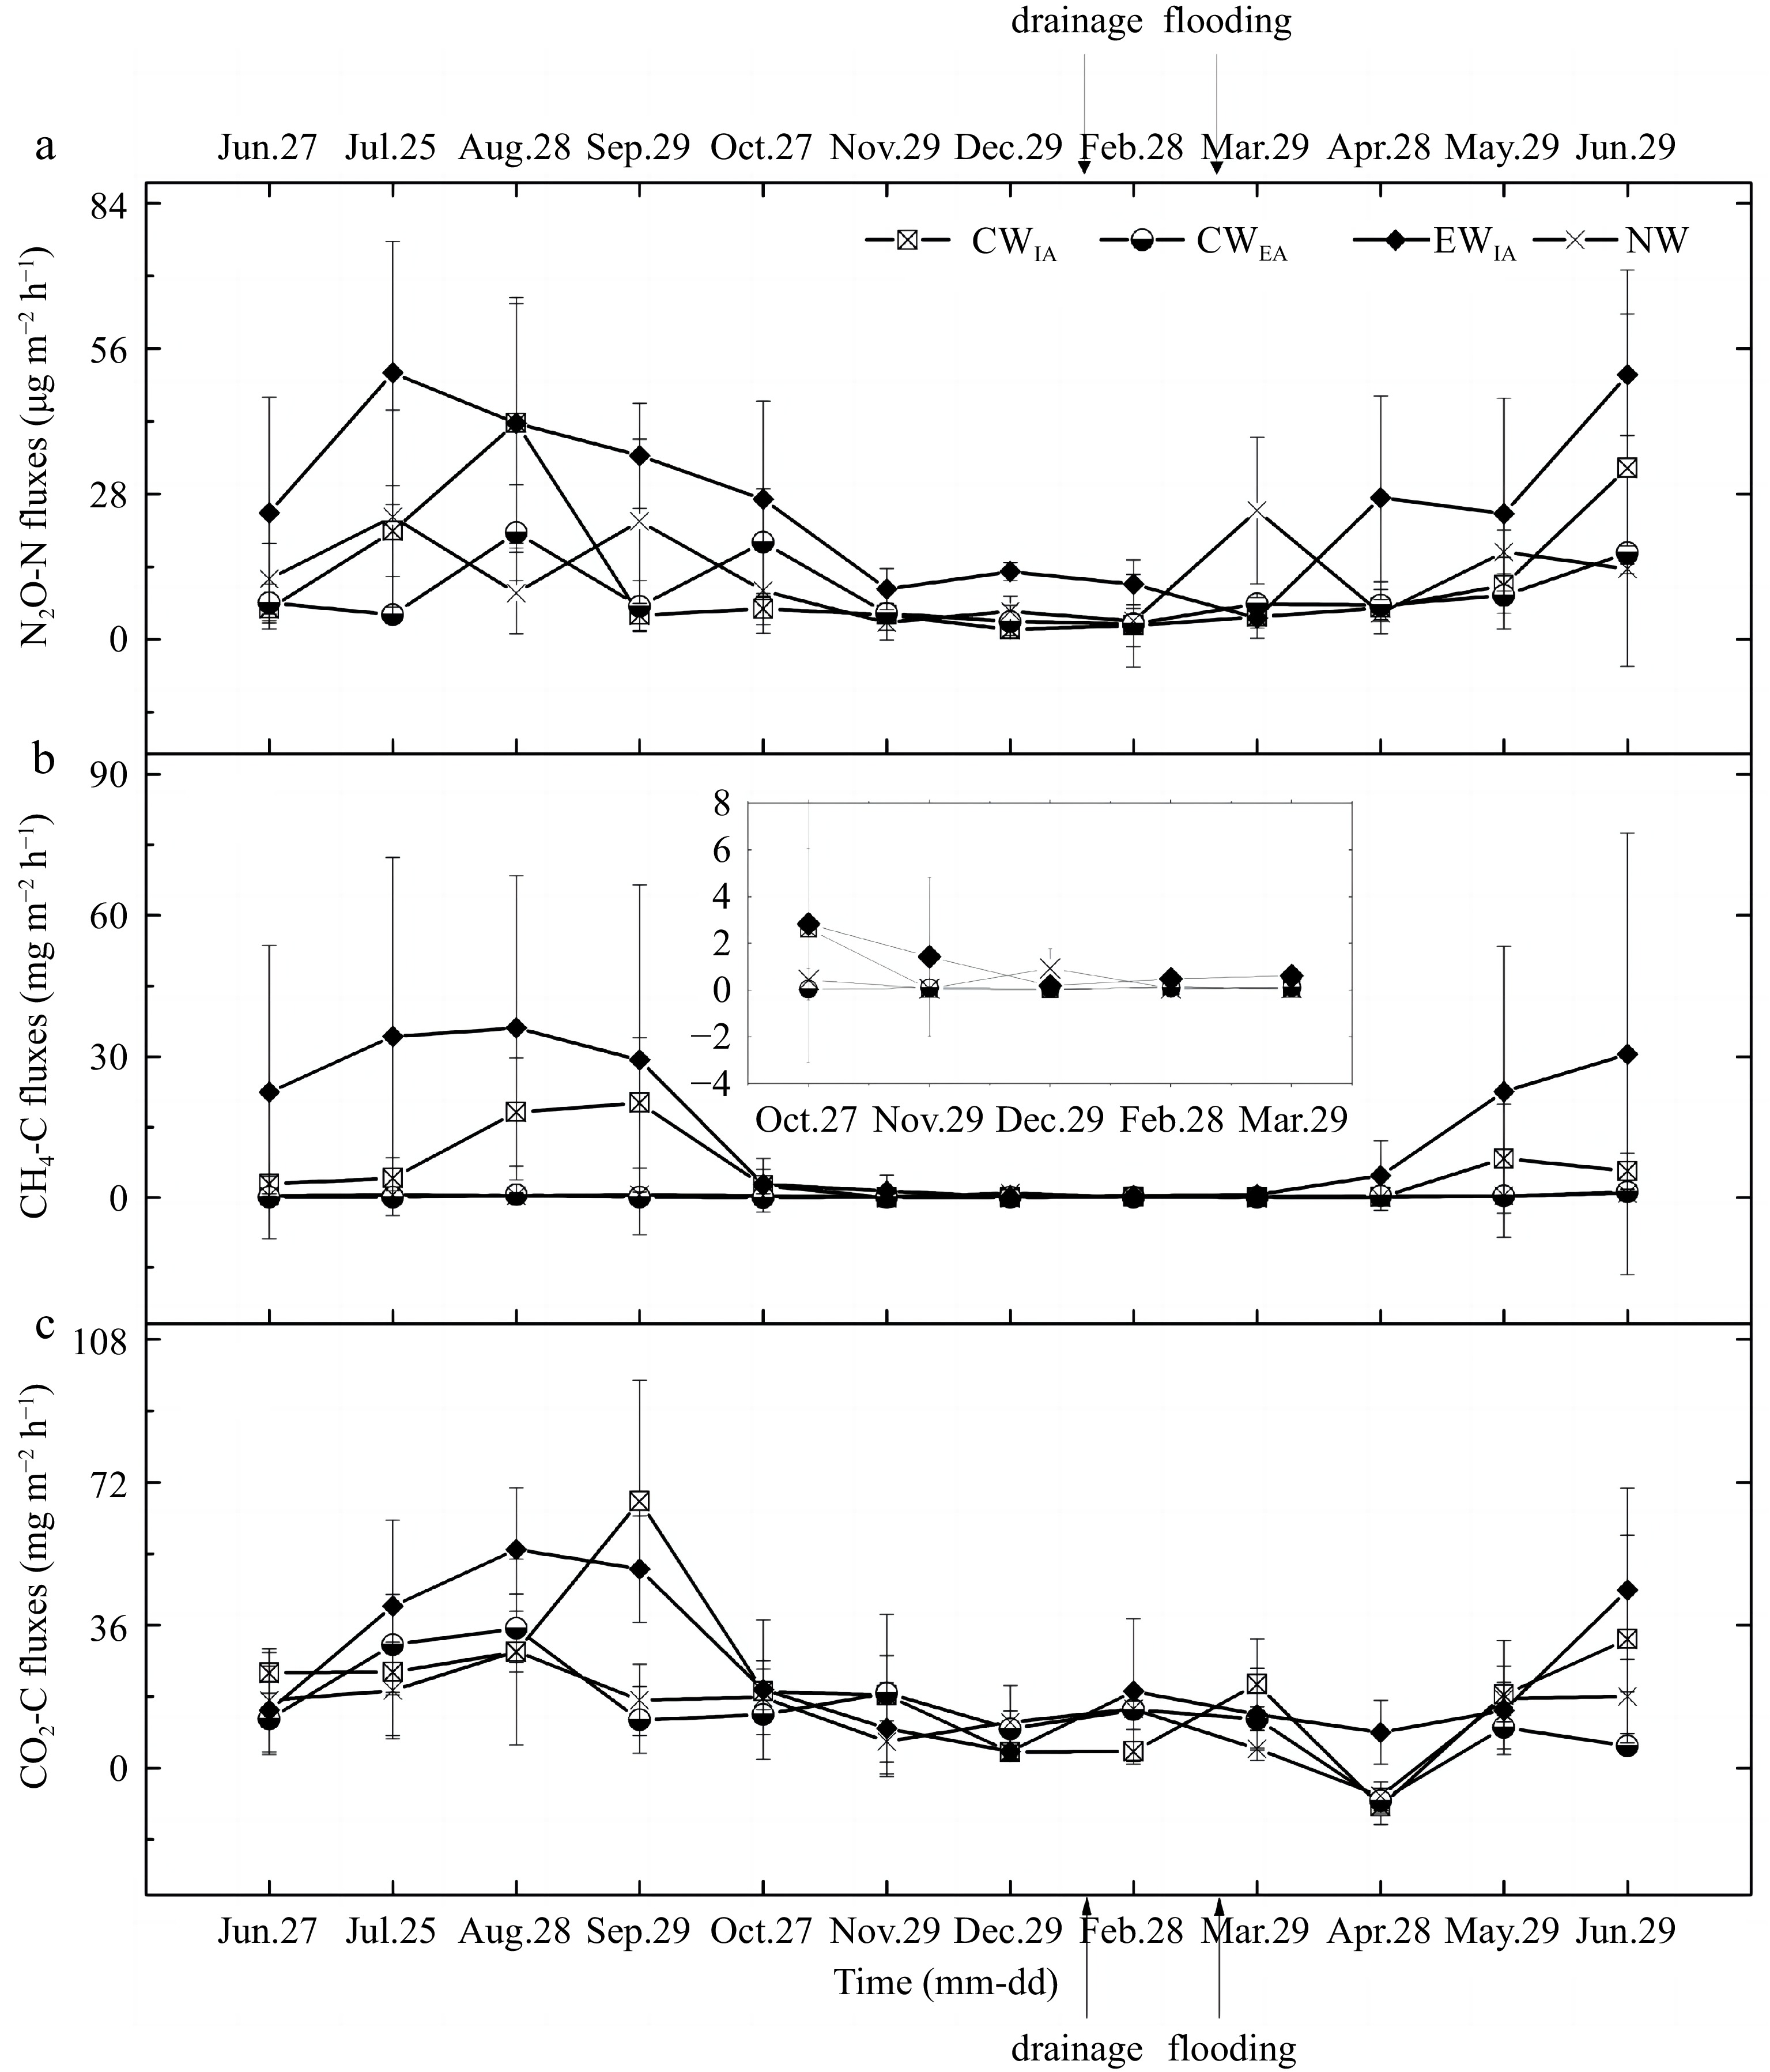
Figure 3.
Seasonal GHG emission dynamics of (a) N2O, (b) CH4 and (c) CO2 fluxes for different wetlands. The management practices of drainage and flooding occurred only to the sites of CWIA, CWEA and EWIA.
-
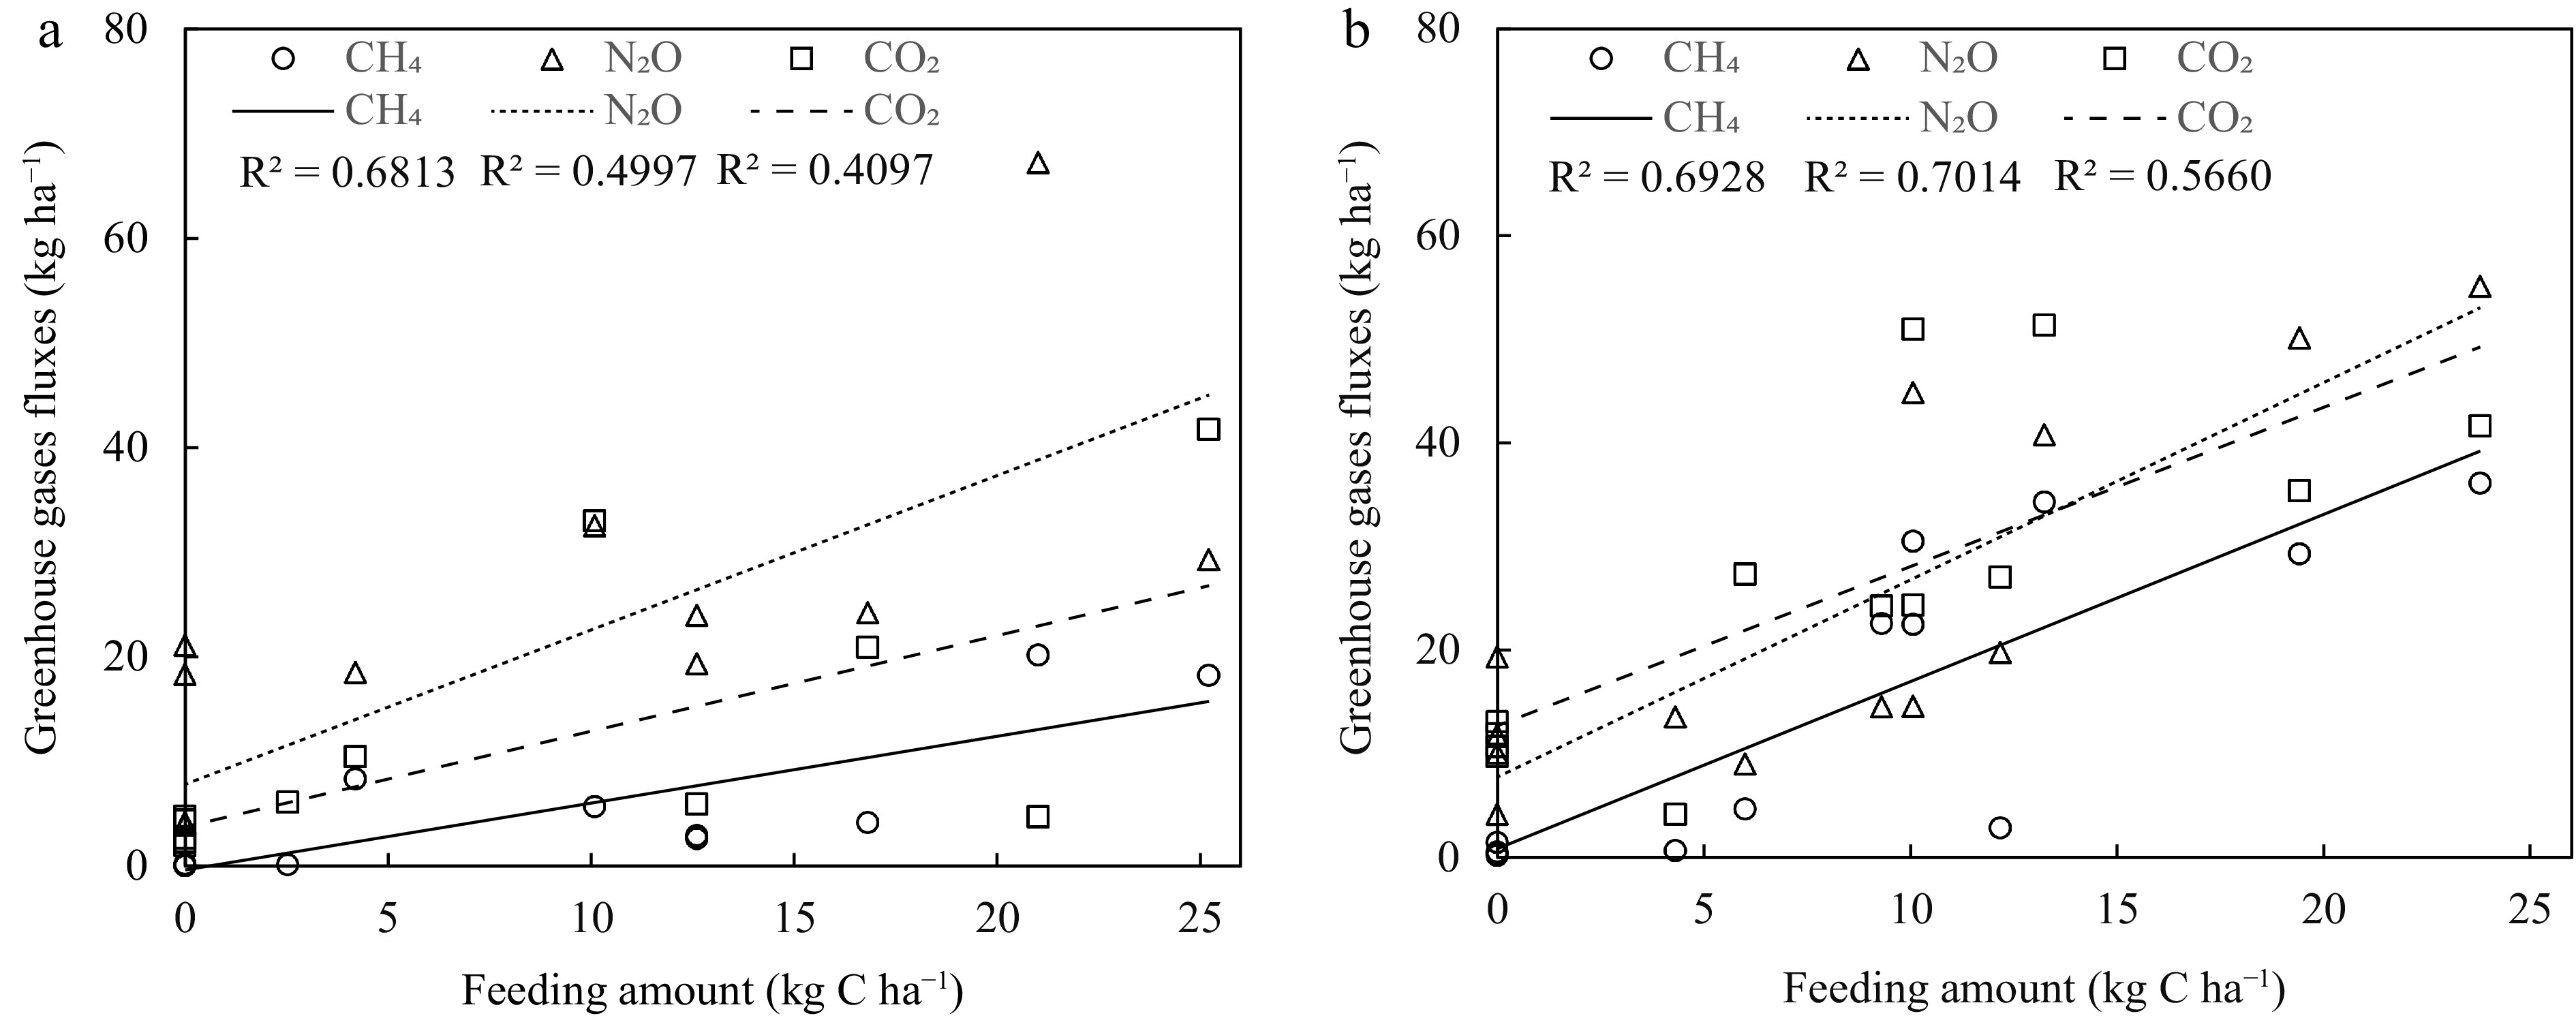
Figure 4.
Dependence of CO2, CH4 and N2O fluxes on feeding amount at the sites of (a) CWIA and (b) EWIA.
-
Sites Origin Area Water table Location Feed Forage content Yield (hm2) m Longitude Latitude Total C
(g kg−1)Total N
(g kg−1)C/N* t ha−1 year−1 NW A natural lake 1,000 3−9 30.67° 117.52° NA NA NA NA / EWIA Wetland shifted to aquatic production 53 2−4 30.64° 117.46° Fed on forage from March to October 127.12 ± 7.41 77.85 ± 2.03 1.6:1 11.32 CWEA Paddy converted constructed wetland with 2 1 30.73° 117.58° Fed on wheat grain or grass or fertilizer irregularly 5.00 CWIA Paddy converted constructed wetlands with intensive aquaculture 2 1−2 30.66° 117.50° Fed on forage from April to October 151.31 ± 2.80 72.39 ± 1.29 2.1:1 7.50 * C/N represented the carbon-nitrogen ratio. Table 1.
Basic information of the four experimental sites.
-
Sites Cumulative emission GHG emission intensity per kg product N2O-N (kg ha−1) CH4-C (kg ha−1) CO2-C (kg ha−1) N2O (g kg−1) CH4 (kg kg−1) Total (kg CO2-eq kg−1) CWIA 1.06 ± 0.20 457.08 ± 161.20 1,877.04 ± 527.95 0.22 0.10 3.25 CWEA 0.81 ± 0.12 23.83 ± 7.80 1321.32 ± 91.11 0.25 0.01 1.21 EWIA 2.43 ± 0.20 1,360.27 ± 1552.98 2,246.79 ± 488.23 0.34 0.19 5.30 NW 1.12 ± 0.42 38.29 ± 11.99 1,305.48 ± 216.63 / / / /: represented no data. The values were presented as the mean ± standard deviation. Table 2.
Cumulative CO2, CH4 and N2O fluxes and yield-scaled GHG emission intensity for different wetland systems.
-
Sites GWP Contributions (%) t CO2-eq ha−1 y−1 N2O CH4 CO2 CWIA 24.38 2% 70% 28% CWEA 6.04 6% 14% 80% EWIA 60.02 2% 85% 14% NW 6.67 7% 21% 72% Table 3.
Global warming potentials and their contributions for different wetland systems.
-
Sites pH $ {\text{NH}^+_4}{\text {-N}}$ ${\text{NO}^-_3}{\text {-N}} $ ${\text{NO}^-_2}{\text {-N}} $ TN (g L−1) DOC (mg L−1) Water quality CWIA 7.52 ± 0.14a 0.60 ± 0.35a 0.57 ± 0.26b 0.48 ± 0.51a 1.93 ± 0.69ab 24.99 ± 8.50ab CWEA 7.39 ± 0.48a 0.46 ± 0.33a 0.36 ± 0.12b 0.10 ± 0.16ab 1.30 ± 0.52bc 21.83 ± 7.67ab EWIA 7.50 ± 0.28a 0.66 ± 0.61a 1.36 ± 0.56a 0.36 ± 0.49ab 2.07 ± 0.88a 29.93 ± 8.92a NW 7.57 ± 0.29a 0.25 ± 0.20a 0.28 ± 0.08b 0.03 ± 0.03b 0.66 ± 0.23c 20.01 ± 7.71b Sites pH $ {\text{NH}^+_4}{\text {-N}}\;{\rm{ (mg\; kg^{−1})}} $ $ {\text{NO}^-_3}{\text {-N}}\;{\rm{ (mg\; kg^{−1})}} $ SOM (g kg−1) TN (g kg−1) C/N Sediment quality CWIA 6.81 ± 0.13a 36.67 ± 4.32b 273.70 ± 185.08a 39.69 ± 2.75ab 2.95 ± 0.18ab 7.81 ± 0.51ab CWEA 6.22 ± 0.18b 33.21 ± 6.39b 54.57 ± 20.31a 39.66 ± 4.16ab 2.68 ± 0.19b 8.58 ± 0.42a EWIA 6.59 ± 0.29a 203.22 ± 16.08a 251.03 ± 263.67a 44.00 ± 1.15a 3.34 ± 0.06a 7.46 ± 0.19b NW 6.58 ± 0.14a 27.86 ± 5.07b 21.23 ± 5.10a 35.78 ± 4.09b 2.91 ± 0.47ab 7.00 ± 0.73b TN, DOC, SOM and C/N represented total nitrogen, dissolved organic carbon, soil organic matter and carbon : nitrogen ratio, respectively. Table 4.
Water and sediment qualities at the four experimental sites.
-
Items pH DOC ${\text{NH}^+_4}{\text {-N}} $ ${\text{NO}^-_3}{\text {-N}} $ ${\text{NO}^-_2}{\text {-N}} $ TN Water temperature Correlation CH4 0.11 0.09 0.60** 0.80** −0.17 0.13 0.46* N2O 0.31 0.20 0.37* 0.60** −0.22 0.10 0.55** CO2 0.28 −0.11 0.70** 0.54** −0.23 0.11 0.65** P value CH4 0.574 0.633 0.002 0.000 0.399 0.517 0.014 N2O 0.109 0.299 0.049 0.001 0.249 0.605 0.003 CO2 0.144 0.576 0.000 0.003 0.246 0.575 0.000 * Significant at P < 0.05; ** Significant at P < 0.01. Table 5.
Correlation coefficients between GHGs emission and water parameters in all four wetlands.
-
Location Sources Time horizon Wetland types N2O fluxes CH4 fluxes CO2 fluxes μg m−2 h−1 mg m−2 h−1 mg m−2 h−1 China East China Current study 13 months Constructed wetland for intensive aquaculture 18.65 ± 20.48 6.92 ± 9.41 77.23 ± 68.95 Constructed wetland for extensive aquaculture 14.08 ± 9.58 0.35 ± 0.45 51.21 ± 40.97 Enclosure wetland for intensive aquaculture 41.89 ± 24.83 20.60 ± 19.90 90.34 ± 65.45 Natural wetland 19.50 ± 12.48 0.55 ± 0.41 51.09 ± 33.48 East China Liu et al. (2016) 12 months Rice paddies 110.5 0.71 Crab-fish aquaculture 48.1 0.37 Southeastern China Yang et al. (2015) 5 months Shrimp pond 10.74 19.95 20.78 4 months Shrimp-fish pond 11.8 1.65 −60.46 Lab simulation of aquatic system Hu et al. (2014) 2 months Control 5,504 ± 1,221 2,401 ± 343 Treatment 911 ± 488 4,590 ± 546 Overseas
of Nature wetlandsYangtze estuarine, China Wang et al. (2009) 12 months Marsh site 2.06 Bare tidal flat 0.04 East China Han et al. (2013) 3 months Open river 62.17 ± 2.13 16.41 ± 3.06 162.18 ± 10.55 Canal 111.74 ± 7.41 175.94 ± 18.42 1,082.00 ± 90.53 Reservoir 50.99 ± 2.68 1.70 ± 0.14 25.61 ± 4.08 Northeast China Yang et al. (2013) 3 months Freshwater marsh 13.3 8.92 394.5 India Selvam et al. (2014) 24 h/1−8 h Ponds 11.93 ± 12.33 123.02 ± 117.33 Rivers 4.13 ± 8.27 36.85 ± 70.58 Reservoirs 2.13 ± 2.33 15.40 ± 35.75 Colombia Dennis et al. (2014) 11 months Restored mangrove 162 ± 48 3.47 ± 1.52 97 ± 46 11.78 ± 10.54 747 ± 299 6.12 ± 9.69 Costa Rica Nahlik et al. (2011) 29 months Forested marsh 5.05 Rainforest swamp 33.39 Alluvial marsh 39.94 Australia Allen et al. (2011) 6 months Mangrove 30.00 0.30 Orinoco River Floodplain, Venezuela Smith et al. (2000) 17 months Open river 1.33 Flooded forest 4.67 Macrophyte mats 1.33 Table 6.
Comparison of greenhouse gases fluxes from different wetland types with previous studies in China and other regions.
Figures
(4)
Tables
(6)