-
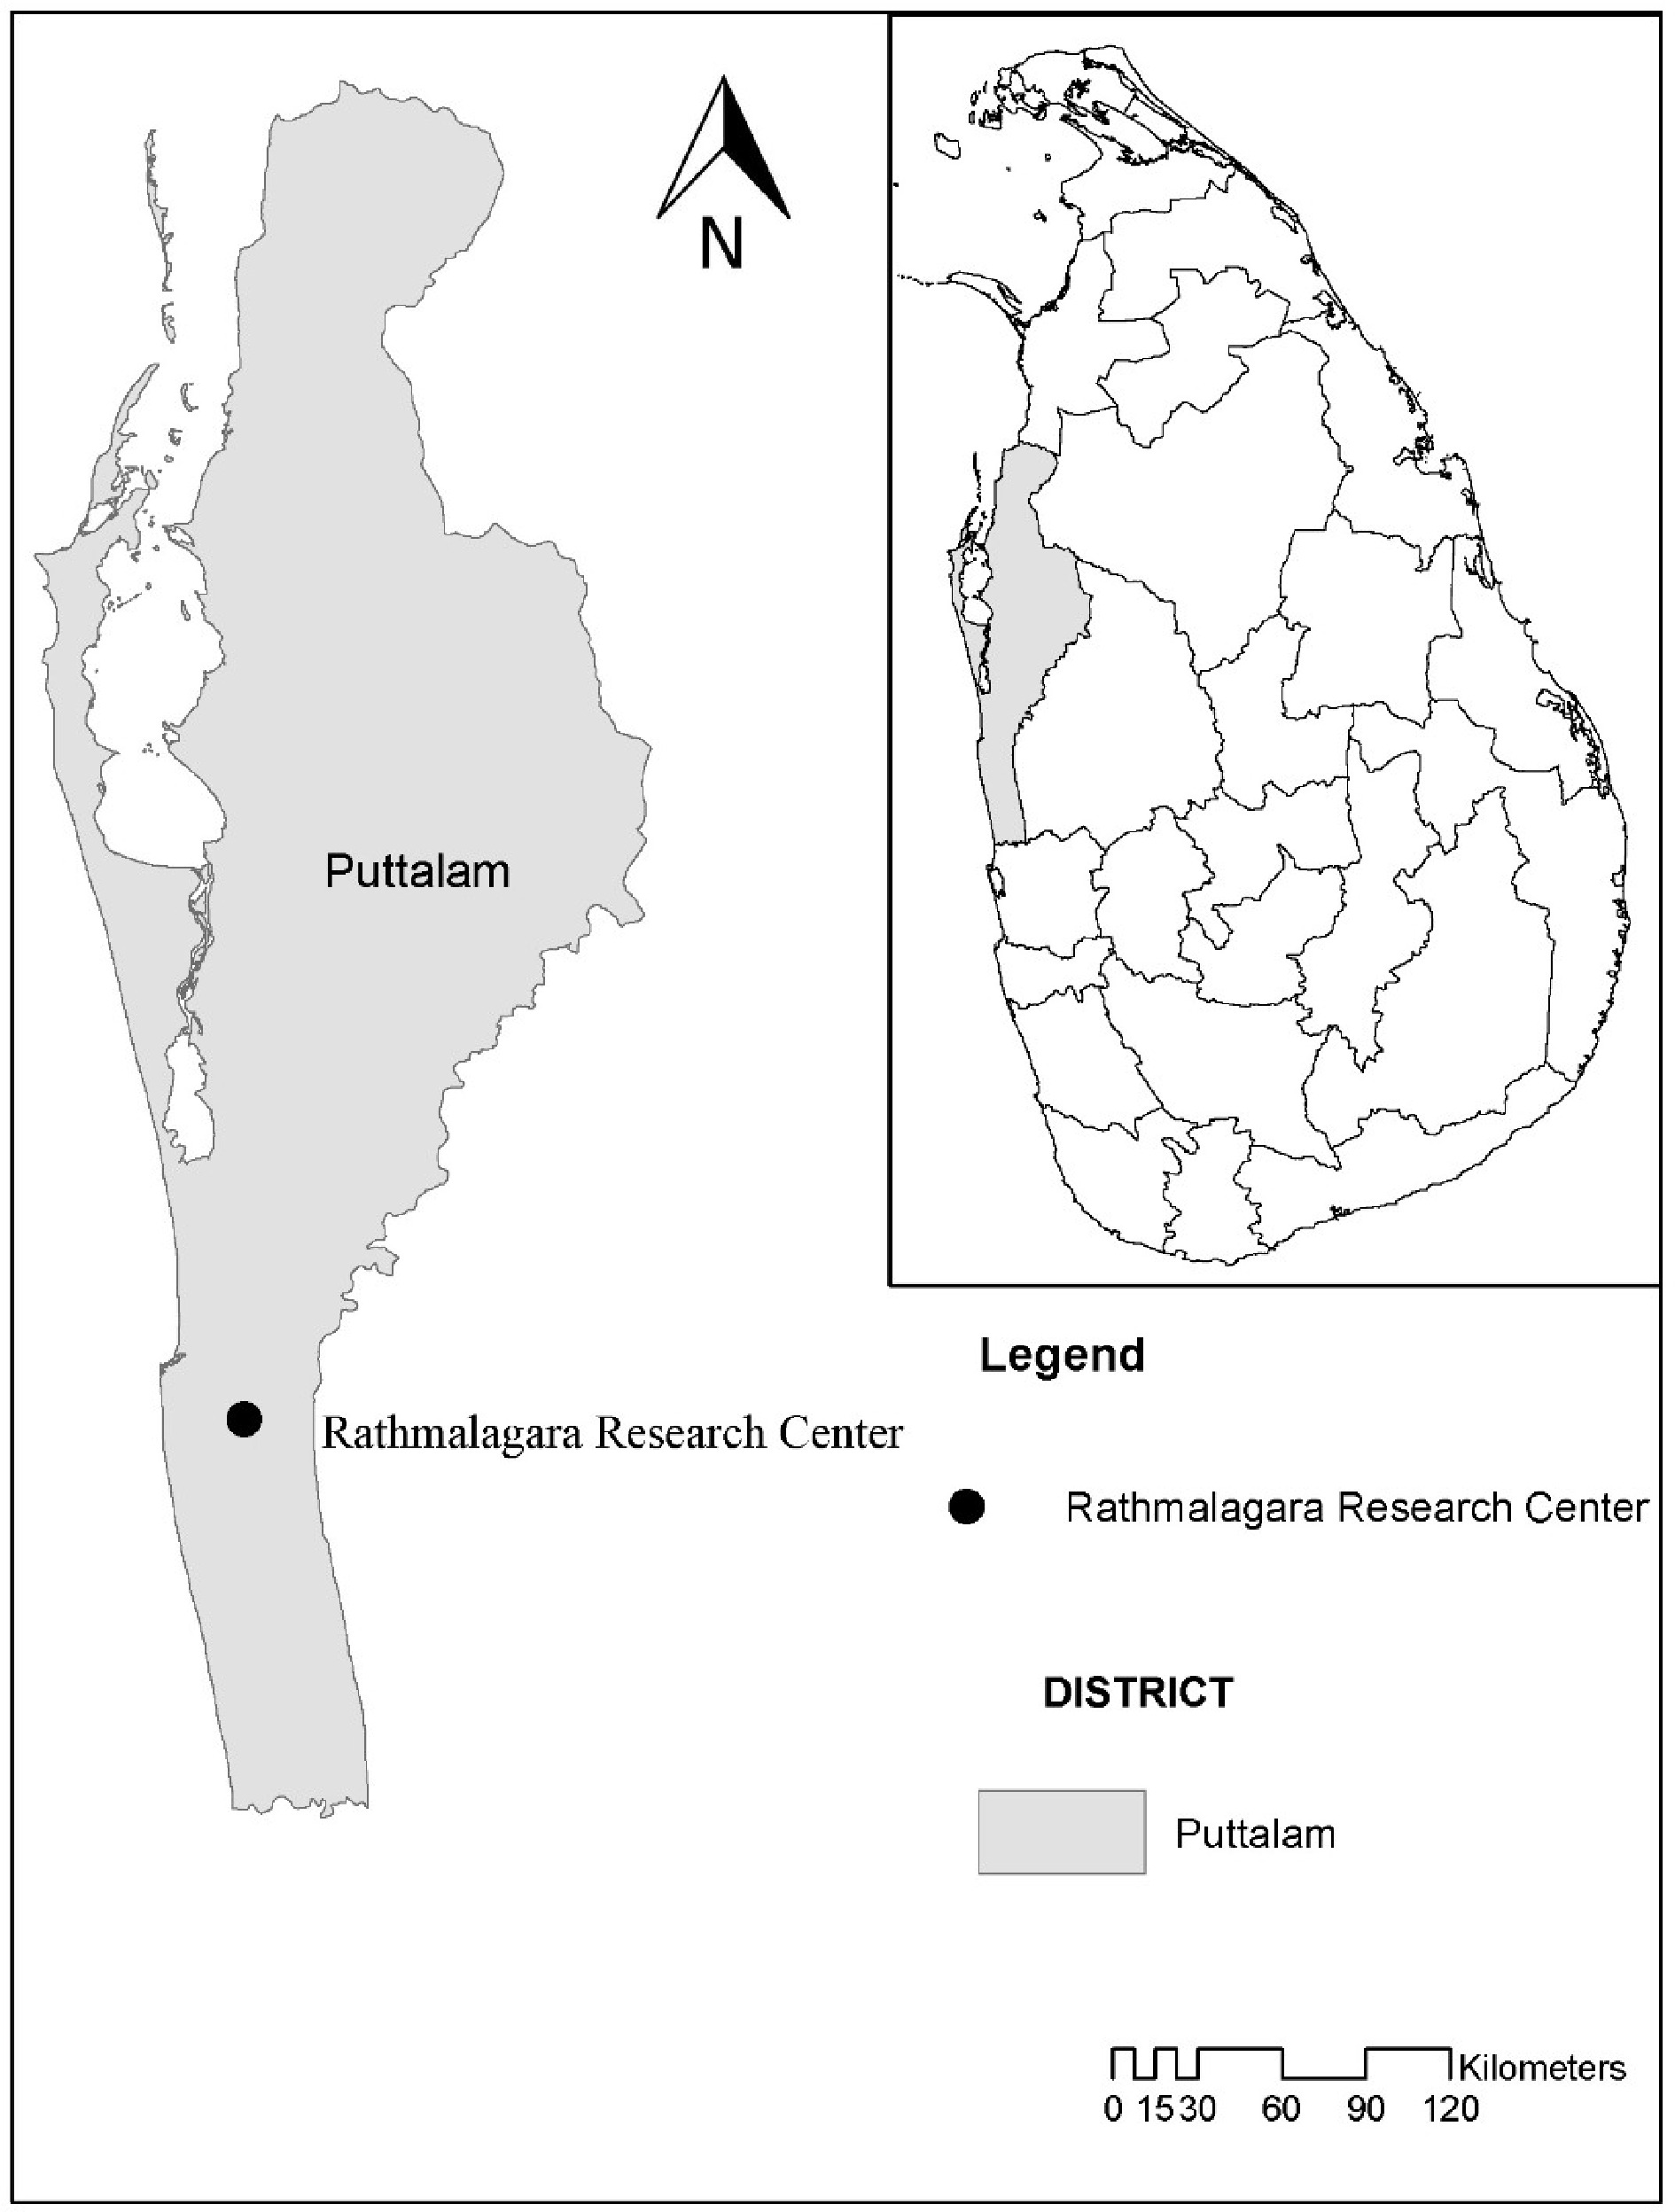
Figure 1.
Map of experiment site: Rathmalagara Research Centre of Coconut Research Institute of Sri Lanka.
-
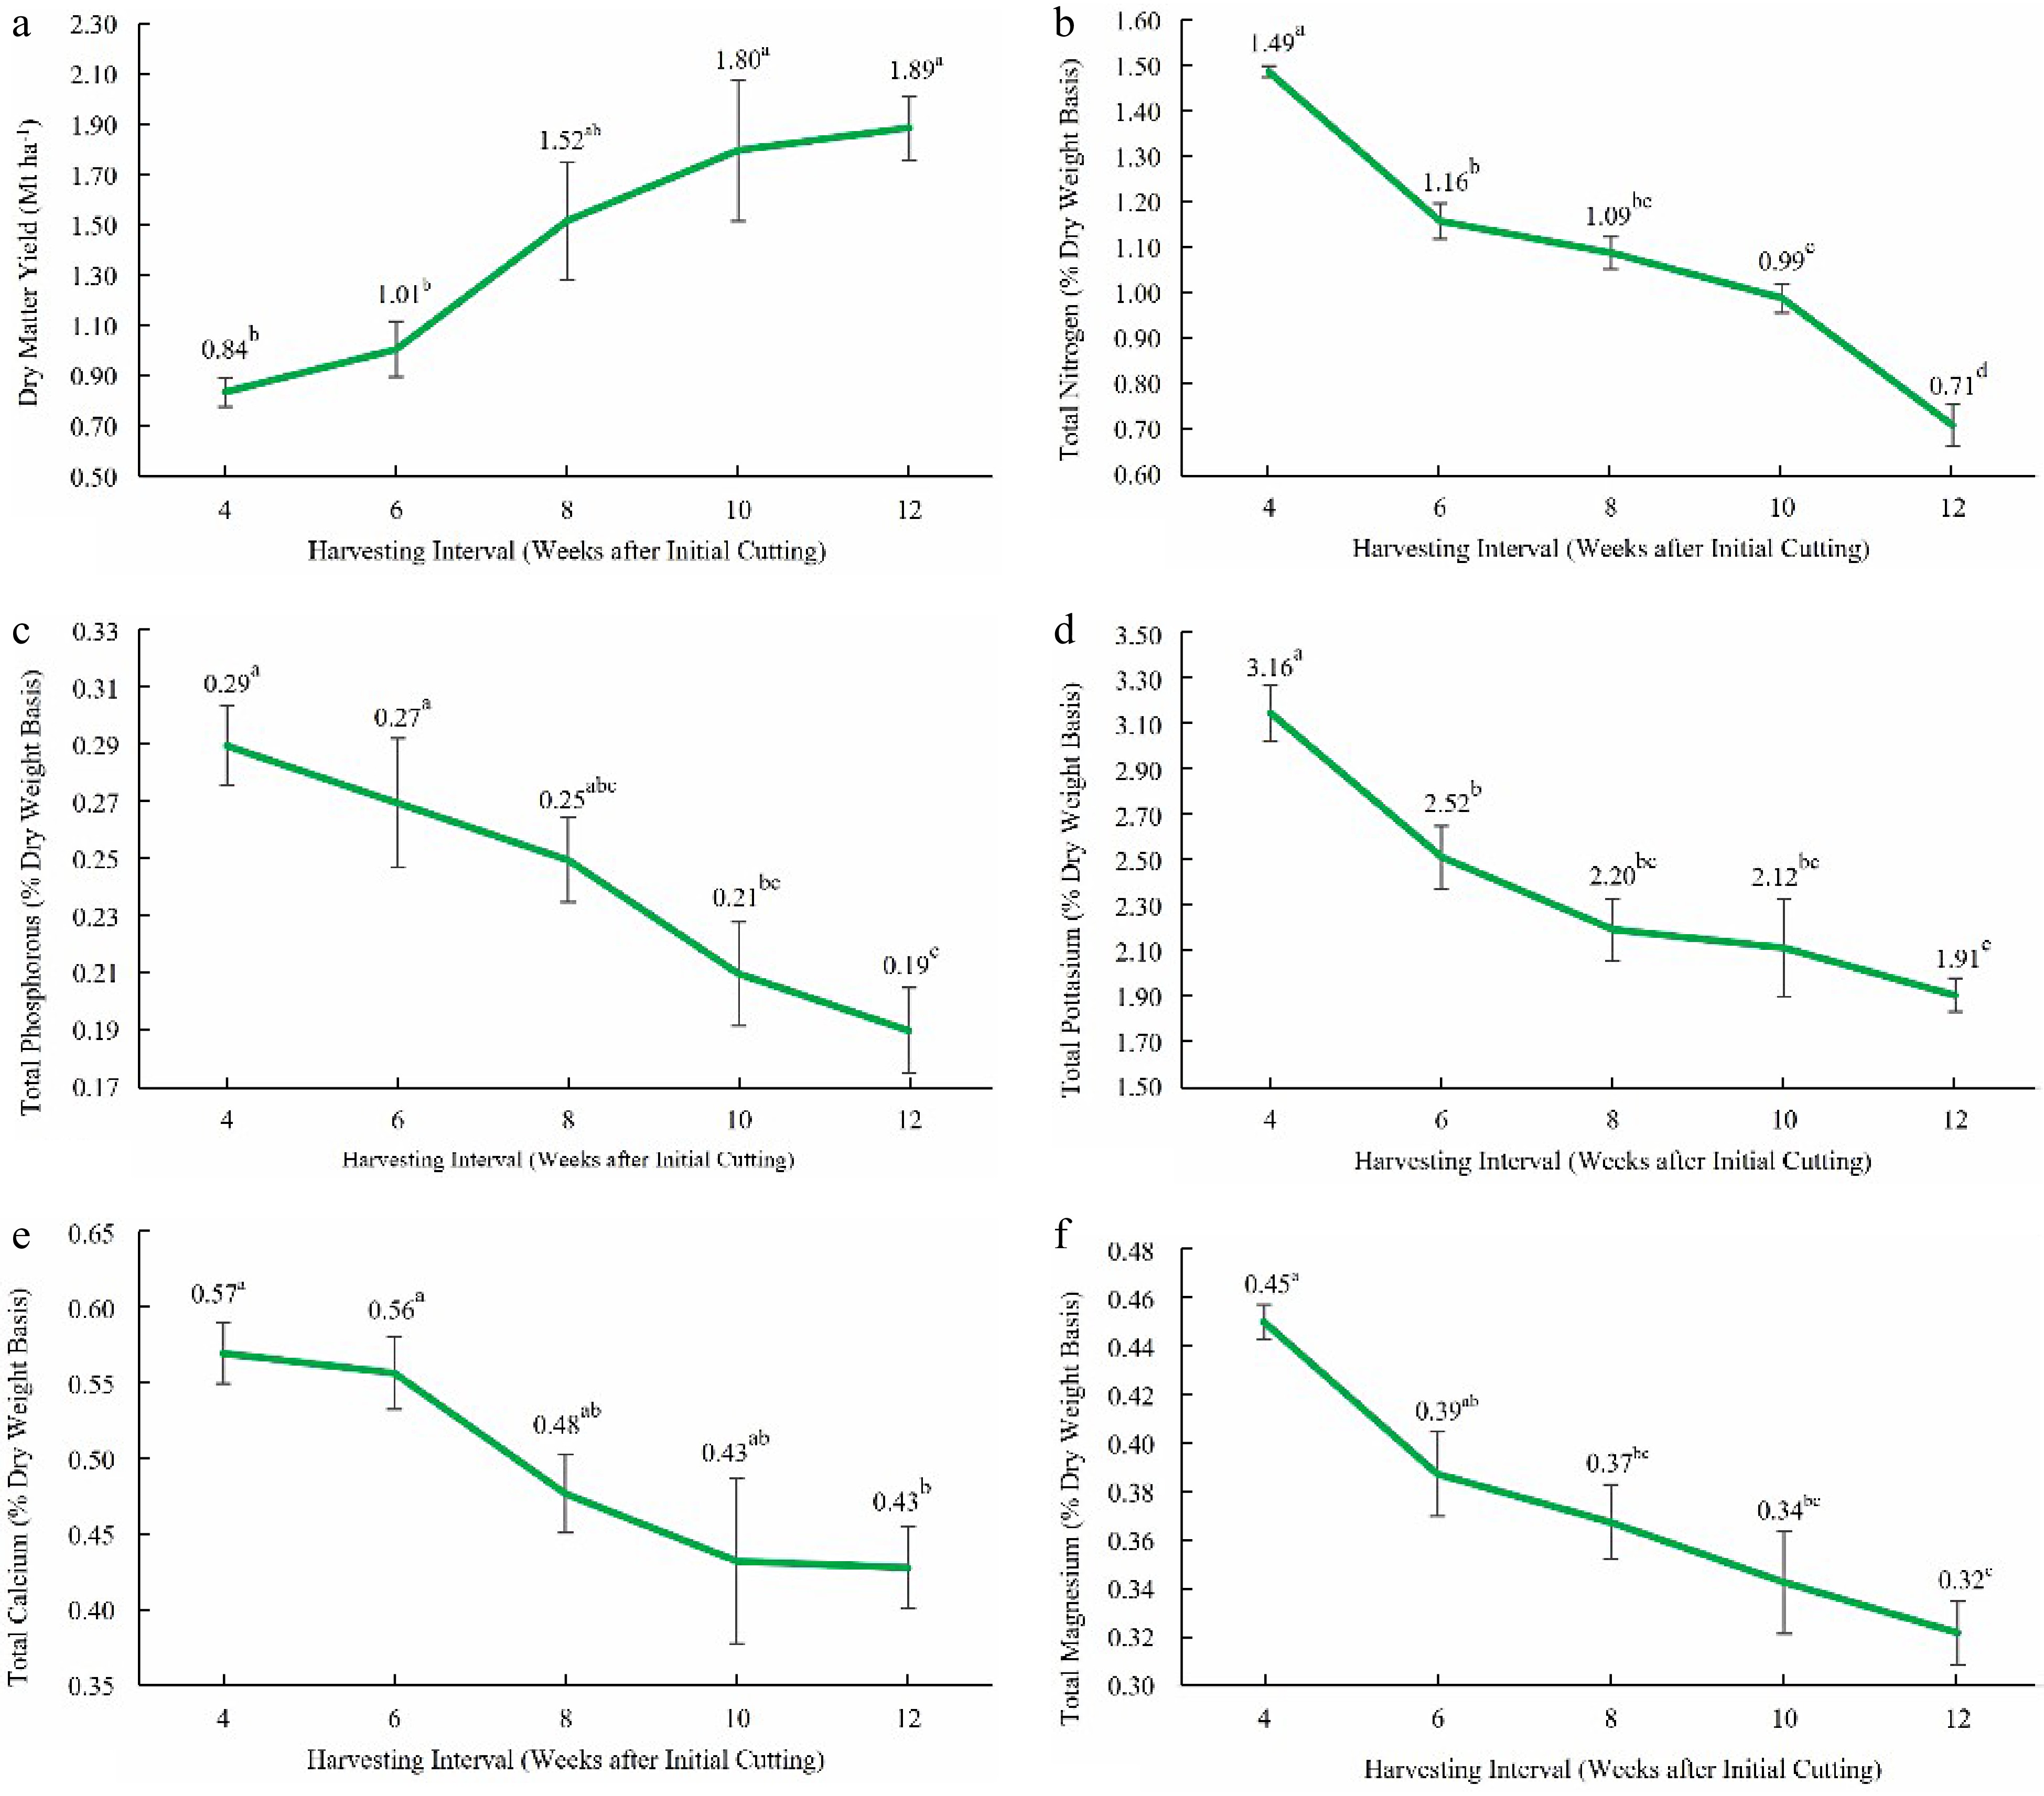
Figure 2.
(a) Dry matter yield, (b) total leaf nitrogen content, (c) total leaf phosphorous content, (d) total leaf potassium content, (e) total leaf calcium content, and (f) total leaf magnesium content at different growth stages (4, 6, 8, 10, and 12 weeks after initial cutting). Means that do not share a letter are significantly different at p < 0.05.
-
Variable Harvesting interval (weeks after regrowth) Mean Min. Max. SD CV (%) Dry matter yield (t ha−1) 4 0.84 0.51 1.19 0.20 24.31 6 1.01 0.47 1.75 0.39 37.99 8 1.52 0.53 2.96 0.81 53.66 10 1.80 0.46 3.75 0.97 53.80 12 1.89 1.20 2.47 0.45 23.51 Total nitrogen (% dry weight basis) 4 1.49 1.38 1.63 0.06 4.00 6 1.16 0.79 1.35 0.18 15.72 8 1.09 0.71 1.36 0.18 16.88 10 0.99 0.69 1.37 0.17 17.29 12 0.71 0.17 1.08 0.25 34.75 Total phosphorous
(% dry weight basis)4 0.29 0.20 0.39 0.07 24.97 6 0.27 0.15 0.50 0.13 48.38 8 0.25 0.15 0.34 0.07 28.36 10 0.21 0.10 0.40 0.11 49.10 12 0.19 0.05 0.35 0.09 46.33 Total potassium
(% dry weight basis)4 3.16 2.49 4.05 0.43 13.75 6 2.52 1.67 3.02 0.48 19.23 8 2.20 1.59 3.04 0.48 21.67 10 2.12 1.19 3.47 0.74 35.09 12 1.91 1.45 2.34 0.26 13.42 Total calcium
(% dry weight basis)4 0.57 0.50 0.65 0.06 10.10 6 0.56 0.45 0.68 0.08 13.61 8 0.48 0.36 0.62 0.08 17.32 10 0.43 0.23 0.64 0.16 37.78 12 0.43 0.30 0.59 0.09 21.08 Total magnesium
(% dry weight basis)4 0.45 0.43 0.48 0.02 4.21 6 0.39 0.30 0.47 0.06 15.64 8 0.37 0.26 0.44 0.05 14.48 10 0.34 0.19 0.46 0.07 21.36 12 0.32 0.26 0.40 0.05 14.09 Since these are naturally existing fields, the variation is higher compared to cultivated fields resulting in higher CV values. Table 1.
Descriptive statistics of dry matter yield and leaf nutrient content
Figures
(2)
Tables
(1)