-
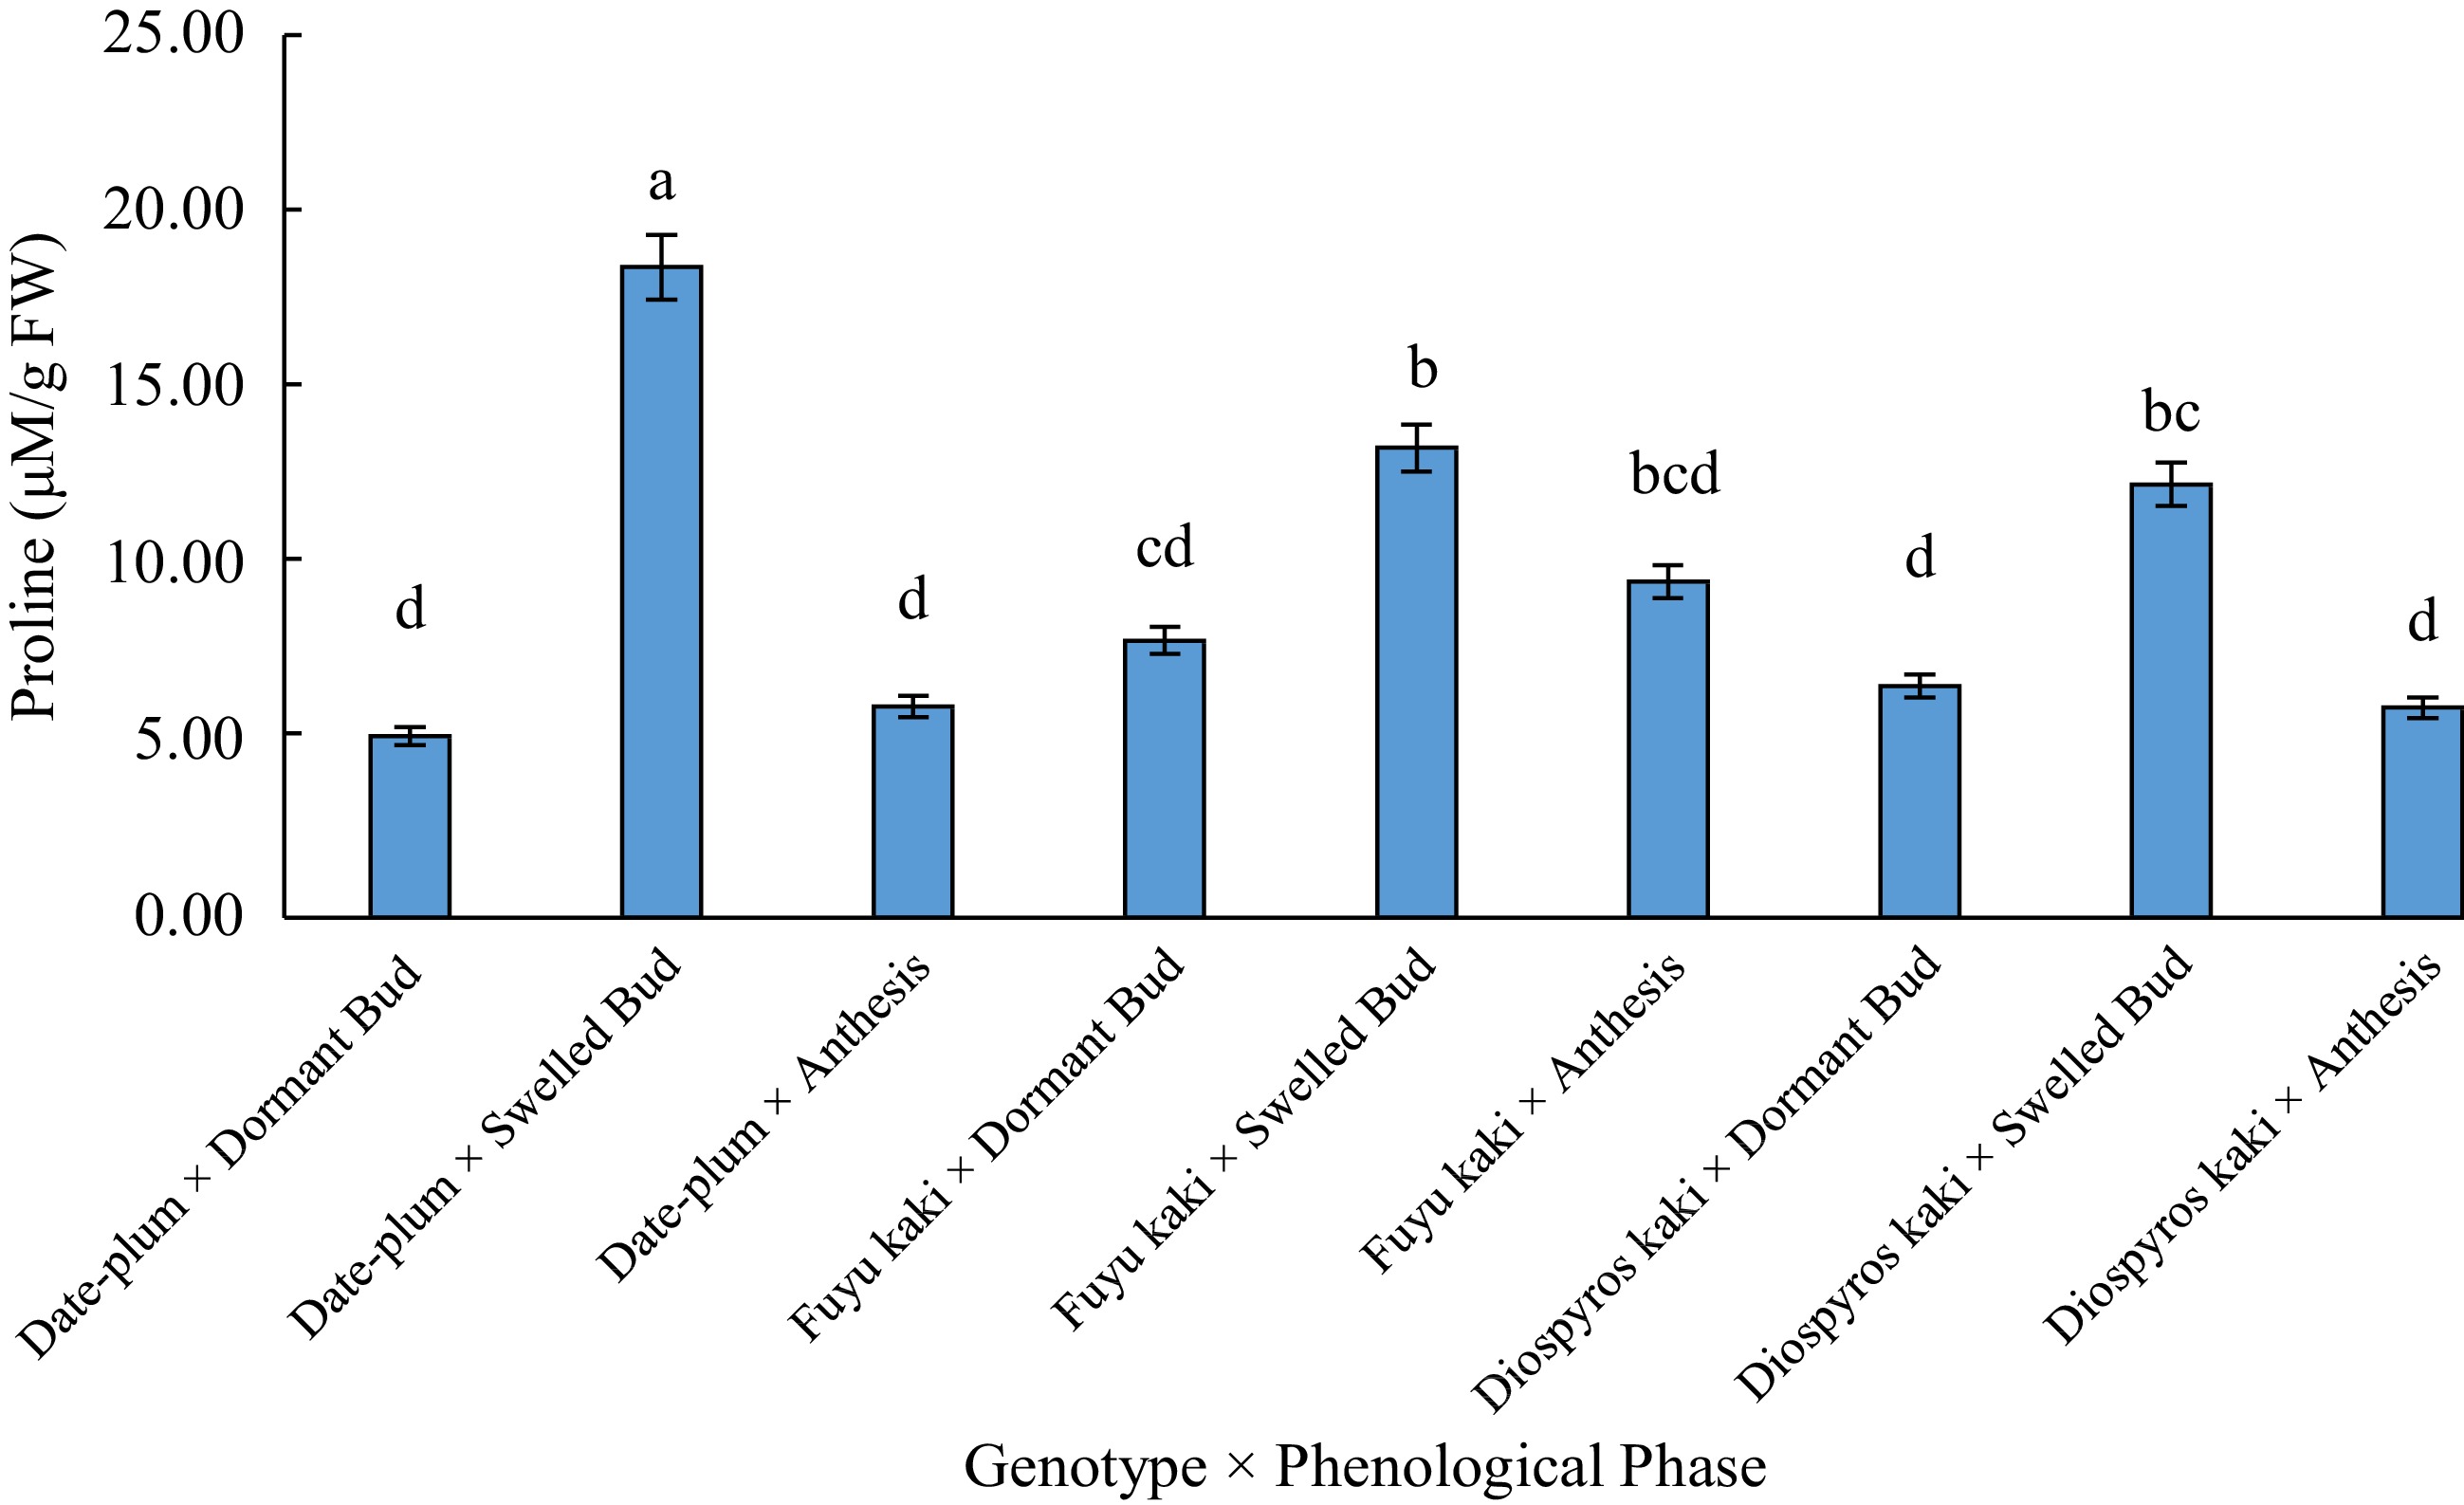
Figure 1.
The effect of 'genotype × phenological phase' on proline content.
-
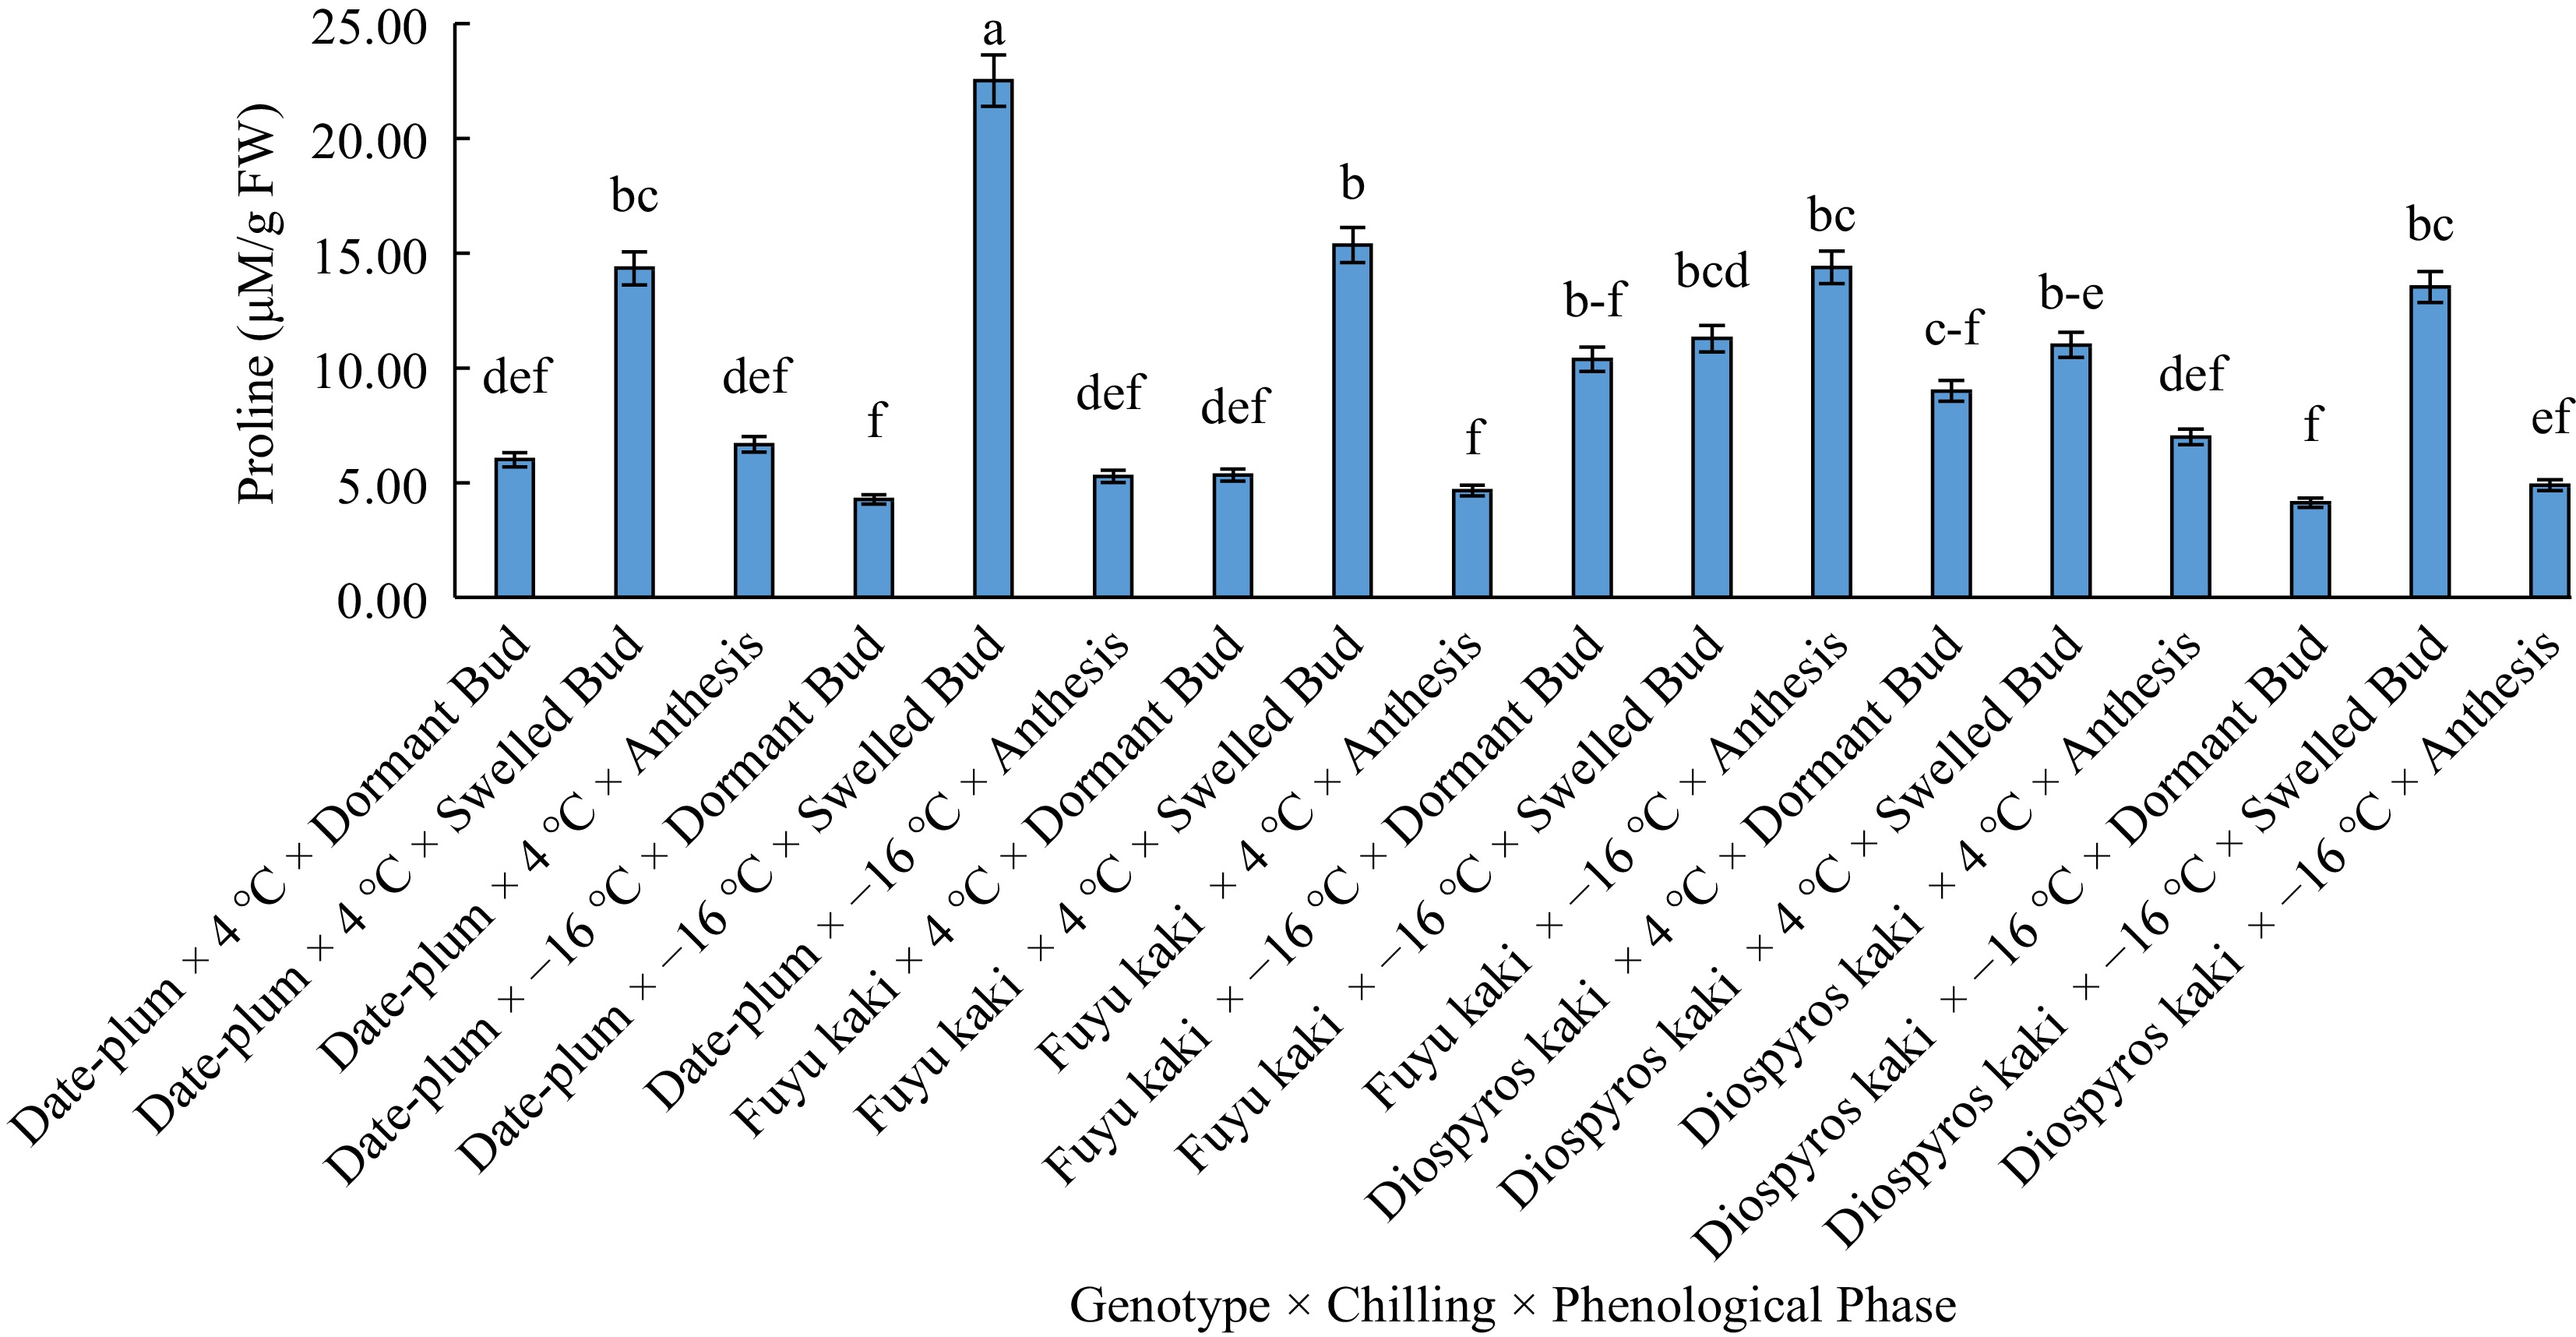
Figure 2.
The effect of 'genotype × chilling × phenological stage' on proline content.
-
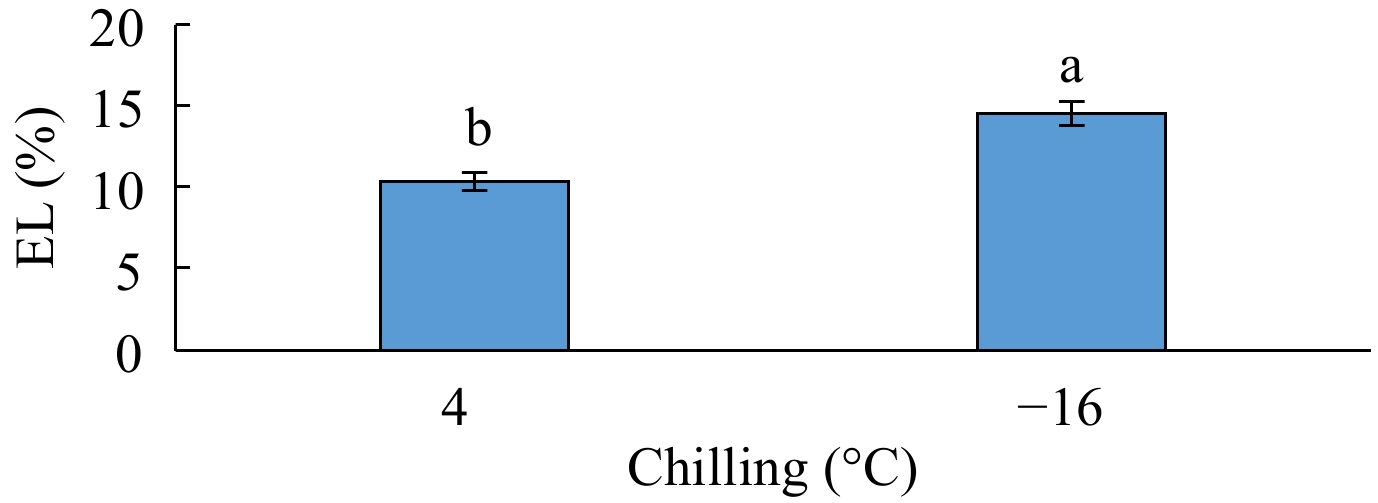
Figure 3.
The effect of chilling on electrolyte leakage (EL).
-
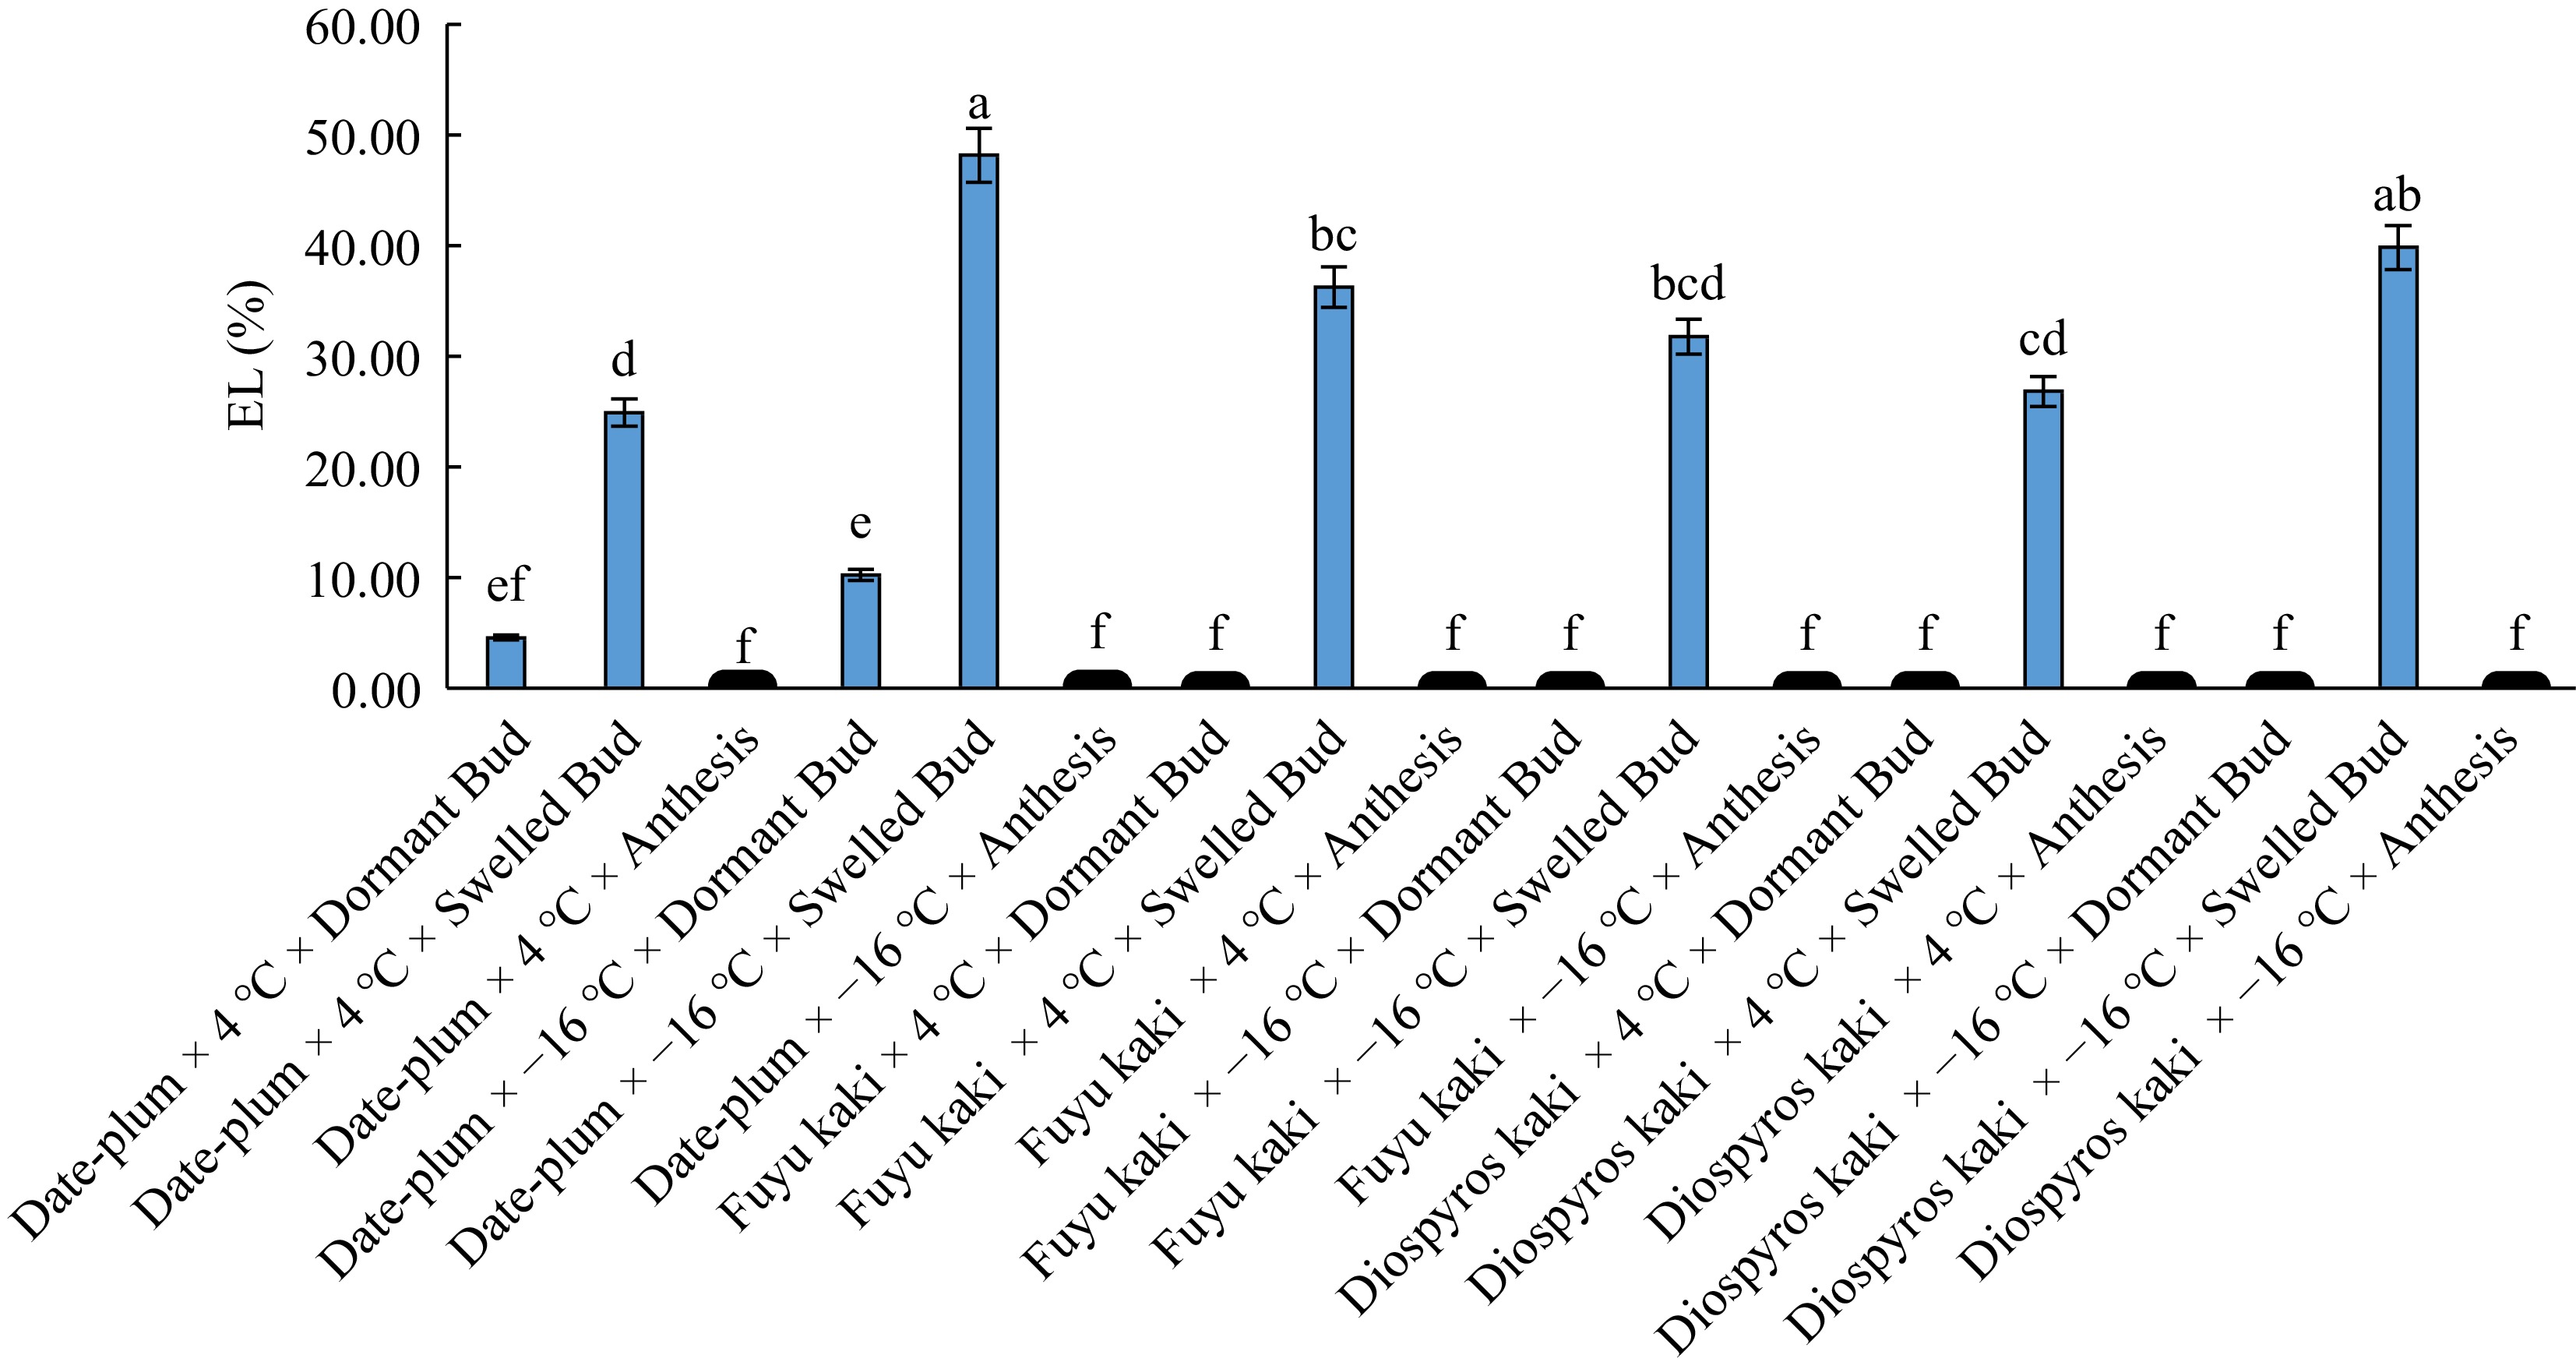
Figure 4.
The effect of 'genotype × chilling × phenological phase' on electrolyte leakage (EL).
-
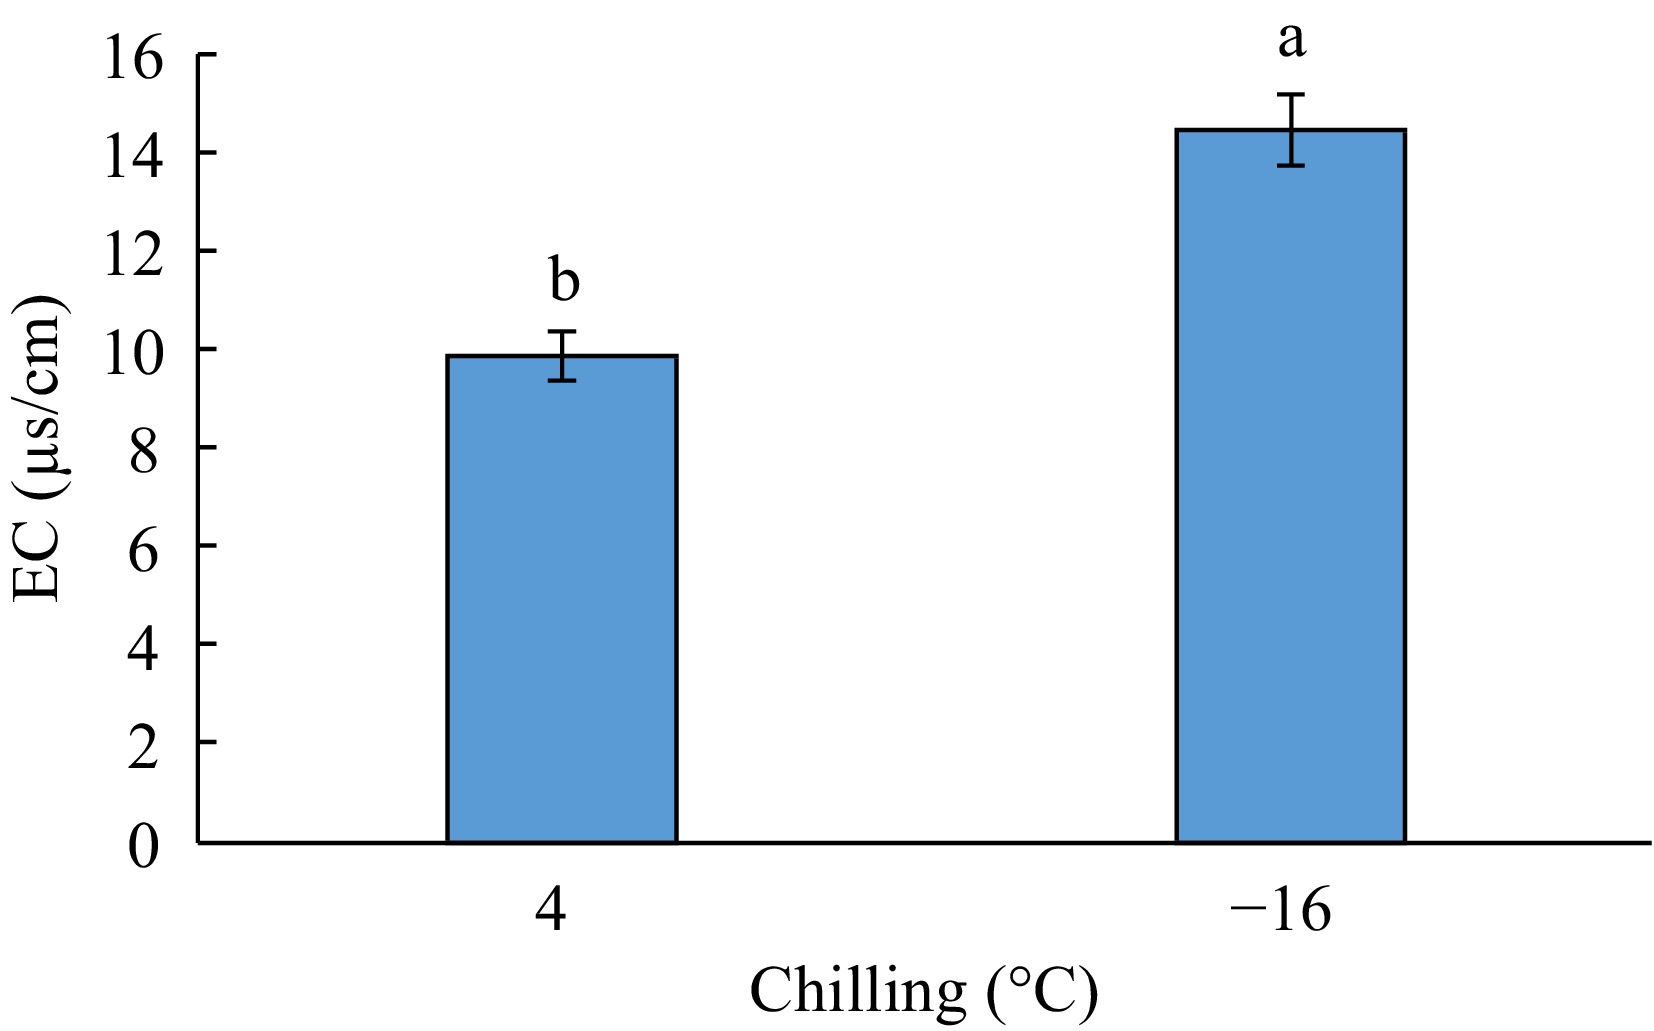
Figure 5.
The effect of chilling on EC.
-
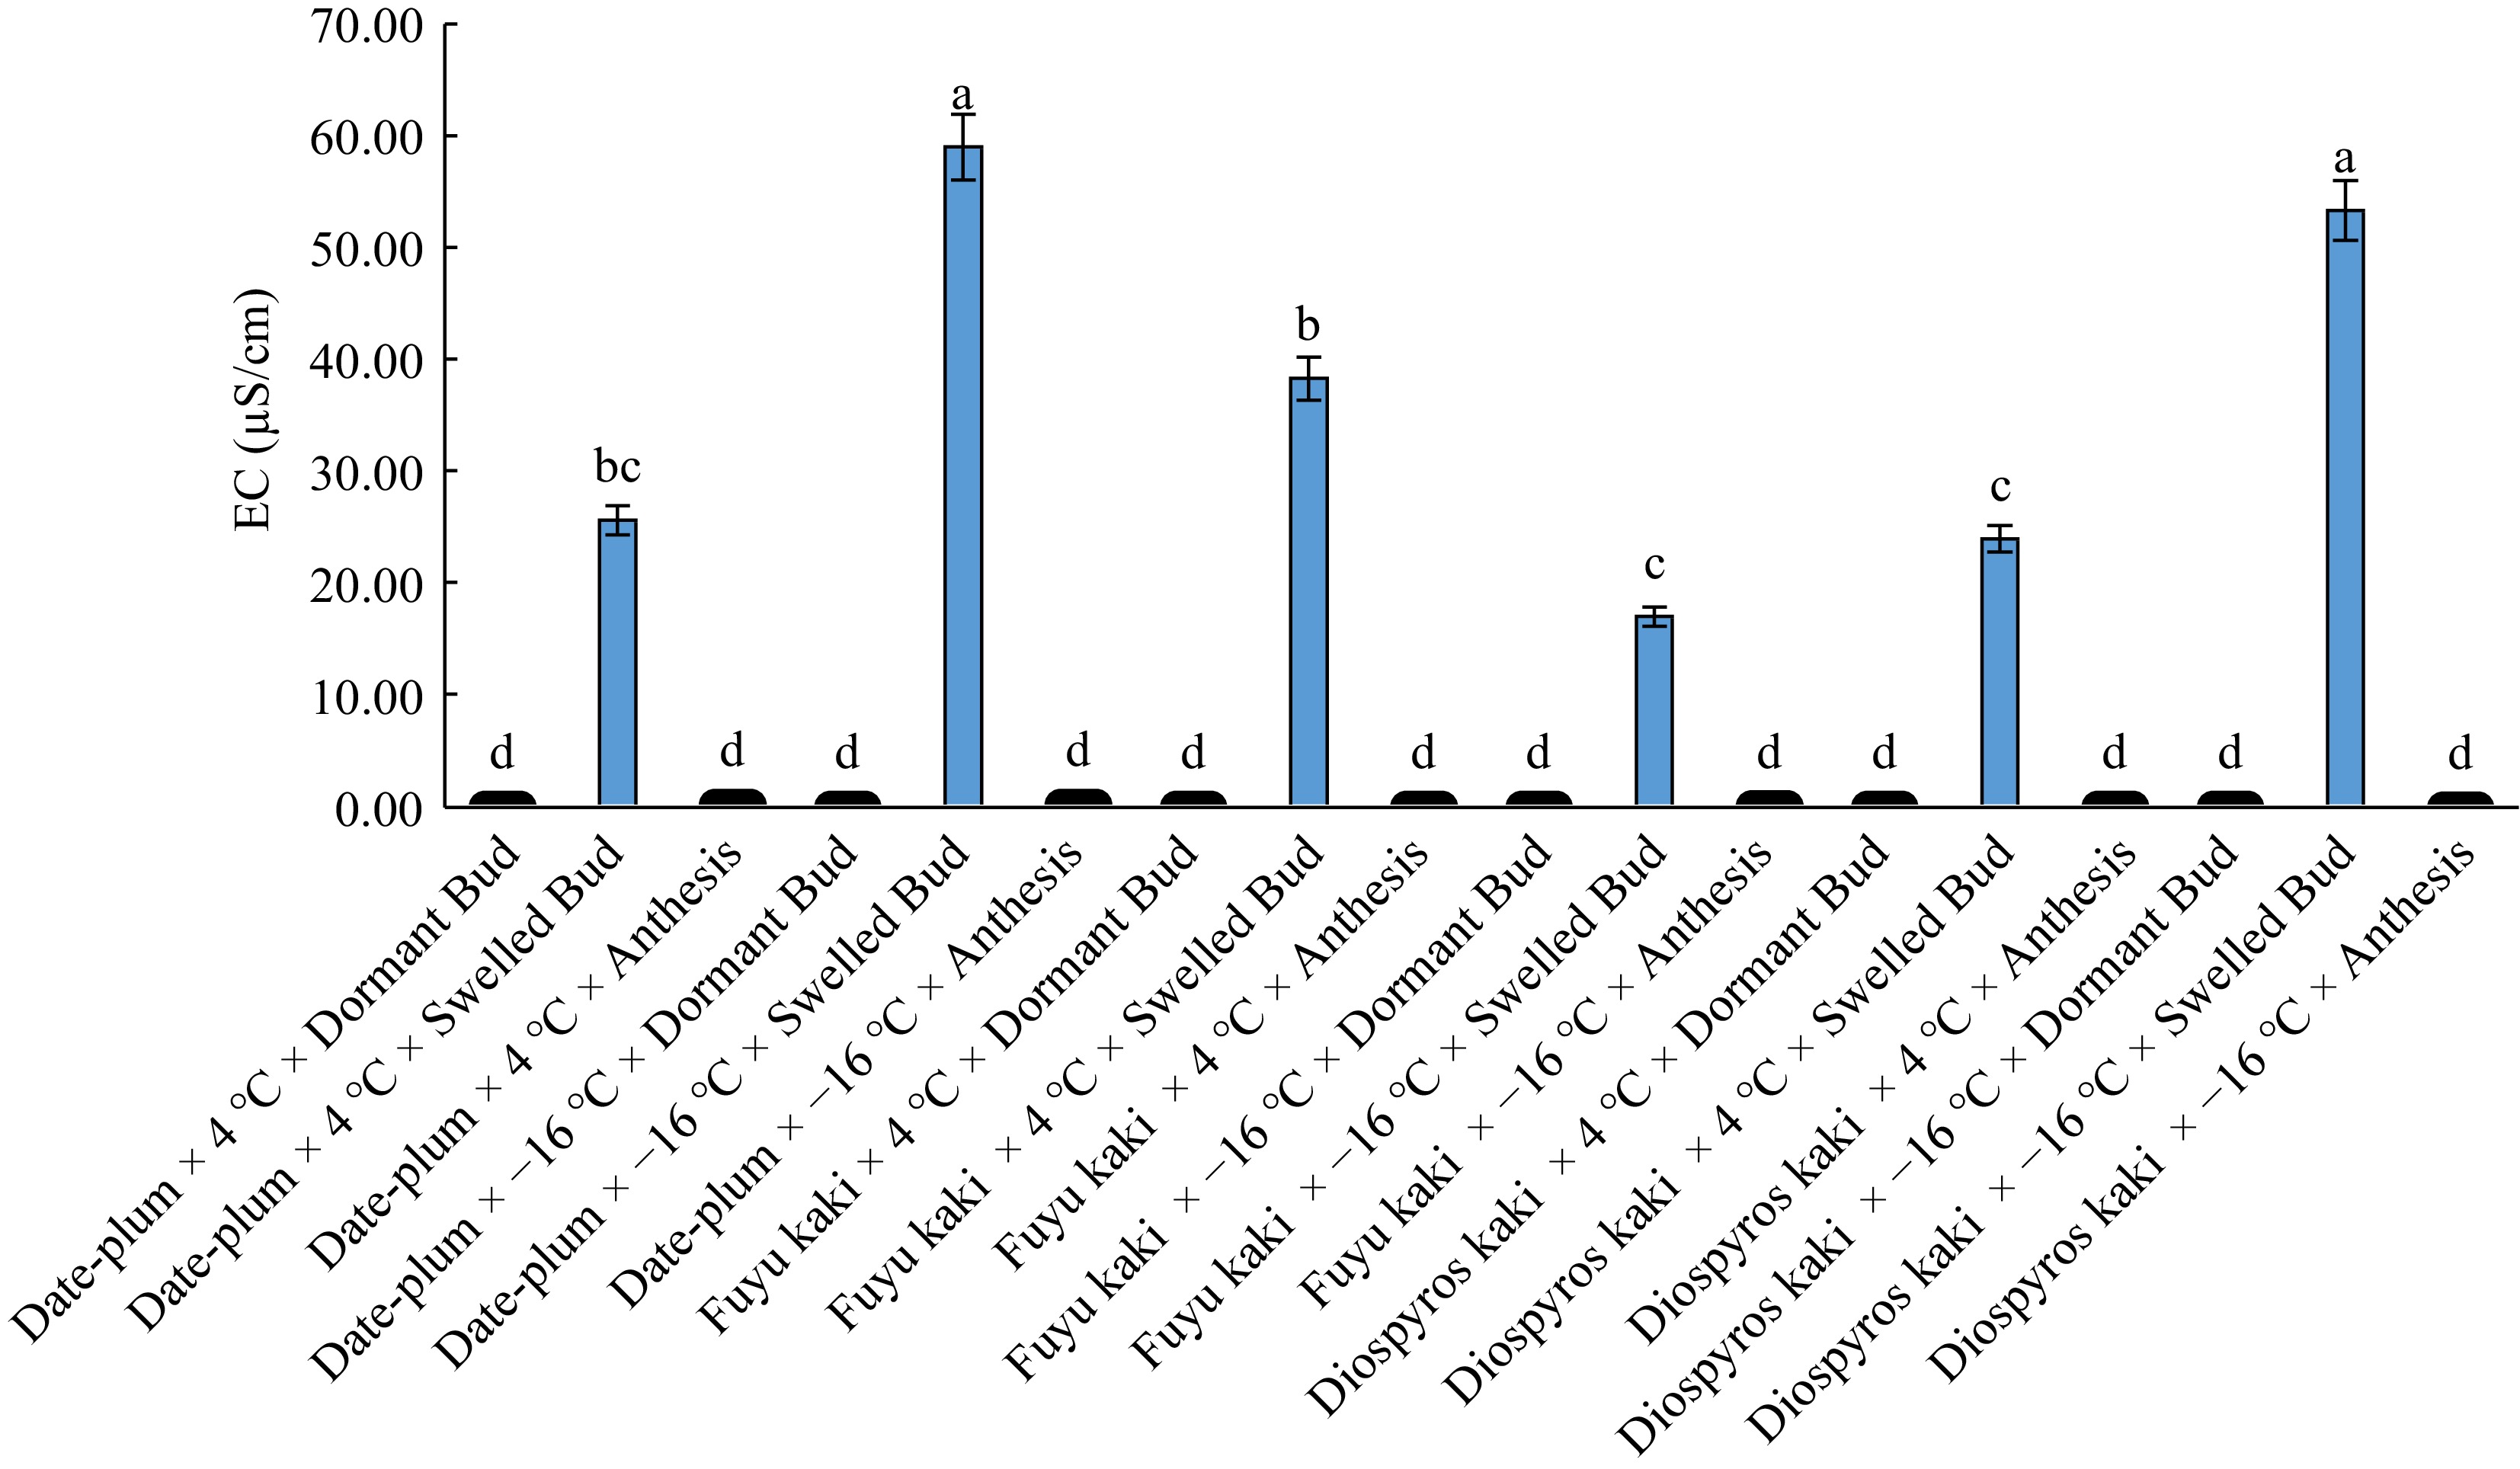
Figure 6.
The effect of 'genotype × chilling × phenological stage' on EC.
-
Sources of variations df Means of squares Proline content Electrolyte leakage EC Replication 2 88.74** 89.39ns 32.14ns Genotype (A) 2 19.48ns 71.32ns 117.79ns Chilling (B) 1 21.37ns 234.04* 284.97* AB 2 29.13ns 138.85* 461.82** Phenological phase (C) 2 369.23** 6673.85** 7819.65** AC 4 40.96* 26.31* 115.24ns BC 2 10.59ns 143.87* 285.73* ABC 4 65.57** 85.79+ 464.13** Error 34 14.42 33.59 59.83 ns: insignificant difference; **: significant difference at 0.01; *: significant difference at 0.05; +: significant difference at 0.10. Table 1.
Analysis of variance for the effect of experimental factors on proline content.
-
Treatment Proline
(μmol/g FW)Electrolyte
leakage (%)EC
(μS/cm)Bud dormancy 6.52 b 2.54 b 0.1 b Bud swelling 14.66 a 34.64 a 36.23 a Anthesis 7.15 b 0.16 b 0.16 b Similar letters in each column shows insignificant differences at the p < 0.05 level. Table 2.
Means comparison for the effect of phenological stage on the studied traits.
-
Treatment Ion leakage
(%)EC
(μS/cm)4 °C × bud dormancy 1.60 c 0.10 c 4 °C × bud swelling 29.34 b 29.33 b 4 °C × anthesis 0.16 c 0.16 c -16 °C × bud dormancy 3.48 c 0.11 c -16 °C × bud swelling 39.94 a 43.13 a -16 °C × anthesis 0.16 c 0.15 c Similar letters in each column shows insignificant differences at the p < 0.01 and p < 0.05 levels. Table 3.
Means comparison for the effect of 'chilling × phenological phase' on the studied traits.
-
Treatment Ion leakage
(%)EC
(μS/cm)Date-plum × 4 °C 9.92 b 8.68 b Date-plum × -16 °C 19.56 a 19.80 a Kaki Fuyu × 4 °C 12.15 b 12.84 ab Kaki Fuyu × -16 °C 10.68 b 5.77 b Japanese × 4 °C 9.02 b 8.07 b Japanese × -16 °C 13.35 b 17.82 a Similar letter(s) in each column shows insignificance differences at the p < 0.01 and p < 0.05 levels. Table 4.
Means comparison for the effect of 'genotype × chilling' on the studied traits.
Figures
(6)
Tables
(4)