-

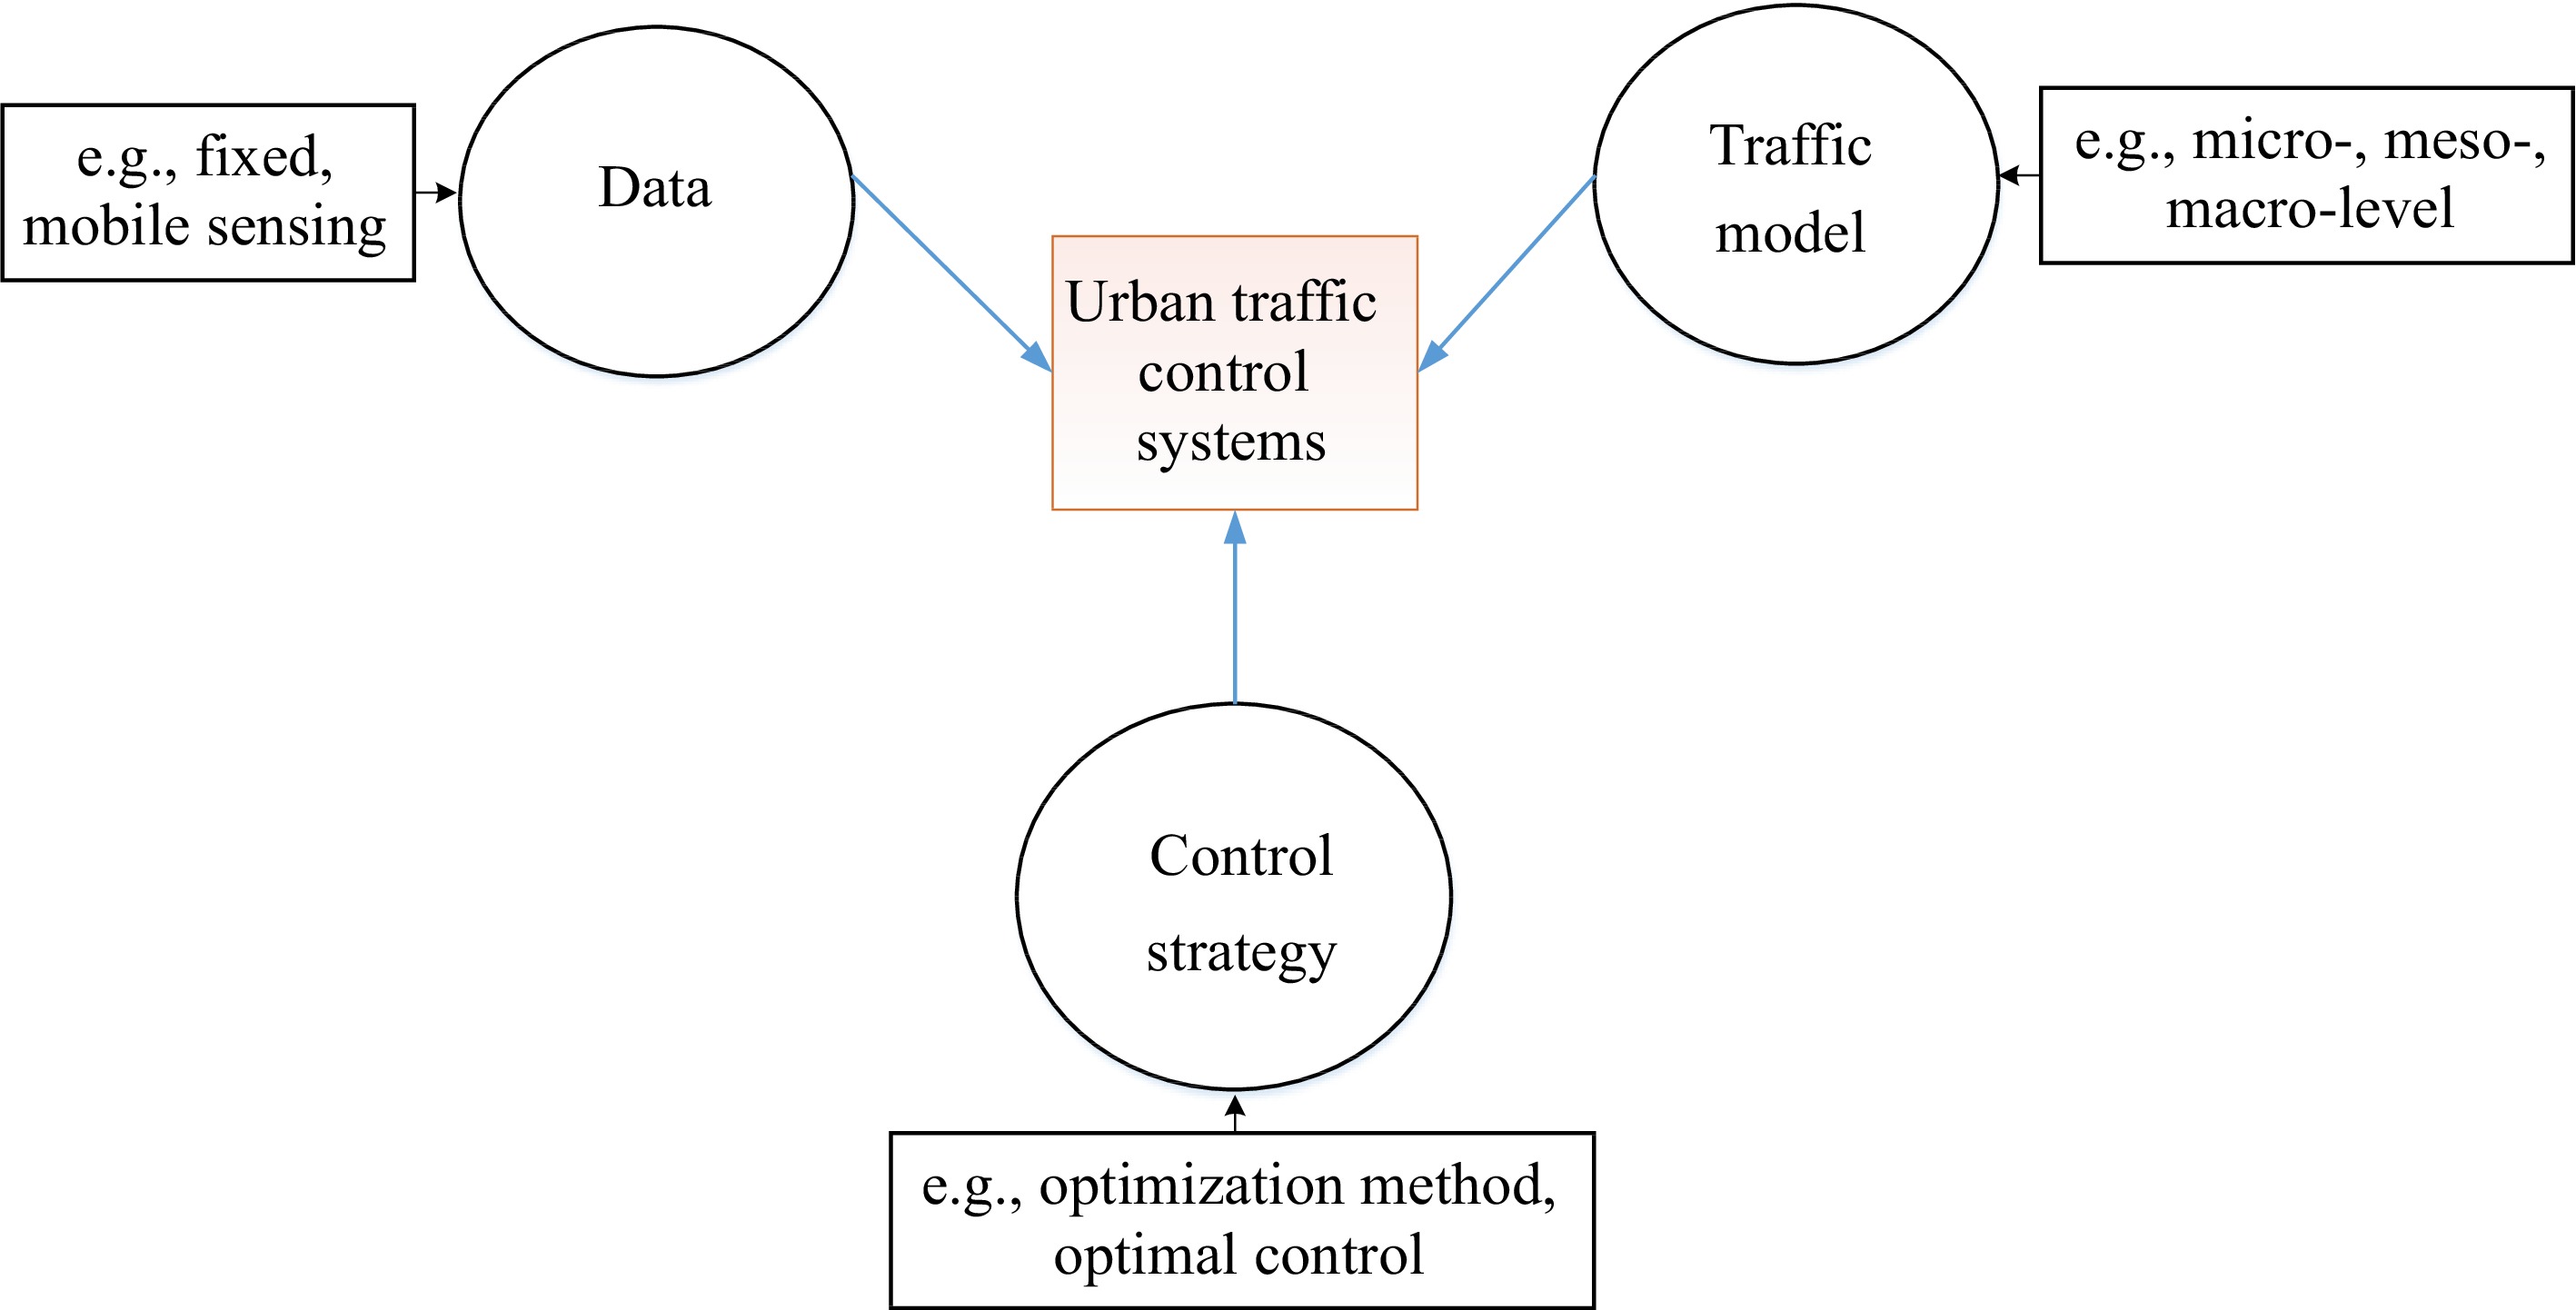
Figure 1.
Three basic components of urban traffic control systems (UTCSs).
-

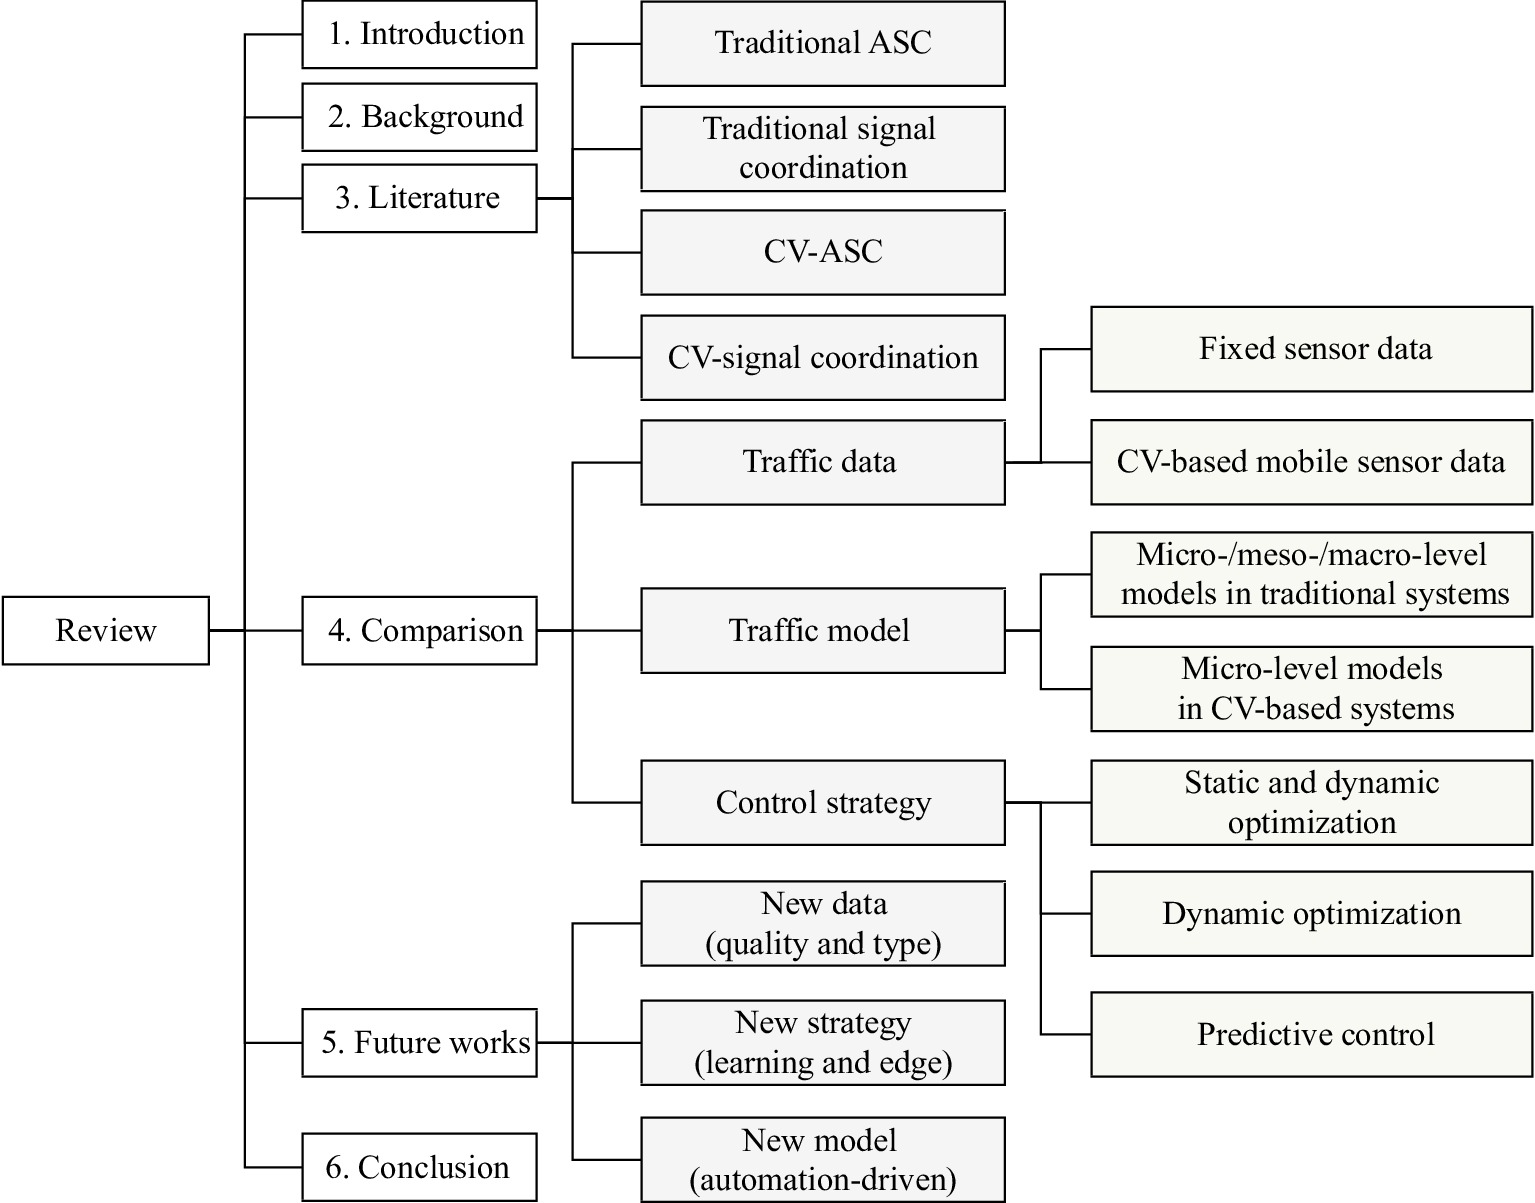
Figure 2.
The structure of the current review for the traditional and CV-based urban traffic control systems.
-

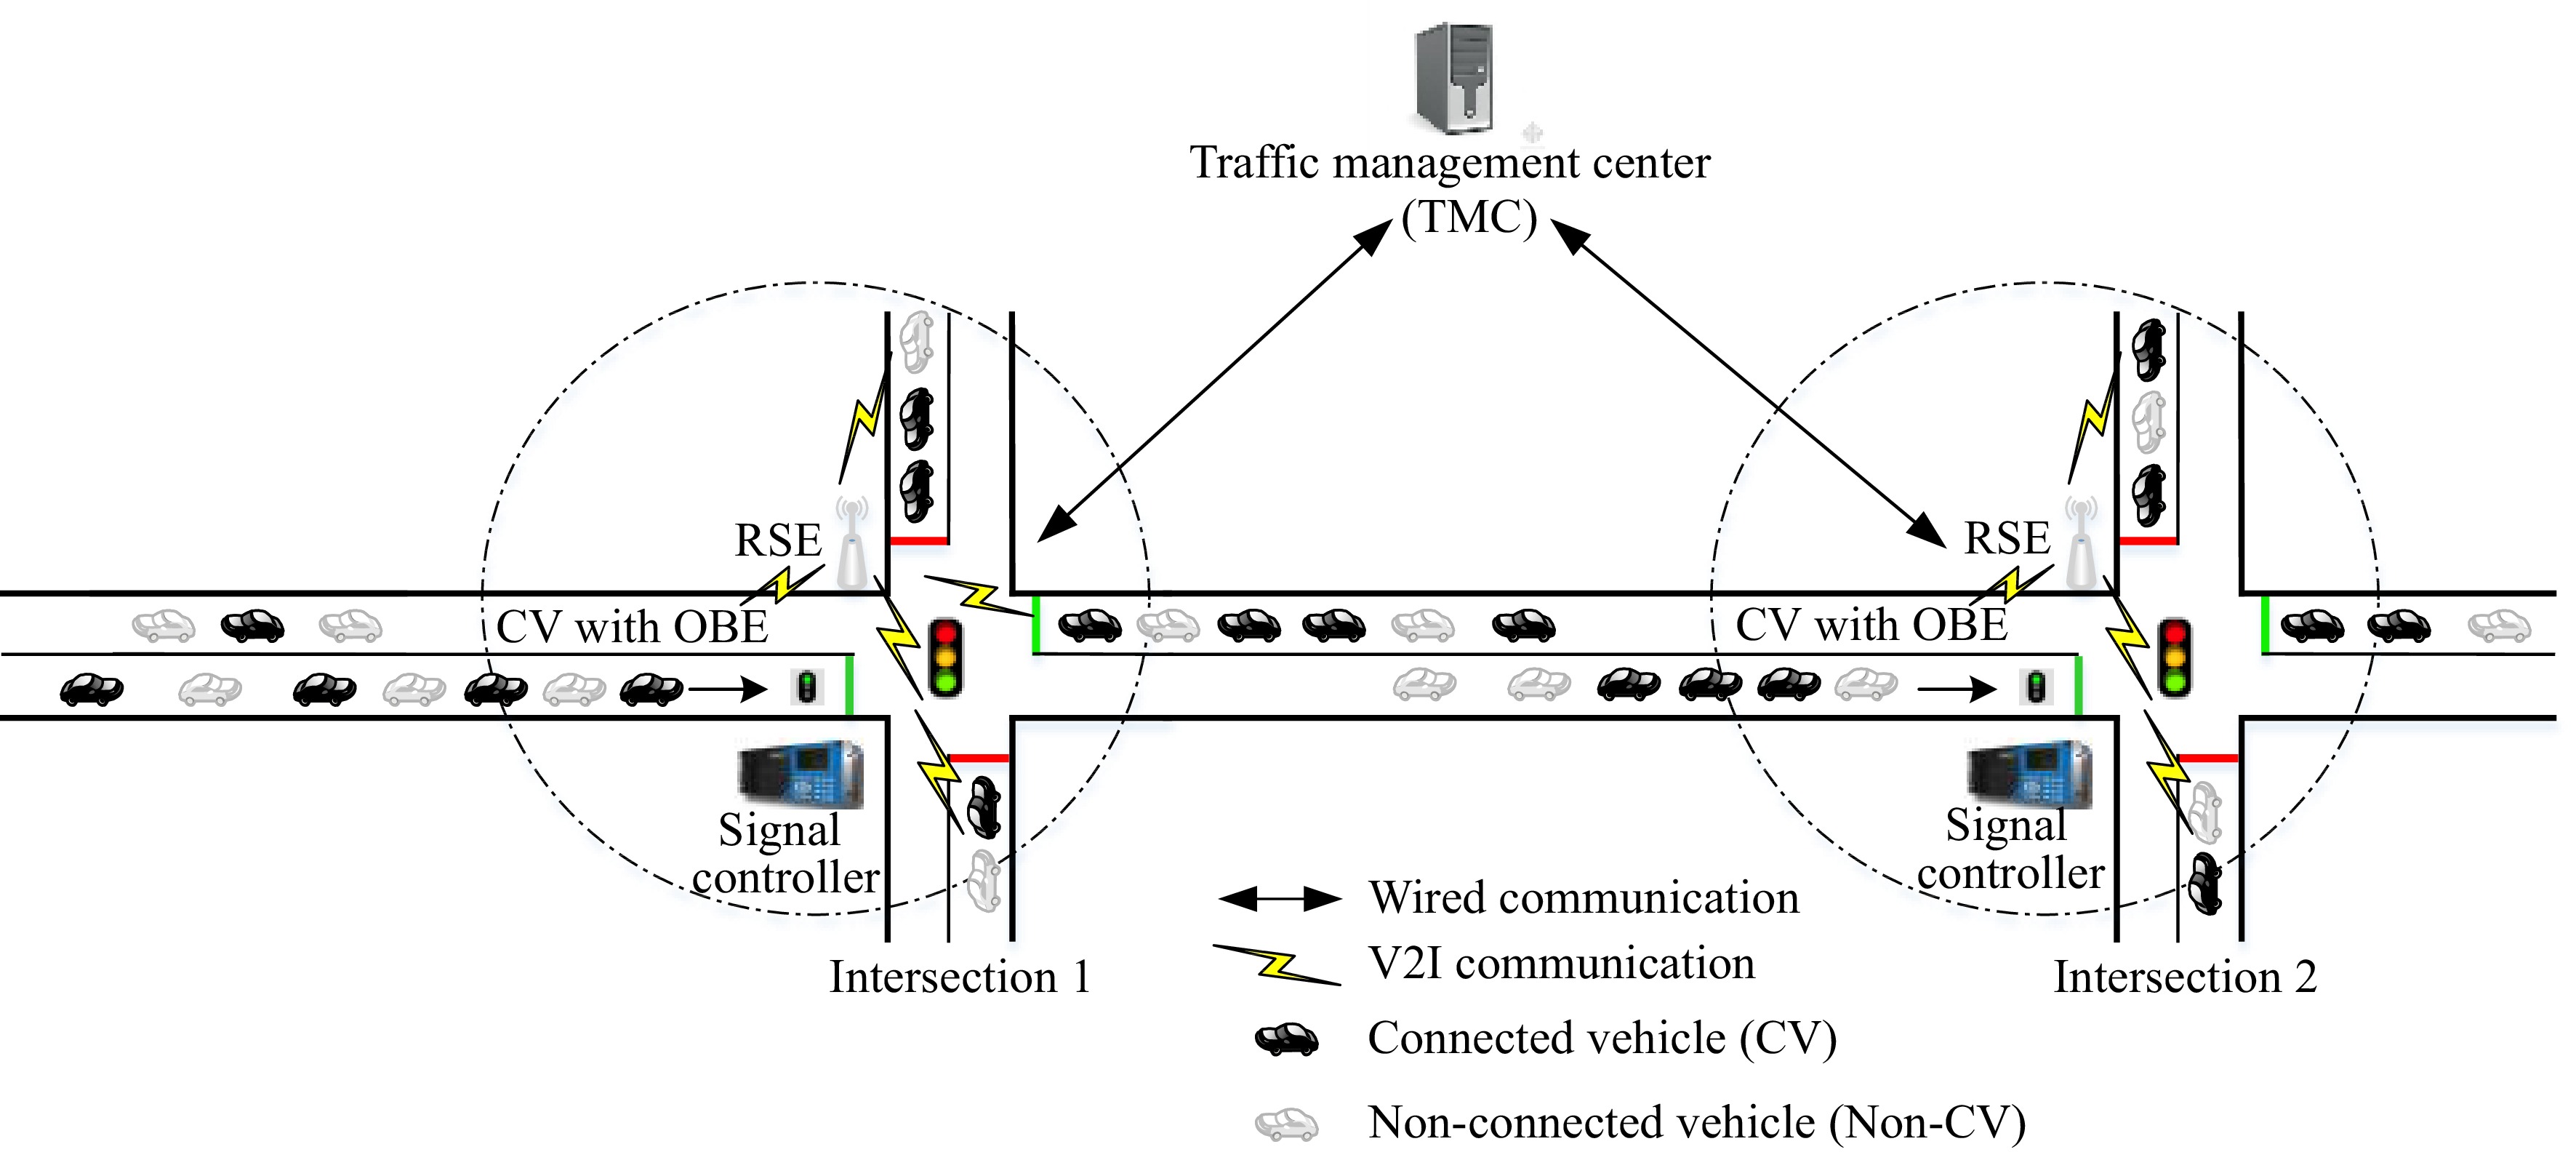
Figure 3.
A graphical statement of signal control in a mixed CV environment, with an urban road segment with two adjacent signalized intersections.
-
Signal control Data type Traffic prediction Control strategy Fixed-time Historical N/A Pre-defined
timing plansActuated Real-time N/A Simple logics Adaptive Real-time Predictions by
traffic modelsSignal
optimizationsTable 1.
Summary of three conventional signal control systems.
-
Category Adjusted control Responsive control Advanced adaptive control a Data quality: sensor density level (L) Static sensor data L1 & L1.5, less than one sensor up to one sensor per link L2, one sensor per link up to one per lane L3, two sensors per lane a Responsive to demand variations Slow reactive response based on pre-calculated historical traffic flow Prompt reactive response based on changes in regularly disrupted traffic Very rapid proactive response based on short-term predicted movements a Change frequency in control plan (HZ) Minimum of 15 minutes, usually several times during a rush period, (< 1/900 HZ) Minimum of 5-15 minutes, per several cycles, (< 1/300 HZ) Continuous adjustments are made to all timing parameters, per several seconds (< 1/5 HZ) c Control strategy Pattern matching from pre-stored plans by static optimization Cyclic timing plan generating and matching via static/dynamic optimization Real-time timing adjusting via dynamic optimization and optimal control a,b Generations of UTCSs (G) G1 & G1.5a , e.g., SCATS[28] G2a, e.g., SCOOT[27] G3b , e.g., OPAC[29], RHODES[30],
ACS Lite[53]Coordination included Mostly yes Mostly yes Yes a Adopted from Klein et al.[14] and Stevanovic et al.[15]. b Summarized from Gartner et al.[52] and Wang et al.[16]. c Identified in this report drawn from across a number of studies. -
Category Adjusted control Responsive control Advanced adaptive control a Data quality: sensor density level (L) Same as Table 2 a Responsive to demand variations a Change frequency in control plan c Control strategy a,b Generations of UTCSs (G) Specific control strategy for Coordination Advancement of the quality of progression,
e.g., classical MAXBAND[33] and recent AMBAND[68]Optimization of a performance index,
e.g., MITROP[34]Table 3.
Classifications of signal coordinations in UTCSs[19].
-
Author, year Objective functions+ Delay1 Queue length2 Waiting time3 Stop4 Travel time5 Type Gradinescu et al.[75] in 2007 Average delay 1 Chou et al.[76] in 2012 Vehicle and
Passenger delayStops * Nafi and Khan[77] in 2012 Average waiting time 3 Chang and Park[78] in 2013 Queue length Junction waiting time * Ahmane et al.[79] in 2013 Queue length 2 Cai et al.[80] in 2013 Travel time 5 Pandit et al.[81] in 2013 Delay 1 Lee et al.[82] in 2013 Cumulative
Travel time5 Kari et al.[83] in 2014 Travel delay 1 Guler et al.[36] in 2014 Total delay Stops * Tiaprasert et al.[84] in 2015 Queue length 2 Feng et al.[1] in 2015 Vehicle delay Queue length 1 Younes and Boukerche[85] in 2016 Delay 1 Feng et al.[32] in 2016 Vehicle delay 1 Islam et al.[88] in 2017 Queue length 2 Liu et al.[39] in 2017 Average waiting time 3 Cheng et al.[86] in 2017 Average waiting time 3 Feng et al.[87] in 2018 Total delay 1 Ban et al.[89] in 2018 Delay 1 Al Islam et al.[90] in 2020 Average delay Total travel time * Li et al.[91, 92] in 2021 Delay 1 Mo et al.[93] in 2022 Average delay 1 + Index type: 1 delay, 2 queue length, 3 waiting time, 4 stop, 5 travel time, * combination. Table 4.
Summary of the objective functions in the existing CV-based ASCs applied to both the isolated intersection and multiple intersections.
-
Category CV-based basic ASC CV-based advanced ASC a, c Data quality: sensor density level (L)
and market penetration rate (Pcv)Mobile sensor data L4a, Pcv = 100%,
i.e., 100 % market penetration rateL3.5c & L4a, Pcv < 100% & Pcv = 100%,
i.e., both non-full and full market penetration rateEach connected vehicle (CV) regularly reports its location, speed, and possibly its destinationa b Responsive to demand variations Very rapid proactive response based on short-term traffic predictions b Change frequency in control plan (HZ) Continuous adjustments, per several seconds to per second (< 1 HZ) c Control Strategy Real-time timing adjustment via static optimization, dynamic optimization, and optimal control c Generations of UTCSs (G) G4c, e.g., work by Gradinescu et al.[75] G4.5c , e.g., PAMSCOD[42] and detector-free ASC[ 87] a Adopted from Klein et al.[14], Stevanovic et al. [15]. b Summarized from Gartner et al. [52], and Wang et al. [16]. c Identified in this report. -
Author, year Country/
regionInstitution He et al.[42] in 2012 USA University of Arizona C.M. Day et al.[40] in 2016 USA Purdue University Li et al.[41] in 2016 USA Purdue University Feng et al.[32] in 2016 USA University of Arizona Beak et al.[19] in 2017 USA University of Arizona,
University of MichiganC.M. Day et al.[98] in 2017 USA Purdue University Remias et al.[46] in 2018 USA Purdue University Zheng et al.[99] in 2018 USA,
ChinaUniversity of Michigan,
Didi Chuxing LLCMo et al.[93] in 2022 USA Columbia University Table 6.
Summary of the CV-based advanced signal coordination systems’ research teams and outputs.
-
Category CV-based advanced signal coordination systems a, c Data quality: sensor density level (L) and
market penetration rate (Pcv)Mobile sensor data L3.5c & L4a, Pcv < 100% & Pcv = 100%, i.e., both non-full and full market penetration rate b Responsive to demand variations Slow reactive response based on
historic traffic flowsRapid proactive response based on short-term predicted movements b Change frequency in control plan (HZ) Minimum of 15 min−3 h,
(< 1/900 HZ)Continuous adjustments, usually per cycle
(< 1/100 HZ)Minimum Pcv_min 0.1% for per 3 hrs change, 5% for
per 15 mins change25% for per cycle change Specific control strategy of coordination offline offset method,
e.g., detector-free method [98,40,41,46]online priority-based method,
e.g., adaptive coordination method[19,32,42]c Generations of UTCSs (G) UTCS G4.5c a Adopted from Klein et al.[14], Stevanovic et al. [15]. b Summarized from Gartner et al.[52], and Wang et al.[16]. c Identified in this report. -
Category Non-CV-based
Adjusted controlNon-CV-based
Responsive controlNon-CV-based
Advanced adaptive controlCV-based
Basic ASCCV-based
Advanced ASCa Data quality: sensor density level (L) Static sensor data Mobile sensor data L1 & L1.5, less than
one sensor up to one sensor per linkL2, one sensor per link up to one per lane L3, two sensors per lane L4a, Pcv = 100%, i.e., 100% market penetration rate L3.5c & L4a, Pcv < 100% & Pcv = 100%, i.e., both non-full and full market penetration rate a Responsive to demand variations Slow reactive
response based on
pre-calculated historical traffic flowPrompt reactive response based on changes in regularly disrupted traffic Very rapid proactive response based on short-term predicted movements Very rapid proactive response based on short-term traffic predictions a Change frequency in control plan
(HZ)Minimum of 15 min, usually several times during a rush period,
(< 1/900 HZ)Minimum of 5−15 min, per several cycles,
(< 1/300 HZ)continuous adjustments are made to all timing parameters, per several seconds
(< 1/5 HZ)Continuous adjustments, per several seconds to per second (< 1 HZ) c Control strategy Pattern matching from pre-stored plans by static optimization Cyclic timing plan generating and matching via static/dynamic optimization real-time
timing adjustment via dynamic optimization and optimal controlReal-time timing adjustment via static optimization, dynamic optimization, and optimal control a,b Generations of UTCSs (G) G1 & G1.5a,
e.g., SCATS[28]G2a, e.g., SCOOT[27] G3b, e.g., OPAC[29], RHODES[ 30],
ACS Lite[53]G4c, e.g., the work by Gradinescu et al.[75] G4.5c, e.g., PAMSCOD[42] and detector-free ASC[87] Coordination included Mostly yes Mostly yes Yes Mostly yes Mostly yes Traffic model Microscopic/ macroscopic/ mesoscopic models Mostly microscopic models * Summarized from previous Tables 2 & 5, where further details of the above notations are available. Table 8.
Fine classifications of traditional (non-CV-based) and CV-based ASC*.
-
Category Non-CV-based
Adjusted controlNon-CV-based
Responsive controlNon-CV-based
Advanced adaptive controlCV-based
Advanced signal coordination systemsa Data quality: sensor density level (L) Static sensor data Mobile sensor data L1 & L1.5, L2, L3, L3.5c & L4a, Pcv < 100% & Pcv = 100%, i.e., both non-full and full market penetration rate a Responsive to demand
variationsSame as Table 8 Slow reactive response based on historical traffic flows Rapid, proactive response based on short-term predicted movements a Change frequency in control plan
(HZ)Minimum of 15 min−3h,
(< 1/900 HZ)Continuous adjustments,
usually per cycle
(< 1/100 HZ)c Minimum Pcv_min 0.1% for per 3 hrs change,
5% for per 15 mins change25% for per cycle change a,b Generations of UTCSs (G) G4.5c , Specific control strategy for Coordination Advancement of quality of progression,
e.g., classical MAXBAND[33] and recent AMBAND[68]Optimization of a performance index,
e.g., MITROP[34]Offline offset method, e.g., detector-free
method[98,40,41,46]Online priority-based method,
e.g., adaptive coordination method[19,32,42]Traffic model Microscopic/ macroscopic/ mesoscopic models Mostly microscopic models * Summarized from previous Tables 3 & 7, where further details of the above notations are available. Table 9.
Fine classifications of traditional (non-CV-based) and CV-based signal coordination*.
-
Data Type Spatial-temporal
property of traffic dataCost* Extra proactive data Pros/
ConsStatic sensor data Instantaneous data at fixed location High No Cons Mobile sensor (CV) data Full penetration Complete spatial and temporal CV data, high frequency of data exchange Low Yes, e.g., priority request data Pros Low penetration Limited CV data Cons Large missing of non-CV data * Usually considering the installation and maintenance cost. Table 10.
Summary of the data comparisons and limitations for both the static and mobile sensor data.
-
Low penetration
rate issueLimited CV data issue Missing of non-CV data issue CV
applicationsMin Pcv Proposed methods Goodall et al.[94] in 2014 n/a Micro-simulation-based estimation
of the non-CV positionCV-ASC 10%−25% Feng et al.[1] in 2015 n/a EVLS algorithm CV-ASC 25%−50% Day et al.[98, 40, 41, 46] from
2016 to 2018Historical limited CV data-based aggregation n/a detector-free coordination 5%,
15 mins
changeBeak et al.[19] in 2017 Stop-bar detector-assisted method n/a adaptive coordination 25% Feng et al.[87] in 2018 Probabilistic model based on both prior arrival distribution and historical CV data n/a CV-ASC 10% Al Islam et al.[90 ] in 2020 Spatial vehicle distribution estimation by CVs vehicle trajectories via both the loop and CV data CV-ASC and coordination 0%, 10% Li et al.[91, 92] in 2021 Vehicle-triggered platoon dispersion n/a CV-based coordination 5%, 10% Mo et al.[93] in 2022 Decentralized learning method n/a CV-ASC 10% Zhang et al.[104] in 2022 Bayesian deduction n/a CV-ASC 5%, 10% Table 11.
Summary of studies targeting the low-penetration issue for urban signals.
-
Decade Typical UTCSs Dataa Global optimization formulation
and/or solution algorithmTraffic model 1960s TRANSYT in UK in 1968 Loop data Domain-constrained optimization DSM model[15] 1970s SCATS in Australia in 1979 SL, Loop data Strategic and tactical control Flow-delay profiles[15] SCOOT in UK in 1979 US, Loop data Domain-constrained optimization Flow-occupancy profiles, DSM model[15] DYPIC in UK in 1974 [108] US, Loop data Backward dynamic programming[108],
Rolling horizon approachDSM model 1980s -1990s OPAC in US in 1983[15] MB & SL, Loop data Complete enumeration / exhaustive enumeration[111, 112],
Rolling horizon
approachDSM model[15] RHODES in US in 1992[ 15] MB & SL, Loop data Dynamic programming[111, 112], Rolling horizon approach[30] DSM model[15] UTOPIA /SPOT in Italy in 1985[15] US & SL, Loop data Online dynamic optimization and off-line optimization[108] , Rolling horizon approach[113] DSM model PRODYN in France in 1984[108] US, Loop data Forward dynamic programming[111, 112] ,
Rolling horizon approach[109]DSM model 2000s ACS-lite in US in 2003[15] US, Loop data Domain-constrained optimization, three
levels of optimization methodologyDSM model 2010s Aboudolas et al. in 2010[109] AL, Loop data Quadratic programming, Rolling horizon approach SFM model Liu & Qiu in 2016[110] US & SL, Loop data Multi-objective optimization problem and
an evolutionary algorithmExtended SFM model Hao et al. in 2018[114, 115] US, Loop data Model predictive control-based method integrating optimizations CTM model Han et al. in 2018[116] n/a Linear quadratic model predictive control Extended CTM model Lu et al. in 2019[117] n/a Explicit model predictive control SFM model Pedroso and Batista in 2021[118] US Decentralized and decentralized-decoupled traffic-responsive urban control Decentralized SFM Souza et al. in 2022[119] Loop data, Historical data Integrating signal control and routing Multi-commodity SFM a SL = stop-line, MB = mid-block, US = upstream, AL = arbitrary location, adopted from Stevanovic et al. [15] and Aboudolas et al.[109]. Table 12.
Summary of traditional UTCSs applied different traffic models.
-
Typical UTCSs Dataa Rolling horizon approach Global optimization formulation and/or solution algorithm OPAC[15] MB & SL, Loop data Yes[15] Complete enumeration (CE) / exhaustive enumeration[111, 112] RHODES[15] MB & SL, Loop data Yes[30] Dynamic programming[ 111, 112] UTOPIA/SPOT[15] US & SL, Loop data Yes[113] Online dynamic optimization and off-line optimization[ 108] PRODYN[108] US, Loop data Yes[109] Forward dynamic programming[111, 112] DYPIC[ 108] US, Loop data Yes[ 108] Backward dynamic programming[ 108] Aboudolas et al.[109] in 2010 AL, Loop data Yes Quadratic programming Liu & Qiu[110] in 2016 US & SL, Loop data Yes Multi-objective optimization problem and an evolutionary algorithm Hao et al.[114, 115] in 2018 US, Loop data Yes MPC-based method integrating optimizations, CTM model Jamshidnejad et al.[141] in 2018 Loop data Yes Sustainable model-predictive control, S-model Han et al.[116] in 2018 Loop data Yes LQ-MPC, extended CTM, corridor Lu et al.[117] in 2019 Loop data Yes Explicit model predictive control (EMPC), SFM model Pedroso & Batista[118] in 2021 Loop data One-step Decentralized and decentralized-decoupled traffic-responsive urban control, Decentralized SFM Souza et al.[119] in 2022 Loop data Yes Integrating signal control and routing, Multi-commodity SFM a SL = stop-line, MB = mid-block, US = upstream, AL = arbitrary location, adopted from Stevanovic et al. [15] and Aboudolas et al. [109]. Table 13.
Summary of traditional UTCSs using the rolling horizon approach.
-
Typical works Platforma Intelligent strategy Control features Jin et al.[50] in 2017 Embedded device Fuzzy-based A fuzzy group-based approach, machine-to-machine connectivity Gao et al.[51] in 2017 Centralized structure Deep reinforcement learning-based Convolutional neural network for automatic feature crafting, experience replay and target network for stability Wu et al.[143] in 2019 Edge computing Deep reinforcement learning-based Distributed reinforcement learning Zhou et al.[144] in 2021 Hierarchical structure Deep reinforcement learning-based Multi-agent training with rich CV data, hierarchical control Zhang et al.[145] in 2021 Edge computing Deep reinforcement learning-based Multi-agent actor-critic control, value decomposition, a cooperative scheme Wu et al.[146] in 2022, Edge computing Deep reinforcement learning-based Game theory-aided reinforcement learning Wang et al.[147] in 2022 Edge computing Deep reinforcement learning-based Social features and connections Mo et al.[93] in 2022 Decentralized Deep reinforcement learning-based Asymmetric advantage actor-critic, non-CV, and CV data for offline training, CV data for online control Chen et al.[142] in 2022 Edge, distributed Distributed dynamic route-based Distributed backpressure principle, dynamic route control Table 14.
Summary of UTCSs using modern intelligent approaches.
-
Authors CV data Rolling horizon approach Global optimization formulation
and/or solution algorithm*CV applications Benefit+ Gradinescu et al.[75] in 2007 Online No Static optimization1 CV-ASC 28.3%1 Priemer et al.[161] in 2009 No Dynamic optimization with DP &
Complete enumeration2aCV-ASC 24%1 Lee et al.[82] in 2013 No Static optimization1 CV-ASC 34%5 Cai et al.[80] in 2013 No Dynamic optimization2c CV-ASC 11.69%5 Pandit et al.[81] in 2013 No Dynamic optimization2c CV-ASC ~25%1 Kari et al.[83] in 2014 No Static optimization1 CV-ASC 57.31%1 Guler et al.[36] in 2014 No Dynamic optimization2c CV-ASC ~50%* Younes et al.[85] in 2016 No Scheduling algorithm2c CV-ASC 25%1 Islam et al.[88] in 2017 No Modified MILP1 CV-ASC 27%2 Liu et al.[39] in 2017 No Reinforcement learning2c CV-ASC ~30%3 PAMSCOD[42] and its variant [45]
in 2012 and 2014, respectivelyYes MILP2b CV-ASC 25%1 Goodall et al.[35] in 2013 Yes[16] Dynamic optimization with
rolling horizon2bCV-ASC 20%4 Feng et al.[1] and its variant[87]
in 2015 and 2018, respectivelyYes Hybrid structure2b CV-ASC 16.33%1 C.M. Day et al.[98, 40, 41, 46]
from 2016 to 2018Offline No Static optimization1 CV-based coordination − Priority-based method [32][42] in 2016 Online No Static optimization1 CV-based coordination 25%1 Beak et al.[19] in 2017 Online No Static optimization1 CV-based coordination 19%1 Al Islam et al.[90] in 2020 Online Yes Dynamic optimization with
rolling horizon2bCV-ASC and coordination 50%* Li et al.[91, 92] in 2021 Online Yes MPC3 CV-based coordination 35%1 Zhang et al.[104] in 2022 Offline & online No Deep reinforcement learning-based2c CV-ASC 66%1 Mo et al.[93] in 2022 Offline & online No Deep reinforcement learning-based2c CV-ASC 30%1 * 1 = static optimization-based control, 2a = dynamic optimization-based control with the DP, 2b = dynamic optimization-based control with the rolling horizon scheme, 2c = dynamic optimization-based control with other intelligent approaches, 3 = MPC. + index type: 1 delay, 2 queue length, 3 waiting time, 4 stop, 5 travel time, * combination. Table 15.
Summary of CV-based signal control systems.
Figures
(3)
Tables
(15)