-
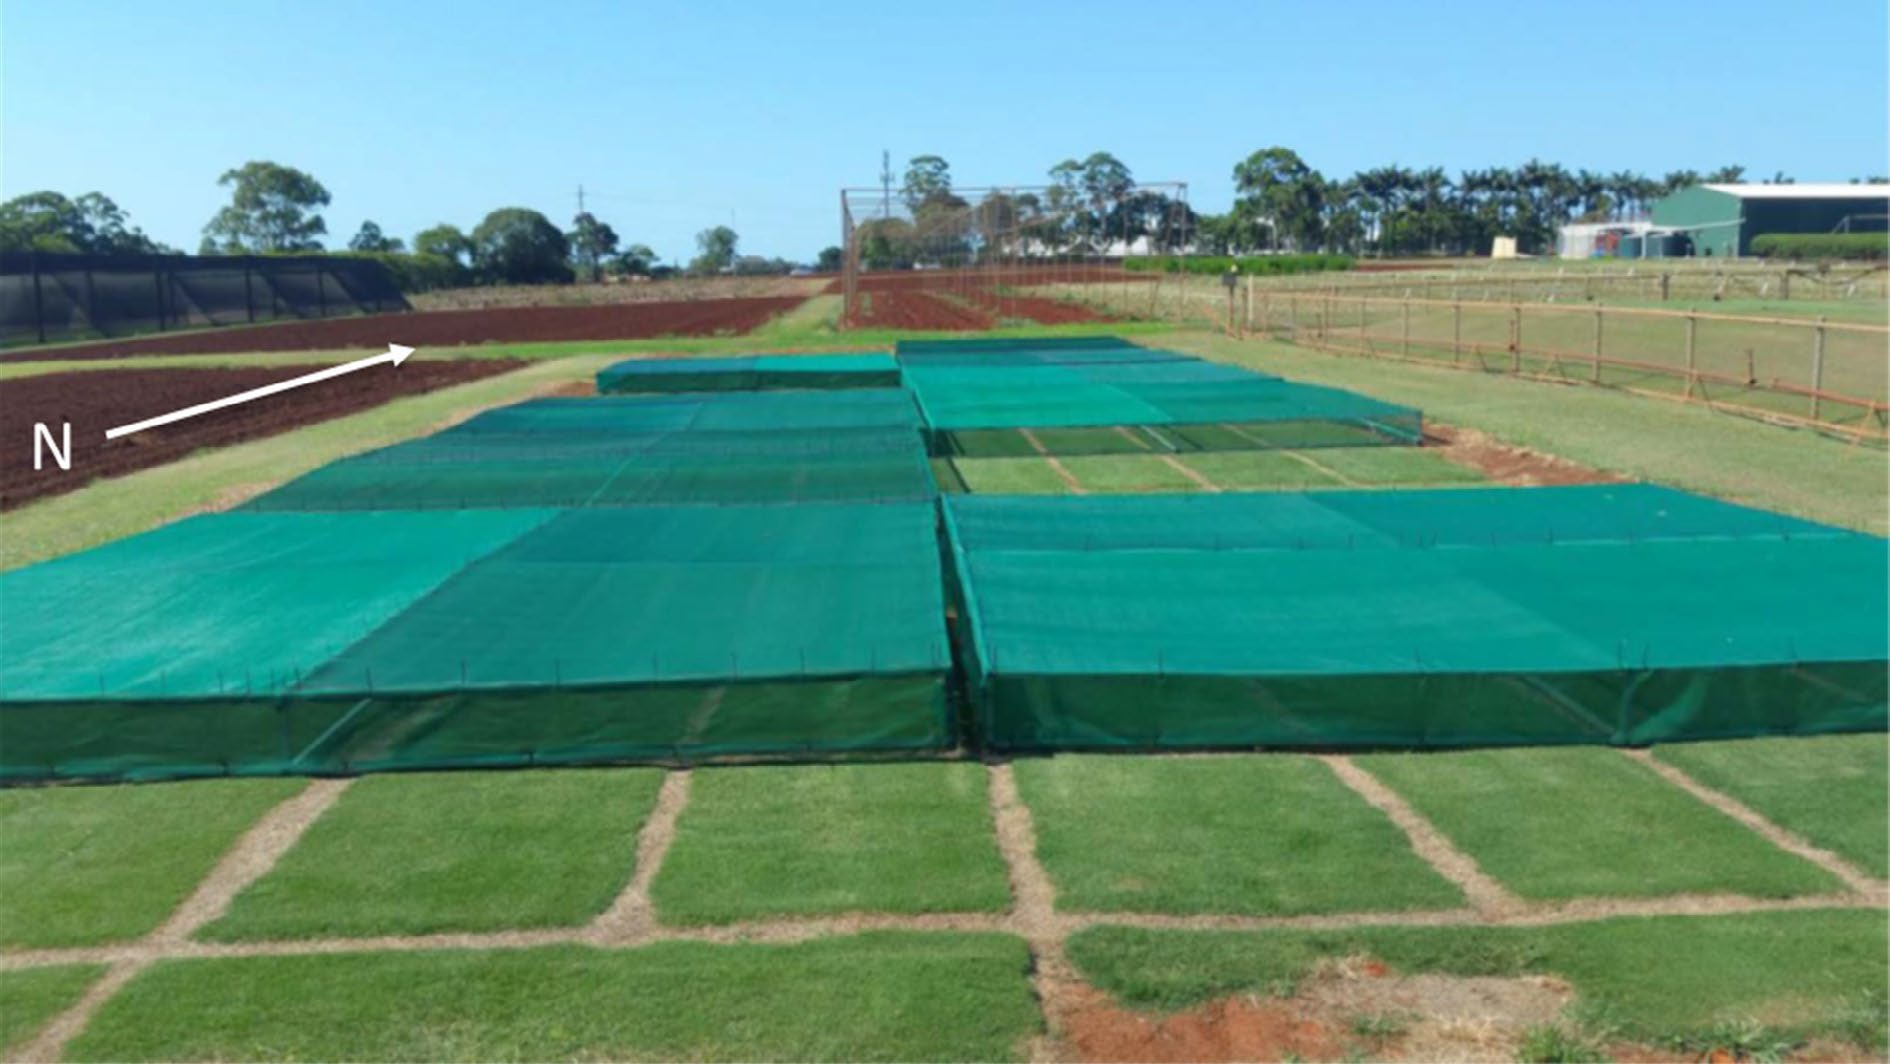
Figure 1.
Experimental plot with woven cloth providing different treatments estimated by the manufacturer to be a 30%, 50% and 70% reduction of PPF, with the uncovered quadrants serving as the controls. The eight different cultivars of Cynodon grasses were assessed for seven weeks to determine the effect of reduced PPF on the amount of biomass produced and cell wall composition. The woven cloth was removed weekly for sufficient time to allow clipping to be undertaken.
-
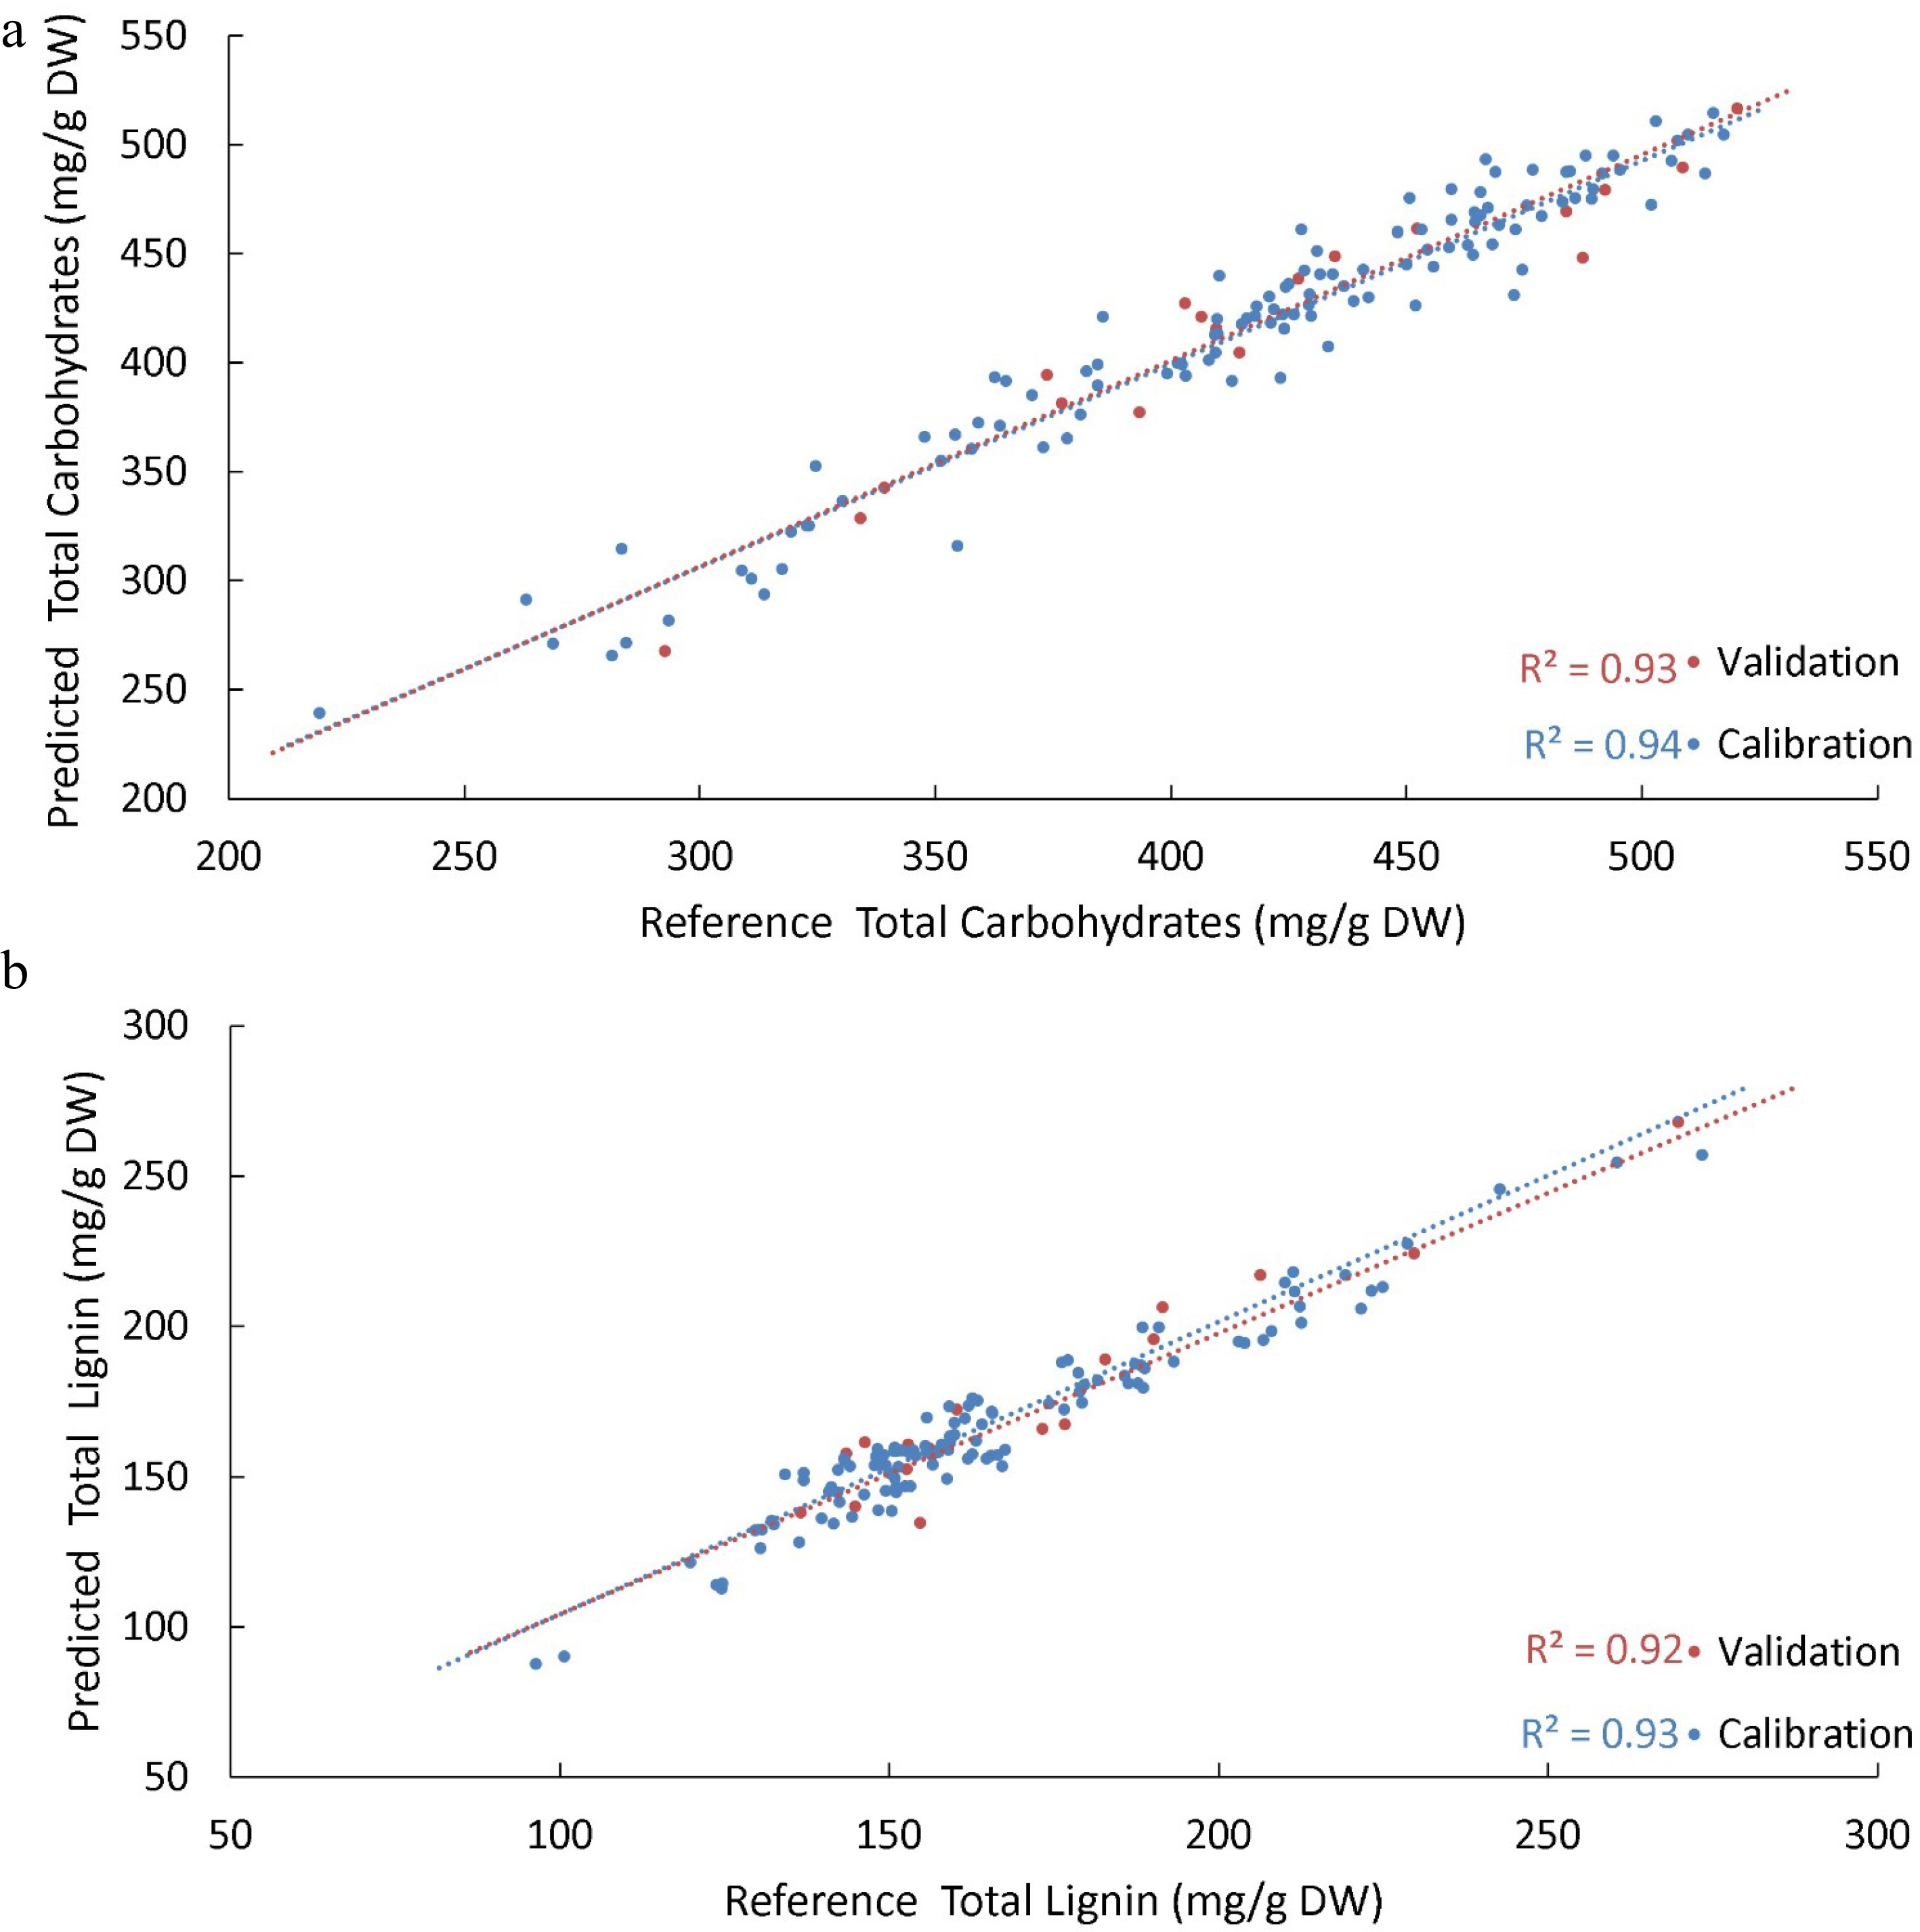
Figure 2.
PLSR models were generated to predict the various biomass components of Cynodon cultivars. (a) Shows the predicted values from the PLSR model developed for total carbohydrates present in the cell wall versus reference values for the same sample. (b) Shows the predicted versus reference values for total lignin present in the cell wall. For both models, a subset of data was withheld to be used as an independent validation set of samples (red); the R2 of the validation set was used to assess the robustness of the model in predicting unknown samples. A benchmark R2 of 0.90 for this validation set was nominally established for predictive models, which both achieved.
-
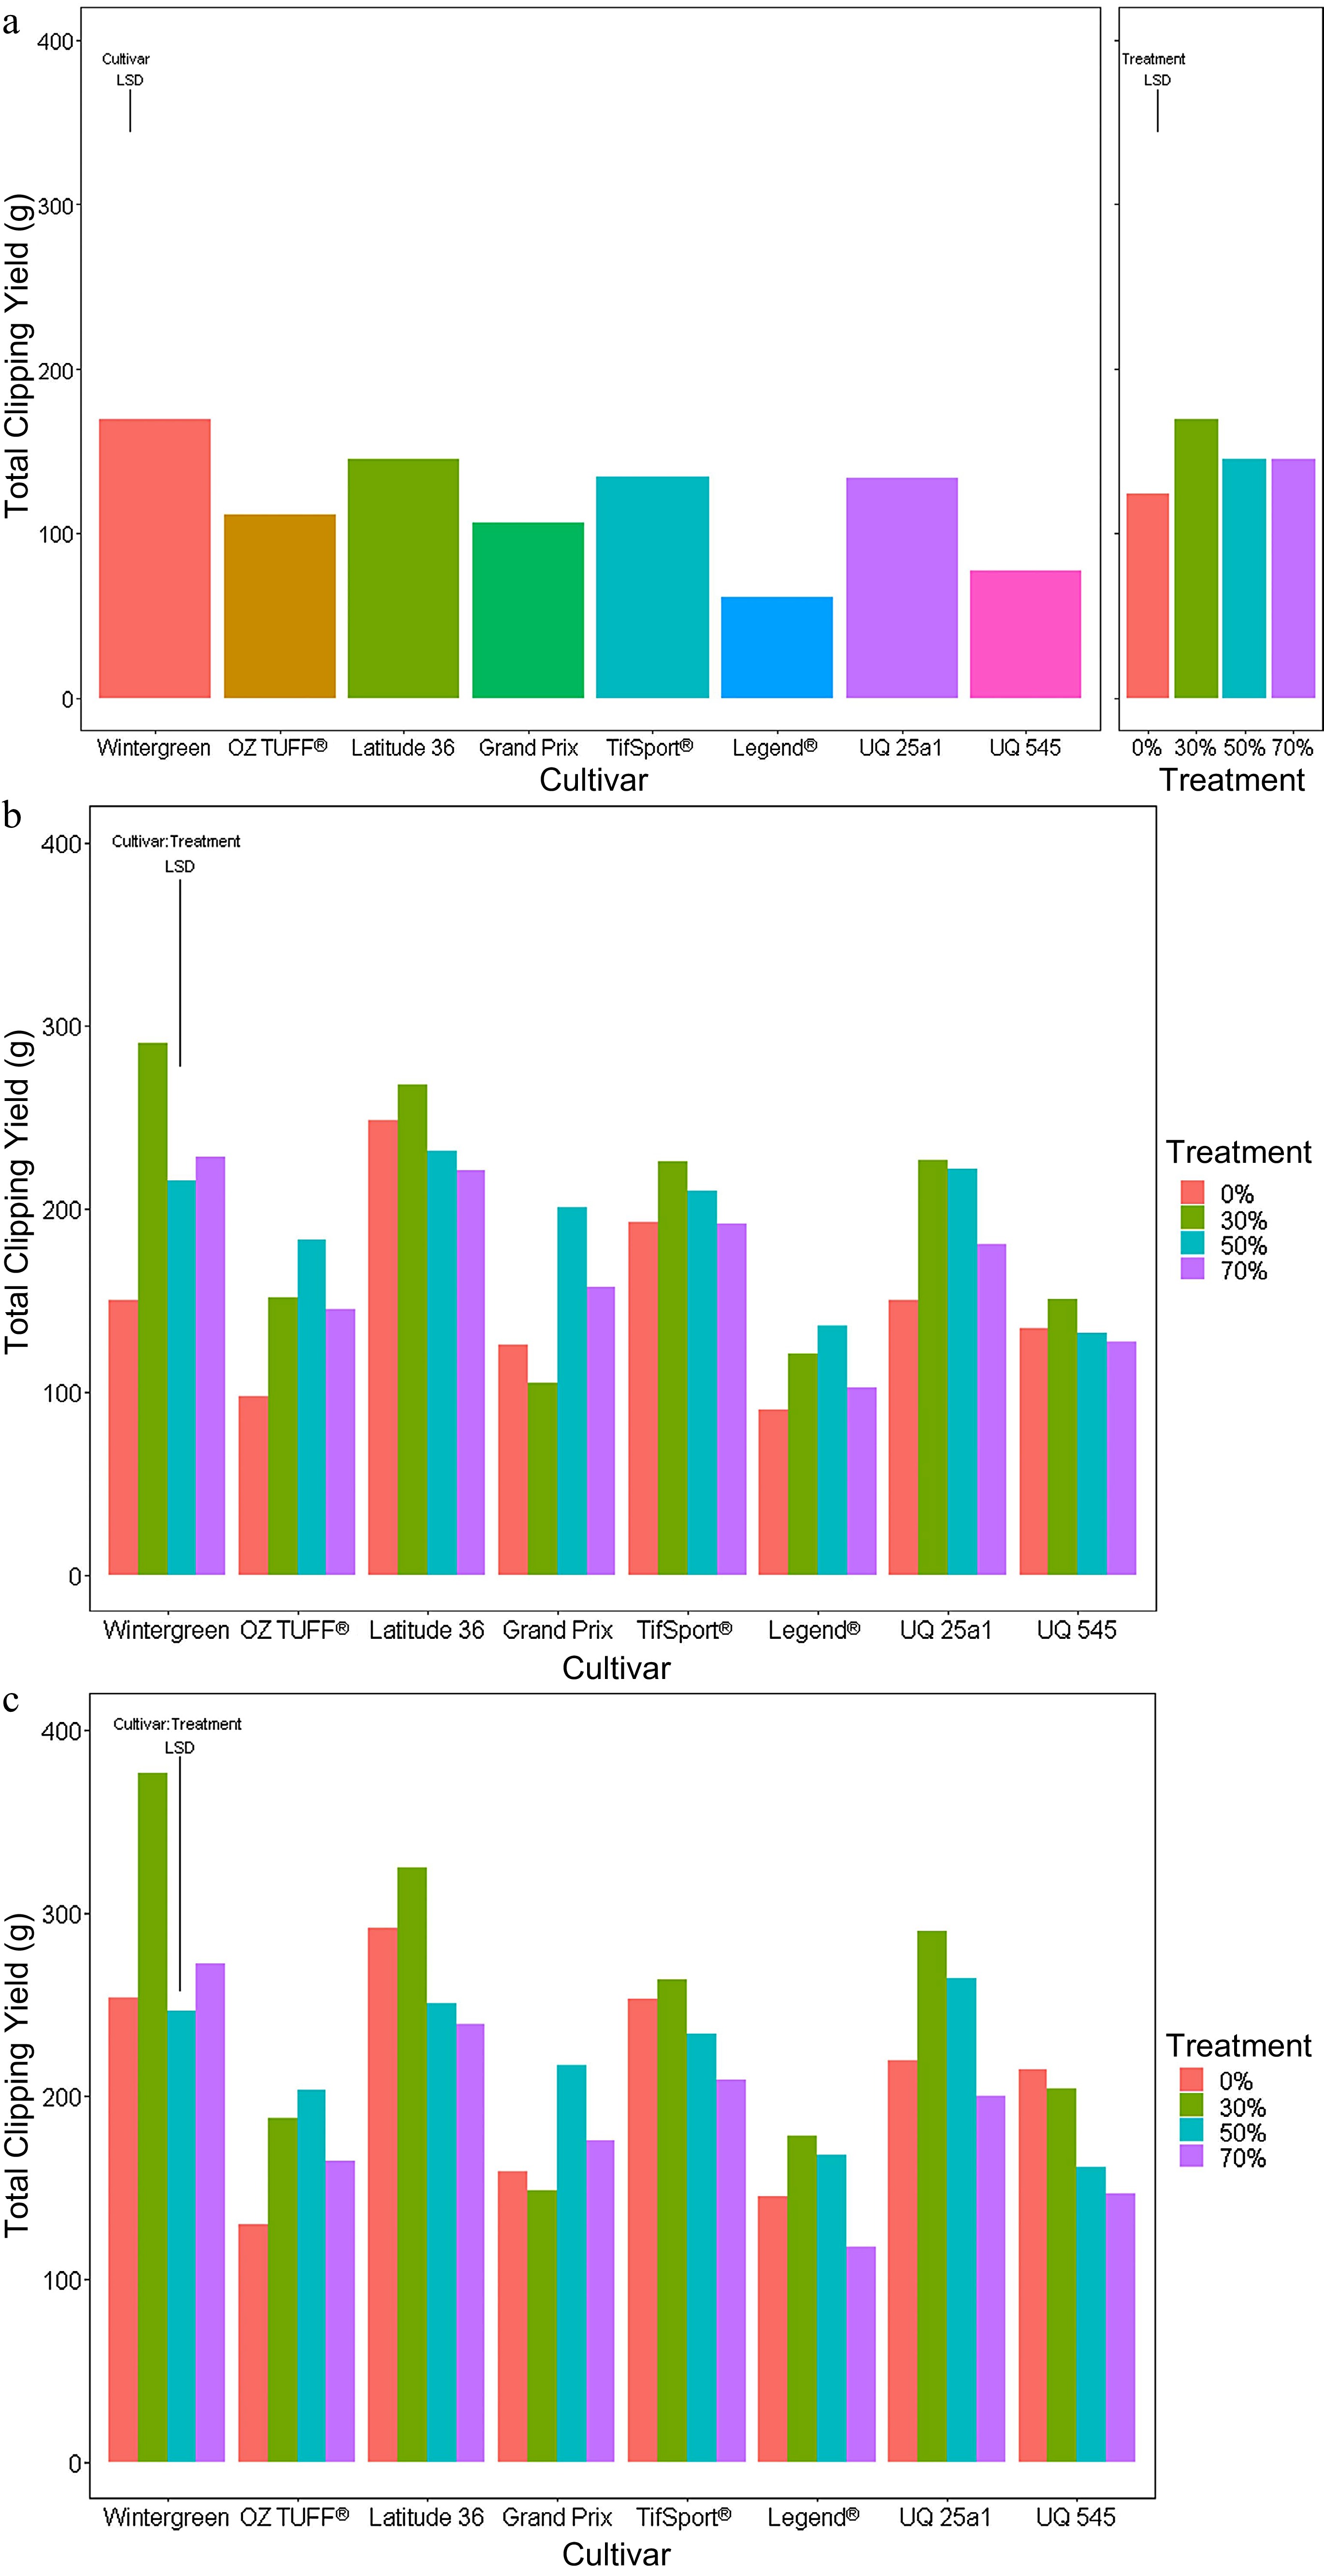
Figure 3.
Accumulated clipping yields of eight cultivars (Wintergreen, Oztuff®, Latitude 36®, Grandprix, TifSport®, Legend®, UQ 25a1 and UQ 545) of Cynodon grasses grown under different treatments; 0% control, 30%, 50% and 70% reduced PPF. The accumulated clipping yield was assessed at three time points, (a) short (weeks 1−2), (b) medium (weeks 1−5) and (c) long (weeks 1−7) periods. Significance was determined based on an LSD post hoc ANOVA analysis with an alpha value of 0.05.
-
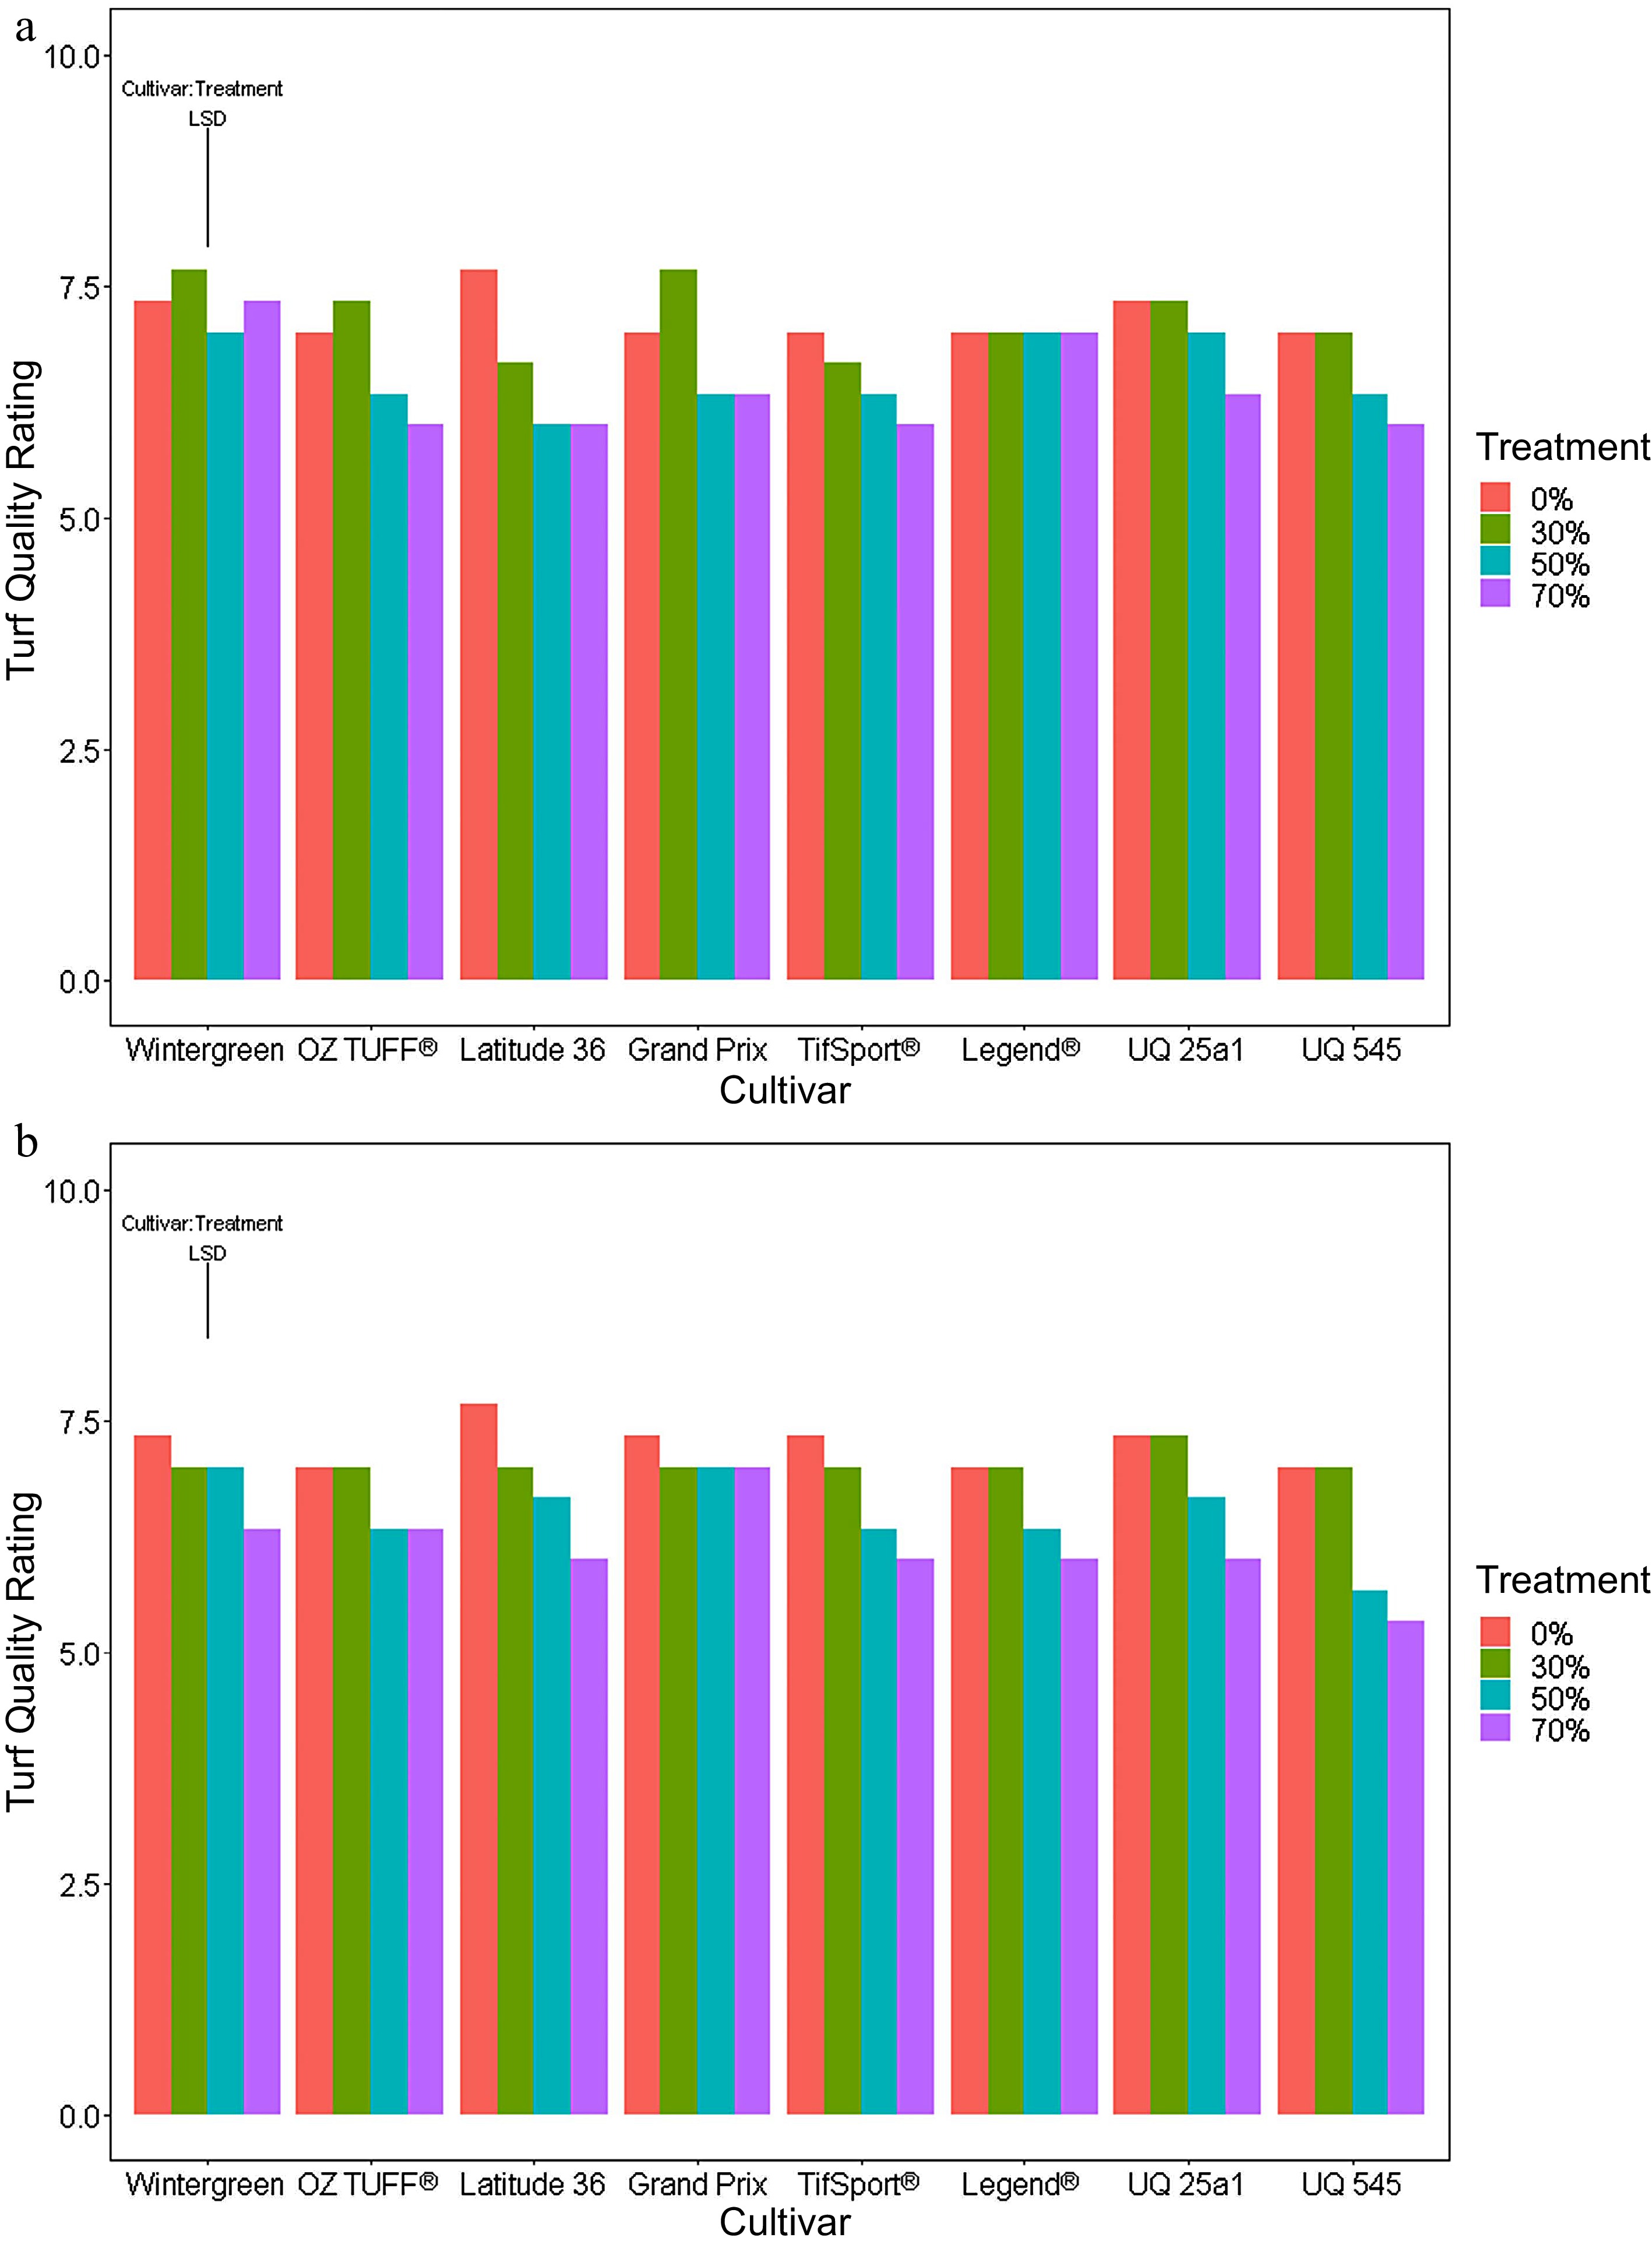
Figure 4.
Mean turf quality scores in the final week of the (a) medium (week 5) and (b) long periods (week 7) using a split plot analysis ANOVA. The ANOVA revealed there were significant interactions between the two main effects cultivar and reduced PPF treatments for both periods and so a LSD was calculated for cultivar: treatment with a significance p value set at < 0.05.
-
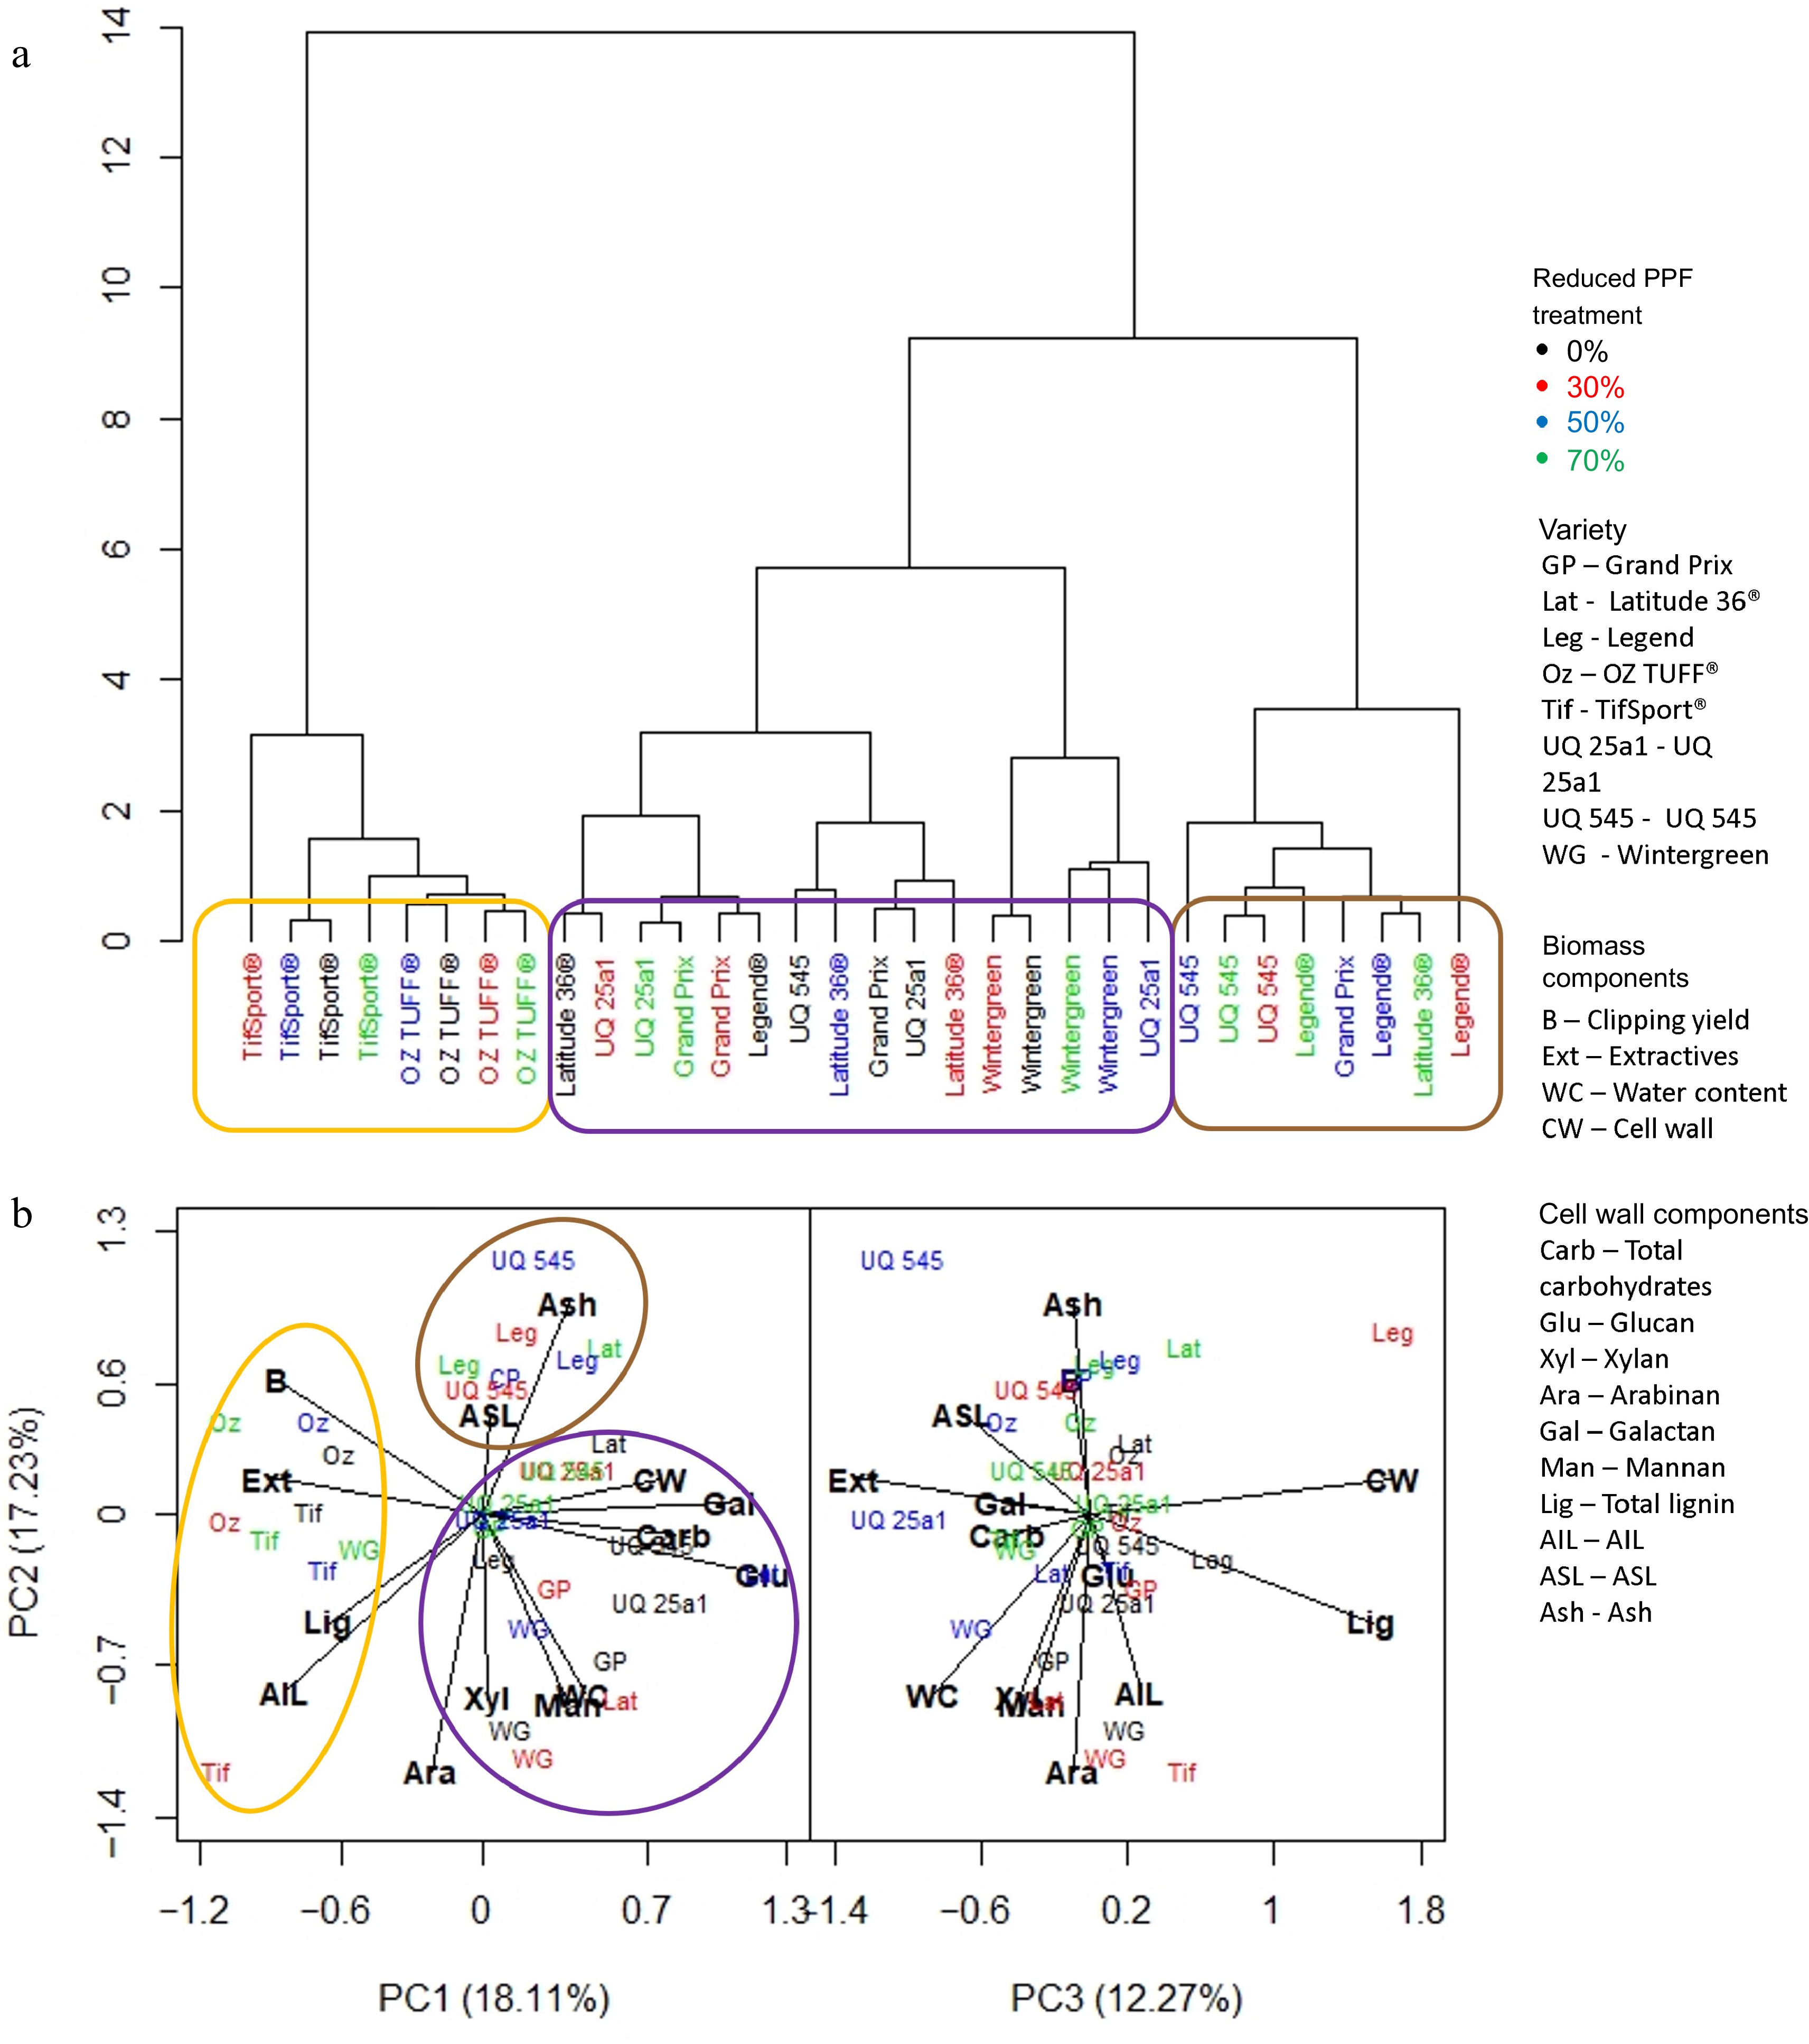
Figure 5.
(a) Dendrogram based on standardized means derived from each trait investigated and the influence of cultivar and reduced PPF treatments on that trait at the final week (week two) of the short period (weeks 1−2). (b) PCA analysis was generated from the same dataset, showing which trait was associated with cultivar or reduced PPF treatment. Clusters identified in the dendrogram are circled and highlighted in the PCA analysis.
-
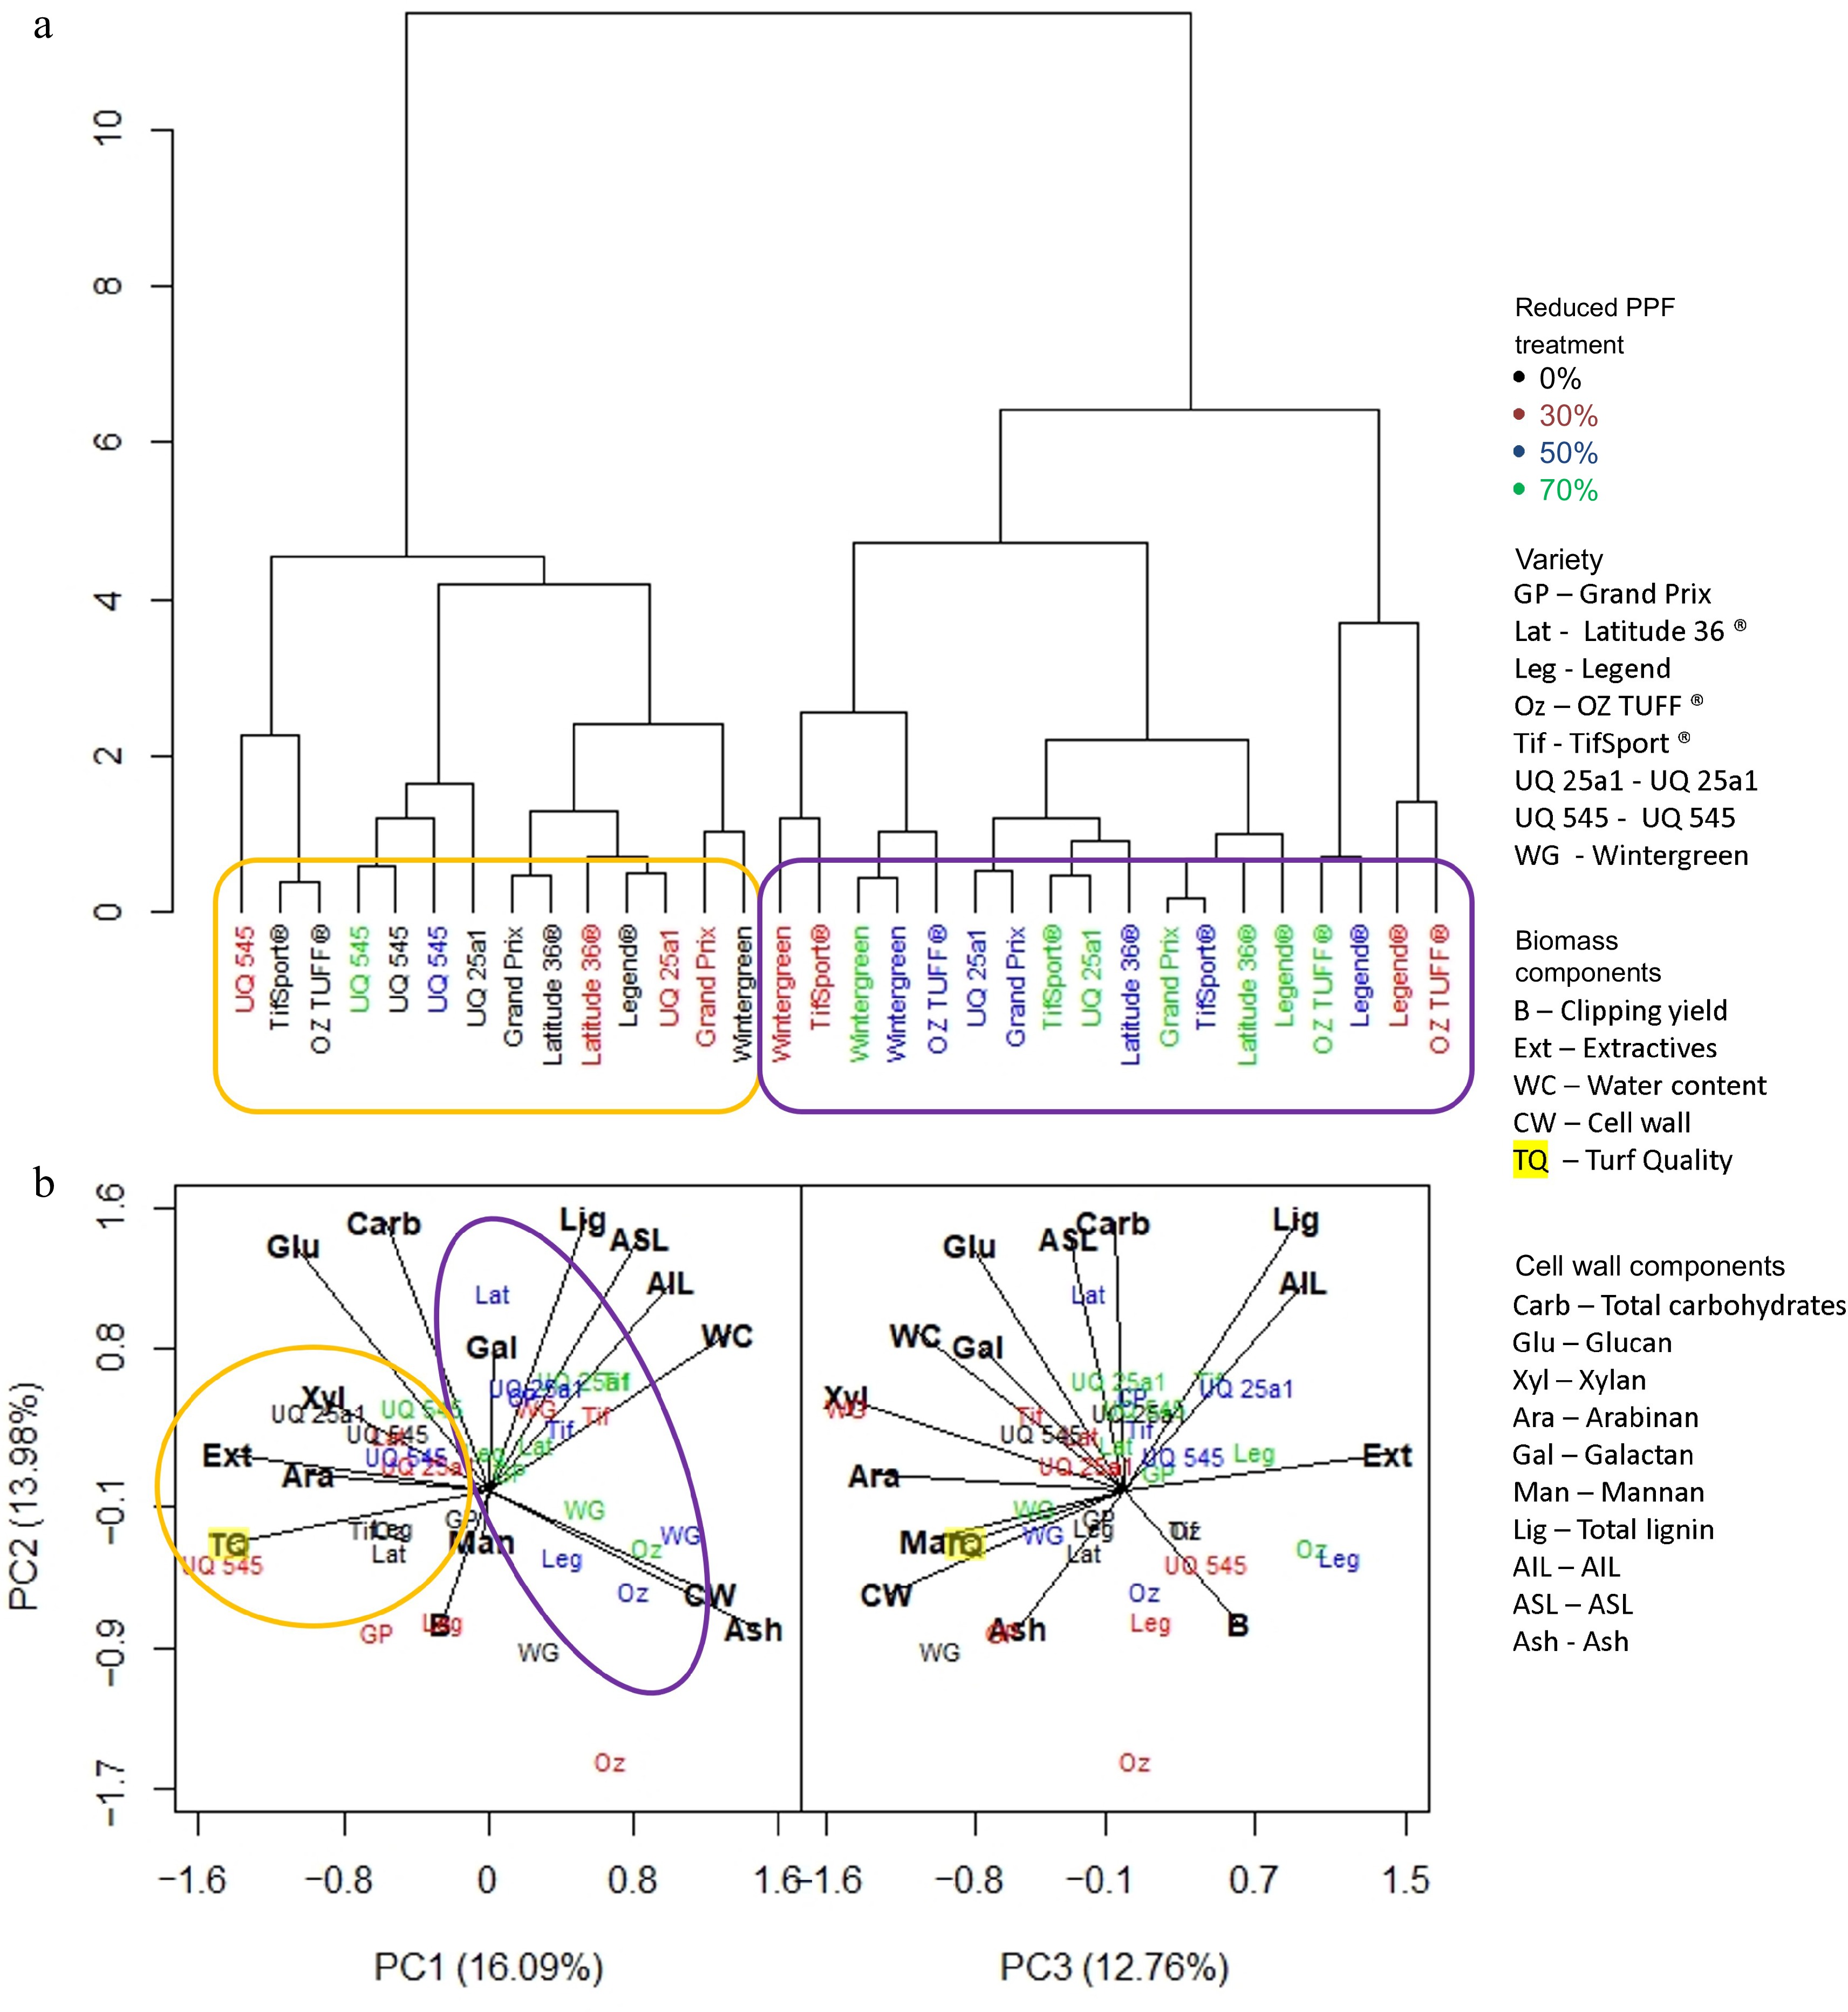
Figure 6.
(a) Dendrogram based on standardized means derived from each trait investigated and the influence of cultivar and reduced PPF treatments on that trait at the final week (week five) of the medium period (weeks 1−5). (b) PCA analysis was generated from the same dataset, showing which trait was associated with cultivar or reduced PPF treatment. Clusters identified in the dendrogram are circled and highlighted in the PCA analysis.
-
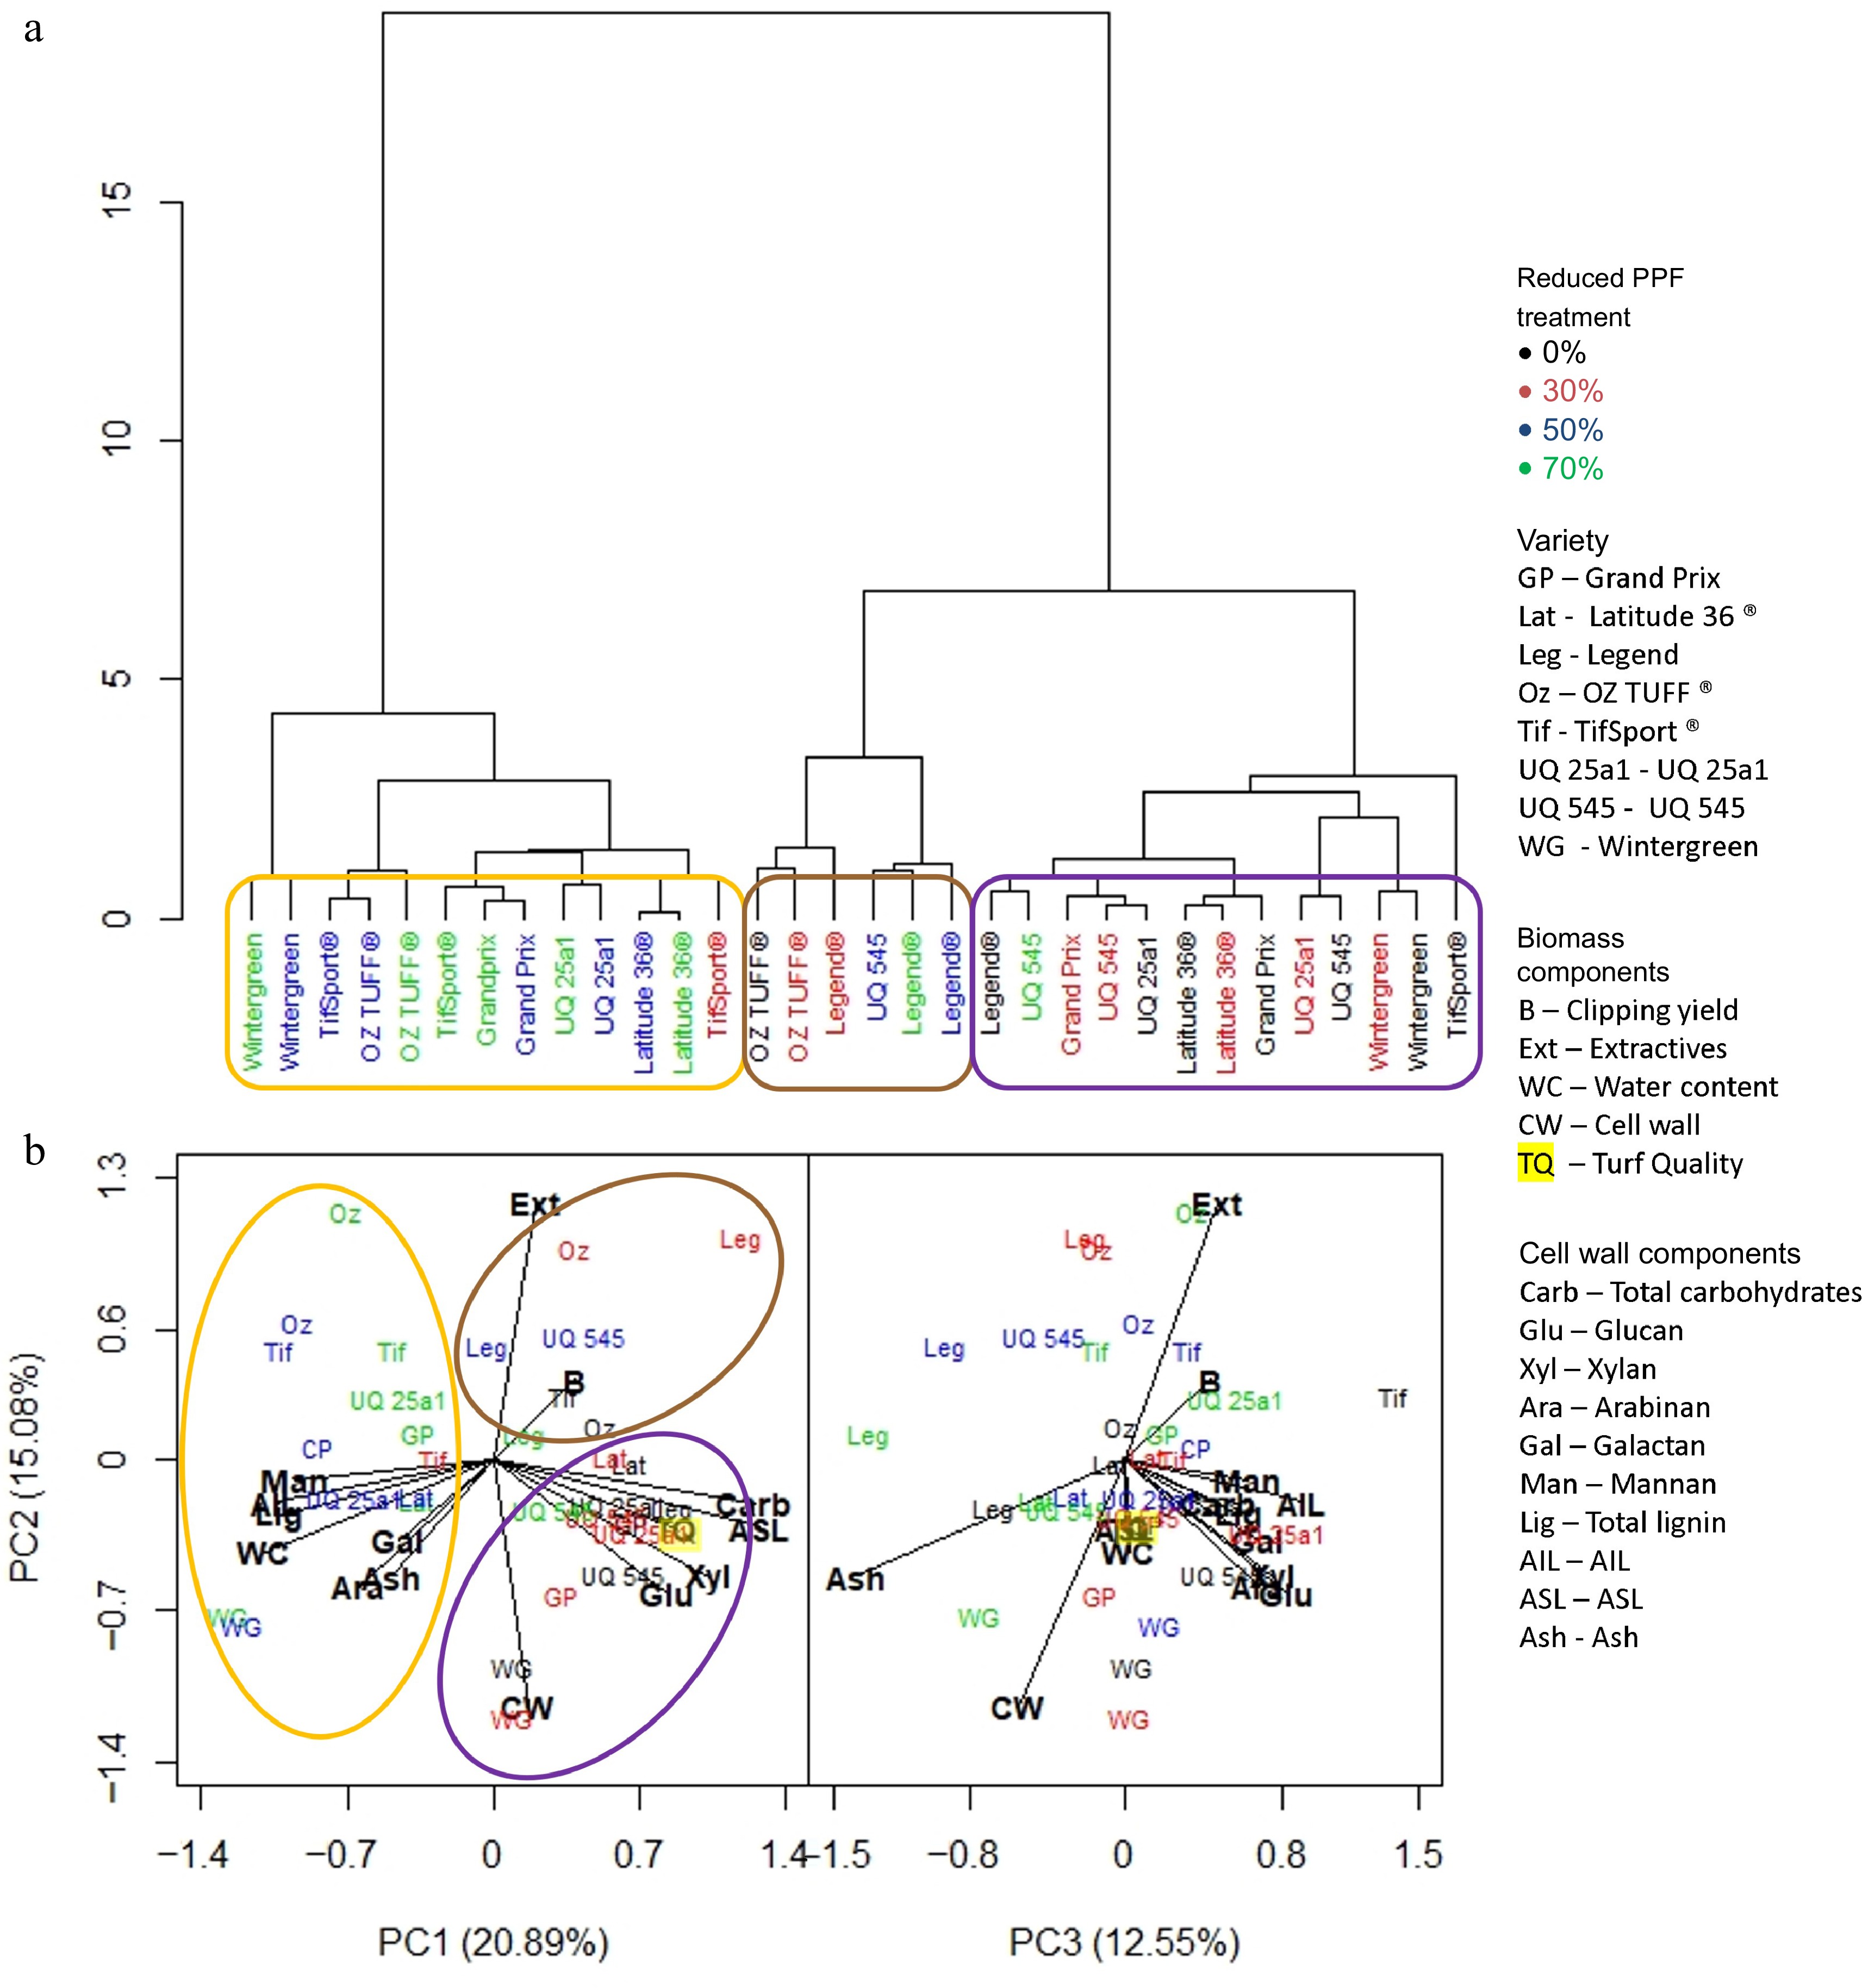
Figure 7.
(a) Dendrogram based on standardized means derived from each trait investigated and the influence of cultivar and reduced PPF treatments on that trait at the final week (week 7) of the long period (weeks 1−7). (b) PCA analysis was generated from the same dataset showing which trait was associated with cultivar or reduced PPF treatment. Clusters identified in the dendrogram are circled and highlighted in the PCA analysis.
-
Reduced PPF treatment Actual mean PPF
(μmol·m−2·s−1)Theoretical mean PPF
(μmol·m−2·s−1)R:FR
ratio0% Reduced PPF 1,537 1,537 1.27 30% Reduced PPF 1,022 1,075 1.23 50% Reduced PPF 679 768 1.16 70% Reduced PPF 337 461 1.02 Table 1.
Mean weekly PPF measurements (μmol·m−2·s−1) were recorded at midday using a LiCor LI6400XT® external light sensor for each plot established in the experimental design. The theoretical mean based on the manufacturer's ratings and the ratio of R:FR light received by the plant were also calculated.
-
Short period Medium period Long period Cultivar *** *** *** Treatment *** *** *** Cultivar : Treatment *** ** Table 2.
ANOVA analysis results for clipping yields at the short, medium and long period time points for eight cultivars of Cynodon grasses grown under 0% (control), 30%, 50% and 70% reduced PPF. At all periods, there were significant differences between cultivars and reduced PPF treatments. It was also found that there were significant interactions between cultivar and treatment at the medium and long periods. Significance determined by p-value (* < 0.05, ** < 0.01, *** < 0.001).
Figures
(7)
Tables
(2)