2023 Volume 3
Article Contents
About this article
ARTICLE   Open Access    

The application of Fourier Transform Infra-Red spectrometry to assess the impact of changes in Photosynthetic Photon Flux on cell wall components and turf quality of different cultivars of Cynodon grasses

More Information
  • The impact of decreased Photosynthetic Photon Flux (PPF) on the biomass and quality of Cynodon turf grasses are of considerable interest to the turf community, however there is little available data regarding its effect upon cell walls. Fourier Transform Infra-Red (FTIR)-based Partial Least Squares Regression (PLSR) models are useful for assessing the cell wall composition of a multitude of samples in a high-throughput manner. Such models were generated to predict cell wall components, water and extractive non-cell wall content of Cynodon grass biomass to determine if different levels of PPF imposed by woven polyester cloth influenced the cell wall composition of six cultivars of C. dactylon and two hybrid cultivars of C. dactylon × C. transvaalensis. The trial ran over seven weeks, and cell wall composition was assessed at three time points, week two (short period), week five (medium period) and week seven (long period). Cultivar had the strongest influence on cell wall composition in the short period, while at the end of the long period, reduced PPF was the more influential factor affecting the composition of the cell wall. At the final experimental time point, turf quality was negatively correlated with reduced PPF (50% and 70% reduction), total lignin and Acid Insoluble Lignin (AIL) and positively correlated with higher PPF (30% and 0% reduction) carbohydrates and Acid Soluble Lignin (ASL). It is proposed that the defense response pathway was preferred over the typical shade avoidance responses due to the weekly clipping regime confounding the response to reductions in PPF, leading to higher percentages of lignin, ash and lower carbohydrate content in the cell wall of Cynodon grasses.
  • Aquaporins (AQPs) constitute a large family of transmembrane channel proteins that function as regulators of intracellular and intercellular water flow[1,2]. Since their first discovery in the 1990s, AQPs have been found not only in three domains of life, i.e., bacteria, eukaryotes, and archaea, but also in viruses[3,4]. Each AQP monomer is composed of an internal repeat of three transmembrane helices (i.e., TM1–TM6) as well as two half helixes that are formed by loop B (LB) and LE through dipping into the membrane[5]. The dual Asn-Pro-Ala (NPA) motifs that are located at the N-terminus of two half helixes act as a size barrier of the pore via creating an electrostatic repulsion of protons, whereas the so-called aromatic/arginine (ar/R) selectivity filter (i.e., H2, H5, LE1, and LE2) determines the substrate specificity by rendering the pore constriction site diverse in both size and hydrophobicity[59]. Based on sequence similarity, AQPs in higher plants could be divided into five subfamilies, i.e., plasma membrane intrinsic protein (PIP), tonoplast intrinsic protein (TIP), NOD26-like intrinsic protein (NIP), X intrinsic protein (XIP), and small basic intrinsic protein (SIP)[1017]. Among them, PIPs, which are typically localized in the cell membrane, are most conserved and play a central role in controlling plant water status[12,1822]. Among two phylogenetic groups present in the PIP subfamily, PIP1 possesses a relatively longer N-terminus and PIP2 features an extended C-terminus with one or more conserved S residues for phosphorylation modification[5,15,17].

    Tigernut (Cyperus esculentus L.), which belongs to the Cyperaceae family within Poales, is a novel and promising herbaceous C4 oil crop with wide adaptability, large biomass, and short life period[2327]. Tigernut is a unique species accumulating up to 35% oil in the underground tubers[2830], which are developed from stolons and the process includes three main stages, i.e., initiation, swelling, and maturation[3133]. Water is essential for tuber development and tuber moisture content maintains a relatively high level of approximately 85% until maturation when a significant drop to about 45% is observed[28,32]. Thereby, uncovering the mechanism of tuber water balance is of particular interest. Despite crucial roles of PIPs in the cell water balance, to date, their characterization in tigernut is still in the infancy[21]. The recently available genome and transcriptome datasets[31,33,34] provide an opportunity to address this issue.

    In this study, a global characterization of PIP genes was conducted in tigernut, including gene localizations, gene structures, sequence characteristics, and evolutionary patterns. Moreover, the correlation of CePIP mRNA/protein abundance with water content during tuber development as well as subcellular localizations were also investigated, which facilitated further elucidating the water balance mechanism in this special species.

    PIP genes reported in Arabidopsis (Arabidopsis thaliana)[10] and rice (Oryza sativa)[11] were respectively obtained from TAIR11 (www.arabidopsis.org) and RGAP7 (http://rice.uga.edu), and detailed information is shown in Supplemental Table S1. Their protein sequences were used as queries for tBLASTn[35] (E-value, 1e–10) search of the full-length tigernut transcriptome and genome sequences that were accessed from CNGBdb (https://db.cngb.org/search/assembly/CNA0051961)[31,34]. RNA sequencing (RNA-seq) reads that are available in NCBI (www.ncbi.nlm.nih.gov/sra) were also adopted for gene structure revision as described before[13], and presence of the conserved MIP (major intrinsic protein, Pfam accession number PF00230) domain in candidates was confirmed using MOTIF Search (www.genome.jp/tools/motif). To uncover the origin and evolution of CePIP genes, a similar approach was also employed to identify homologs from representative plant species, i.e., Carex cristatella (v1, Cyperaceae)[36], Rhynchospora breviuscula (v1, Cyperaceae)[37], and Juncus effusus (v1, Juncaceae)[37], whose genome sequences were accessed from NCBI (www.ncbi.nlm.nih.gov). Gene structure of candidates were displayed using GSDS 2.0 (http://gsds.gao-lab.org), whereas physiochemical parameters of deduced proteins were calculated using ProtParam (http://web.expasy.org/protparam). Subcellular localization prediction was conducted using WoLF PSORT (www.genscript.com/wolf-psort.html).

    Nucleotide and protein multiple sequence alignments were respectively conducted using ClustalW and MUSCLE implemented in MEGA6[38] with default parameters, and phylogenetic tree construction was carried out using MEGA6 with the maximum likelihood method and bootstrap of 1,000 replicates. Systematic names of PIP genes were assigned with two italic letters denoting the source organism and a progressive number based on sequence similarity. Conserved motifs were identified using MEME Suite 5.5.3 (https://meme-suite.org/tools/meme) with optimized parameters as follows: Any number of repetitions, maximum number of 15 motifs, and a width of 6 and 250 residues for each motif. TMs and conserved residues were identified using homology modeling and sequence alignment with the structure resolved spinach (Spinacia oleracea) SoPIP2;1[5].

    Synteny analysis was conducted using TBtools-II[39] as described previously[40], where the parameters were set as E-value of 1e-10 and BLAST hits of 5. Duplication modes were identified using the DupGen_finder pipeline[41], and Ks (synonymous substitution rate) and Ka (nonsynonymous substitution rate) of duplicate pairs were calculated using codeml in the PAML package[42]. Orthologs between different species were identified using InParanoid[43] and information from synteny analysis, and orthogroups (OGs) were assigned only when they were present in at least two species examined.

    Plant materials used for gene cloning, qRT-PCR analysis, and 4D-parallel reaction monitoring (4D-PRM)-based protein quantification were derived from a tigernut variety Reyan3[31], and plants were grown in a greenhouse as described previously[25]. For expression profiling during leaf development, three representative stages, i.e., young, mature, and senescing, were selected and the chlorophyll content was checked using SPAD-502Plus (Konica Minolta, Shanghai, China) as previously described[44]. Young and senescing leaves are yellow in appearance, and their chlorophyll contents are just half of that of mature leaves that are dark green. For diurnal fluctuation regulation, mature leaves were sampled every 4 h from the onset of light at 8 a.m. For gene regulation during tuber development, fresh tubers at 1, 5, 10, 15, 20, 25, and 35 d after tuber initiation (DAI) were collected as described previously[32]. All samples with three biological replicates were quickly frozen with liquid nitrogen and stored at −80 °C for further use. For subcellular localization analysis, tobacco (Nicotiana benthamiana) plants were grown as previously described[20].

    Tissue-specific expression profiles of CePIP genes were investigated using Illumina RNA-seq samples (150 bp paired-end reads) with three biological replicates for young leaf, mature leaf, sheath of mature leaf, shoot apex, root, rhizome, and three stages of developmental tuber (40, 85, and 120 d after sowing (DAS)), which are under the NCBI accession number of PRJNA703731. Raw sequence reads in the FASTQ format were obtained using fastq-dump, and quality control was performed using fastQC (www.bioinformatics.babraham.ac.uk/projects/fastqc). Read mapping was performed using HISAT2 (v2.2.1, https://daehwankimlab.github.io/hisat2), and relative gene expression level was presented as FPKM (fragments per kilobase of exon per million fragments mapped)[45].

    For qRT-PCR analysis, total RNA extraction and synthesis of the first-strand cDNA were conducted as previously described[24]. Primers used in this study are shown in Supplemental Table S2, where CeUCE2 and CeTIP41[25,33] were employed as two reference genes. PCR reaction in triplicate for each biological sample was carried out using the SYBR-green Mix (Takara) on a Real-time Thermal Cycler Type 5100 (Thermal Fisher Scientific Oy). Relative gene abundance was estimated with the 2−ΔΔCᴛ method and statistical analysis was performed using SPSS Statistics 20 as described previously[13].

    Raw proteomic data for tigernut roots, leaves, freshly harvested, dried, rehydrated for 48 h, and sprouted tubers were downloaded from ProteomeXchange/PRIDE (www.proteomexchange.org, PXD021894, PXD031123, and PXD035931), which were further analyzed using Maxquant (v1.6.15.0, www.maxquant.org). Three dominant members, i.e., CePIP1;1, -2;1, and -2;8, were selected for 4D-PRM quantification analysis, and related unique peptides are shown in Supplemental Table S3. Protein extraction, trypsin digestion, and LC-MS/MS analysis were conducted as described previously[46].

    For subcellular localization analysis, the coding region (CDS) of CePIP1;1, -2;1, and -2;8 were cloned into pNC-Cam1304-SubN via Nimble Cloning as described before[30]. Then, recombinant plasmids were introduced into Agrobacterium tumefaciens GV3101 with the helper plasmid pSoup-P19 and infiltration of 4-week-old tobacco leaves were performed as previously described[20]. For subcellular localization analysis, the plasma membrane marker HbPIP2;3-RFP[22] was co-transformed as a positive control. Fluorescence observation was conducted using confocal laser scanning microscopy imaging (Zeiss LMS880, Germany): The wavelength of laser-1 was set as 730 nm for RFP observation, where the fluorescence was excited at 561 nm; the wavelength of laser-2 was set as 750 nm for EGFP observation, where the fluorescence was excited at 488 nm; and the wavelength of laser-3 was set as 470 nm for chlorophyll autofluorescence observation, where the fluorescence was excited at 633 nm.

    As shown in Table 1, a total of 14 PIP genes were identified from eight tigernut scaffolds (Scfs). The CDS length varies from 831 to 882 bp, putatively encoding 276–293 amino acids (AA) with a molecular weight (MW) of 29.16–31.59 kilodalton (kDa). The theoretical isoelectric point (pI) varies from 7.04 to 9.46, implying that they are all alkaline. The grand average of hydropathicity (GRAVY) is between 0.344 and 0.577, and the aliphatic index (II) ranges from 94.57 to 106.90, which are consistent with the hydrophobic characteristic of AQPs[47]. As expected, like SoPIP2;1, all CePIPs include six TMs, two typical NPA motifs, the invariable ar/R filter F-H-T-R, five conserved Froger's positions Q/M-S-A-F-W, and two highly conserved residues corresponding to H193 and L197 in SoPIP2;1 that were proven to be involved in gating[5,48], though the H→F variation was found in CePIP2;9, -2;10, and -2;11 (Supplemental Fig. S1). Moreover, two S residues, corresponding to S115 and S274 in SoPIP2;1[5], respectively, were also found in the majority of CePIPs (Supplemental Fig. S1), implying their posttranslational regulation by phosphorylation.

    Table 1.  Fourteen PIP genes identified in C. esculentus.
    Gene name Locus Position Intron no. AA MW (kDa) pI GRAVY AI TM MIP
    CePIP1;1 CESC_15147 Scf9:2757378..2759502(–) 3 288 30.76 8.82 0.384 95.28 6 47..276
    CePIP1;2 CESC_04128 Scf4:3806361..3807726(–) 3 291 31.11 8.81 0.344 95.95 6 46..274
    CePIP1;3 CESC_15950 Scf54:5022493..5023820(+) 3 289 31.06 8.80 0.363 94.57 6 49..278
    CePIP2;1 CESC_15350 Scf9:879960..884243(+) 3 288 30.34 8.60 0.529 103.02 6 33..269
    CePIP2;2 CESC_00011 Scf30:4234620..4236549(+) 3 293 31.59 9.27 0.394 101.57 6 35..268
    CePIP2;3 CESC_00010 Scf30:4239406..4241658(+) 3 291 30.88 9.44 0.432 98.97 6 31..266
    CePIP2;4 CESC_05080 Scf46:307799..309544(+) 3 285 30.44 7.04 0.453 100.32 6 28..265
    CePIP2;5 CESC_05079 Scf46:312254..314388(+) 3 286 30.49 7.04 0.512 101.68 6 31..268
    CePIP2;6 CESC_05078 Scf46:316024..317780(+) 3 288 30.65 7.68 0.475 103.06 6 31..268
    CePIP2;7 CESC_05077 Scf46:320439..322184(+) 3 284 30.12 8.55 0.500 100.00 6 29..266
    CePIP2;8 CESC_14470 Scf2:4446409..4448999(+) 3 284 30.37 8.30 0.490 106.90 6 33..263
    CePIP2;9 CESC_02223 Scf1:2543928..2545778(–) 3 283 30.09 9.46 0.533 106.47 6 31..262
    CePIP2;10 CESC_10007 Scf27:1686032..1688010(–) 3 276 29.16 9.23 0.560 106.05 6 26..256
    CePIP2;11 CESC_10009 Scf27:1694196..1696175(–) 3 284 29.71 9.10 0.577 105.49 6 33..263
    AA: amino acid; AI: aliphatic index; GRAVY: grand average of hydropathicity; kDa: kilodalton; MIP: major intrinsic protein; MW: molecular weight; pI: isoelectric point; PIP: plasma membrane intrinsic protein; Scf: scaffold; TM: transmembrane helix.
     | Show Table
    DownLoad: CSV

    To uncover the evolutionary relationships, an unrooted phylogenetic tree was constructed using the full-length protein sequences of CePIPs together with 11 OsPIPs and 13 AtPIPs. As shown in Fig. 1a, these proteins were clustered into two main groups, corresponding to PIP1 and PIP2 as previously defined[10,49], and each appears to have evolved into several subgroups. Compared with PIP1s, PIP2s possess a relatively shorter N-terminal but an extended C-terminal with one conserved S residue (Supplemental Fig. S1). Interestingly, a high number of gene repeats were detected, most of which seem to be species-specific, i.e., AtPIP1;1/-1;2/-1;3/-1;4/-1;5, AtPIP2;1/-2;2/-2;3/-2;4/-2;5/-2;6, AtPIP2;7/-2;8, OsPIP1;1/-1;2/-1;3, OsPIP2;1/-2;4/-2;5, OsPIP2;2/-2;3, CePIP1;1/-1;2, CePIP2;2/-2;3, CePIP2;4/-2;5/-2;6/-2;7, and CePIP2;9/-2;10/-2;11, reflecting the occurrence of more than one lineage-specific whole-genome duplications (WGDs) after their divergence[50,51]. In Arabidopsis that experienced three WGDs (i.e. γ, β, and α) after the split with the monocot clade[52], AtPIP1;5 in the PIP1 group first gave rise to AtPIP1;1 via the γ WGD shared by all core eudicots[50], which latter resulted in AtPIP1;3, -1;4, and -1;2 via β and α WGDs; AtPIP2;1 in the PIP2 group first gave rise to AtPIP2;6 via the γ WGD, and they latter generated AtPIP2;2, and -2;5 via the α WGD (Supplemental Table S1). In rice, which also experienced three WGDs (i.e. τ, σ, and ρ) after the split with the eudicot clade[51], OsPIP1;2 and -2;3 generated OsPIP1;1 and -2;2 via the Poaceae-specific ρ WGD, respectively. Additionally, tandem, proximal, transposed and dispersed duplications also played a role on the gene expansion in these two species (Supplemental Table S1).

    Figure 1.  Structural and phylogenetic analysis of PIPs in C. esculentus, O. sativa, and A. thaliana. (a) Shown is an unrooted phylogenetic tree resulting from full-length PIPs with MEGA6 (maximum likelihood method and bootstrap of 1,000 replicates), where the distance scale denotes the number of amino acid substitutions per site. (b) Shown are the exon-intron structures. (c) Shown is the distribution of conserved motifs among PIPs, where different motifs are represented by different color blocks as indicated and the same color block in different proteins indicates a certain motif. (At: A. thaliana; Ce: C. esculentus; PIP: plasma membrane intrinsic protein; Os: O. sativa).

    Analysis of gene structures revealed that all CePIP and AtPIP genes possess three introns and four exons in the CDS, in contrast to the frequent loss of certain introns in rice, including OsPIP1;2, -1;3, -2;1, -2;3, -2;4, -2;5, -2;6, -2;7, and -2;8 (Fig. 1b). The positions of three introns are highly conserved, which are located in sequences encoding LB (three residues before the first NPA), LD (one residue before the conserved L involved in gating), and LE (18 residues after the second NPA), respectively (Supplemental Fig. S1). The intron length of CePIP genes is highly variable, i.e., 109–993 bp, 115–1745 bp, and 95–866 bp for three introns, respectively. By contrast, the exon length is relatively less variable: Exons 2 and 3 are invariable with 296 bp and 141 bp, respectively, whereas Exons 1 and 4 are of 277–343 bp and 93–132 bp, determining the length of N- and C-terminus of PIP1 and PIP2, respectively (Fig. 1b). Correspondingly, their protein structures were shown to be highly conserved, and six (i.e., Motifs 1–6) out of 15 motifs identified are broadly present. Among them, Motif 3, -2, -6, -1, and -4 constitute the conserved MIP domain. In contrast to a single Motif 5 present in most PIP2s, all PIP1s possess two sequential copies of Motif 5, where the first one is located at the extended N-terminal. In CePIP2;3 and OsPIP2;7, Motif 5 is replaced by Motif 13; in CePIP2;2, it is replaced by two copies of Motif 15; and no significant motif was detected in this region of CePIP2;10. PIP1s and PIP2s usually feature Motif 9 and -7 at the C-terminal, respectively, though it is replaced by Motif 12 in CePIP2;6 and OsPIP2;8. PIP2s usually feature Motif 8 at the N-terminal, though it is replaced by Motif 14 in CePIP2;2 and -2;3 or replaced by Motif 11 in CePIP2;10 and -2;11 (Fig. 1c).

    As shown in Fig. 2a, gene localization of CePIPs revealed three gene clusters, i.e., CePIP2;2/-2;3 on Scf30, CePIP2;4/-2;5/-2;6/-2;7 on Scf46, and CePIP2;10/-2;11 on Scf27, which were defined as tandem repeats for their high sequence similarities and neighboring locations. The nucleotide identities of these duplicate pairs vary from 70.5% to 91.2%, and the Ks values range from 0.0971 to 1.2778 (Table 2), implying different time of their birth. According to intra-species synteny analysis, two duplicate pairs, i.e., CePIP1;1/-1;2 and CePIP2;2/-2;4, were shown to be located within syntenic blocks (Fig. 2b) and thus were defined as WGD repeats. Among them, CePIP1;1/-1;2 possess a comparable Ks value to CePIP2;2/-2;3, CePIP1;1/-1;3, and CePIP2;4/-2;8 (1.2522 vs 1.2287–1.2778), whereas CePIP2;2/-2;4 harbor a relatively higher Ks value of 1.5474 (Table 2), implying early origin or fast evolution of the latter. While CePIP1;1/-1;3 and CePIP2;1/-2;8 were characterized as transposed repeats, CePIP2;1/-2;2, CePIP2;9/-2;10, and CePIP2;8/-2;10 were characterized as dispersed repeats (Fig. 2a). The Ks values of three dispersed repeats vary from 0.8591 to 3.0117 (Table 2), implying distinct times of origin.

    Figure 2.  Duplication events of CePIP genes and synteny analysis within and between C. esculentus, O. sativa, and A. thaliana. (a) Duplication events detected in tigernut. Serial numbers are indicated at the top of each scaffold, and the scale is in Mb. Duplicate pairs identified in this study are connected using lines in different colors, i.e., tandem (shown in green), transposed (shown in purple), dispersed (shown in gold), and WGD (shown in red). (b) Synteny analysis within and between C. esculentus, O. sativa, and A. thaliana. (c) Synteny analysis within and between C. esculentus, C. cristatella, R. breviuscula, and J. effusus. Shown are PIP-encoding chromosomes/scaffolds and only syntenic blocks that contain PIP genes are marked, i.e., red and purple for intra- and inter-species, respectively. (At: A. thaliana; Cc: C. cristatella; Ce: C. esculentus; Je: J. effusus; Mb: megabase; PIP: plasma membrane intrinsic protein; Os: O. sativa; Rb: R. breviuscula; Scf: scaffold; WGD: whole-genome duplication).
    Table 2.  Sequence identity and evolutionary rate of homologous PIP gene pairs identified in C. esculentus. Ks and Ka were calculated using PAML.
    Duplicate 1 Duplicate 2 Identity (%) Ka Ks Ka/Ks
    CePIP1;1 CePIP1;3 78.70 0.0750 1.2287 0.0610
    CePIP1;2 CePIP1;1 77.20 0.0894 1.2522 0.0714
    CePIP2;1 CePIP2;4 74.90 0.0965 1.7009 0.0567
    CePIP2;3 CePIP2;2 70.50 0.1819 1.2778 0.1424
    CePIP2;4 CePIP2;2 66.50 0.2094 1.5474 0.1353
    CePIP2;5 CePIP2;4 87.30 0.0225 0.4948 0.0455
    CePIP2;6 CePIP2;5 84.90 0.0545 0.5820 0.0937
    CePIP2;7 CePIP2;6 78.70 0.0894 1.0269 0.0871
    CePIP2;8 CePIP2;4 72.90 0.1401 1.2641 0.1109
    CePIP2;9 CePIP2;10 76.40 0.1290 0.8591 0.1502
    CePIP2;10 CePIP2;8 64.90 0.2432 3.0117 0.0807
    CePIP2;11 CePIP2;10 91.20 0.0562 0.0971 0.5783
    Ce: C. esculentus; Ka: nonsynonymous substitution rate; Ks: synonymous substitution rate; PIP: plasma membrane intrinsic protein.
     | Show Table
    DownLoad: CSV

    According to inter-species syntenic analysis, six out of 14 CePIP genes were shown to have syntelogs in rice, including 1:1, 1:2, and 2:2 (i.e. CePIP1;1 vs OsPIP1;3, CePIP1;3 vs OsPIP1;2/-1;1, CePIP2;1 vs OsPIP2;4, CePIP2;2/-2;4 vs OsPIP2;3/-2;2, and CePIP2;8 vs OsPIP2;6), in striking contrast to a single one found in Arabidopsis (i.e. CePIP1;2 vs AtPIP1;2). Correspondingly, only OsPIP1;2 in rice was shown to have syntelogs in Arabidopsis, i.e., AtPIP1;3 and -1;4 (Fig. 2b). These results are consistent with their taxonomic relationships that tigernut and rice are closely related[50,51], and also imply lineage-specific evolution after their divergence.

    As described above, phylogenetic and syntenic analyses showed that the last common ancestor of tigernut and rice is more likely to possess only two PIP1s and three PIP2s. However, it is not clear whether the gene expansion observed in tigernut is species-specific or Cyperaceae-specific. To address this issue, recently available genomes were used to identify PIP subfamily genes from C. cristatella, R. breviuscula, and J. effuses, resulting in 15, 13, and nine members, respectively. Interestingly, in contrast to a high number of tandem repeats found in Cyperaceae species, only one pair of tandem repeats (i.e., JePIP2;3 and -2;4) were identified in J. effusus, a close outgroup species to Cyperaceae in the Juncaceae family[36,37]. According to homologous analysis, a total of 12 orthogroups were identified, where JePIP genes belong to PIP1A (JePIP1;1), PIP1B (JePIP1;2), PIP1C (JePIP1;3), PIP2A (JePIP2;1), PIP2B (JePIP2;2), PIP2F (JePIP2;3 and -2;4), PIP2G (JePIP2;5), and PIP2H (JePIP2;6) (Table 3). Further intra-species syntenic analysis revealed that JePIP1;1/-1;2 and JePIP2;2/-2;3 are located within syntenic blocks, which is consistent with CePIP1;1/-1;2, CePIP2;2/-2;4, CcPIP1;1/-1;2, CcPIP2;3/-2;4, RbPIP1;1/-1;2, and RbPIP2;2/-2;5 (Fig. 2c), implying that PIP1A/PIP1B and PIP2B/PIP2D were derived from WGDs occurred sometime before Cyperaceae-Juncaceae divergence. After the split with Juncaceae, tandem duplications frequently occurred in Cyperaceae, where PIP2B/PIP2C and PIP2D/PIP2E/PIP2F retain in most Cyperaceae plants examined in this study. By contrast, species-specific expansion was also observed, i.e., CePIP2;4/-2;5, CePIP2;10/-2;11, CcPIP1;2/-1;3, CcPIP2;4/-2;5, CcPIP2;8/-2;9, CcPIP2;10/-2;11, RbPIP2;3/-2;4, and RbPIP2;9/-2;10 (Table 3 & Fig. 2c).

    Table 3.  Twelve proposed orthogroups based on comparison of representative plant species.
    Orthogroup C. esculentus C. cristatella R. breviuscula J. effusus O. sativa A. thaliana
    PIP1A CePIP1;1 CcPIP1;1 RbPIP1;1 JePIP1;1 OsPIP1;3 AtPIP1;1, AtPIP1;2,
    AtPIP1;3, AtPIP1;4,
    AtPIP1;5
    PIP1B CePIP1;2 CcPIP1;2, CcPIP1;3 RbPIP1;2 JePIP1;2
    PIP1C CePIP1;3 CcPIP1;4 RbPIP1;3 JePIP1;3 OsPIP1;1, OsPIP1;2
    PIP2A CePIP2;1 CcPIP2;1 RbPIP2;1 JePIP2;1 OsPIP2;1, OsPIP2;4,
    OsPIP2;5
    AtPIP2;1, AtPIP2;2,
    AtPIP2;3, AtPIP2;4,
    AtPIP2;5, AtPIP2;6
    PIP2B CePIP2;2 CcPIP2;2 RbPIP2;2 JePIP2;2 OsPIP2;2, OsPIP2;3
    PIP2C CePIP2;3 CcPIP2;3 RbPIP2;3, RbPIP2;4
    PIP2D CePIP2;4, CePIP2;5 CcPIP2;4, CcPIP2;5 RbPIP2;5
    PIP2E CePIP2;5 CcPIP2;5 RbPIP2;6
    PIP2F CePIP2;6 CcPIP2;6
    PIP2G CePIP2;7 CcPIP2;7 RbPIP2;7 JePIP2;3, JePIP2;4
    PIP2H CePIP2;8 CcPIP2;8, CcPIP2;9 RbPIP2;8 JePIP2;5 OsPIP2;6 AtPIP2;7, AtPIP2;8
    PIP2I CePIP2;9, CePIP2;10,
    CePIP2;11
    CcPIP2;10, CcPIP2;11 RbPIP2;9, RbPIP2;10 JePIP2;6 OsPIP2;7, OsPIP2;8
    At: A. thaliana; Cc: C. cristatella; Ce: C. esculentus; Je: J. effuses; Os: O. sativa; Rb: R. breviuscula; PIP: plasma membrane intrinsic protein.
     | Show Table
    DownLoad: CSV

    Tissue-specific expression profiles of CePIP genes were investigated using transcriptome data available for young leaf, mature leaf, sheath, root, rhizome, shoot apex, and tuber. As shown in Fig. 3a, CePIP genes were mostly expressed in roots, followed by sheaths, moderately in tubers, young leaves, rhizomes, and mature leaves, and lowly in shoot apexes. In most tissues, CePIP1;1, -2;1, and -2;8 represent three dominant members that contributed more than 90% of total transcripts. By contrast, in rhizome, these three members occupied about 80% of total transcripts, which together with CePIP1;3 and -2;4 contributed up to 96%; in root, CePIP1;1, -1;3, -2;4, and -2;7 occupied about 84% of total transcripts, which together with CePIP2;1 and -2;8 contributed up to 94%. According to their expression patterns, CePIP genes could be divided into five main clusters: Cluster I includes CePIP1;1, -2;1, and -2;8 that were constitutively and highly expressed in all tissues examined; Cluster II includes CePIP2;2, -2;9, and -2;10 that were lowly expressed in all tested tissues; Cluster III includes CePIP1;2 and -2;11 that were preferentially expressed in young leaf and sheath; Cluster IV includes CePIP1;3 and -2;4 that were predominantly expressed in root and rhizome; and Cluster V includes remains that were typically expressed in root (Fig. 3a). Collectively, these results imply expression divergence of most duplicate pairs and three members (i.e. CePIP1;1, -2;1, and -2;8) have evolved to be constitutively co-expressed in most tissues.

    Figure 3.  Expression profiles of CePIP genes in various tissues, different stages of leaf development, and mature leaves of diurnal fluctuation. (a) Tissue-specific expression profiles of 14 CePIP genes. The heatmap was generated using the R package implemented with a row-based standardization. Color scale represents FPKM normalized log2 transformed counts, where blue indicates low expression and red indicates high expression. (b) Expression profiles of CePIP1;1, -2;1, and -2;8 at different stages of leaf development. (c) Expression profiles of CePIP1;1, -2;1, and -2;8 in mature leaves of diurnal fluctuation. Bars indicate SD (N = 3) and uppercase letters indicate difference significance tested following Duncan's one-way multiple-range post hoc ANOVA (p< 0.01). (Ce: C. esculentus; FPKM: Fragments per kilobase of exon per million fragments mapped; PIP: plasma membrane intrinsic protein)

    As shown in Fig. 3a, compared with young leaves, transcriptome profiling showed that CePIP1;2, -2;3, -2;7, -2;8, and -2;11 were significantly down-regulated in mature leaves, whereas CePIP1;3 and -2;1 were up-regulated. To confirm the results, three dominant members, i.e., CePIP1;1, -2;1, and -2;8, were selected for qRT-PCR analysis, which includes three representative stages, i.e., young, mature, and senescing leaves. As shown in Fig. 3b, in contrast to CePIP2;1 that exhibited a bell-like expression pattern peaking in mature leaves, transcripts of both CePIP1;1 and -2;8 gradually decreased during leaf development. These results were largely consistent with transcriptome profiling, and the only difference is that CePIP1;1 was significantly down-regulated in mature leaves relative to young leaves. However, this may be due to different experiment conditions used, i.e., greenhouse vs natural conditions.

    Diurnal fluctuation expression patterns of CePIP1;1, -2;1, and -2;8 were also investigated in mature leaves and results are shown in Fig. 3c. Generally, transcripts of all three genes in the day (8, 12, 16, and 20 h) were higher than that in the night (24 and 4 h). During the day, both CePIP1;1 and -2;8 exhibited an unimodal expression pattern that peaked at 12 h, whereas CePIP2;1 possessed two peaks (8 and 16 h) and their difference was not significant. Nevertheless, transcripts of all three genes at 20 h (onset of night) were significantly lower than those at 8 h (onset of day) as well as 12 h. In the night, except for CePIP2;1, no significant difference was observed between the two stages for both CePIP1;1 and -2;8. Moreover, their transcripts were comparable to those at 20 h (Fig. 3c).

    To reveal the expression patterns of CePIP genes during tuber development, three representative stages, i.e., 40 DAS (early swelling stage), 85 DAS (late swelling stage), and 120 DAS (mature stage), were first profiled using transcriptome data. As shown in Fig. 4a, except for rare expression of CePIP1;2, -2;2, -2;9, and -2;10, most genes exhibited a bell-like expression pattern peaking at 85 DAS, in contrast to a gradual decrease of CePIP2;3 and -2;8. Notably, except for CePIP2;4, other genes were expressed considerably lower at 120 DAS than that at 40 DAS. For qRT-PCR confirmation of CePIP1;1, -2;1, and -2;8, seven stages were examined, i.e., 1, 5, 10, 15, 20, 25, and 35 DAI, which represent initiation, five stages of swelling, and maturation as described before[32]. As shown in Fig. 4b, two peaks were observed for all three genes, though their patterns were different. As for CePIP1;1, compared with the initiation stage (1 DAI), significant up-regulation was observed at the early swelling stage (5 DAI), followed by a gradual decrease except for the appearance of the second peak at 20 DAI, which is something different from transcriptome profiling. As for CePIP2;1, a sudden drop of transcripts first appeared at 5 DAI, then gradually increased until 20 DAI, which was followed by a gradual decrease at two late stages. The pattern of CePIP2;8 is similar to -1;1, two peaks appeared at 5 and 20 DAI and the second peak was significantly lower than the first. The difference is that the second peak of CePIP2;8 was significantly lower than the initiation stage. By contrast, the second peak (20 DAI) of CePIP2;1 was significantly higher than that of the first one (1 DAI). Nevertheless, the expression patterns of both CePIP2;1 and -2;8 are highly consistent with transcriptome profiling.

    Figure 4.  Transcript and protein abundances of CePIP genes during tuber development. (a) Transcriptome-based expression profiling of 14 CePIP genes during tuber development. The heatmap was generated using the R package implemented with a row-based standardization. Color scale represents FPKM normalized log2 transformed counts, where blue indicates low expression and red indicates high expression. (b) qRT-PCR-based expression profiling of CePIP1;1, -2;1, and -2;8 in seven representative stages of tuber development. (c) Relative protein abundance of CePIP1;1, -2;1, and -2;8 in three representative stages of tuber development. Bars indicate SD (N = 3) and uppercase letters indicate difference significance tested following Duncan's one-way multiple-range post hoc ANOVA (p < 0.01). (Ce: C. esculentus; DAI: days after tuber initiation; DAS: days after sowing; FPKM: Fragments per kilobase of exon per million fragments mapped; PIP: plasma membrane intrinsic protein).

    Since protein abundance is not always in agreement with the transcript level, protein profiles of three dominant members (i.e. CePIP1;1, -2;1, and -2;8) during tuber development were further investigated. For this purpose, we first took advantage of available proteomic data to identify CePIP proteins, i.e., leaves, roots, and four stages of tubers (freshly harvested, dried, rehydrated for 48 h, and sprouted). As shown in Supplemental Fig. S2, all three proteins were identified in both leaves and roots, whereas CePIP1;1 and -2;8 were also identified in at least one of four tested stages of tubers. Notably, all three proteins were considerably more abundant in roots, implying their key roles in root water balance.

    To further uncover their profiles during tuber development, 4D-PRM-based protein quantification was conducted in three representative stages of tuber development, i.e., 1, 25, and 35 DAI. As expected, all three proteins were identified and quantified. In contrast to gradual decrease of CePIP2;8, both CePIP1;1 and -2;1 exhibited a bell-like pattern that peaked at 25 DAI, though no significant difference was observed between 1 and 25 DAI (Fig. 4c). The trends are largely in accordance with their transcription patterns, though the reverse trend was observed for CePIP2;1 at two early stages (Fig. 4b & Fig. 4c).

    As predicted by WoLF PSORT, CePIP1;1, -2;1, and -2;8 may function in the cell membrane. To confirm the result, subcellular localization vectors named pNC-Cam1304-CePIP1;1, pNC-Cam1304-CePIP2;1, and pNC-Cam1304-CePIP2;8 were further constructed. When transiently overexpressed in tobacco leaves, green fluorescence signals of all three constructs were confined to cell membranes, highly coinciding with red fluorescence signals of the plasma membrane marker HbPIP2;3-RFP (Fig. 5).

    Figure 5.  (a) Schematic diagram of overexpressing constructs, (b) subcellular localization analysis of CePIP1;1, -2;1, and -2;8 in N. benthamiana leaves. (35S: cauliflower mosaic virus 35S RNA promoter; Ce: C. esculentus; EGFP: enhanced green fluorescent protein; kb: kilobase; NOS: terminator of the nopaline synthase gene; RFP: red fluorescent protein; PIP: plasma membrane intrinsic protein).

    Water balance is particularly important for cell metabolism and enlargement, plant growth and development, and stress responses[2,19]. As the name suggests, AQPs raised considerable interest for their high permeability to water, and plasma membrane-localized PIPs were proven to play key roles in transmembrane water transport between cells[1,18]. The first PIP was discovered in human erythrocytes, which was named CHIP28 or AQP1, and its homolog in plants was first characterized in Arabidopsis, which is known as RD28, PIP2c, or AtPIP2;3[3,7,53]. Thus far, genome-wide identification of PIP genes have been reported in a high number of plant species, including two model plants Arabidopsis and rice[10,11,1317,5456]. By contrast, little information is available on Cyperaceae, the third largest family within the monocot clade that possesses more than 5,600 species[57].

    Given the crucial roles of water balance for tuber development and crop production, in this study, tigernut, a representative Cyperaceae plant producing high amounts of oil in underground tubers[28,30,32], was employed to study PIP genes. A number of 14 PIP genes representing two phylogenetic groups (i.e., PIP1 and PIP2) or 12 orthogroups (i.e., PIP1A, PIP1B, PIP1C, PIP2A, PIP2B, PIP2C, PIP2D, PIP2E, PIP2F, PIP2G, PIP2H, and PIP2I) were identified from the tigernut genome. Though the family amounts are comparative or less than 13–21 present in Arabidopsis, cassava (Manihot esculenta), rubber tree (Hevea brasiliensis), poplar (Populus trichocarpa), C. cristatella, R. breviuscula, banana (Musa acuminata), maize (Zea mays), sorghum (Sorghum bicolor), barley (Hordeum vulgare), and switchgrass (Panicum virgatum), they are relatively more than four to 12 found in eelgrass (Zostera marina), Brachypodium distachyon, foxtail millet (Setaria italic), J. effuses, Aquilegia coerulea, papaya (Carica papaya), castor been (Ricinus communis), and physic nut (Jatropha curcas) (Supplemental Table S4). Among them, A. coerulea represents a basal eudicot that didn't experience the γ WGD shared by all core eudicots[50], whereas eelgrass is an early diverged aquatic monocot that didn't experience the τ WGD shared by all core monocots[56]. Interestingly, though both species possess two PIP1s and two PIP2s, they were shown to exhibit complex orthologous relationships of 1:1, 2:2, 1:0, and 0:1 (Supplemental Table S5). Whereas AcPIP1;1/AcPIP1;2/ZmPIP1;1/ZmPIP1;2 and ZmPIP2;1/AcPIP2;1 belong to PIP1A and PIP2A identified in this study, AcPIP2;2 and ZmPIP2;2 belong to PIP2H and PIP2I, respectively (Supplemental Table S5), implying that the last common ancestor of monocots and eudicots possesses only one PIP1 and two PIP2s followed by clade-specific expansion. A good example is the generation of AtPIP1;1 and -2;6 from AtPIP1;5 and -2;1 via the γ WGD, respectively[17].

    In tigernut, extensive expansion of the PIP subfamily was contributed by WGD (2), transposed (2), tandem (5), and dispersed duplications (3). It's worth noting that, two transposed repeats (i.e., CePIP1;1/-1;3 and CePIP2;1/-2;8) are shared by rice, implying their early origin that may be generated sometime after the split with the eudicot clade but before Cyperaceae-Poaceae divergence. By contrast, two WGD repeats (i.e., CePIP1;1/-1;2 and CePIP2;2/-2;4) are shared by C. cristatella, R. breviuscula, and J. effusus but not rice and Arabidopsis, implying that they may be derived from WGDs that occurred sometime after Cyperaceae-Poaceae split but before Cyperaceae-Juncaceae divergence. The possible WGD is the one that was described in C. littledalei[58], though the exact time still needs to be studied. Interestingly, compared with Arabidopsis (1) and rice (2), tandem/proximal duplications played a more important role in the expansion of PIP genes in tigernut (5) as well as other Cyperaceae species tested (5–6), which were shown to be Cyperaceae-specific or even species-specific. These tandem repeats may play a role in the adaptive evolution of Cyperaceae species as described in a high number of plant species[14,41]. According to comparative genomics analyses, tandem duplicates experienced stronger selective pressure than genes formed by other modes (WGD, transposed duplication, and dispersed duplication) and evolved toward biased functional roles involved in plant self-defense[41].

    As observed in most species such as Arabidopsis[10,1417], PIP genes in all Cyperaceae and Juncaceae species examined in this study, i.e., tigernut, C. cristatella, R. breviuscula, and J. effuses, feature three introns with conserved positions. By contrast, zero to three introns was not only found in rice but also in other Poaceae species such as maize, sorghum, foxtail millet, switchgrass, B. distachyon, and barley[54,55], implying lineage/species-specific evolution.

    Despite the extensive expansion of PIP genes (PIP2) in tigernut even after the split with R. breviuscula, CePIP1;1, -2;1, and -2;8 were shown to represent three dominant members in most tissues examined in this study, i.e., young leaf, mature leaf, sheath, rhizome, shoot apex, and tuber, though the situation in root is more complex. CePIP1;1 was characterized as a transposed repeat of CePIP1;3, which represents the most expressed member in root. Moreover, its recent WGD repeat CePIP1;2 was shown to be lowly expressed in most tested tissues, implying their divergence. The ortholog of CePIP1;1 in rice is OsPIP1;3 (RWC-3), which was shown to be preferentially expressed in roots, stems, and leaves, in contrast to constitutive expression of OsPIP1;1 (OsPIP1a) and -1;2[5961], two recent WGD repeats. Injecting the cRNA of OsPIP1;3 into Xenopus oocytes could increase the osmotic water permeability by 2–3 times[60], though the activity is considerably lower than PIP2s such as OsPIP2;2 and -2;2[6163]. Moreover, OsPIP1;3 was shown to play a role in drought avoidance in upland rice and its overexpression in lowland rice could increase root osmotic hydraulic conductivity, leaf water potential, and relative cumulative transpiration at the end of 10 h PEG treatment[64]. CePIP2;8 was characterized as a transposed repeat of CePIP2;1. Since their orthologs are present in both rice and Arabidopsis (Supplemental Table S3), the duplication event is more likely to occur sometime before monocot-eudicot split. Interestingly, their orthologs in rice, i.e., OsPIP2;1 (OsPIP2a) and -2;6, respectively, are also constitutively expressed[61], implying a conserved evolution with similar functions. When heterologously expressed in yeast, OsPIP2;1 was shown to exhibit high water transport activity[62,6466]. Moreover, root hydraulic conductivity was decreased by approximately four folds in OsPIP2;1 RNAi knock-down rice plants[64]. The water transport activity of OsPIP2;6 has not been tested, however, it was proven to be an H2O2 transporter that is involved in resistance to rice blast[61]. More work especially transgenic tests may improve our knowledge of the function of these key CePIP genes.

    Leaf is a photosynthetic organ that regulates water loss through transpiration. In tigernut, PIP transcripts in leaves were mainly contributed by CePIP1;1, -2;1, and -2;8, implying their key roles. During leaf development, in contrast to gradual decrease of CePIP1;1 and -2;8 transcripts in three stages (i.e. young, mature, and senescing) examined in this study, CePIP2;1 peaked in mature leaves. Their high abundance in young leaves is by cell elongation and enlargement at this stage, whereas upregulation of CePIP2;1 in mature leaves may inform its possible role in photosynthesis[67]. Thus far, a high number of CO2 permeable PIPs have been identified, e.g., AtPIP2;1, HvPIP2;1, HvPIP2;2, HvPIP2;3, HvPIP2;5, and SiPIP2;7[6870]. Moreover, in mature leaves, CePIP1;1, -2;1, and -2;8 were shown to exhibit an apparent diurnal fluctuation expression pattern that was expressed more in the day and usually peaked at noon, which reflects transpiration and the fact that PIP genes are usually induced by light[11,7173]. In rice, OsPIP2;4 and -2;5 also showed a clear diurnal fluctuation in roots that peaked at 3 h after the onset of light and dropped to a minimum 3 h after the onset of darkness[11]. Notably, further studies showed that temporal and dramatic induction of OsPIP2;5 around 2 h after light initiation was triggered by transpirational demand but not circadian rhythm[74].

    As an oil-bearing tuber crop, the main economic goal of tigernut cultivation is to harvest underground tubers, whose development is highly dependent on water available[32,75]. According to previous studies, the moisture content of immature tigernut tubers maintains more than 80.0%, followed by a seed-like dehydration process with a drop of water content to less than 50% during maturation[28,32]. Thereby, the water balance in developmental tubers must be tightly regulated. Like leaves, the majority of PIP transcripts in tubers were shown to be contributed by CePIP1;1, -2;1, and -2;8, which was further confirmed at the protein level. In accordance with the trend of water content during tuber development, mRNA, and protein abundances of CePIP1;1, -2;1, and -2;8 in initiation and swelling tubers were considerably higher than that at the mature stage. High abundances of CePIP1;1, -2;1, and -2;8 at the initiation stage reflects rapid cell division and elongation, whereas upregulation of CePIP1;1 and -2;1 at the swelling stage is in accordance with cell enlargement and active physiological metabolism such as rapid oil accumulation[28,30]. At the mature stage, downregulation of PIP transcripts and protein abundances resulted in a significant drop in the moisture content, which is accompanied by the significant accumulation of late embryogenesis-abundant proteins[23,32]. The situation is highly distinct from other tuber plants such as potato (Solanum tuberosum), which may contribute to the difference in desiccation resistance between two species[32,76]. It's worth noting that, in one study, CePIP2;1 was not detected in any of the four tested stages, i.e., freshly harvested, dried, rehydrated for 48 h, and sprouted tubers[23]. By contrast, it was quantified in all three stages of tuber development examined in this study, i.e., 1, 25, and 35 DAI (corresponding to freshly harvested tubers), which represent initiation, swelling, and maturation. One possible reason is that the protein abundance of CePIP2;1 in mature tubers is not high enough to be quantified by nanoLC-MS/MS, which is relatively less sensitive than 4D-PRM used in this study[30,46]. In fact, nanoLC-MS/MS-based proteomic analysis of 30 samples representing six tissues/stages only resulted in 2,257 distinct protein groups[23].

    Taken together, our results imply a key role of CePIP1;1, -2;1, and -2;8 in tuber water balance, however, the mechanism underlying needs to be further studied, e.g., posttranslational modifications, protein interaction patterns, and transcriptional regulators.

    To our knowledge, this is the first genome-wide characterization of PIP genes in tigernut, a representative Cyperaceae plant with oil-bearing tubers. Fourteen CePIP genes representing two phylogenetic groups or 12 orthogroups are relatively more than that present in two model plants rice and Arabidopsis, and gene expansion was mainly contributed by WGD and transposed/tandem duplications, some of which are lineage or even species-specific. Among these genes, CePIP1;1, -2;1, and -2;8 have evolved to be three dominant members that are constitutively expressed in most tissues, including leaf and tuber. Transcription of these three dominant members in leaves are subjected to development and diurnal regulation, whereas in tubers, their mRNA and protein abundances are positively correlated with the moisture content during tuber development. Moreover, their plasma membrane-localization was confirmed by subcellular localization analysis, implying that they may function in the cell membrane. These findings shall not only provide valuable information for further uncovering the mechanism of tuber water balance but also lay a solid foundation for genetic improvement by regulating these key PIP members in tigernut.

    The authors confirm contribution to the paper as follows: study conception and design, supervision: Zou Z; analysis and interpretation of results: Zou Z, Zheng Y, Xiao Y, Liu H, Huang J, Zhao Y; draft manuscript preparation: Zou Z, Zhao Y. All authors reviewed the results and approved the final version of the manuscript.

    All the relevant data is available within the published article.

    This work was supported by the Hainan Province Science and Technology Special Fund (ZDYF2024XDNY171 and ZDYF2024XDNY156), China; the National Natural Science Foundation of China (32460342, 31971688 and 31700580), China; the Project of Sanya Yazhou Bay Science and Technology City (SCKJ-JYRC-2022-66), China. The funders had no role in study design, data collection and analysis, decision to publish, or preparation of the manuscript.

  • The authors declare that they have no conflict of interest.

  • Supplemental Fig. S1 The layout of the split-plot design implemented to determine the effect of reduced PPF on i) the amount of biomass produced and ii) cell wall composition of eight different cultivars of Cynodon grasses. Each of the three blocks included the control (0% reduced PPF; white) and the reduced PPF treatments of 30% (red), 50% (blue) and 70% (green). The control and each reduced PPF treatment within each block included all eight cultivars (1) Wintergreen, (2) OZTUFF®, (3) Latitude 36®, (4) Grand Prix, (5) TifSport®, (6) Legend®, (7) UQ25a1 and (8) UQ 545.
    Supplemental Fig. S2 Predicted cell wall mg /g dried biomass (DW) determined by application of a PLSR model generated from FTIR spectra vs measured (reference) values of isolated cell walls derived from ground leaf clippings of Cynodon grasses by washing non-cell wall extractives away with ethanol and 40°C water. The calibration set of samples (blue) was used to generate the model, while another independent validation set of samples (red) was used to test the capability of the model to predict unknown datasets with the R2 and RMSE obtained for the validation set providing a measure of the model's accuracy in predicting unknown samples based on their FTIR spectra.
    Supplemental Fig. S3 Predicted water content of the cell wall value determined by PLSR model generated from FTIR Spectra vs reference values water extracted by freeze drying ground leaf clippings obtained from Cynodon grasses including the R2 and RMSE for a calibration and validation set of samples. The calibration set (blue) was used to generate the model, while another independent validation set (red) was used to test its ability to predict unknown datasets. The R2 and RMSE obtained for the validation set measured the model's effectiveness for predicting unknown samples based on their FTIR spectra.
    Supplemental Fig. S4 Predicted ‘extractive’ values of the cell wall determined by PLSR model generated from FTIR Spectra vs reference of non-cell wall extracted mass from dried ground leaf clippings obtained from Cynodon grasses including the R2 and RMSE for a calibration and validation set of samples. The calibration set (blue) was used to generate the model, while another independent validation set (red) was used to test its ability to predict unknown datasets. The R2 and RMSE obtained for the validation set measured the model's effectiveness for predicting unknown samples based on their FTIR spectra.
    Supplemental Fig. S5 Predicted Cell wall values determined by PLSR model generated from FTIR Spectra vs reference glucan values extracted from cell wall isolated from dried ground leaf clippings obtained from Cynodon grasses including the R2 and RMSE for a calibration and validation set of samples. The calibration set (blue) was used to generate the model, while another independent validation set (red) was used to test its ability to predict unknown datasets. The R2 and RMSE obtained for the validation set measured the model's effectiveness for predicting unknown samples based on their FTIR spectra.
    Supplemental Fig. S6 Predicted Cell wall values determined by PLSR model generated from FTIR Spectra vs reference xylan values extracted from cell wall isolated from dried ground leaf clippings obtained from Cynodon grasses including the R2 and RMSE for a calibration and validation set of samples. The calibration set (blue) was used to generate the model, while another independent validation set (red) was used to test its ability to predict unknown datasets. The R2 and RMSE obtained for the validation set measured the model's effectiveness for predicting unknown samples based on their FTIR spectra.
    Supplemental Fig. S7 Predicted Cell wall values determined by PLSR model generated from FTIR Spectra vs reference arabinan values extracted from cell wall isolated from dried ground leaf clippings obtained from Cynodon grasses including the R2 and RMSE for a calibration and validation set of samples. The calibration set (blue) was used to generate the model, while another independent validation set (red) was used to test its ability to predict unknown datasets. The R2 and RMSE obtained for the validation set measured the model's effectiveness for predicting unknown samples based on their FTIR spectra.
    Supplemental Fig. S8 Predicted Cell wall values determined by PLSR model generated from FTIR Spectra vs reference galactan values extracted from cell wall isolated from dried ground leaf clippings obtained from Cynodon grasses including the R2 and RMSE for a calibration and validation set of samples. The calibration set (blue) was used to generate the model, while another independent validation set (red) was used to test its ability to predict unknown datasets. The R2 and RMSE obtained for the validation set measured the model's effectiveness for predicting unknown samples based on their FTIR spectra.
    Supplemental Fig. S9 Predicted Cell wall values determined by PLSR model generated from FTIR Spectra vs reference mannan values extracted from cell wall isolated from dried ground leaf clippings obtained from Cynodon grasses including the R2 and RMSE for a calibration and validation set of samples. The calibration set (blue) was used to generate the model, while another independent validation set (red) was used to test its ability to predict unknown datasets. The R2 and RMSE obtained for the validation set measured the model's effectiveness for predicting unknown samples based on their FTIR spectra.
    Supplemental Fig. S10 Predicted Cell wall values determined by PLSR model generated from FTIR Spectra vs reference AIL values extracted from cell wall isolated from dried ground leaf clippings obtained from Cynodon grasses including the R2 and RMSE for a calibration and validation set of samples. The calibration set (blue) was used to generate the model, while another independent validation set (red) was used to test its ability to predict unknown datasets. The R2 and RMSE obtained for the validation set measured the model's effectiveness for predicting unknown samples based on their FTIR spectra.
    Supplemental Fig. S11 Predicted Cell wall values determined by PLSR model generated from FTIR Spectra vs reference ASL values extracted from cell wall isolated from dried ground leaf clippings obtained from Cynodon grasses including the R2 and RMSE for a calibration and validation set of samples. The calibration set (blue) was used to generate the model, while another independent validation set (red) was used to test its ability to predict unknown datasets. The R2 and RMSE obtained for the validation set measured the model's effectiveness for predicting unknown samples based on their FTIR spectra.
    Supplemental Fig. S12 Predicted Cell wall values determined by PLSR model generated from FTIR Spectra vs reference ash values extracted from cell wall isolated from dried ground leaf clippings obtained from Cynodon grasses including the R2 and RMSE for a calibration and validation set of samples. The calibration set (blue) was used to generate the model, while another independent validation set (red) was used to test its ability to predict unknown datasets. The R2 and RMSE obtained for the validation set measured the model's effectiveness for predicting unknown samples based on their FTIR spectra.
    Supplemental Table S1 Repeated measures mixed-effects model for a split-plot analysis of variance for all traits measured weekly with period, cultivar and reduced PPF treatment as the main effects. Residuals for the model were calculated using a first-order autocorrelation to account for the repeated weekly measures using the ASReml-R software package. Analysis revealed that period was the main influence on the variation observed for the majority of traits highlighted yellow.
    Supplemental Table S2 Different pre-treatments were applied to the raw spectra obtained from the Perkin Elmer Spectrum II FTIR® spectrometer and a PLSR model generated with the transformed spectra and reference values. A calibration set of samples was used to generate each model and was evaluated by an independent validation set of samples. Each model was evaluated based on its calibration R2 and RMSE (mg/gDW) values, with those providing the lowest RMSE (mg/gDW) values for the validation set, chosen as the pre-treatment for the final model. The pre-treatments chosen for each variable measured are listed below with the calibration and validation R2 and RMSE (mg/gDW) values from that PLSR model.
    Supplemental Table S3 (a). ANOVA table from a split plot analysis of clipping yield at the end of the short period (weeks 1-2). (b). Main effects (Reduced PPF) clipping yield means. LSD was calculated using Error a. (c). Subplot effects (Cultivar) clipping yield means. LSD was calculated using Error b. Groupings based on LSD are provided.
    Supplemental Table S4 (a). ANOVA table from a split plot analysis of clipping yield at the end of the medium period (weeks 1-5). (b). Main plot (Reduced PPF) and subplot (Cultivar) interaction clipping yield means. Interaction LSD (p<0.05) was calculated using Error b. Groupings based on LSD are provided.
    Supplemental Table S5 (a). ANOVA table from a split plot analysis of clipping yield at the end of the long period (weeks 1-7). (b). Main plot (Reduced PPF) and subplot (Cultivar) interaction clipping yield means. Interaction LSD (p<0.05) was calculated using Error b. Groupings based on LSD are provided.
    Supplemental Table S6 (a). ANOVA table from a split plot analysis of turf quality at the end of the medium period (weeks 1-5). (b). Main plot (Reduced PPF) and subplot (Cultivar) interaction turf quality means. Interaction LSD (p value <0.05) was calculated using Error b. Groupings based on LSD are provided.
    Supplemental Table S7 (a). ANOVA table from a split plot analysis of turf quality at the end of the long period (weeks 1-7). (b). Main plot (Reduced PPF) and subplot (Cultivar) interaction turf quality means. Interaction LSD (p value <0.05) was calculated using Error b. Groupings based on LSD are provided.
  • [1]

    Zhou Y, Lambrides CJ, Fukai S. 2014. Drought resistance and soil water extraction of a perennial C4 grass: contributions of root and rhizome traits. Functional Plant Biology 41:505−19

    doi: 10.1071/FP13249

    CrossRef   Google Scholar

    [2]

    Dodd MB, McGowan AW, Power IL, Thorrold BS. 2005. Effects of variation in shade level, shade duration and light quality on perennial pastures. New Zealand Journal of Agricultural Research 48:531−43

    doi: 10.1080/00288233.2005.9513686

    CrossRef   Google Scholar

    [3]

    Huang S, Jiang S, Liang J, Chen M, Shi Y. 2019. Current knowledge of bermudagrass responses to abiotic stresses. Breeding Science 69:215−26

    doi: 10.1270/jsbbs.18164

    CrossRef   Google Scholar

    [4]

    Dunne JC, Reynolds WC, Miller GL, Arellano C, Brandenburg RL, et al. 2015. Identification of South African bermudagrass germplasm with shade tolerance. HortScience 50:1419−25

    doi: 10.21273/HORTSCI.50.10.1419

    CrossRef   Google Scholar

    [5]

    Malik S, ur Rehman S, Younis A, Qasim M, Nadeem M, et al. 2014. Evaluation of quality, growth, and physiological potential of various turf grass cultivars for shade garden. Journal of Horticulture, Forestry and Biotechnology 18:110−21

    Google Scholar

    [6]

    Schmidt RE, Blaser RE. 1969. Effect of temperature, light, and nitrogen on growth and metabolism of ‘Tifgreen’ bermudagrass (Cynodon spp. ). Crop Science 9:5−9

    doi: 10.2135/cropsci1969.0011183X000900010002x

    CrossRef   Google Scholar

    [7]

    Trenholm LE, Nagata RT. 2005. Shade tolerance of St. Augustinegrass cultivars. HortTechnology 15:267−72

    doi: 10.21273/HORTTECH.15.2.0267

    CrossRef   Google Scholar

    [8]

    Liu W, Ren M, Liu T, Du Y, Zhou T, et al. 2018. Effect of shade stress on lignin biosynthesis in soybean stems. Journal of Integrative Agriculture 17:1594−604

    doi: 10.1016/S2095-3119(17)61807-0

    CrossRef   Google Scholar

    [9]

    Li W, Katin-Grazzini L, Gu X, Wang X, El-Tanbouly R, et al. 2017. Transcriptome analysis reveals differential gene expression and a possible role of gibberellins in a shade-tolerant mutant of perennial ryegrass. Frontiers in Plant Science 8:868

    doi: 10.3389/fpls.2017.00868

    CrossRef   Google Scholar

    [10]

    Tan T, Li S, Fan Y, Wang Z, Ali Raza M, et al. 2022. Far-red light: a regulator of plant morphology and photosynthetic capacity. The Crop Journal 10:300−09

    doi: 10.1016/j.cj.2021.06.007

    CrossRef   Google Scholar

    [11]

    Falcioni R, Moriwaki T, Perez-Llorca M, Munné-Bosch S, Gibin MS, et al. 2020. Cell wall structure and composition is affected by light quality in tomato seedlings. Journal of Photochemistry and Photobiology B: Biology 203:111745

    doi: 10.1016/j.jphotobiol.2019.111745

    CrossRef   Google Scholar

    [12]

    Dunne JC, Miller GL, Arellano C, Brandenburg RL, Schoeman A, et al. 2017. Shade response of bermudagrass accessions under different management practices. Urban Forestry & Urban Greening 26:169−77

    doi: 10.1016/j.ufug.2017.02.011

    CrossRef   Google Scholar

    [13]

    Shi T, Quan Q, Li Y. 2018. Effects of clonal integration on the proximal and distal ramets of Cynodon dactylon under shade stress. Brazilian Archives of Biology and Technology 61:e18160475

    doi: 10.1590/1678-4324-2018160475

    CrossRef   Google Scholar

    [14]

    Trappe JM, Karcher DE, Richardson MD, Patton AJ. 2011. Shade and traffic tolerance varies for bermudagrass and zoysiagrass cultivars. Crop Science 51:870−77

    doi: 10.2135/cropsci2010.05.0248

    CrossRef   Google Scholar

    [15]

    Fan J, Zhang W, Amombo E, Hu L, Kjorven JO, et al. 2020. Mechanisms of environmental stress tolerance in turfgrass. Agronomy 10:522

    doi: 10.3390/agronomy10040522

    CrossRef   Google Scholar

    [16]

    Chhetri M, Fontanier C, Koh K, Wu Y, Moss JQ. 2019. Turf performance of seeded and clonal bermudagrasses under varying light environments. Urban Forestry & Urban Greening 43:126355

    doi: 10.1016/j.ufug.2019.05.017

    CrossRef   Google Scholar

    [17]

    Liu X, Renard CMGC, Bureau S, Le Bourvellec C. 2021. Revisiting the contribution of ATR-FTIR spectroscopy to characterise plant cell wall polysaccharides. Carbohydrate Polymers 262:117935

    doi: 10.1016/j.carbpol.2021.117935

    CrossRef   Google Scholar

    [18]

    Kac̆uráková M, Capek P, Sasinková V, Wellner N, Ebringerová A. 2000. FT-IR study of plant cell wall model compounds: pectic polysaccharides and hemicelluloses. Carbohydrate Polymers 43:195−203

    doi: 10.1016/S0144-8617(00)00151-X

    CrossRef   Google Scholar

    [19]

    Chazal R, Robert P, Durand S, Devaux MF, Saulnier L, et al. 2014. Investigating lignin key features in maize lignocelluloses using infrared spectroscopy. Applied Spectroscopy 68:1342−47

    doi: 10.1366/14-07472

    CrossRef   Google Scholar

    [20]

    Wang J, Zhu J, Huang R, Yang Y. 2012. Investigation of cell wall composition related to stem lodging resistance in wheat (Triticum aestivum L. ) by FTIR spectroscopy. Plant Signaling & Behavior 7:856−63

    doi: 10.4161/psb.20468

    CrossRef   Google Scholar

    [21]

    Alonso-Simón A, García-Angulo P, Mélida H, Encina A, Álvarez JM, et al. 2011. The use of FTIR spectroscopy to monitor modifications in plant cell wall architecture caused by cellulose biosynthesis inhibitors. Plant Signaling & Behavior 6:1104−10

    doi: 10.4161/psb.6.8.15793

    CrossRef   Google Scholar

    [22]

    Hori R, Sugiyama J. 2003. A combined FT-IR microscopy and principal component analysis on softwood cell walls. Carbohydrate Polymers 52:449−53

    doi: 10.1016/S0144-8617(03)00013-4

    CrossRef   Google Scholar

    [23]

    Canteri MHG, Renard CMGC, Le Bourvellec C, Bureau S. 2019. ATR-FTIR spectroscopy to determine cell wall composition: application on a large diversity of fruits and vegetables. Carbohydrate Polymers 212:186−96

    doi: 10.1016/j.carbpol.2019.02.021

    CrossRef   Google Scholar

    [24]

    Wolfrum E, Payne C, Stefaniak T, Rooney W, Dighe N, et al. 2013. Multivariate calibration models for sorghum composition using Near-Infrared (NIR) Spectroscopy. Technical Report. Rep. NREL/TP-5100-56838. National Renewable Energy Laboratory, USA

    [25]

    Payne CE, Wolfrum EJ. 2015. Rapid analysis of composition and reactivity in cellulosic biomass feedstocks with near-infrared spectroscopy. Biotechnology for Biofuels 8:43

    doi: 10.1186/s13068-015-0222-2

    CrossRef   Google Scholar

    [26]

    Chen SF, Danao MGC, Singh V, Brown PJ. 2014. Determining sucrose and glucose levels in dual-purpose sorghum stalks by Fourier transform near infrared (FT-NIR) spectroscopy. Journal of the Science of Food and Agriculture 94:2569−76

    doi: 10.1002/jsfa.6606

    CrossRef   Google Scholar

    [27]

    Brown C, Martin AP, Grof CPL. 2017. The application of Fourier transform mid-infrared (FTIR) spectroscopy to identify variation in cell wall composition of Setaria italica ecotypes. Journal of Integrative Agriculture 16:1256−67

    doi: 10.1016/S2095-3119(16)61574-5

    CrossRef   Google Scholar

    [28]

    Sluiter A, Hames B, Ruiz R, Scarlata C, Sluiter J, et al. 2008. Determination of Structural Carbohydrates and Lignin in Biomass. Technical Report. Rep. NREL/TP-510-42618. National Renewable Energy Laboratory, USA.

    [29]

    De Mendiburu F, Yaseen M. 2020. Agricolae: Statistical procedures for agricultural research. R package version 1.4.0. Retrieved from: https://myaseen208.github.io/agricolae/, https://cran.r-project.org/package=agricolae.

    [30]

    Hoffmann L Jr, Rooney WL. 2014. Accumulation of biomass and compositional change over the growth season for six photoperiod sorghum lines. BioEnergy Research 7:811−15

    doi: 10.1007/s12155-013-9405-5

    CrossRef   Google Scholar

    [31]

    Zhou G, Taylor G, Polle A. 2011. FTIR-ATR-based prediction and modelling of lignin and energy contents reveals independent intra-specific variation of these traits in bioenergy poplars. Plant Methods 7:9

    doi: 10.1186/1746-4811-7-9

    CrossRef   Google Scholar

    [32]

    Semchenko M, Lepik M, Götzenberger L, Zobel K. 2012. Positive effect of shade on plant growth: amelioration of stress or active regulation of growth rate? Journal of Ecology 100:459−66

    doi: 10.1111/j.1365-2745.2011.01936.x

    CrossRef   Google Scholar

    [33]

    Rehman M, Fahad S, Saleem MH, Hafeez M, Ur Rahman MH, et al. 2020. Red light optimized physiological traits and enhanced the growth of ramie (Boehmeria nivea L.). Photosynthetica 58:922−31

    doi: 10.32615/ps.2020.040

    CrossRef   Google Scholar

    [34]

    Saleem MH, Rehman M, Fahad S, Tung SA, Iqbal N, et al. 2020. Leaf gas exchange, oxidative stress, and physiological attributes of rapeseed (Brassica napus L.) grown under different light-emitting diodes. Photosynthetica 58:836−45

    doi: 10.32615/ps.2020.010

    CrossRef   Google Scholar

    [35]

    Fu J, Luo Y, Sun P, Gao J, Zhao D, et al. 2020. Effects of shade stress on turfgrasses morphophysiology and rhizosphere soil bacterial communities. BMC Plant Biology 20:92

    doi: 10.1186/s12870-020-2300-2

    CrossRef   Google Scholar

    [36]

    Tegg RS, Lane PA. 2004. A comparison of the performance and growth of a range of turfgrass species under shade. Australian Journal of Experimental Agriculture 44:353−58

    doi: 10.1071/EA02159

    CrossRef   Google Scholar

    [37]

    Magalhães Silva Moura JC, Bonine CAV, de Oliveira Fernandes Viana J, Dornelas MC, Mazzafera P. 2010. Abiotic and biotic stresses and changes in the lignin content and composition in plants. Journal of Integrative Plant Biology 52:360−76

    doi: 10.1111/j.1744-7909.2010.00892.x

    CrossRef   Google Scholar

    [38]

    Hussain S, Iqbal N, Pang T, Naeem Khan M, Liu W, et al. 2019. Weak stem under shade reveals the lignin reduction behavior. Journal of Integrative Agriculture 18:496−505

    doi: 10.1016/S2095-3119(18)62111-2

    CrossRef   Google Scholar

    [39]

    Wen B, Zhang Y, Hussain S, Wang S, Zhang X, et al. 2020. Slight shading stress at seedling stage does not reduce lignin biosynthesis or affect lodging resistance of soybean stems. Agronomy 10:544

    doi: 10.3390/agronomy10040544

    CrossRef   Google Scholar

    [40]

    Kyriazopoulos AP, Abraham EM, Parissi ZM, Koukoura Z, Nastis AS. 2013. Forage production and nutritive value of Dactylis glomerata and Trifolium subterraneum mixtures under different shading treatments. Grass and Forage Science 68:72−82

    doi: 10.1111/j.1365-2494.2012.00870.x

    CrossRef   Google Scholar

    [41]

    Lin CH, McGraw ML, George MF, Garrett HE. 2001. Nutritive quality and morphological development under partial shade of some forage species with agroforestry potential. Agroforestry Systems 53:269−81

    doi: 10.1023/A:1013323409839

    CrossRef   Google Scholar

    [42]

    Hill J, Farrish K, Oswald B, Coble D, Shadow A. 2021. Potential of several native and introduced warm season grasses as components of silvopastures in the Southeastern United States. Agroforestry Systems 95:1735−44

    doi: 10.1007/s10457-021-00678-8

    CrossRef   Google Scholar

    [43]

    Ballaré CL. 2014. Light regulation of plant defense. Annual Review of Plant Biology 65:335−63

    doi: 10.1146/annurev-arplant-050213-040145

    CrossRef   Google Scholar

    [44]

    Xie M, Zhang J, Tschaplinski TJ, Tuskan GA, Chen JG, et al. 2018. Regulation of lignin biosynthesis and its role in growth-defense tradeoffs. Frontiers of Plant Science 9:1427

    doi: 10.3389/fpls.2018.01427

    CrossRef   Google Scholar

    [45]

    Ranade SS, Seipel G, Gorzsás A, Garcia-Gil MR. 2022. Adaptive strategies of scots pine under shade: Increase in lignin synthesis and ecotypic variation in defense-related gene expression. Physiologia Plantarum 174:e13792

    doi: 10.1111/ppl.13792

    CrossRef   Google Scholar

    [46]

    Ranade SS, Seipel G, Gorzsás A, García-Gil MR. 2022. Enhanced lignin synthesis and ecotypic variation in defense-related gene expression in response to shade in Norway spruce. Plant, Cell & Environment 45:2671−81

    doi: 10.1111/pce.14387

    CrossRef   Google Scholar

    [47]

    Courbier S, Pierik R. 2019. Canopy light quality modulates stress responses in plants. iScience 22:441−52

    doi: 10.1016/j.isci.2019.11.035

    CrossRef   Google Scholar

    [48]

    Ryalls JMW, Moore BD, Johnson SN. 2018. Silicon uptake by a pasture grass experiencing simulated grazing is greatest under elevated precipitation. BMC Ecology 18:53

    doi: 10.1186/s12898-018-0208-6

    CrossRef   Google Scholar

  • Cite this article

    Brown CW, Jie MWQ, Pearce W, Arief V, Dayananda B, et al. 2023. The application of Fourier Transform Infra-Red spectrometry to assess the impact of changes in Photosynthetic Photon Flux on cell wall components and turf quality of different cultivars of Cynodon grasses. Grass Research 3:9 doi: 10.48130/GR-2023-0009
    Brown CW, Jie MWQ, Pearce W, Arief V, Dayananda B, et al. 2023. The application of Fourier Transform Infra-Red spectrometry to assess the impact of changes in Photosynthetic Photon Flux on cell wall components and turf quality of different cultivars of Cynodon grasses. Grass Research 3:9 doi: 10.48130/GR-2023-0009

Figures(7)  /  Tables(2)

Article Metrics

Article views(4430) PDF downloads(435)

ARTICLE   Open Access    

The application of Fourier Transform Infra-Red spectrometry to assess the impact of changes in Photosynthetic Photon Flux on cell wall components and turf quality of different cultivars of Cynodon grasses

Grass Research  3 Article number: 9  (2023)  |  Cite this article

Abstract: The impact of decreased Photosynthetic Photon Flux (PPF) on the biomass and quality of Cynodon turf grasses are of considerable interest to the turf community, however there is little available data regarding its effect upon cell walls. Fourier Transform Infra-Red (FTIR)-based Partial Least Squares Regression (PLSR) models are useful for assessing the cell wall composition of a multitude of samples in a high-throughput manner. Such models were generated to predict cell wall components, water and extractive non-cell wall content of Cynodon grass biomass to determine if different levels of PPF imposed by woven polyester cloth influenced the cell wall composition of six cultivars of C. dactylon and two hybrid cultivars of C. dactylon × C. transvaalensis. The trial ran over seven weeks, and cell wall composition was assessed at three time points, week two (short period), week five (medium period) and week seven (long period). Cultivar had the strongest influence on cell wall composition in the short period, while at the end of the long period, reduced PPF was the more influential factor affecting the composition of the cell wall. At the final experimental time point, turf quality was negatively correlated with reduced PPF (50% and 70% reduction), total lignin and Acid Insoluble Lignin (AIL) and positively correlated with higher PPF (30% and 0% reduction) carbohydrates and Acid Soluble Lignin (ASL). It is proposed that the defense response pathway was preferred over the typical shade avoidance responses due to the weekly clipping regime confounding the response to reductions in PPF, leading to higher percentages of lignin, ash and lower carbohydrate content in the cell wall of Cynodon grasses.

    • The tropical C4 grass, bermudagrass (Cynodon spp.), belongs to the Chloridoideae family, of which C. dactylon is the most widely distributed member of the genus. C. dactylon and C. dactylon × C. transvaalensis hybrids are commercially used as turf in many public parks, golf courses and sporting fields in Australia due to their recuperative potential, colour and high tolerance to drought[1]. Evidence suggests that compared with other turf species, Cynodon grasses are susceptible to shade stress as a result of decreased Photosynthetic Photon Flux (PPF) with decreases in turf quality metrics such as colour and density after prolonged shading[2,3]. As 20%−25% of turf is exposed to regular shading, there is considerable interest in developing shade-tolerant cultivars, with the role of the cell wall in responding to decreased PPF also significant[4,5].

      Decreased PPF attributable to shade, leads to reduced photosynthetic rates, chlorophyll a and b content, total protein content and decreased soluble carbohydrate content, collectively hypothesized to reduce nitrogen uptake, resulting in stunted root growth and elongation of leaves[3,6]. Plants typically employ a shade avoidance or growth response to avoid low PPF and seek sunlight by increasing the length of internodes and leaves, increasing leaf area and resulting in thinning of turf leaves[7]. Shade tolerance is an alternative response observed, particularly in dwarf varieties with reduced gibberellin production, characterized by decreased overall biomass accumulation and increased chlorophyll content to maximise light capture capability[8,9].

      The quality of light received by plants is also vital, particularly the ratio of Red:Far Red (R:FR) light. Shade is known to reduce the R:FR ratio, with phytochrome A detecting Far Red wavelengths (700−800 nm) associated with reduced PPF and phytochrome B responding to the photosynthetically active wavelengths of light (PAR; 400−700 nm). Phytochrome B is responsible for regulating the growth pathway, increasing auxin levels, elongating stems and plant height[10]. Light with a reduced R:FR ratio has also been shown to increase RuBisCo activity and produce greater biomass. Increasing photosynthetic capacity ensures a high supply of carbohydrates for cellulose synthesis and cell wall carbohydrates, while lignin content is reduced in tomato seedlings grown under low light conditions[11]. Turf management regimes to improve quality traits such as colour and coverage under shade stress, have been trialed with alterations to nitrogen application, growth regulator application and elevation of mowing heights. The success of these management regimes, however, is not universal and the shade tolerance of individual cultivars wields the most significant influence[12]. To date, there have been studies investigating the effects of altered PPF on different cultivars of Cynodon grasses; these studies have focused predominantly on the subjective measurements of colour, density and biomass accumulation to determine turf quality, with none of these studies having focused on the role of the cell wall in response to altered PPF[1316].

      Fourier Transform Infra-red (FTIR) spectrometry is a valuable tool when analysing cell wall composition, with many wavenumbers within the range of 450−4,000 cm−1 associated with cell wall compounds[1719]. It also has the advantage of being non-destructive to the cell wall and the short measurement period of only minutes provides a high throughput capacity, in contrast to more conventional cell wall analysis methods that are time-consuming and expensive as they generally require multiple pieces of equipment[17,20]. Most studies have utilised a PCA approach to categorise and identify phenotypes of various plant tissues such as wood, stem, and fruits based on spectra to select varieties for more in-depth analysis[17,18,21,22]. While useful, this approach cannot quantify any single component in the analysed tissue. Partial Least Squares Regression (PLSR) models calibrated with spectral and analytically derived reference data can accurately predict and quantify cell wall components of interest, such as individual carbohydrates, lignin and pectins[2326]. The study described herein sought to utilise PLSR models to test a hypothesis that a reduction in PPF would result in measurable changes in cell wall composition in eight different cultivars of Cynodon grasses grown over seven weeks.

    • Six cultivars of C. dactylon (Wintergreen, OZTUFF®, Grand Prix, Legend®, UQ25a1 and UQ545) and two C. dactylon × C. transvaalensis hybrid cultivars (Latitude 36® and TifSport®) selected for the experiment were established in 1.2 m × 2.4 m plots at the Redlands Research Station (27.5274° S, 153.2509° E) Cleveland, Queensland, Australia on red podzolic soil in February and March of 2017. In addition to the control (0% reduction of PPF), the cultivars were grown under woven cloth that reduced PPF by 30%, 50% and 70%, as shown in Fig. 1. Three granular fertilisers Turfstarter (45 kg/ha), Couchmaster (7 kg/ha) and Renolblen Sport (24 kg/ha) were applied monthly throughout both establishment of the grasses and the trial itself. Weeds were controlled by hand weeding and a spot spraying of 74 g/L Disodium Methylarsonate (DSMA) and 50 g/L of Chlorpyrifos was used to manage the threat of lawn army worm. The mean weekly midday PPF measured when plots were mown, is listed in Table 1 for the control and each of the three treatments, with the theoretical PPF based on the woven cloth manufacturer's rating and the ratio of R:FR received by plants under each treatment also shown.
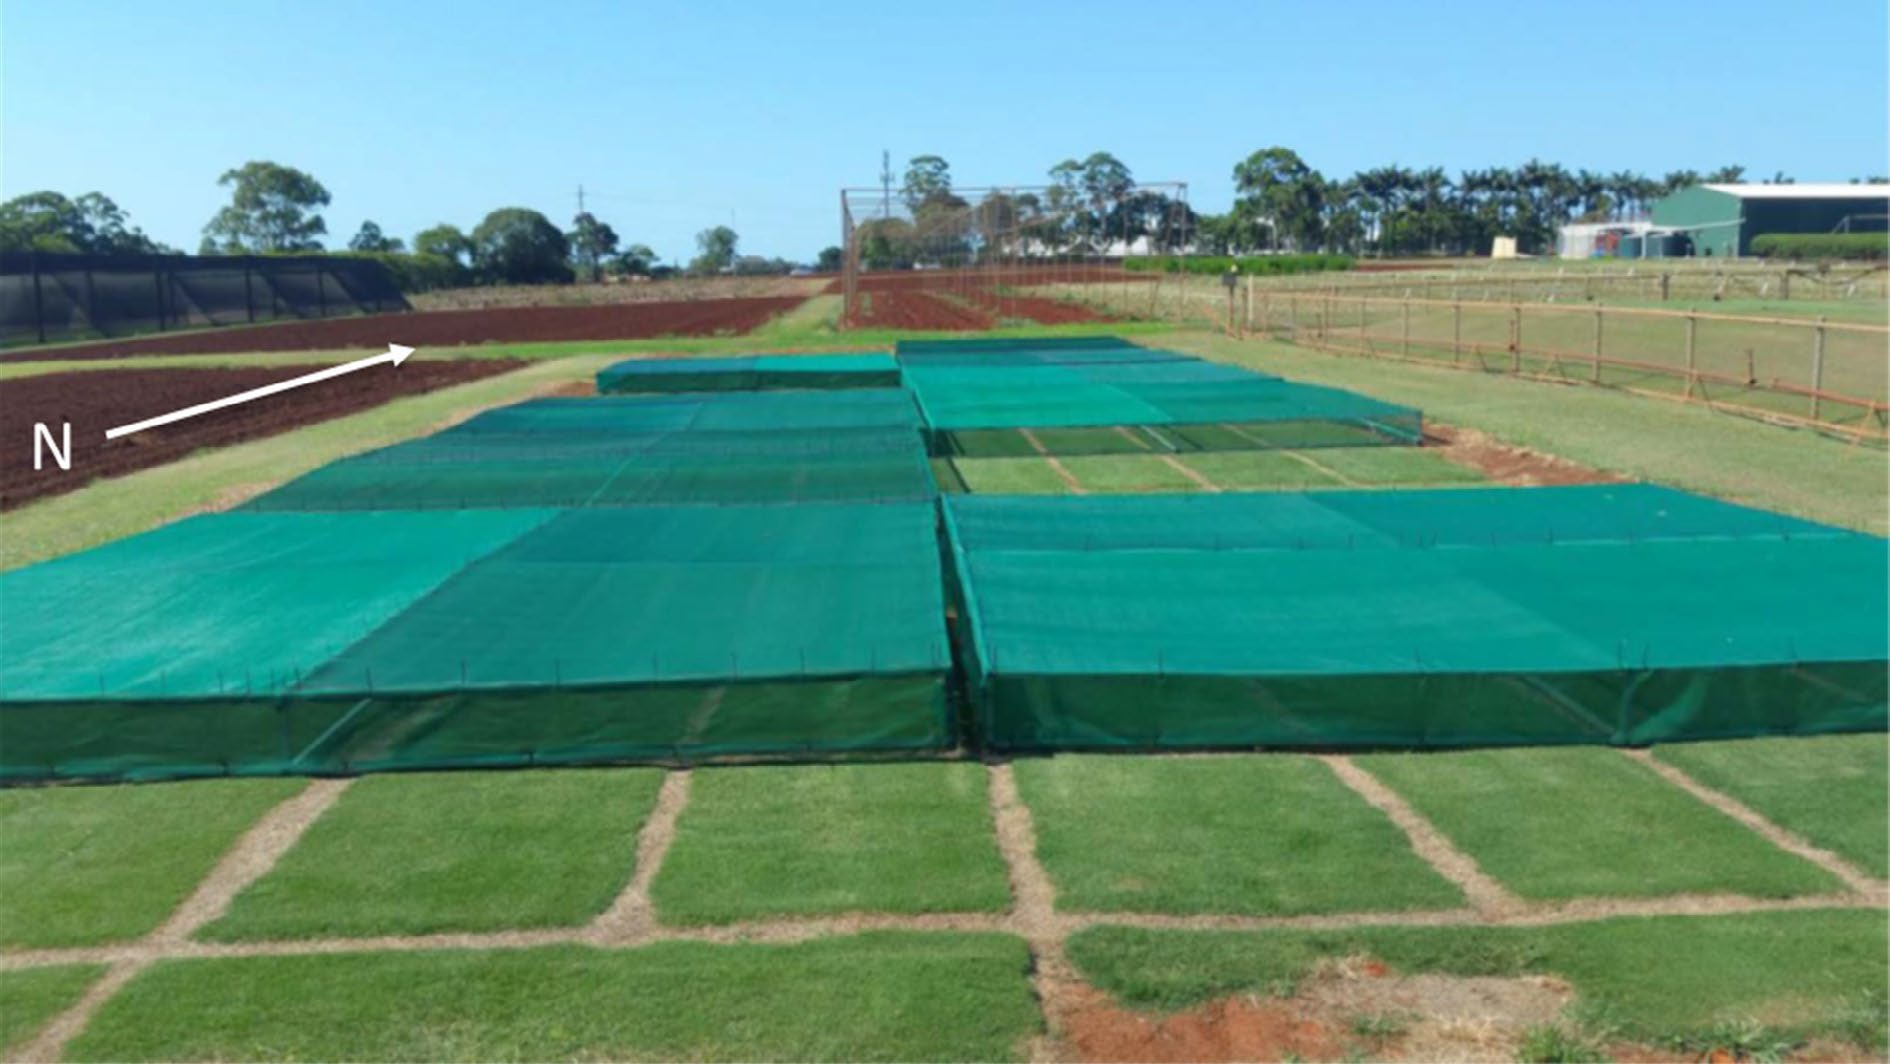
      Figure 1. 

      Experimental plot with woven cloth providing different treatments estimated by the manufacturer to be a 30%, 50% and 70% reduction of PPF, with the uncovered quadrants serving as the controls. The eight different cultivars of Cynodon grasses were assessed for seven weeks to determine the effect of reduced PPF on the amount of biomass produced and cell wall composition. The woven cloth was removed weekly for sufficient time to allow clipping to be undertaken.

      Table 1.  Mean weekly PPF measurements (μmol·m−2·s−1) were recorded at midday using a LiCor LI6400XT® external light sensor for each plot established in the experimental design. The theoretical mean based on the manufacturer's ratings and the ratio of R:FR light received by the plant were also calculated.

      Reduced PPF treatmentActual mean PPF
      (μmol·m−2·s−1)
      Theoretical mean PPF
      (μmol·m−2·s−1)
      R:FR
      ratio
      0% Reduced PPF1,5371,5371.27
      30% Reduced PPF1,0221,0751.23
      50% Reduced PPF6797681.16
      70% Reduced PPF3374611.02

      A trial based upon a split-plot design (Supplemental Fig. S1) with two factors the main plot (reduced PPF) , and the sub-plot, (cultivar) randomly reproduced over three adjacent blocks. Weekly clippings were collected over seven weeks by mowing, commencing on the 3rd of February 2017 with a reel mower set at a height of 20 mm, dried at 60 °C for three days and weighed to determine the amount of biomass produced. The trial was assessed at three time points, a short period (weeks 1−2), medium period (weeks 1−5) and long period (weeks 1−7). At each time point, the total clipping yield was assessed to determine if a cumulative effect was attributable to the imposed treatments. Once dried and weighed, all clippings were ground to a fine powder using a customised roller mill[27]. Approximately 20−40 mg was scanned four times to obtain average spectra using a Perkin Elmer Spectrum II FTIR® instrument (Perkin Elmer, Waltham, MA, USA) fitted with a Universal Attenuated Total Reflectance (UATR) sampling accessory.

    • To generate a PLSR model, a reference set of 144 randomly selected samples underwent compositional analysis. The analysis required the removal of any non-cell wall components (extractives and water) by washing and redrying the sample to determine the cell wall content of the biomass. The isolated cell wall material underwent a two-stage acid hydrolysis[28] with the residue used to determine Acid Insoluble Lignin (AIL) and ash content. The hydrolysate was used to measure cell wall glucan, xylan, arabinan, galactan and mannan content by High-Pressure Liquid Chromatography (HPLC). The instrument used was an Agilent 1,260 series® HPLC (Agilent, Santa Clara, CA, USA) equipped with a refractive index detector and Bio-Rad® HPX-87P column (Bio-Rad, Hercules, CA, USA) with a flow rate of 1 ml/min and a mobile phase of ultra-pure water. Acid Soluble Lignin (ASL) was determined by measuring absorbance at 280 nm on a UV nanodrop spectrometer (Thermo scientific nanodrop 1,000®, Thermo Fisher Scientific, Waltham, MA, USA).

    • Spectral and reference cell wall composition results were entered into Unscrambler® (Camo analytics, Bedford, MA, USA) software to develop PLSR models to predict each major cell wall component. A subset of 124 of the 144 reference samples was chosen randomly to form a calibration set to generate a PLSR model, while the remaining 20 samples were used to form an independent validation set to reduce the likelihood of the model overfitting. A series of regression models were produced using combinations of the pre-treatment options available in Unscrambler®, such as area normalisation, Multiplicative Scattering Correction (MSC), Standard Normal Variate (SNV), smoothing and 1st and 2nd derivative transformations of spectra to determine the optimum pre-treatment for each variable. An ideal threshold set for models was a Pearson R2 above 0.90 based on what had been achieved in similar studies in sorghum, and other forage grasses and the lowest possible Root Mean Squared Error (RMSE) for each model[2426]. Supplemental Table S2 provides a list of R2 and RMSE values for all spectral treatments tested for each variable, with plots of predicted versus reference values for the key components total lignin and total carbohydrates shown in Fig. 2a & b, with all other variables plotted in Supplemental Figs S2S12. The modelled variables were predicted confidently with validation sets of R2 values ~0.9 or above, except for arabinan, galactan and mannan, which were less than 0.8.
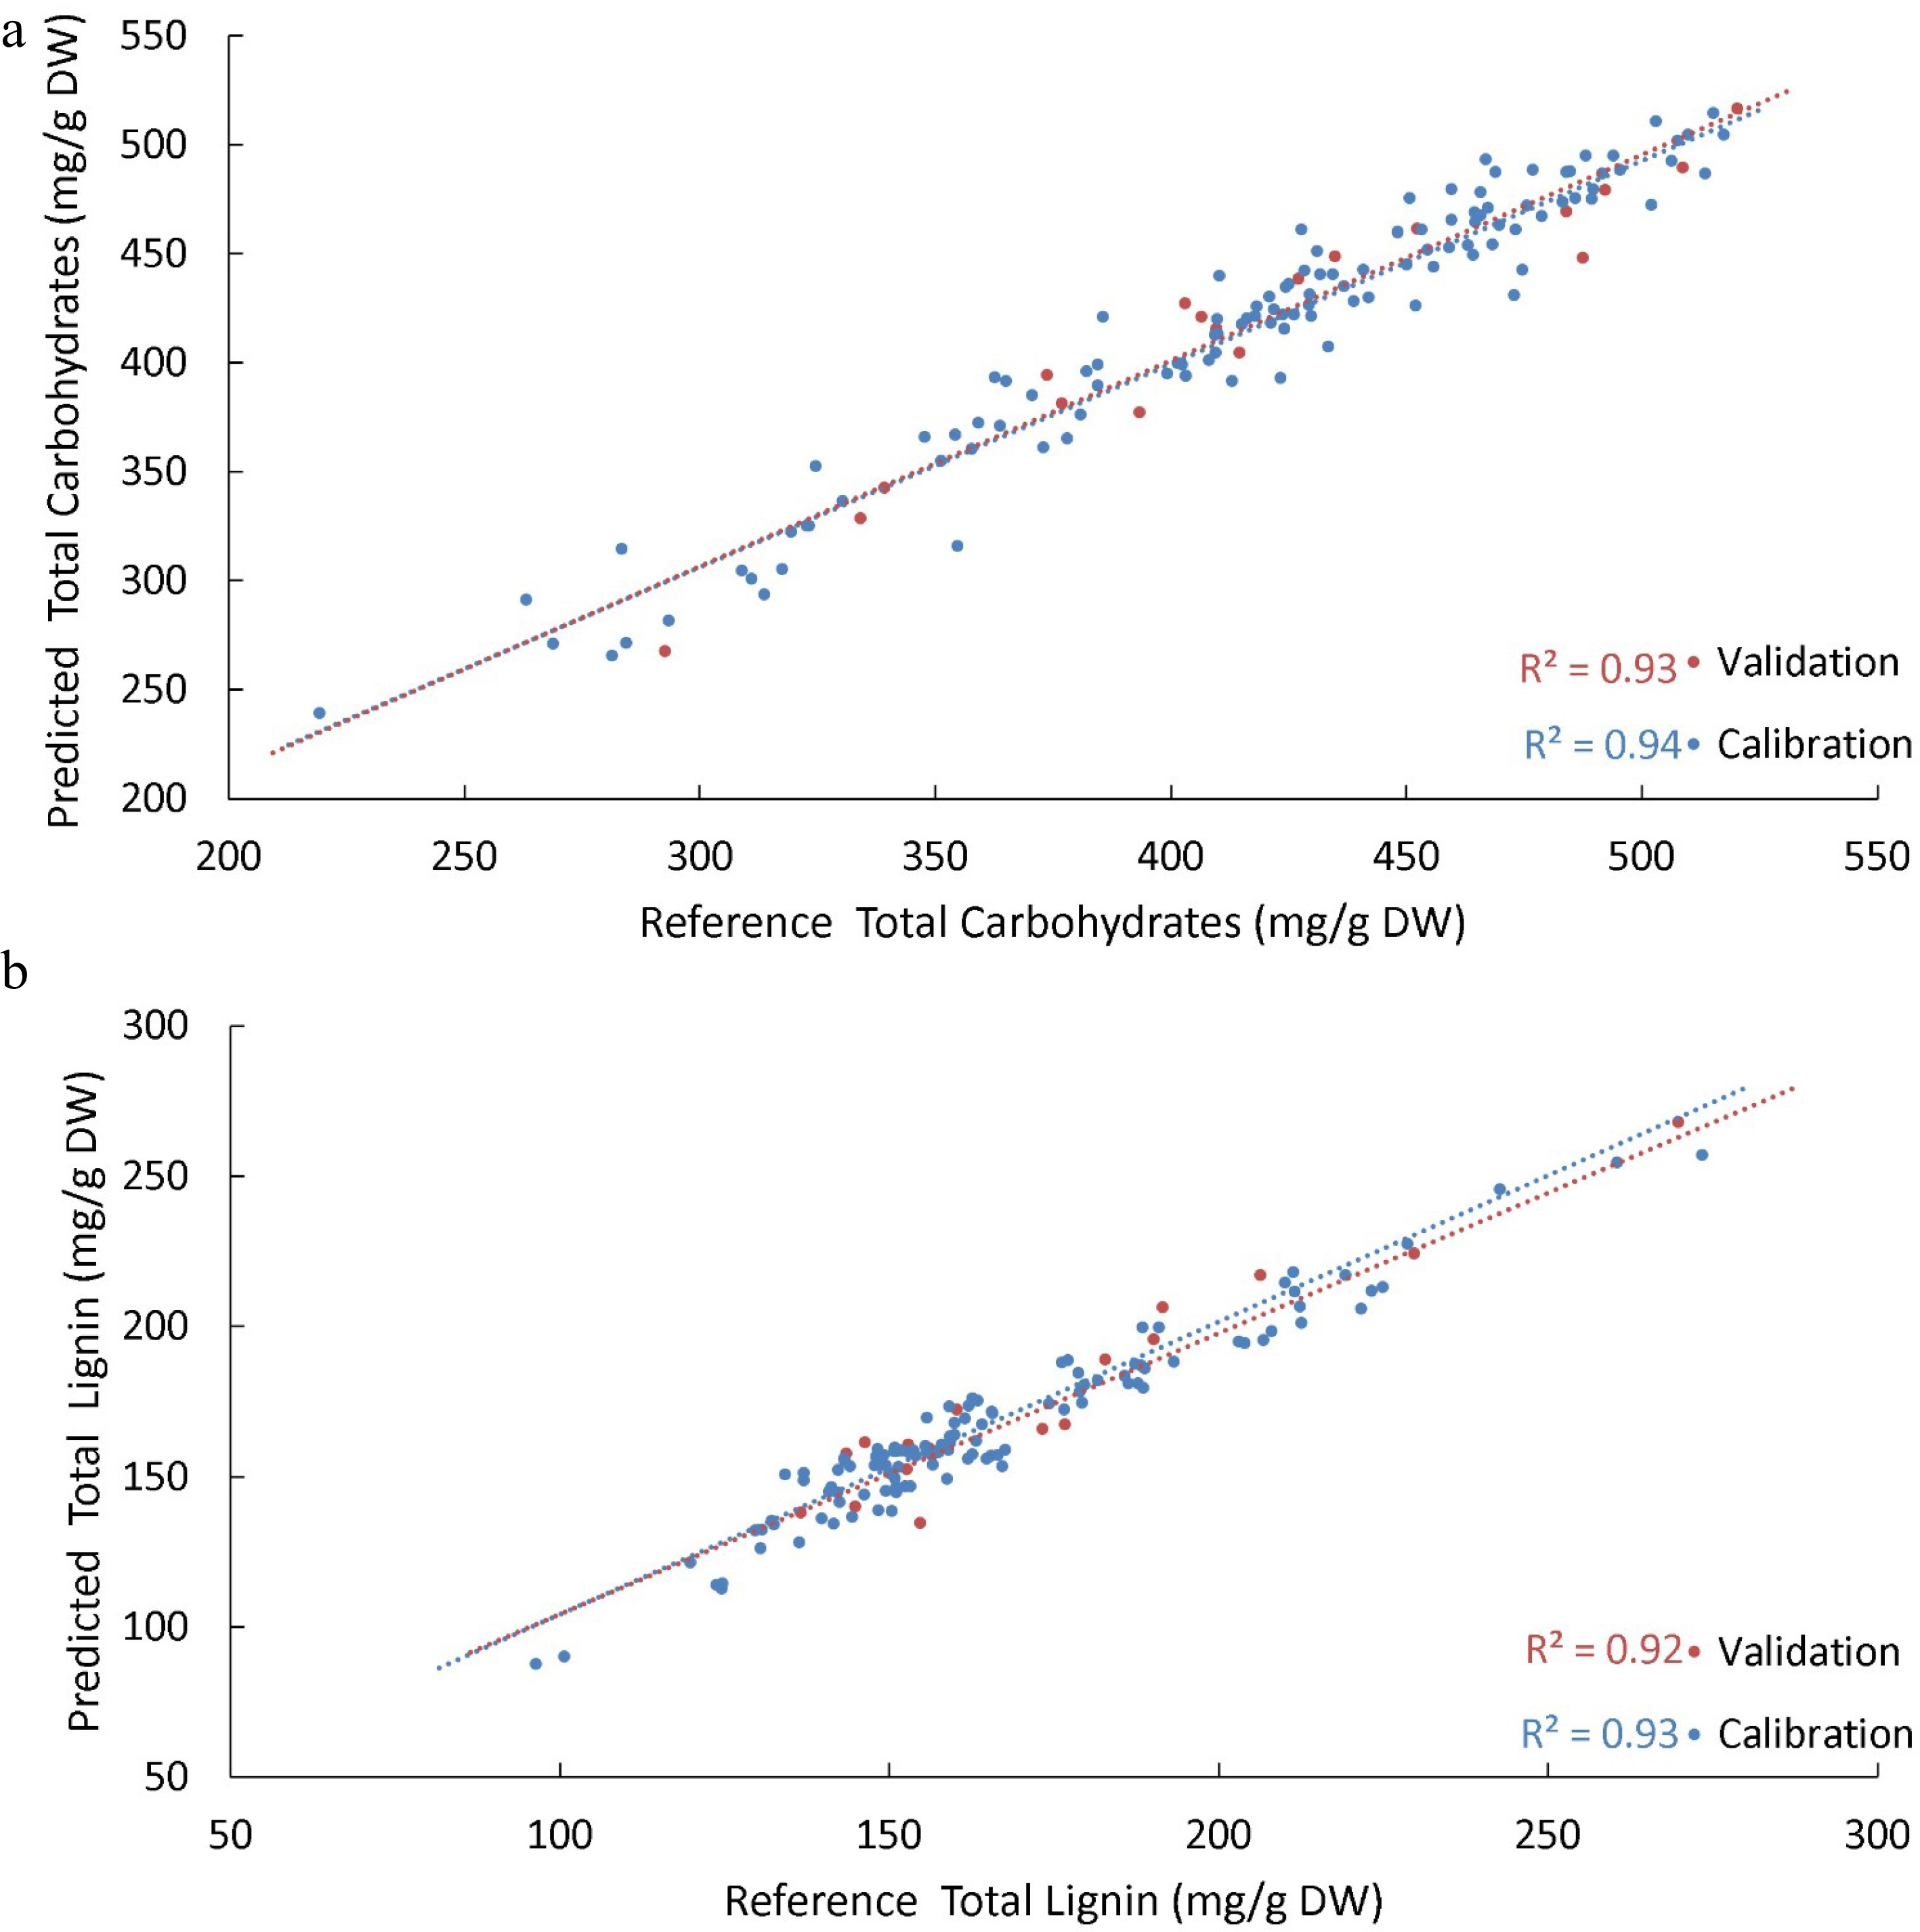
      Figure 2. 

      PLSR models were generated to predict the various biomass components of Cynodon cultivars. (a) Shows the predicted values from the PLSR model developed for total carbohydrates present in the cell wall versus reference values for the same sample. (b) Shows the predicted versus reference values for total lignin present in the cell wall. For both models, a subset of data was withheld to be used as an independent validation set of samples (red); the R2 of the validation set was used to assess the robustness of the model in predicting unknown samples. A benchmark R2 of 0.90 for this validation set was nominally established for predictive models, which both achieved.

    • Initial analysis of all measured traits was performed using a mixed-effects model for a split-plot analysis of variance with period, cultivar and reduced PPF treatment as the main effects, and residuals for the model were calculated using a first-order autocorrelation to account for repeated (weekly) measures using the ASReml-R software package. Variance components are given in Supplemental Table S1 which showed that 'period' was the main factor accounting for observed variation in the key traits. However, this repeated measures analysis did not give the opportunity to present the data in a way that would be easily displayed, for example, we would not have been able to present histograms, with Least Significant Difference (LSD = 0.05) for key traits; treatments and cultivars for each period of this study. Consequently, for clarity of data presentation, three independent split-plot analyses one for each period, without repeated measures, were performed on all traits (clipping yield, turf quality, water quality, extractives, cell wall, total carbohydrates, glucan, xylan, arabinan, galactan, mannan, total lignin, AIL, ASL and ash) in the final week of each period using the Agricolae package in R studio to determine the effect of treatment and cultivar. Throughout the trial multivariate analyses were used to develop dendrograms and PCA plots. All values were standardized by dividing the mean for each variable by the standard deviation for that period. Dendrograms were constructed using Ward Linkage and Squared Euclidean distance options to observe interrelationships among, traits, cultivars and altered PPF levels at each time period. These multivariate analyses were also performed in R Studio using the gclus, dendextrend, dplyr, stats, and ggplot2 packages.

    • The initial mixed effects analysis of clipping yield (Supplemental Table S1) revealed that period (46.5% of variance) had the greatest influence on the variation observed in clipping yield followed by cultivar and no variation due to treatment. However, there was variation attributed to interactions between the treatments and period and cultivar, suggesting that cultivars responded to the shade treatments differently at different points throughout the trial. For this reason a comparison at the end of each period for all traits investigated was undertaken to determine which traits changed between periods.

    • The main effects (PPF treatments, cultivar) were significant in each period (short, medium and long), however, interaction effects were only significant for the medium and long periods (Table 2). Consequently, LSD's were calculated using the appropriate error terms of the ANOVA for a split plot as calculated using the Agricolae package[29]; shown in Supplemental Tables S3S5.

      Table 2.  ANOVA analysis results for clipping yields at the short, medium and long period time points for eight cultivars of Cynodon grasses grown under 0% (control), 30%, 50% and 70% reduced PPF. At all periods, there were significant differences between cultivars and reduced PPF treatments. It was also found that there were significant interactions between cultivar and treatment at the medium and long periods. Significance determined by p-value (* < 0.05, ** < 0.01, *** < 0.001).

      Short periodMedium periodLong period
      Cultivar*********
      Treatment*********
      Cultivar : Treatment*****

      At the end of the short period (Fig. 3a), the 30%, 50% and 70% reduced PPF treatments exhibited a significant (p-value < 0.05) increase in weekly clipping yield compared to the control treatment, with the Legend® cultivar the least affected. There were also notable differences in clipping yield between cultivars with Latitude 36®, TifSport® and Wintergreen producing significantly higher clipping yields than Legend® and UQ 545. At the end of the medium period (Fig. 3b), total clipping yield was still higher for most cultivars grown under the 30%, 50% and 70% reduced PPF treatments, with the 30% reduced PPF treatment providing the highest clipping yield for most cultivars. When grown under the 30% reduced PPF treatment, the clipping yield for Wintergreen was the highest yielding combination of cultivar and reduced PPF treatment; it was also significantly higher than any total clipping yield collected for the Legend® cultivar and all but the 50% reduced PPF treatment clipping yield collected for OZTUFF®.
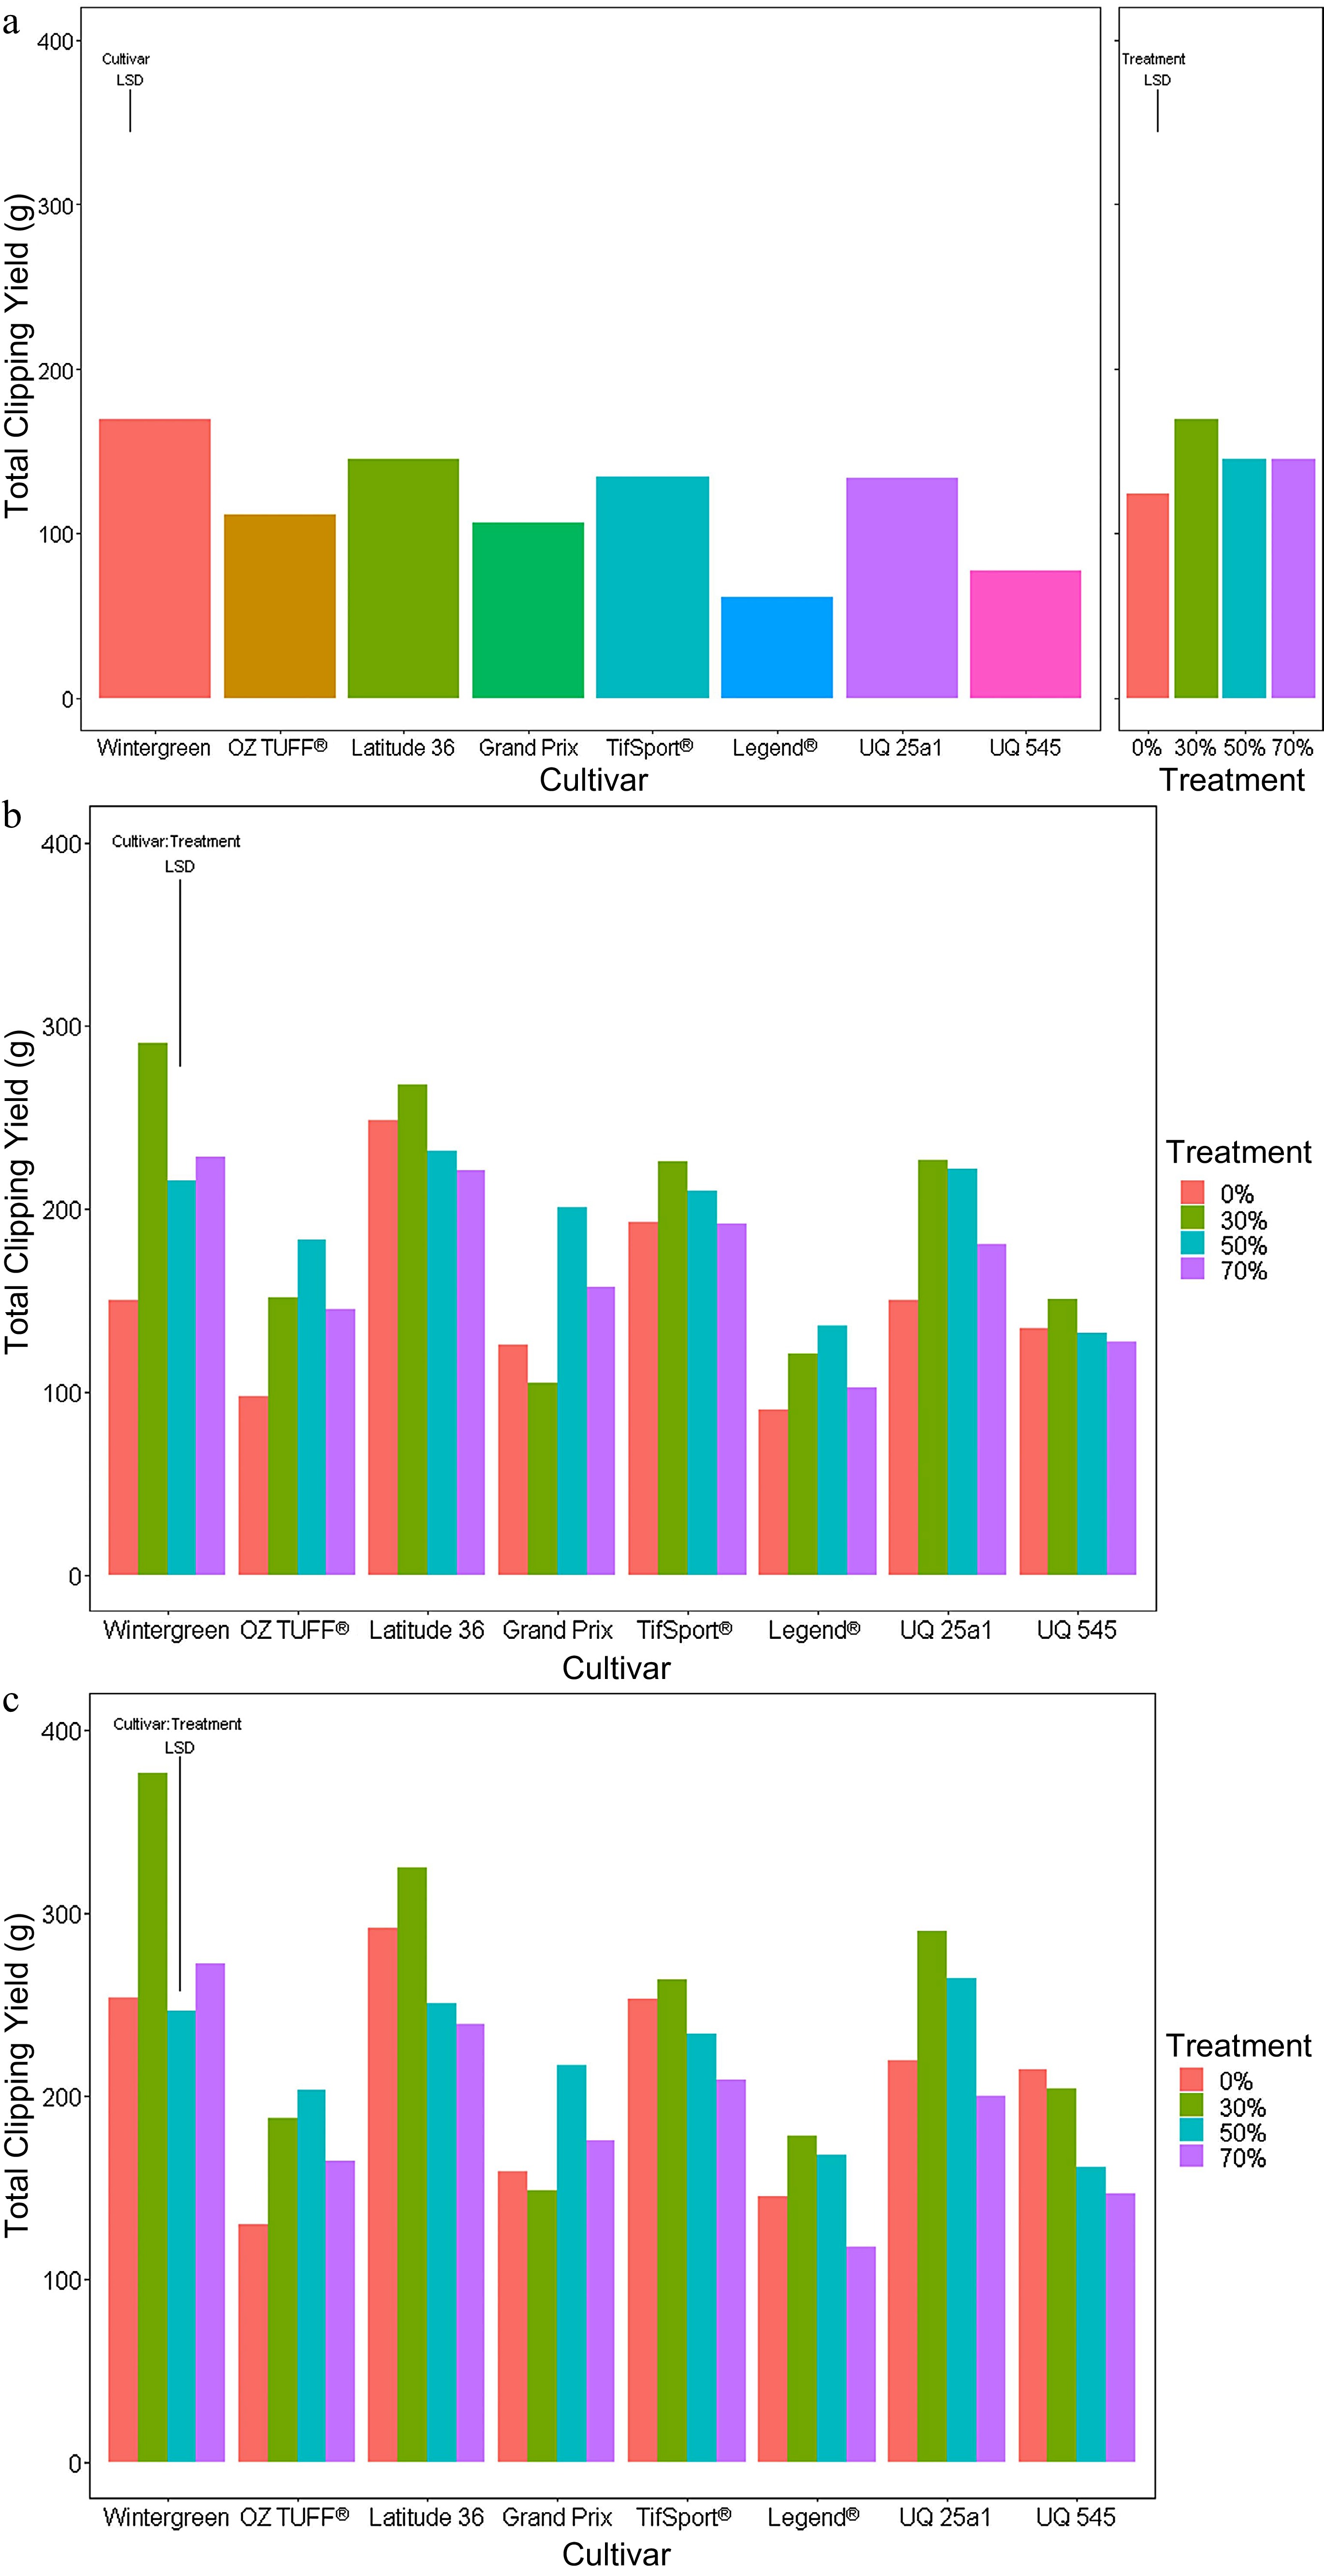
      Figure 3. 

      Accumulated clipping yields of eight cultivars (Wintergreen, Oztuff®, Latitude 36®, Grandprix, TifSport®, Legend®, UQ 25a1 and UQ 545) of Cynodon grasses grown under different treatments; 0% control, 30%, 50% and 70% reduced PPF. The accumulated clipping yield was assessed at three time points, (a) short (weeks 1−2), (b) medium (weeks 1−5) and (c) long (weeks 1−7) periods. Significance was determined based on an LSD post hoc ANOVA analysis with an alpha value of 0.05.

      At the end of the long period (Fig. 3c), the 30% reduced PPF treatments for many cultivars again produced the highest total clipping yield. Wintergreen accumulated the highest clipping yield overall and was significantly different from any total clipping yield recorded for OZTUFF®, Grand Prix Legend® and UQ 545. Summaries of the LSD post hoc analysis for all three periods are presented in Supplemental Tables S3, S4 and S5.

    • At the outset of the trial, all cultivars were assessed for turf quality and scored the maximum of ten. At the end of the medium period (week five; Fig. 4a), cultivar Latitude 36® showed a significant (p-value < 0.05) depletion in turf quality under both the 50 and 70% reduced PPF treatments, whereas the quality of OZTUFF® was only negatively affected by the 70% reduced PPF treatment (Fig. 4a). In the late period (Fig. 4b), all cultivars except for Grand Prix, showed significant decreases in turf quality under the 70% reduced PPF treatment compared to the control, with Latitude 36® and UQ 545 cultivars also showing significant differences under the 50% reduced PPF treatment with the LSD post hoc in Supplemental Tables S6 & S7).
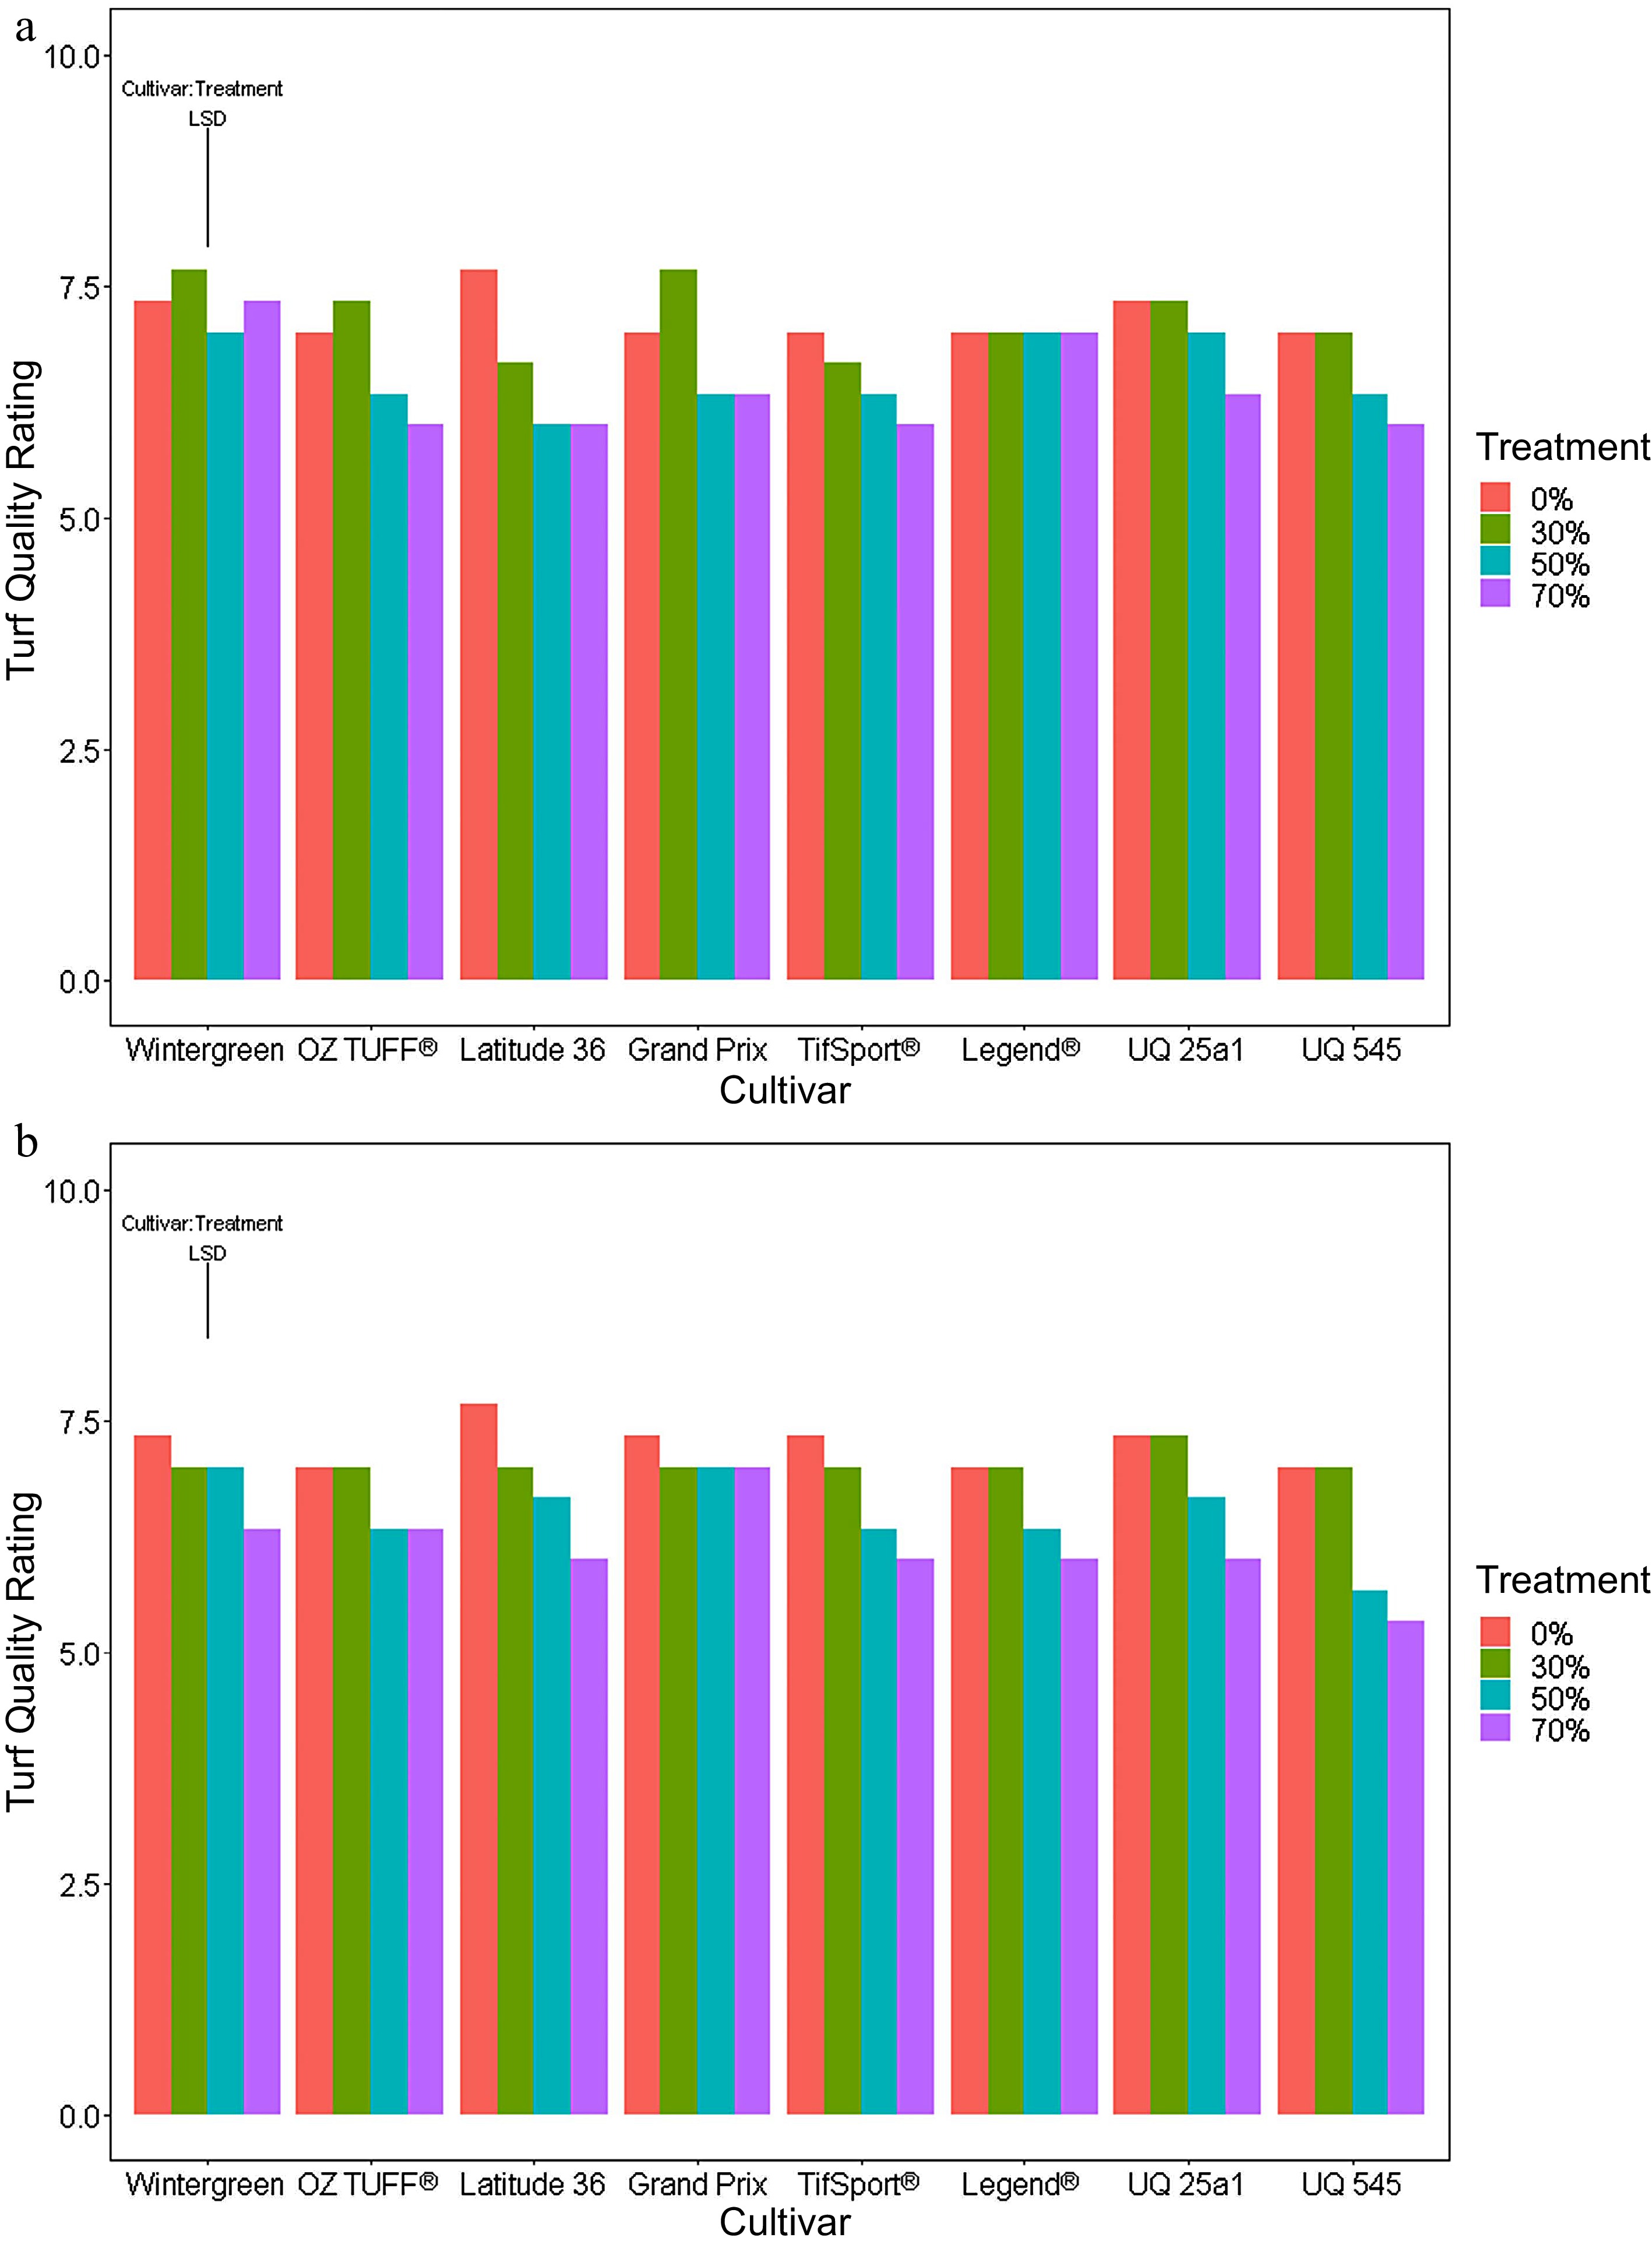
      Figure 4. 

      Mean turf quality scores in the final week of the (a) medium (week 5) and (b) long periods (week 7) using a split plot analysis ANOVA. The ANOVA revealed there were significant interactions between the two main effects cultivar and reduced PPF treatments for both periods and so a LSD was calculated for cultivar: treatment with a significance p value set at < 0.05.

    • Biomass composition was assessed using dendrograms and PCA generated from standardized values collected at the end of each period. This combination of analyses allowed any associated biomass component, e.g., lignin or structural carbohydrate, associated with a cultivar or reduced PPF treatment to be identified. At the end of the short period (Fig. 5), it was clear that cultivar was the dominant factor in determining the composition of the clipping biomass collected. TifSport® and OZTUFF® (circled in orange) clustered together in the dendrogram (Fig. 5a) and were found in the PCA (Fig. 5b) to be associated with clipping yield, extractives, biomass, lignin and AIL. Other cultivars grouped in the dendrogram (Fig. 5a) and formed a cluster (circled in purple) that was associated with all structural carbohydrates investigated, the cell wall and water content. A third cluster (circled in brown) made up primarily of UQ545 and Legend® cultivars grown under 30%, 50% and 70% reduced PPF treatments, associated with higher ash and ASL content.
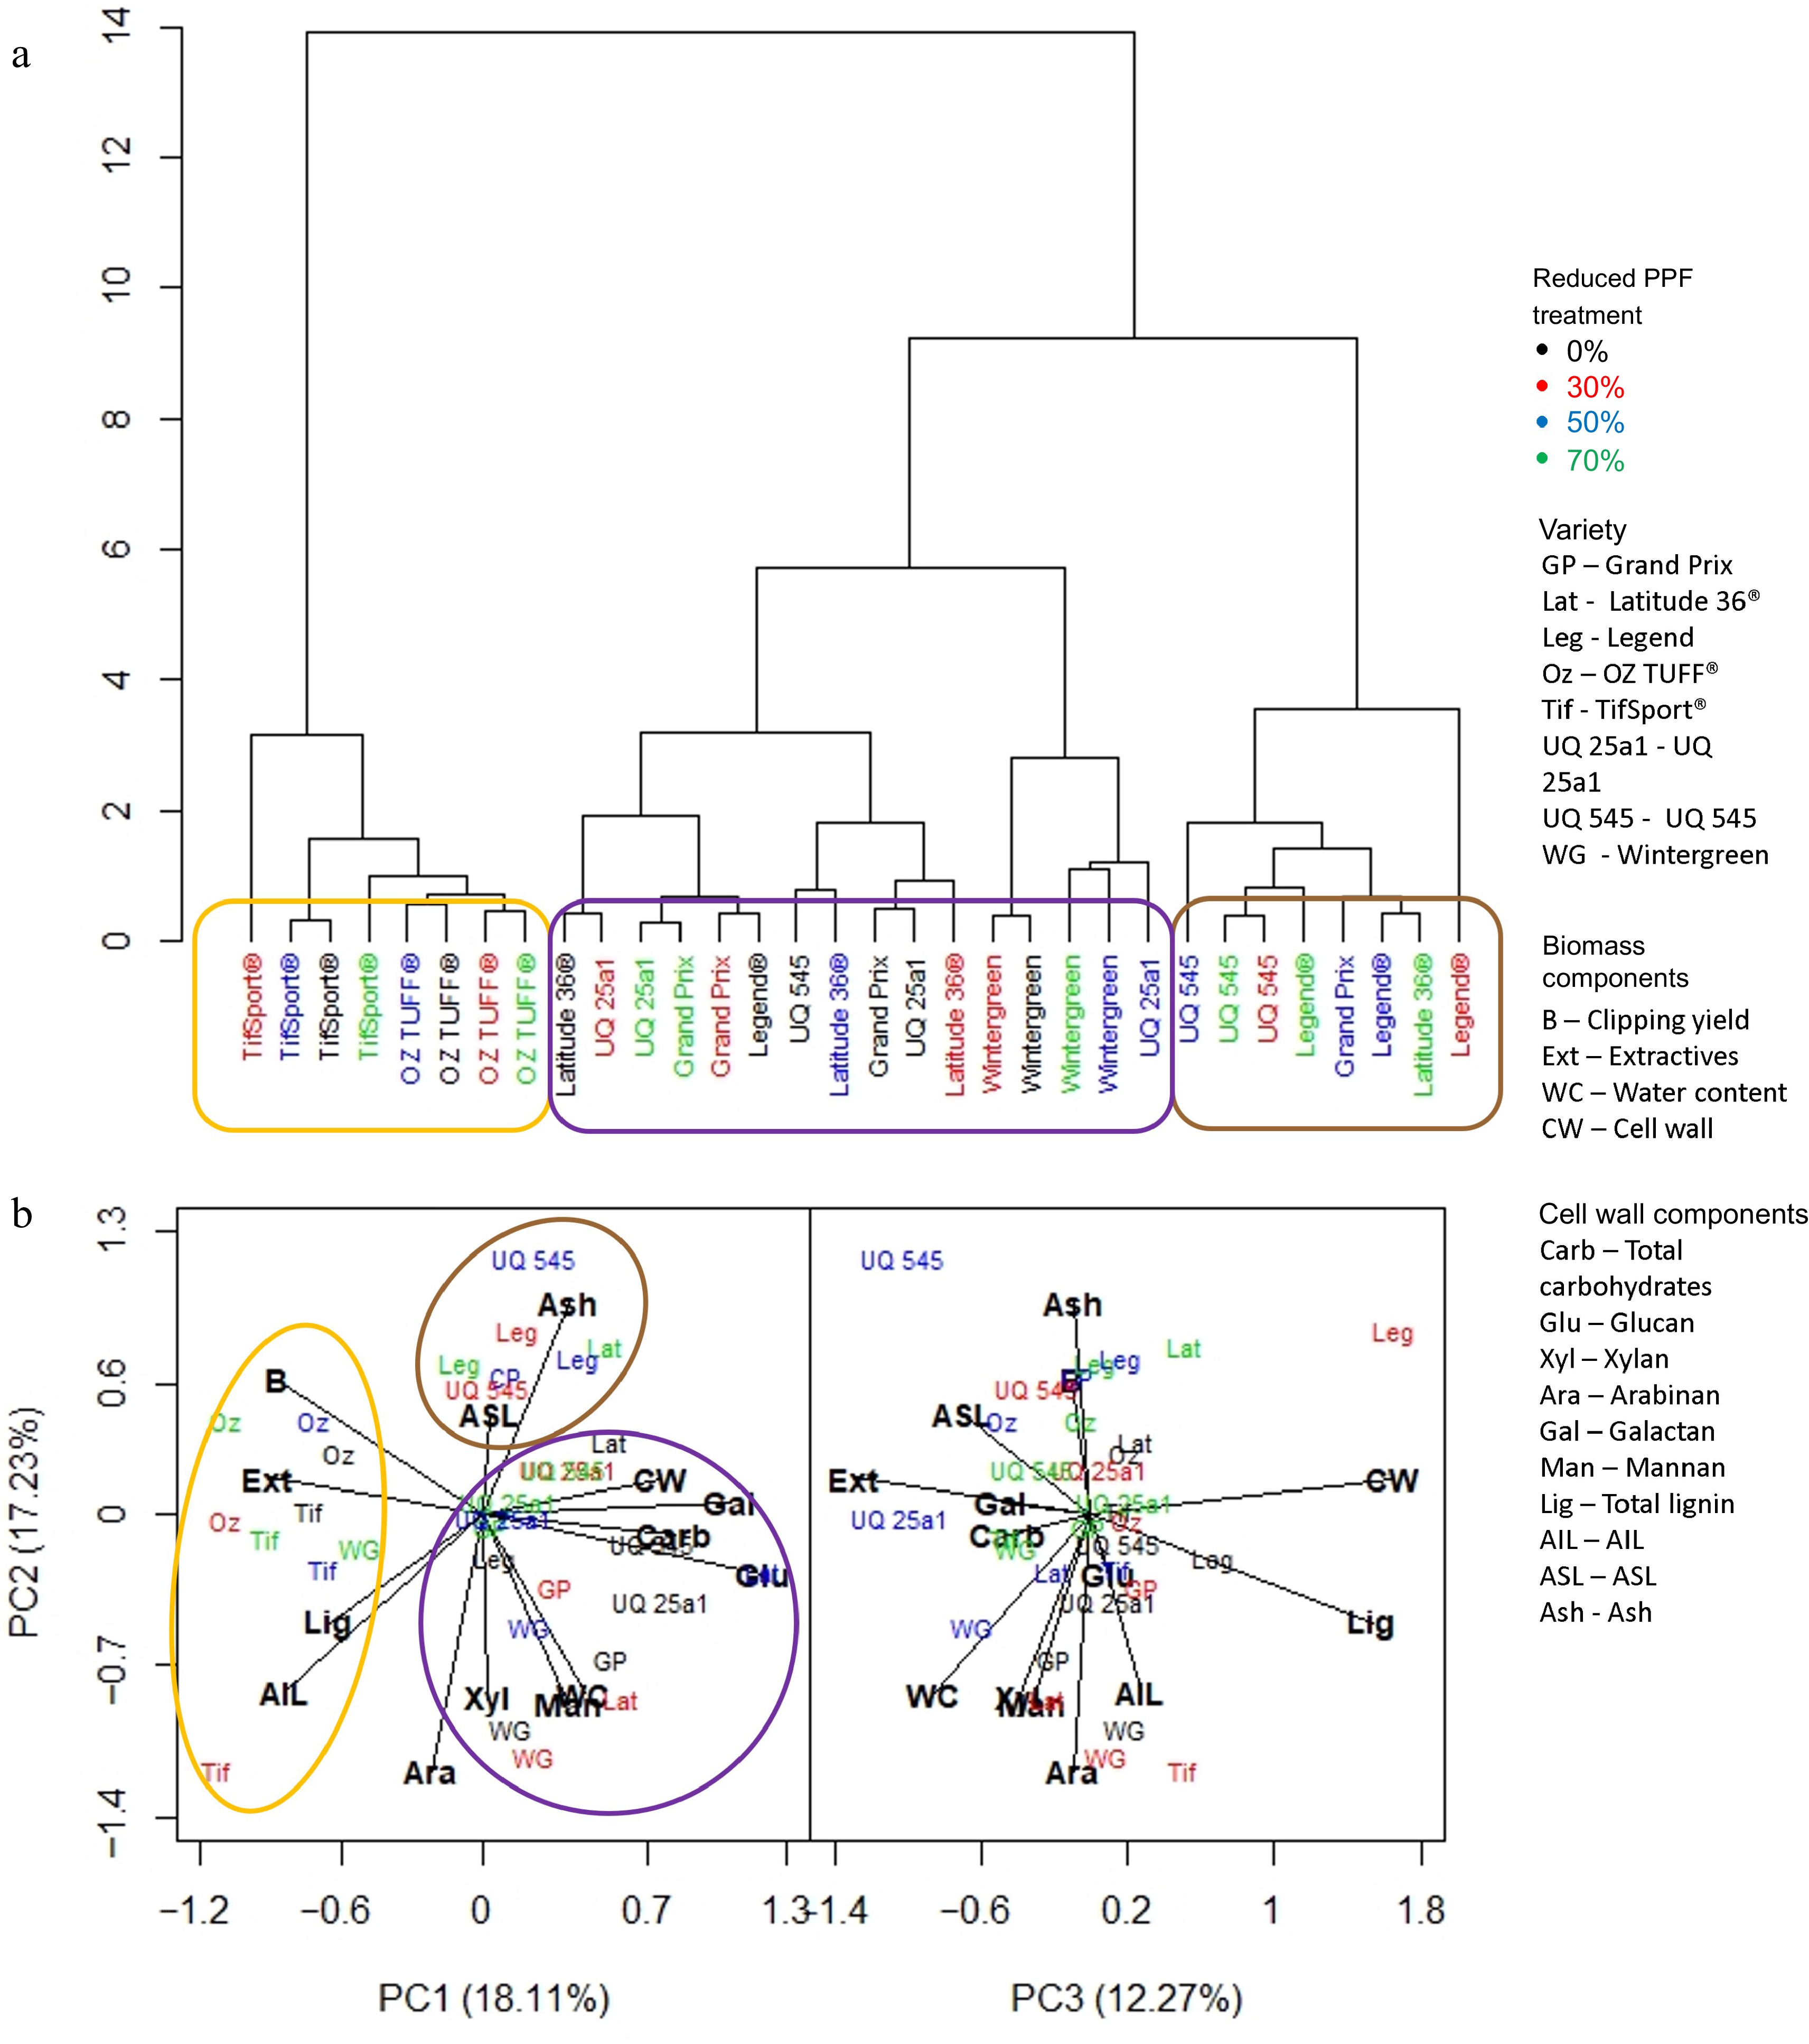
      Figure 5. 

      (a) Dendrogram based on standardized means derived from each trait investigated and the influence of cultivar and reduced PPF treatments on that trait at the final week (week two) of the short period (weeks 1−2). (b) PCA analysis was generated from the same dataset, showing which trait was associated with cultivar or reduced PPF treatment. Clusters identified in the dendrogram are circled and highlighted in the PCA analysis.

      The dendrogram at the end of the medium period (Fig. 6a) showed that the reduced PPF treatments exerted more influence on the predicted biomass components, forming two distinct clusters. The first, circled in orange, contained the control for every cultivar, the 30% reduced PPF treatment for some cultivars (Latitude 36®, UQ 25a1 and Grand Prix), and all reduced PPF treatments for cultivar UQ 545. This cluster was associated with total carbohydrates, glucan, xylan and extractives (Fig. 6b). The other cluster circled in purple was comprised of the 30% reduced PPF treatments of the remaining cultivars and all 50% and 70% reduced PPF treatments for all cultivars except UQ545; and was associated with ash, cell wall, water content AIL, ASL and lignin (Fig. 6b).
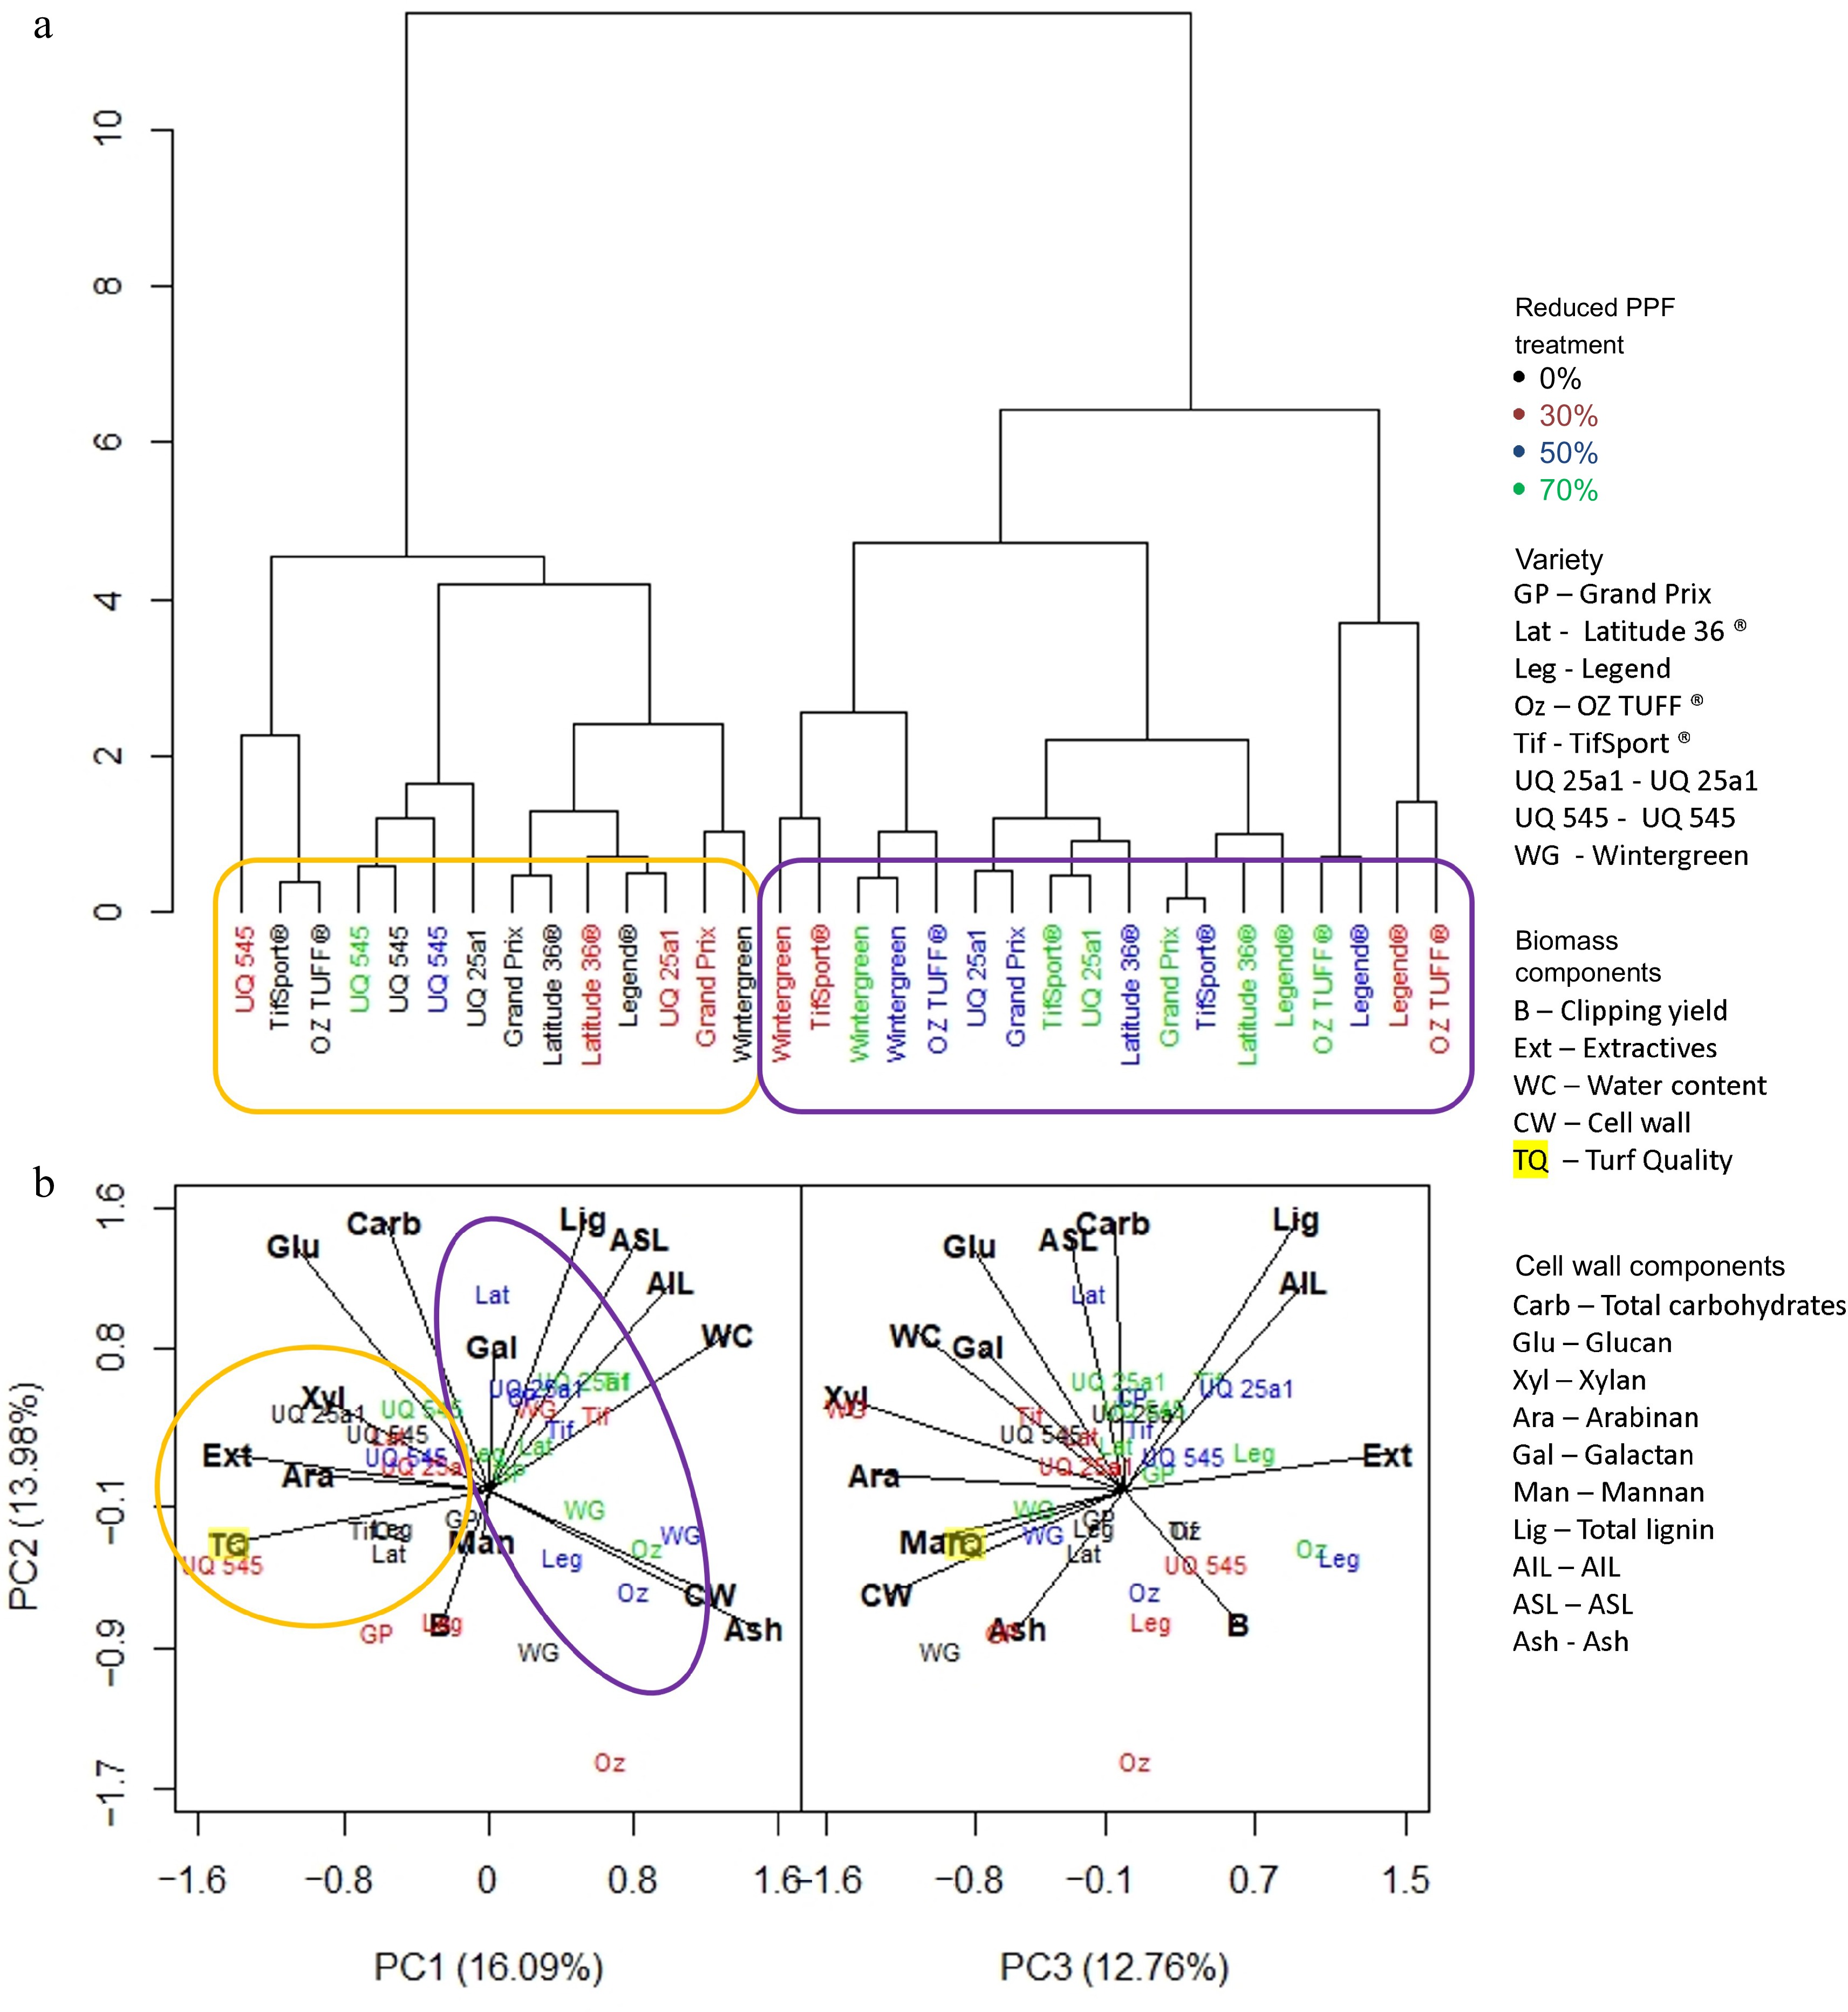
      Figure 6. 

      (a) Dendrogram based on standardized means derived from each trait investigated and the influence of cultivar and reduced PPF treatments on that trait at the final week (week five) of the medium period (weeks 1−5). (b) PCA analysis was generated from the same dataset, showing which trait was associated with cultivar or reduced PPF treatment. Clusters identified in the dendrogram are circled and highlighted in the PCA analysis.

      At the end of the long period (Fig. 7a), the dendrogram showed that the reduced PPF treatments were the more influential variable, with two main clusters forming; the first (circled in orange) was comprised only of non-control treatments and except for the 30% reduced PPF treatment of the TifSport® cultivar, of 50% and 70% reduced PPF treatments only. This group was associated with high water content, lignin, AIL, mannan, arabinan, galactan and ash. The second cluster was divided into two more groups; the first (circled in purple) was comprised entirely of control and 30% reduced PPF treatments, except for the 70% reduced PPF treatment of UQ 545; this group was associated with increased amounts of total carbohydrates, glucan, xylan, ASL and higher turf quality scores (Fig. 7b). The final group (circled in brown) was small, comprised of all non-control reduced PPF treatments for Legend®, the control and 30% reduced PPF treatments for OZTUFF®, and the 50% reduced PPF treatment for UQ 545; this group was associated with higher extractive content.
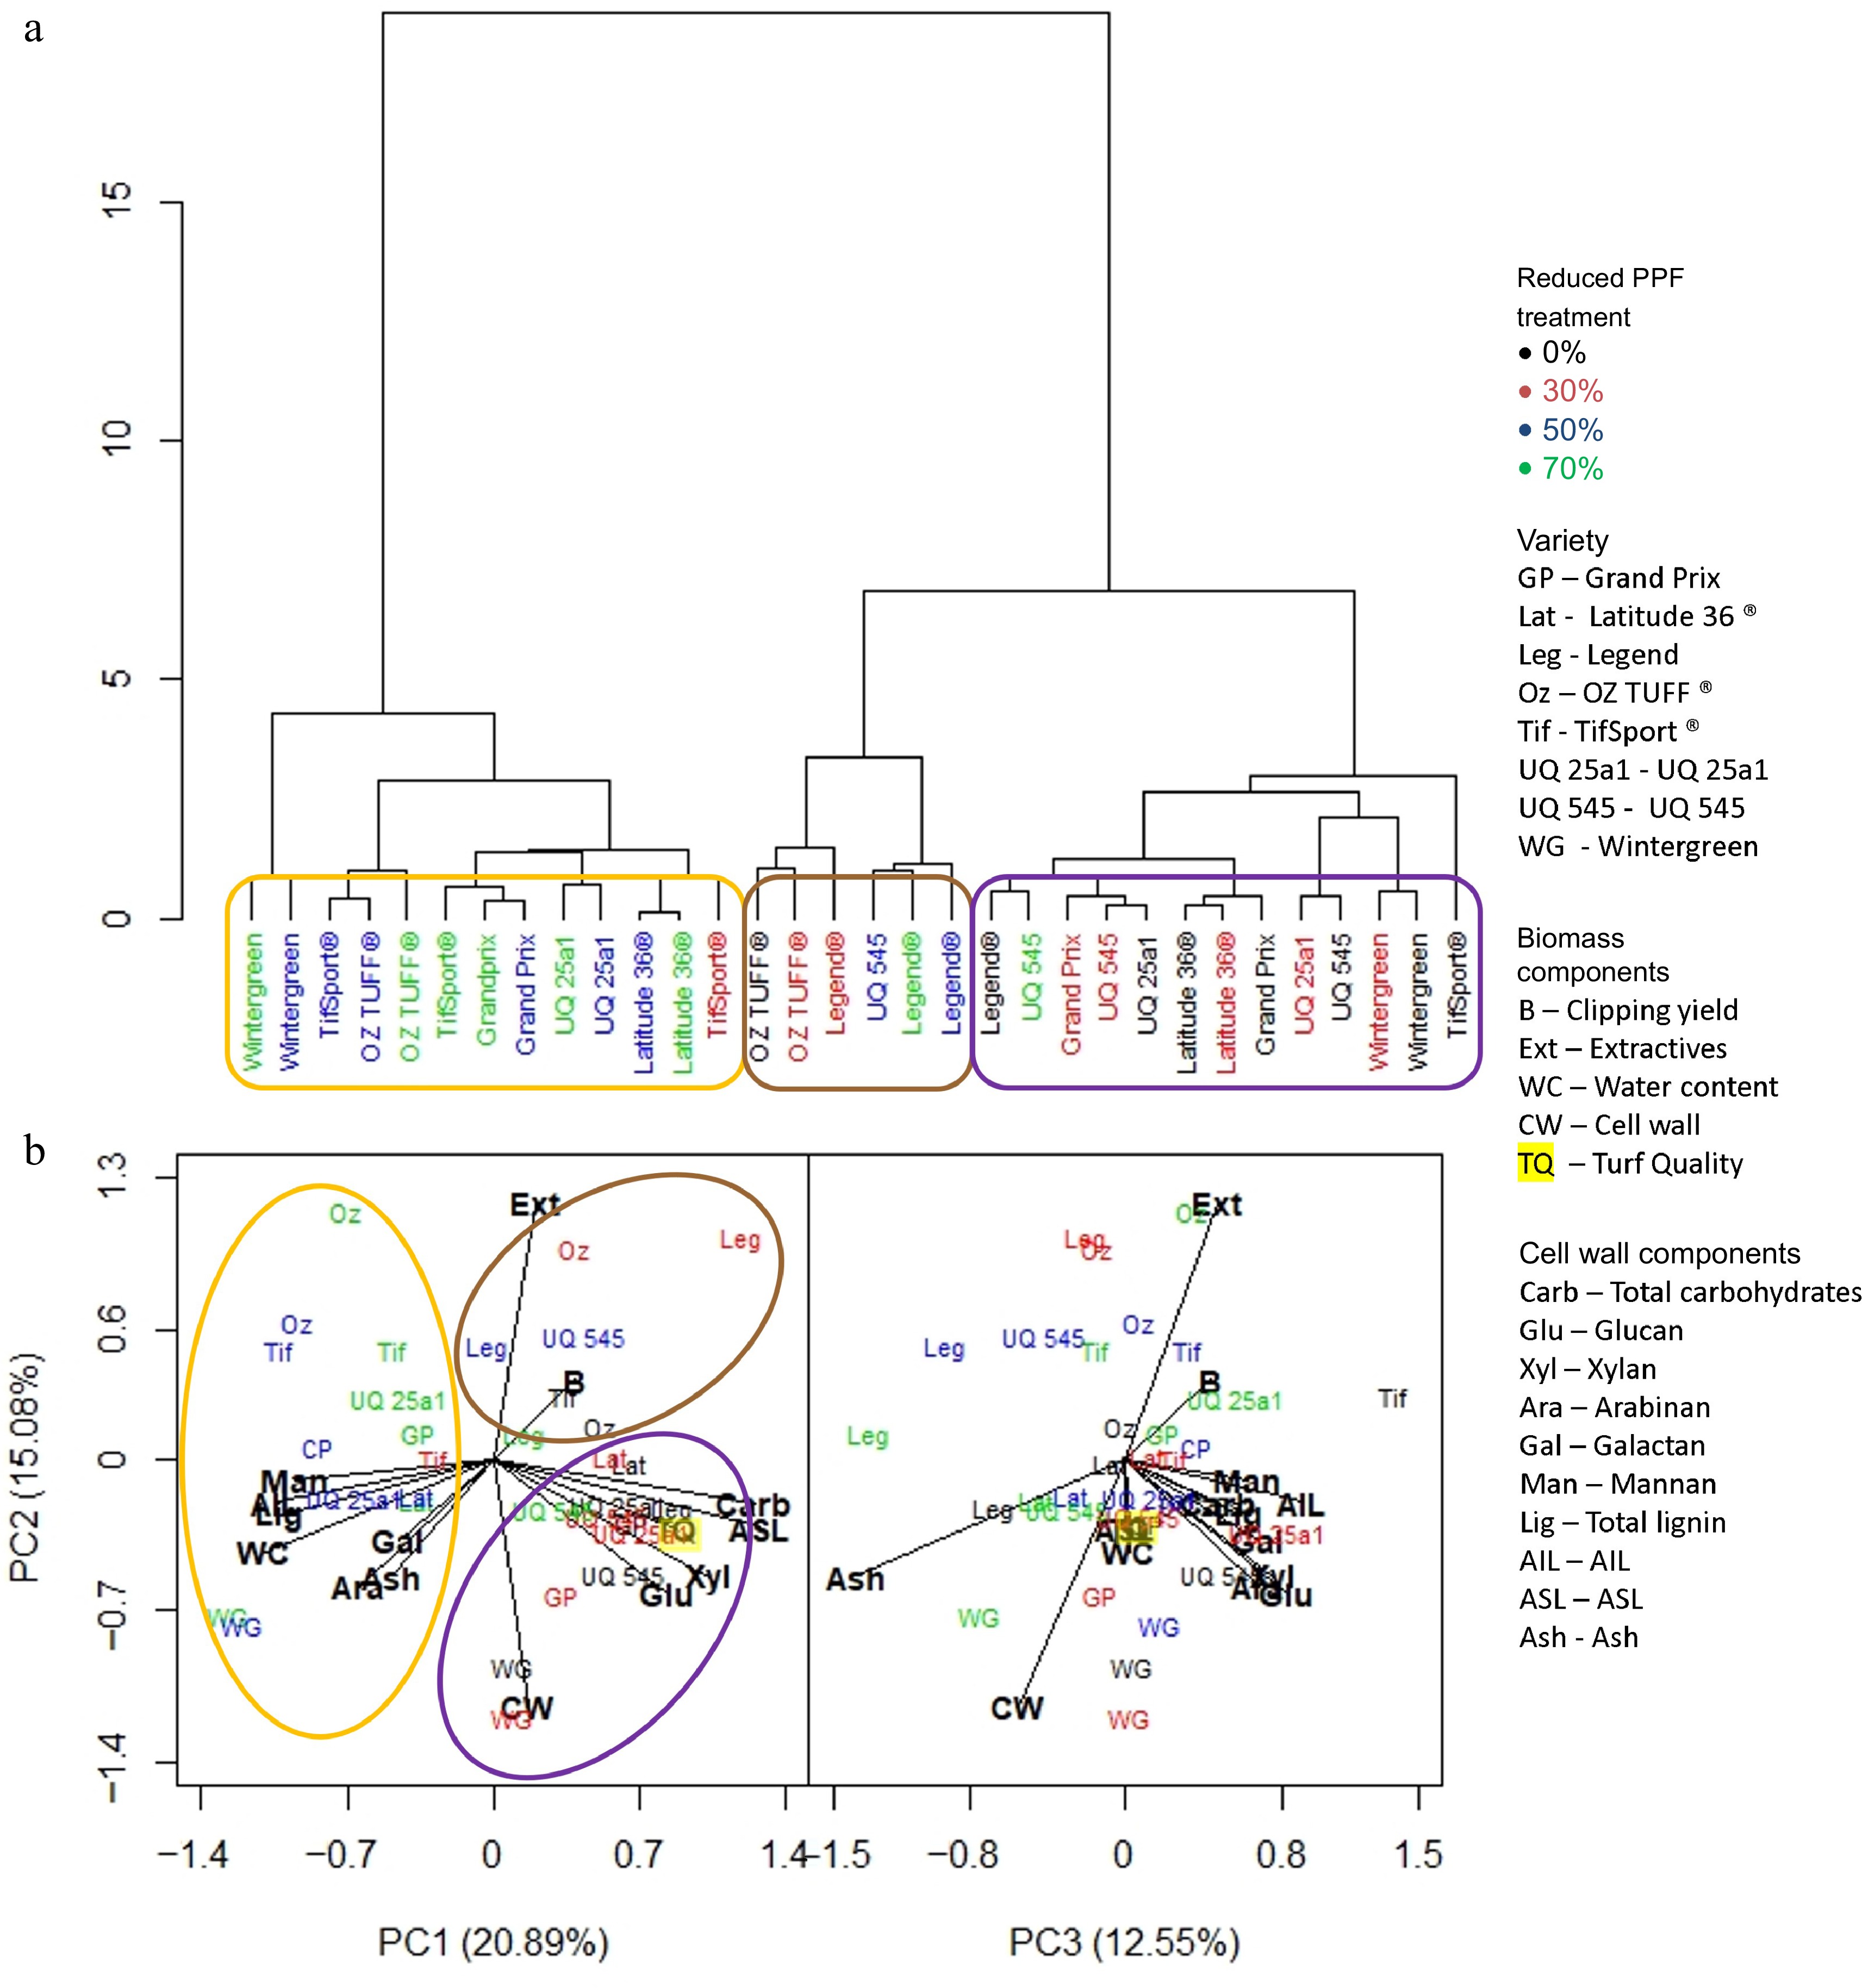
      Figure 7. 

      (a) Dendrogram based on standardized means derived from each trait investigated and the influence of cultivar and reduced PPF treatments on that trait at the final week (week 7) of the long period (weeks 1−7). (b) PCA analysis was generated from the same dataset showing which trait was associated with cultivar or reduced PPF treatment. Clusters identified in the dendrogram are circled and highlighted in the PCA analysis.

    • The PLSR models based upon FTIR spectrometry were demonstrated to effectively assess and discriminate cell wall composition in over 1300 samples collected during this study. The high-quality models provided the platform to investigate the impact of different levels of PPF upon cell wall compositional changes in grasses at a grander scale than could have been achieved with traditional methods. Notably, we found strong correlations of cell wall components with turf quality at the end of the experimental period.

      PLSR models based upon FTIR spectrometry have been utilised in previous studies investigating different cultivars of forage grasses, such as sorghum, switchgrass and panic grass[25,30]. The focus has been on the enzymatic release of sugars, primarily glucose and xylose, as well as other cell wall constituents, lignin and ash, to assess superior cultivars or mutated lines primarily within the context of assessing potential feedstocks for the biofuel industry[25,30]. The PLSR models generated for this study (glucan, R2 = 0.96, xylan, R2 = 0.87, lignin R2 = 0.92, and ash R2 = 0.97) measuring sugars released by acid hydrolysis, were equivalent or superior to other PLSR models developed for comparable components, where R2 values ranged from 0.81−0.91[2325,31]. The models for galactan (R2 = 0.77), arabinan (R2 = 0.64) and mannan (R2 = 0.41) content which were not measured in previous enzymatic based PLSR driven studies, performed below this stringent level, as arabinan, galactan and mannan were only present in very low concentrations, which at times approached the lower limits of the HPLC equipment to measure accurately.

      Throughout the trial, clipping yield varied considerably between cultivars and treatments. Increased clipping yield under reduced PPF treatments in the short period and prolonged by some cultivars into the medium and long periods, was likely due to a reduction in evapotranspiration rate, reduced thermal stress and an increase in far-red light which have previously been reported to be positive attributes of canopy shade and likely mimicked by the woven shade cloth in this experiment[3234]. As bermudagrasses are rhizomatous, it is possible that shaded plants may have benefited from the remobilisation of stored carbohydrates from these or other organs, such as stolons[35]. The impact of reduced PPF treatments upon yield are cumulative, as reported in field sown pasture species, including grasses. However, significant reductions in yield were only evident after three months at reduced PPF levels greater than 60%[2]. Cultivars of Cynodon grasses did not exhibit a universal response to reduced PPF; for example, neither the 50% nor 70% reduced PPF treatments clipping yield for the Legend® cultivar grouped with the majority of 50% and 70% treatments at the end of the long period. Variation in response to shade stress between cultivars of the same species has been found in other shade-related studies, suggesting that multiple responses to shade stress are possible; for example, species with lower vertical growth rates are considered more shade tolerant while within species, there are still considerable differences in growth and quality that can surpass differences between species found within the same study[14,36].

      The relationship between cultivar and reduced PPF treatment effects on cell wall composition supported a cumulative response to decreased PPF, with cultivar initially the more influential factor at the short period time point and reduced PPF the more influential factor at the final long period time point. The key example of this was the TifSport® and OZTUFF® cultivars that were associated with specific cell wall components at the short period time point regardless of treatment, compared to the final long period time point, where they, as with most cultivars, were separated based on the reduced PPF treatments applied.

      The effect of shade avoidance on cell wall composition has been well characterized in Arabidopsis thaliana, with cell walls becoming more flexible due to increased activity of cell wall modifying enzymes and decreased lignin content[37]. Genes encoding key enzymes catalysing steps of the lignin synthesis pathway have been downregulated in soybean and rice under shade stress, resulting in increased lodging[38]. Conversely, studies of A. thaliana and Glycine max suggest that plant cultivars with greater shade tolerance have higher lignin content than those less shade tolerant[39]. Acid Digestible Fibre (ADF) is a useful forage quality measurement that has been a focus of several studies aimed at determining the effect of shade on tropical forages where ADF, which is primarily comprised of lignin and structural carbohydrates, was higher in response to shade[4042].

      At the final experimental time point, turf quality was negatively correlated with total lignin and AIL and positively correlated with carbohydrates glucan, xylan and ASL. The consequence of these relationships in terms of genetic variation in response to changes in PPF, was that under incremental reductions in PPF, grasses with the highest turf quality had lower concentrations of total lignin and AIL and a higher concentration of carbohydrates and ASL. This suggests that as Cynodon grasses were exposed to step-wise reductions in PPF, a measurable stress response was evoked.

      In most angiosperms, when exposed to shade stress, the growth pathway (regulated by phytochrome B signalling, which responds to uncompromised high light intensity, i.e., higher R:FR ratios) is prioritized over the defense pathway (regulated by jasmonic acid signalling), by outcompeting and inhibiting access to transcription factors shared by both pathways[43,44]. Recent evidence in Scots pine (Pinus sylvestris) and Norfolk spruce (Picea abies), however, has shown that in higher latitudes, the defense pathway is preferred[45,46]. Trees in northern regions growing under reduced PPF showed up-regulation of key genes involved in lignin synthesis and key transcription factor suppressors such as MYB3 and MYB4 were down-regulated compared to those pines originating from southern regions where PPF is more abundant[45].

      In the present study with Cynodon grasses, the observed changes associated with the elevated shade treatments indicate key elements of a defense response to the shade stressor[37]. Other stressors have reportedly interacted with the response to decreased PPF, such as salt stress inhibiting hypocotyl and petiole elongation, reducing the ability of a plant to respond to light stress[44,47]. During this experiment, the grasses were subjected to reduced PPF and clipped and the effects of these stressors could have been confounded. The clipping regime implemented during this study may have promoted the defense response pathway over the growth pathway leading to an increase in lignin and ash content, both of which are increased in response to jasmonic acid signalling produced from wounding caused by clipping[48]. However, detailed transcriptomic analysis would be required to confirm such a hypothesis whilst furthering the understanding of how cell walls of Cynodon grasses respond to shade and the interaction of the phytochrome B regulated growth and the jasmonic acid regulated stress response pathways.

      • The authors declare that they have no conflict of interest. Christopher Lambrides is the Editorial Board member of Journal Grass Research who was blinded from reviewing or making decisions on the manuscript. The article was subject to the journal's standard procedures, with peer-review handled independently of these Editorial Board members and their research groups.

      • Supplemental Fig. S1 The layout of the split-plot design implemented to determine the effect of reduced PPF on i) the amount of biomass produced and ii) cell wall composition of eight different cultivars of Cynodon grasses. Each of the three blocks included the control (0% reduced PPF; white) and the reduced PPF treatments of 30% (red), 50% (blue) and 70% (green). The control and each reduced PPF treatment within each block included all eight cultivars (1) Wintergreen, (2) OZTUFF®, (3) Latitude 36®, (4) Grand Prix, (5) TifSport®, (6) Legend®, (7) UQ25a1 and (8) UQ 545.
      • Supplemental Fig. S2 Predicted cell wall mg /g dried biomass (DW) determined by application of a PLSR model generated from FTIR spectra vs measured (reference) values of isolated cell walls derived from ground leaf clippings of Cynodon grasses by washing non-cell wall extractives away with ethanol and 40°C water. The calibration set of samples (blue) was used to generate the model, while another independent validation set of samples (red) was used to test the capability of the model to predict unknown datasets with the R2 and RMSE obtained for the validation set providing a measure of the model's accuracy in predicting unknown samples based on their FTIR spectra.
      • Supplemental Fig. S3 Predicted water content of the cell wall value determined by PLSR model generated from FTIR Spectra vs reference values water extracted by freeze drying ground leaf clippings obtained from Cynodon grasses including the R2 and RMSE for a calibration and validation set of samples. The calibration set (blue) was used to generate the model, while another independent validation set (red) was used to test its ability to predict unknown datasets. The R2 and RMSE obtained for the validation set measured the model's effectiveness for predicting unknown samples based on their FTIR spectra.
      • Supplemental Fig. S4 Predicted ‘extractive’ values of the cell wall determined by PLSR model generated from FTIR Spectra vs reference of non-cell wall extracted mass from dried ground leaf clippings obtained from Cynodon grasses including the R2 and RMSE for a calibration and validation set of samples. The calibration set (blue) was used to generate the model, while another independent validation set (red) was used to test its ability to predict unknown datasets. The R2 and RMSE obtained for the validation set measured the model's effectiveness for predicting unknown samples based on their FTIR spectra.
      • Supplemental Fig. S5 Predicted Cell wall values determined by PLSR model generated from FTIR Spectra vs reference glucan values extracted from cell wall isolated from dried ground leaf clippings obtained from Cynodon grasses including the R2 and RMSE for a calibration and validation set of samples. The calibration set (blue) was used to generate the model, while another independent validation set (red) was used to test its ability to predict unknown datasets. The R2 and RMSE obtained for the validation set measured the model's effectiveness for predicting unknown samples based on their FTIR spectra.
      • Supplemental Fig. S6 Predicted Cell wall values determined by PLSR model generated from FTIR Spectra vs reference xylan values extracted from cell wall isolated from dried ground leaf clippings obtained from Cynodon grasses including the R2 and RMSE for a calibration and validation set of samples. The calibration set (blue) was used to generate the model, while another independent validation set (red) was used to test its ability to predict unknown datasets. The R2 and RMSE obtained for the validation set measured the model's effectiveness for predicting unknown samples based on their FTIR spectra.
      • Supplemental Fig. S7 Predicted Cell wall values determined by PLSR model generated from FTIR Spectra vs reference arabinan values extracted from cell wall isolated from dried ground leaf clippings obtained from Cynodon grasses including the R2 and RMSE for a calibration and validation set of samples. The calibration set (blue) was used to generate the model, while another independent validation set (red) was used to test its ability to predict unknown datasets. The R2 and RMSE obtained for the validation set measured the model's effectiveness for predicting unknown samples based on their FTIR spectra.
      • Supplemental Fig. S8 Predicted Cell wall values determined by PLSR model generated from FTIR Spectra vs reference galactan values extracted from cell wall isolated from dried ground leaf clippings obtained from Cynodon grasses including the R2 and RMSE for a calibration and validation set of samples. The calibration set (blue) was used to generate the model, while another independent validation set (red) was used to test its ability to predict unknown datasets. The R2 and RMSE obtained for the validation set measured the model's effectiveness for predicting unknown samples based on their FTIR spectra.
      • Supplemental Fig. S9 Predicted Cell wall values determined by PLSR model generated from FTIR Spectra vs reference mannan values extracted from cell wall isolated from dried ground leaf clippings obtained from Cynodon grasses including the R2 and RMSE for a calibration and validation set of samples. The calibration set (blue) was used to generate the model, while another independent validation set (red) was used to test its ability to predict unknown datasets. The R2 and RMSE obtained for the validation set measured the model's effectiveness for predicting unknown samples based on their FTIR spectra.
      • Supplemental Fig. S10 Predicted Cell wall values determined by PLSR model generated from FTIR Spectra vs reference AIL values extracted from cell wall isolated from dried ground leaf clippings obtained from Cynodon grasses including the R2 and RMSE for a calibration and validation set of samples. The calibration set (blue) was used to generate the model, while another independent validation set (red) was used to test its ability to predict unknown datasets. The R2 and RMSE obtained for the validation set measured the model's effectiveness for predicting unknown samples based on their FTIR spectra.
      • Supplemental Fig. S11 Predicted Cell wall values determined by PLSR model generated from FTIR Spectra vs reference ASL values extracted from cell wall isolated from dried ground leaf clippings obtained from Cynodon grasses including the R2 and RMSE for a calibration and validation set of samples. The calibration set (blue) was used to generate the model, while another independent validation set (red) was used to test its ability to predict unknown datasets. The R2 and RMSE obtained for the validation set measured the model's effectiveness for predicting unknown samples based on their FTIR spectra.
      • Supplemental Fig. S12 Predicted Cell wall values determined by PLSR model generated from FTIR Spectra vs reference ash values extracted from cell wall isolated from dried ground leaf clippings obtained from Cynodon grasses including the R2 and RMSE for a calibration and validation set of samples. The calibration set (blue) was used to generate the model, while another independent validation set (red) was used to test its ability to predict unknown datasets. The R2 and RMSE obtained for the validation set measured the model's effectiveness for predicting unknown samples based on their FTIR spectra.
      • Supplemental Table S1 Repeated measures mixed-effects model for a split-plot analysis of variance for all traits measured weekly with period, cultivar and reduced PPF treatment as the main effects. Residuals for the model were calculated using a first-order autocorrelation to account for the repeated weekly measures using the ASReml-R software package. Analysis revealed that period was the main influence on the variation observed for the majority of traits highlighted yellow.
      • Supplemental Table S2 Different pre-treatments were applied to the raw spectra obtained from the Perkin Elmer Spectrum II FTIR® spectrometer and a PLSR model generated with the transformed spectra and reference values. A calibration set of samples was used to generate each model and was evaluated by an independent validation set of samples. Each model was evaluated based on its calibration R2 and RMSE (mg/gDW) values, with those providing the lowest RMSE (mg/gDW) values for the validation set, chosen as the pre-treatment for the final model. The pre-treatments chosen for each variable measured are listed below with the calibration and validation R2 and RMSE (mg/gDW) values from that PLSR model.
      • Supplemental Table S3 (a). ANOVA table from a split plot analysis of clipping yield at the end of the short period (weeks 1-2). (b). Main effects (Reduced PPF) clipping yield means. LSD was calculated using Error a. (c). Subplot effects (Cultivar) clipping yield means. LSD was calculated using Error b. Groupings based on LSD are provided.
      • Supplemental Table S4 (a). ANOVA table from a split plot analysis of clipping yield at the end of the medium period (weeks 1-5). (b). Main plot (Reduced PPF) and subplot (Cultivar) interaction clipping yield means. Interaction LSD (p<0.05) was calculated using Error b. Groupings based on LSD are provided.
      • Supplemental Table S5 (a). ANOVA table from a split plot analysis of clipping yield at the end of the long period (weeks 1-7). (b). Main plot (Reduced PPF) and subplot (Cultivar) interaction clipping yield means. Interaction LSD (p<0.05) was calculated using Error b. Groupings based on LSD are provided.
      • Supplemental Table S6 (a). ANOVA table from a split plot analysis of turf quality at the end of the medium period (weeks 1-5). (b). Main plot (Reduced PPF) and subplot (Cultivar) interaction turf quality means. Interaction LSD (p value <0.05) was calculated using Error b. Groupings based on LSD are provided.
      • Supplemental Table S7 (a). ANOVA table from a split plot analysis of turf quality at the end of the long period (weeks 1-7). (b). Main plot (Reduced PPF) and subplot (Cultivar) interaction turf quality means. Interaction LSD (p value <0.05) was calculated using Error b. Groupings based on LSD are provided.
      • Copyright: © 2023 by the author(s). Published by Maximum Academic Press, Fayetteville, GA. This article is an open access article distributed under Creative Commons Attribution License (CC BY 4.0), visit https://creativecommons.org/licenses/by/4.0/.
    Figure (7)  Table (2) References (48)
  • About this article
    Cite this article
    Brown CW, Jie MWQ, Pearce W, Arief V, Dayananda B, et al. 2023. The application of Fourier Transform Infra-Red spectrometry to assess the impact of changes in Photosynthetic Photon Flux on cell wall components and turf quality of different cultivars of Cynodon grasses. Grass Research 3:9 doi: 10.48130/GR-2023-0009
    Brown CW, Jie MWQ, Pearce W, Arief V, Dayananda B, et al. 2023. The application of Fourier Transform Infra-Red spectrometry to assess the impact of changes in Photosynthetic Photon Flux on cell wall components and turf quality of different cultivars of Cynodon grasses. Grass Research 3:9 doi: 10.48130/GR-2023-0009

Catalog

  • About this article

/

DownLoad:  Full-Size Img  PowerPoint
Return
Return