-
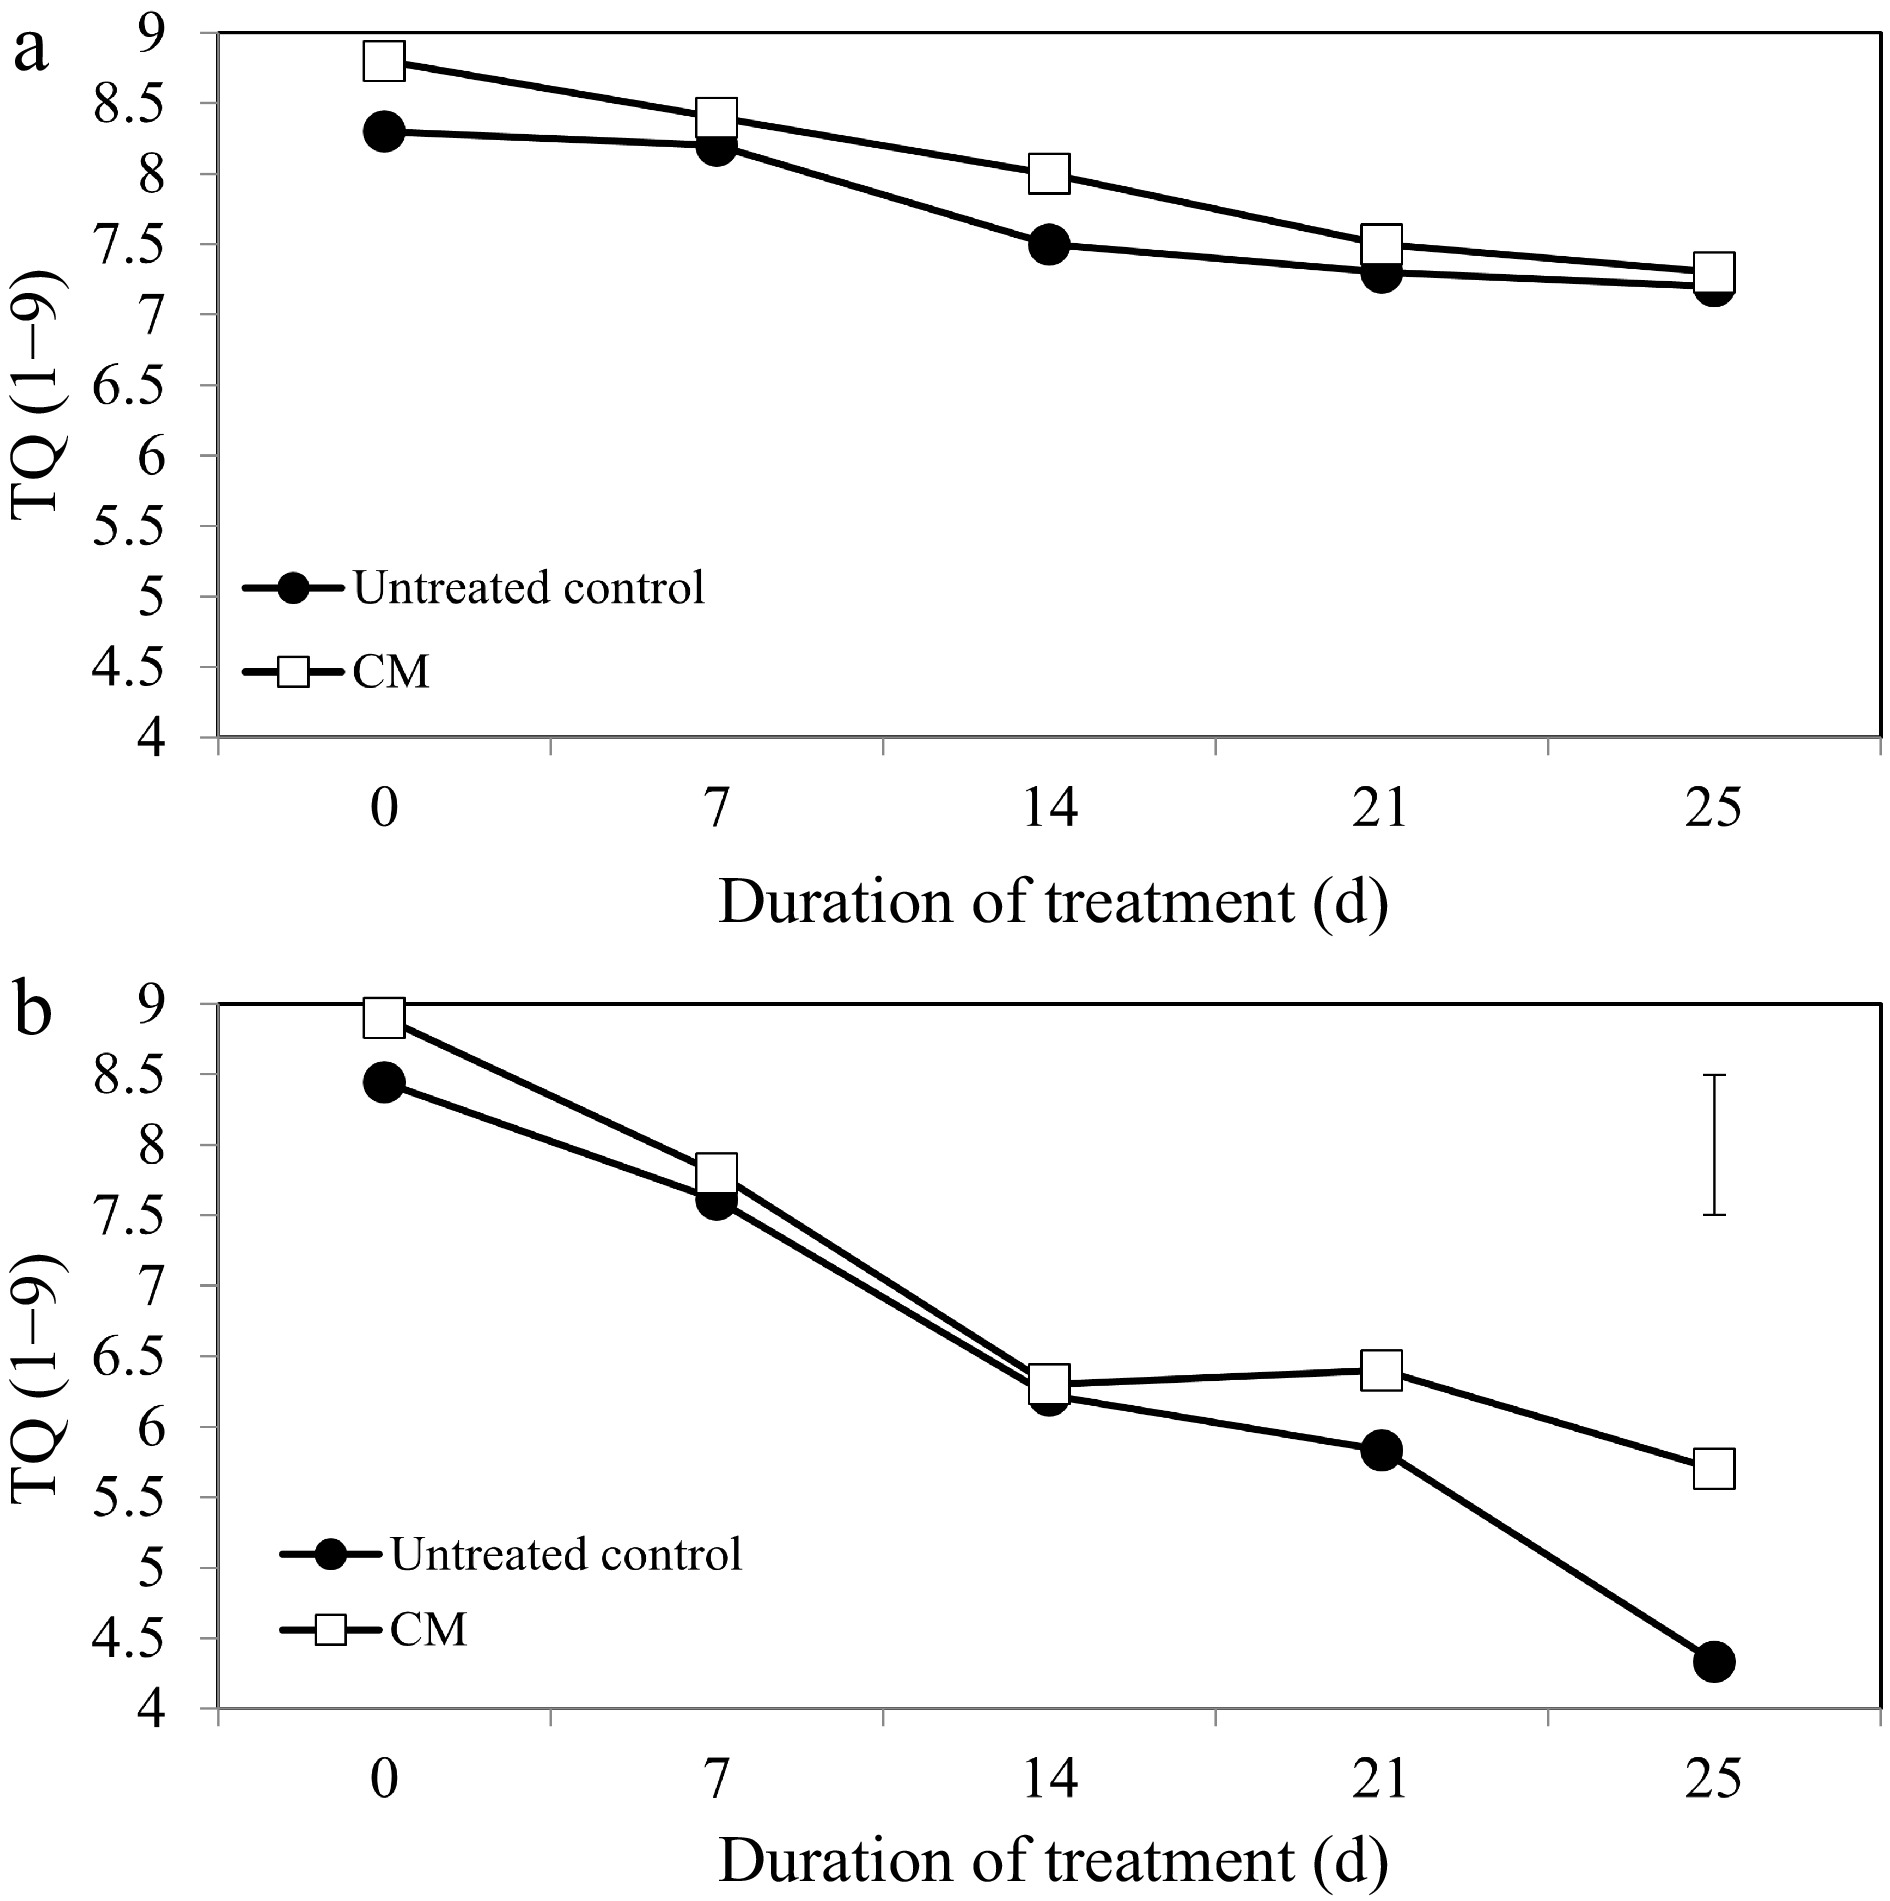
Figure 1.
Turf quality evaluations on a scale of 1 to 9 for creeping bentgrass plants treated with CM or untreated control plants under (a) non-stress optimal temperature or (b) heat stress conditions. Each vertical bar corresponds to a given LSD value (p ≤ 0.05) derived from Fisher’s protected least significant difference (LSD) test for comparison between treatments on each day of treatment.
-
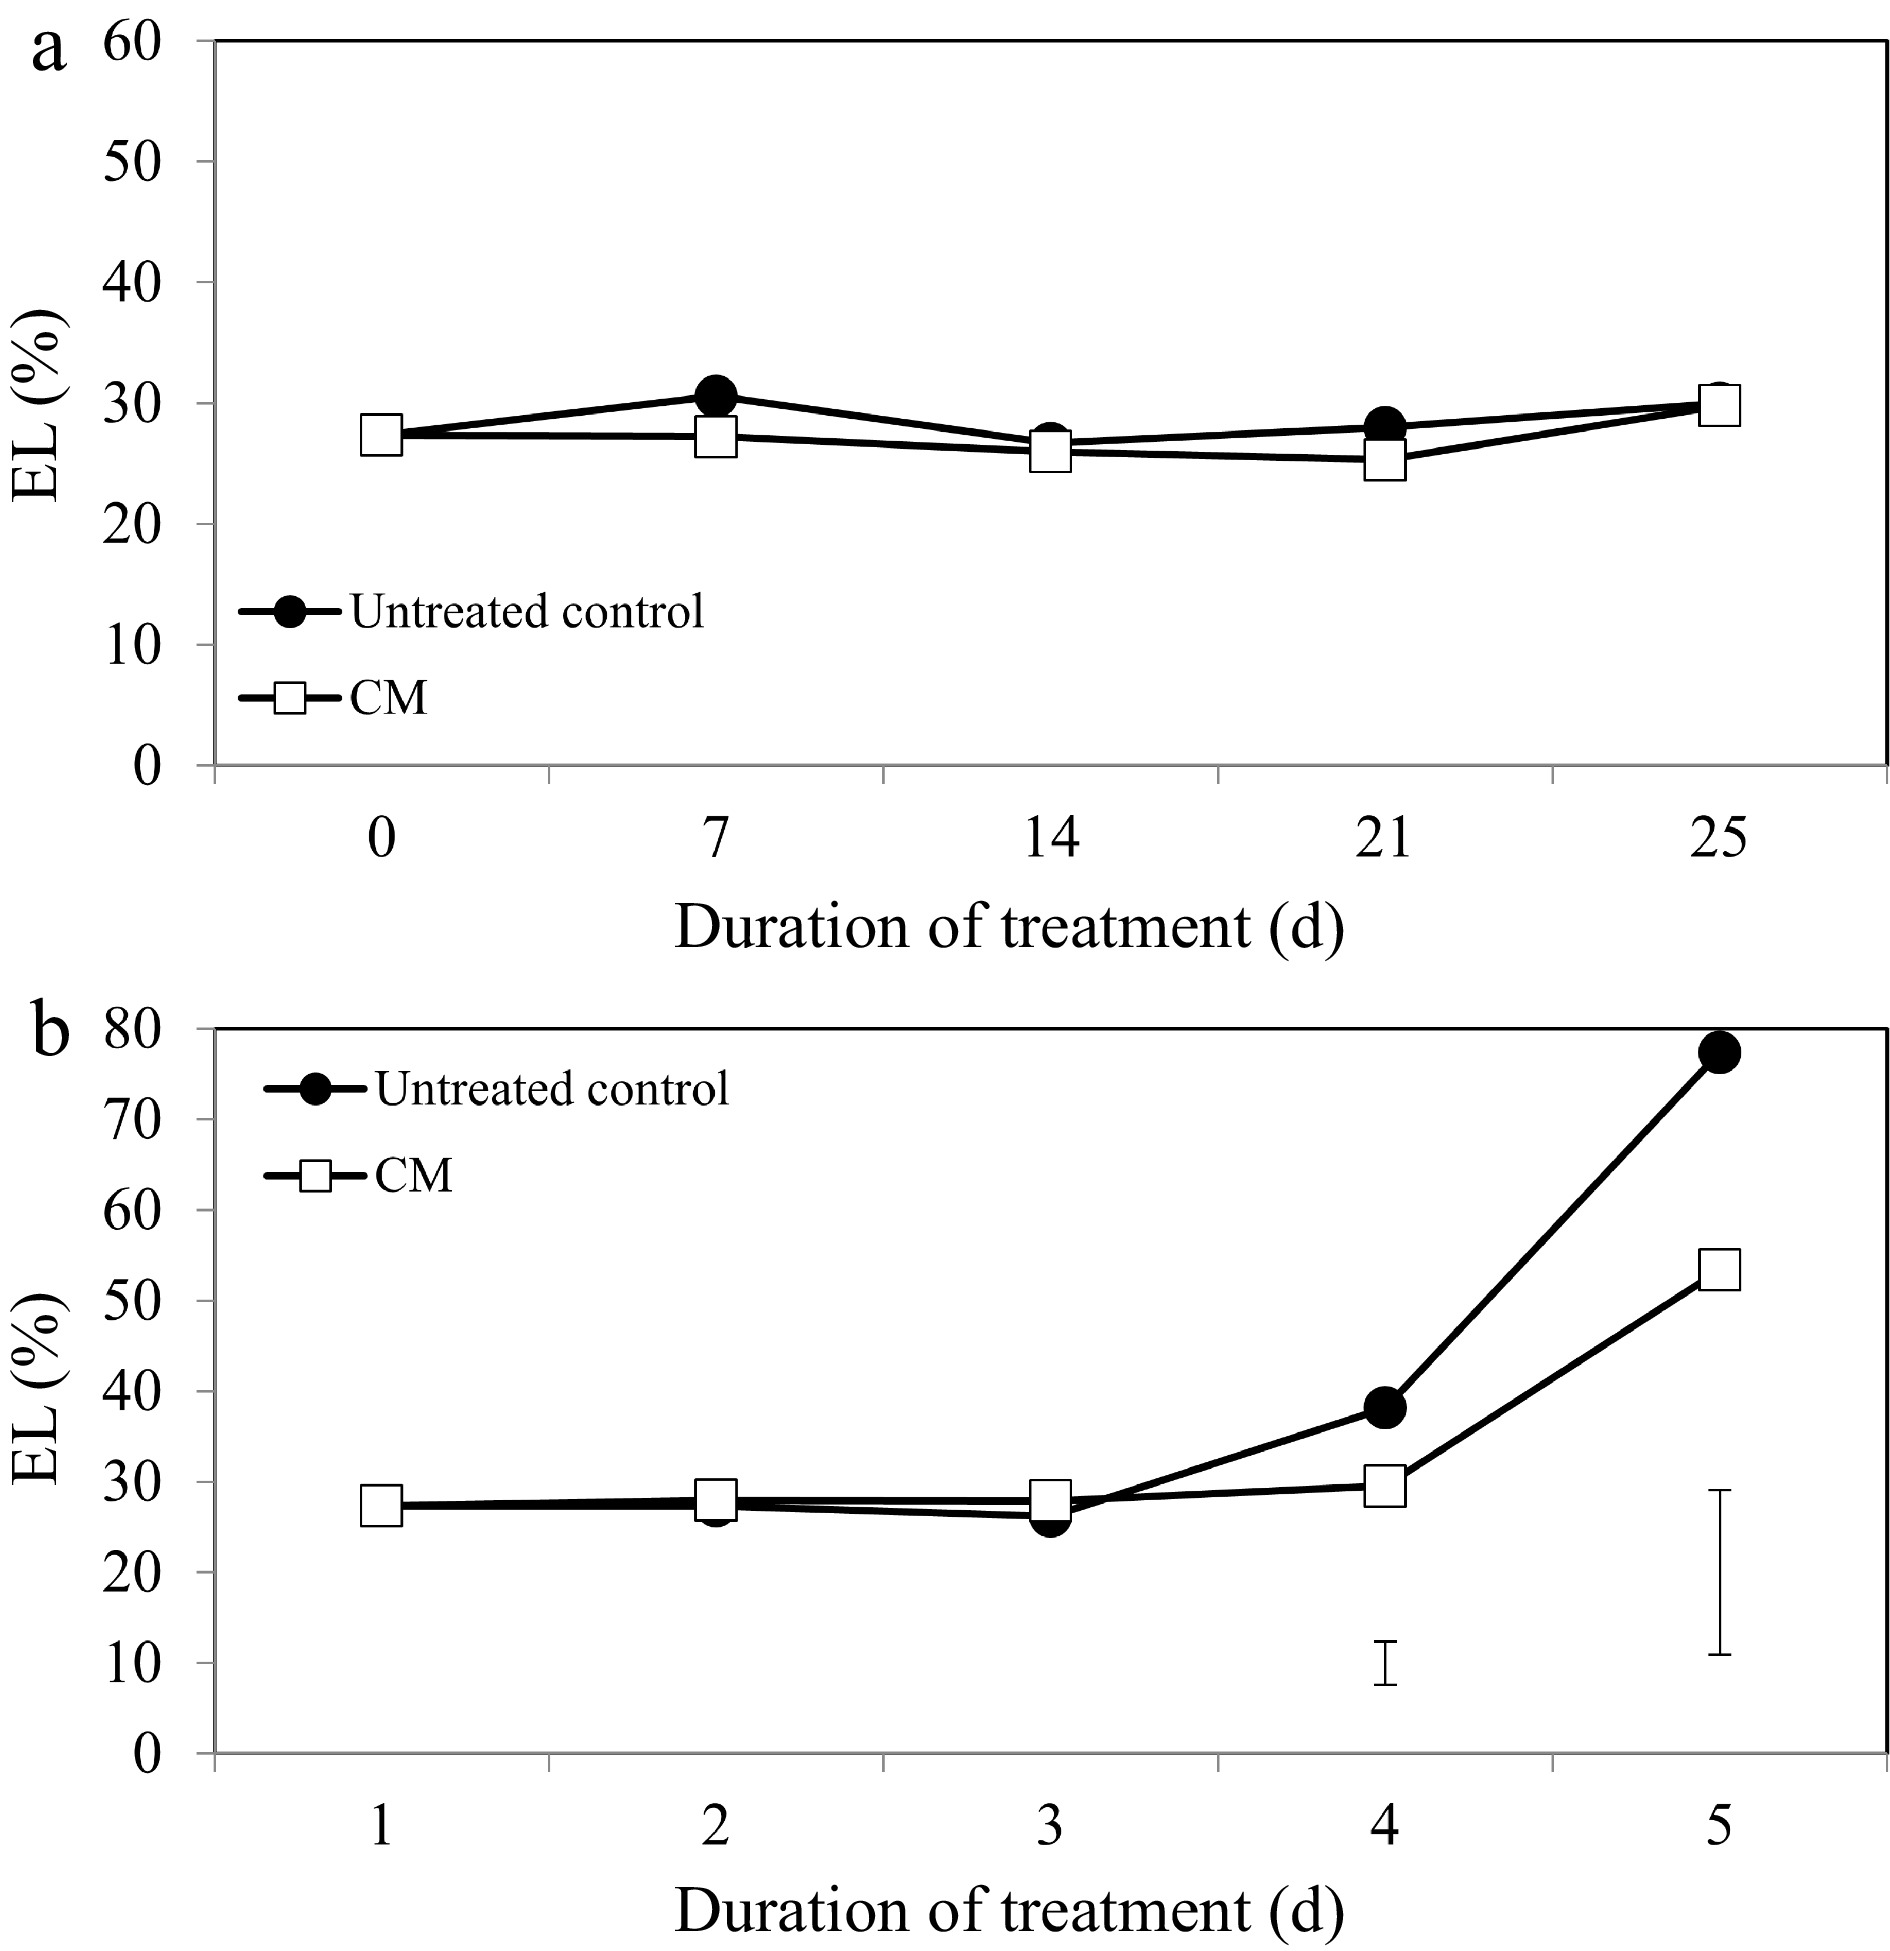
Figure 2.
Leaf electrolyte leakage for creeping bentgrass plants treated with CM or untreated control plants under (a) non-stress optimal temperature or (b) heat stress conditions. Each vertical bar corresponds to a given LSD value (p ≤ 0.05) derived from Fisher’s protected least significant difference (LSD) test for comparison between treatments on each day of treatment.
-
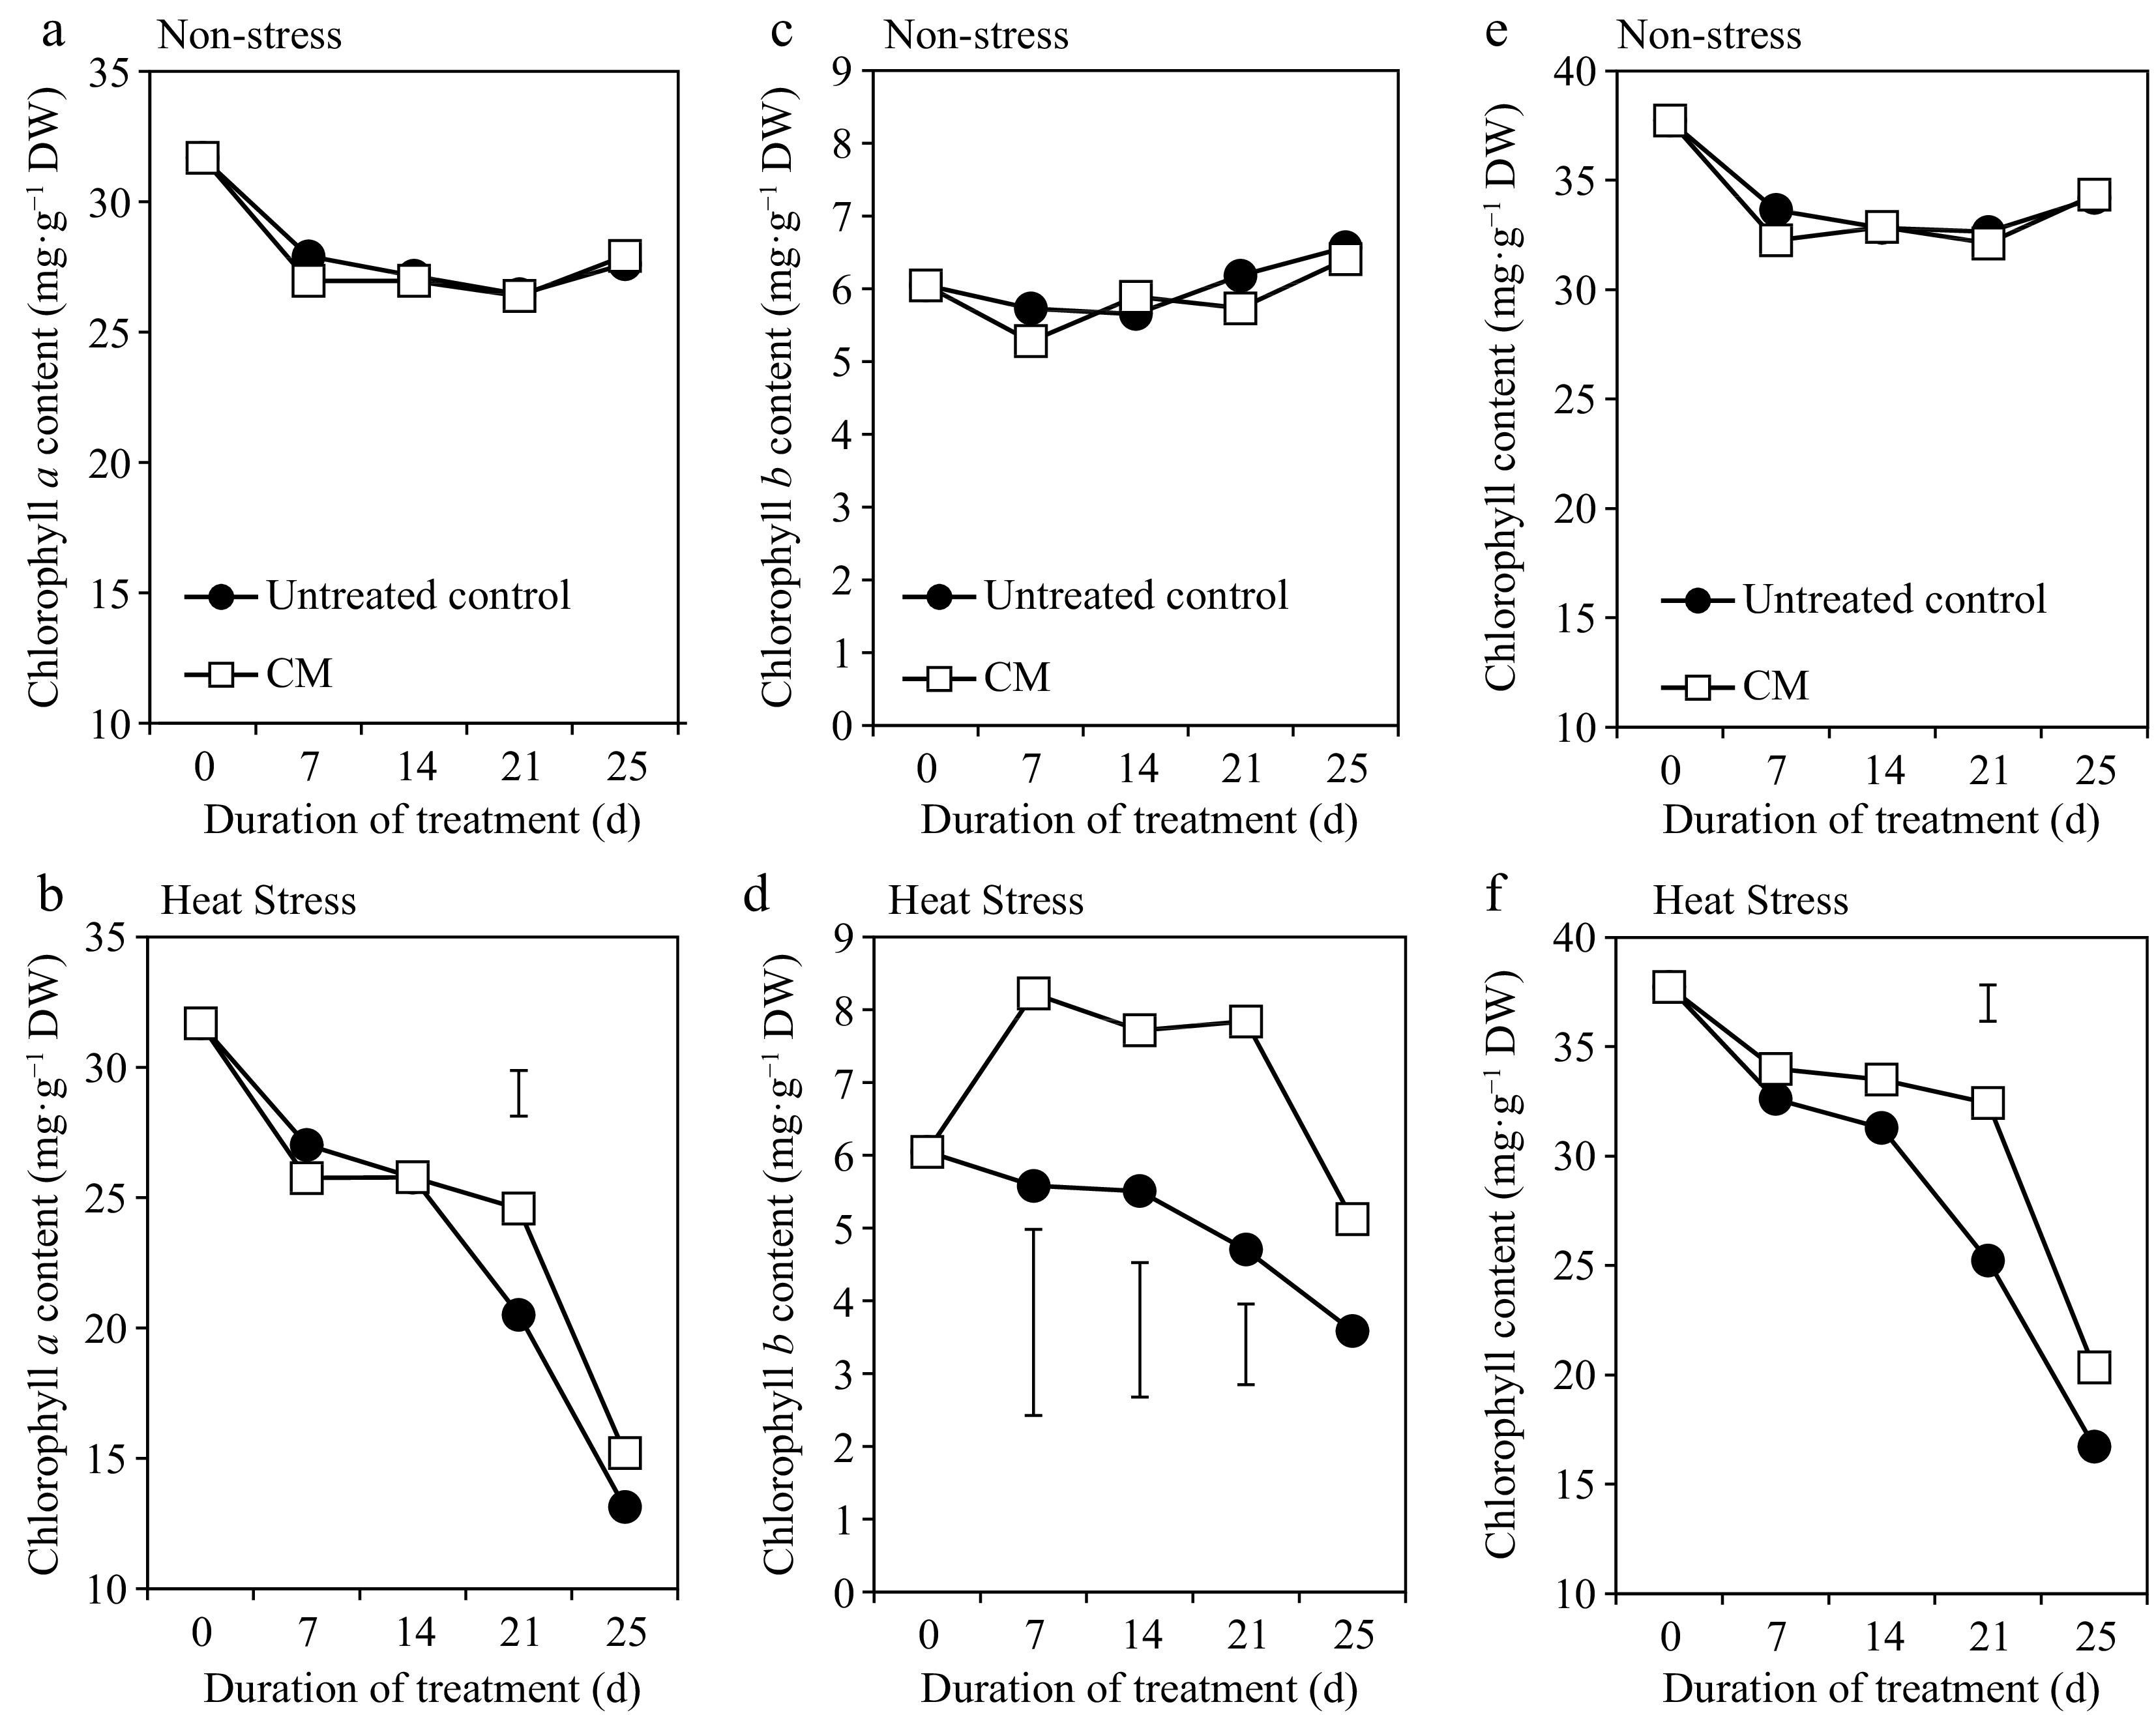
Figure 3.
Chlorophyll a [(a – non-stress), (b – heat stress)], chlorophyll b [(c – non-stress), (d – heat stress)], and total chlorophyll [(e – non-stress), (f – heat stress)] for creeping bentgrass plants treated with CM or untreated control plants under non-stress optimal temperature or heat stress conditions. Each vertical bar corresponds to a given LSD value (p ≤ 0.05) derived from Fisher’s protected least significant difference (LSD) test for comparison between treatments on each day of treatment.
-
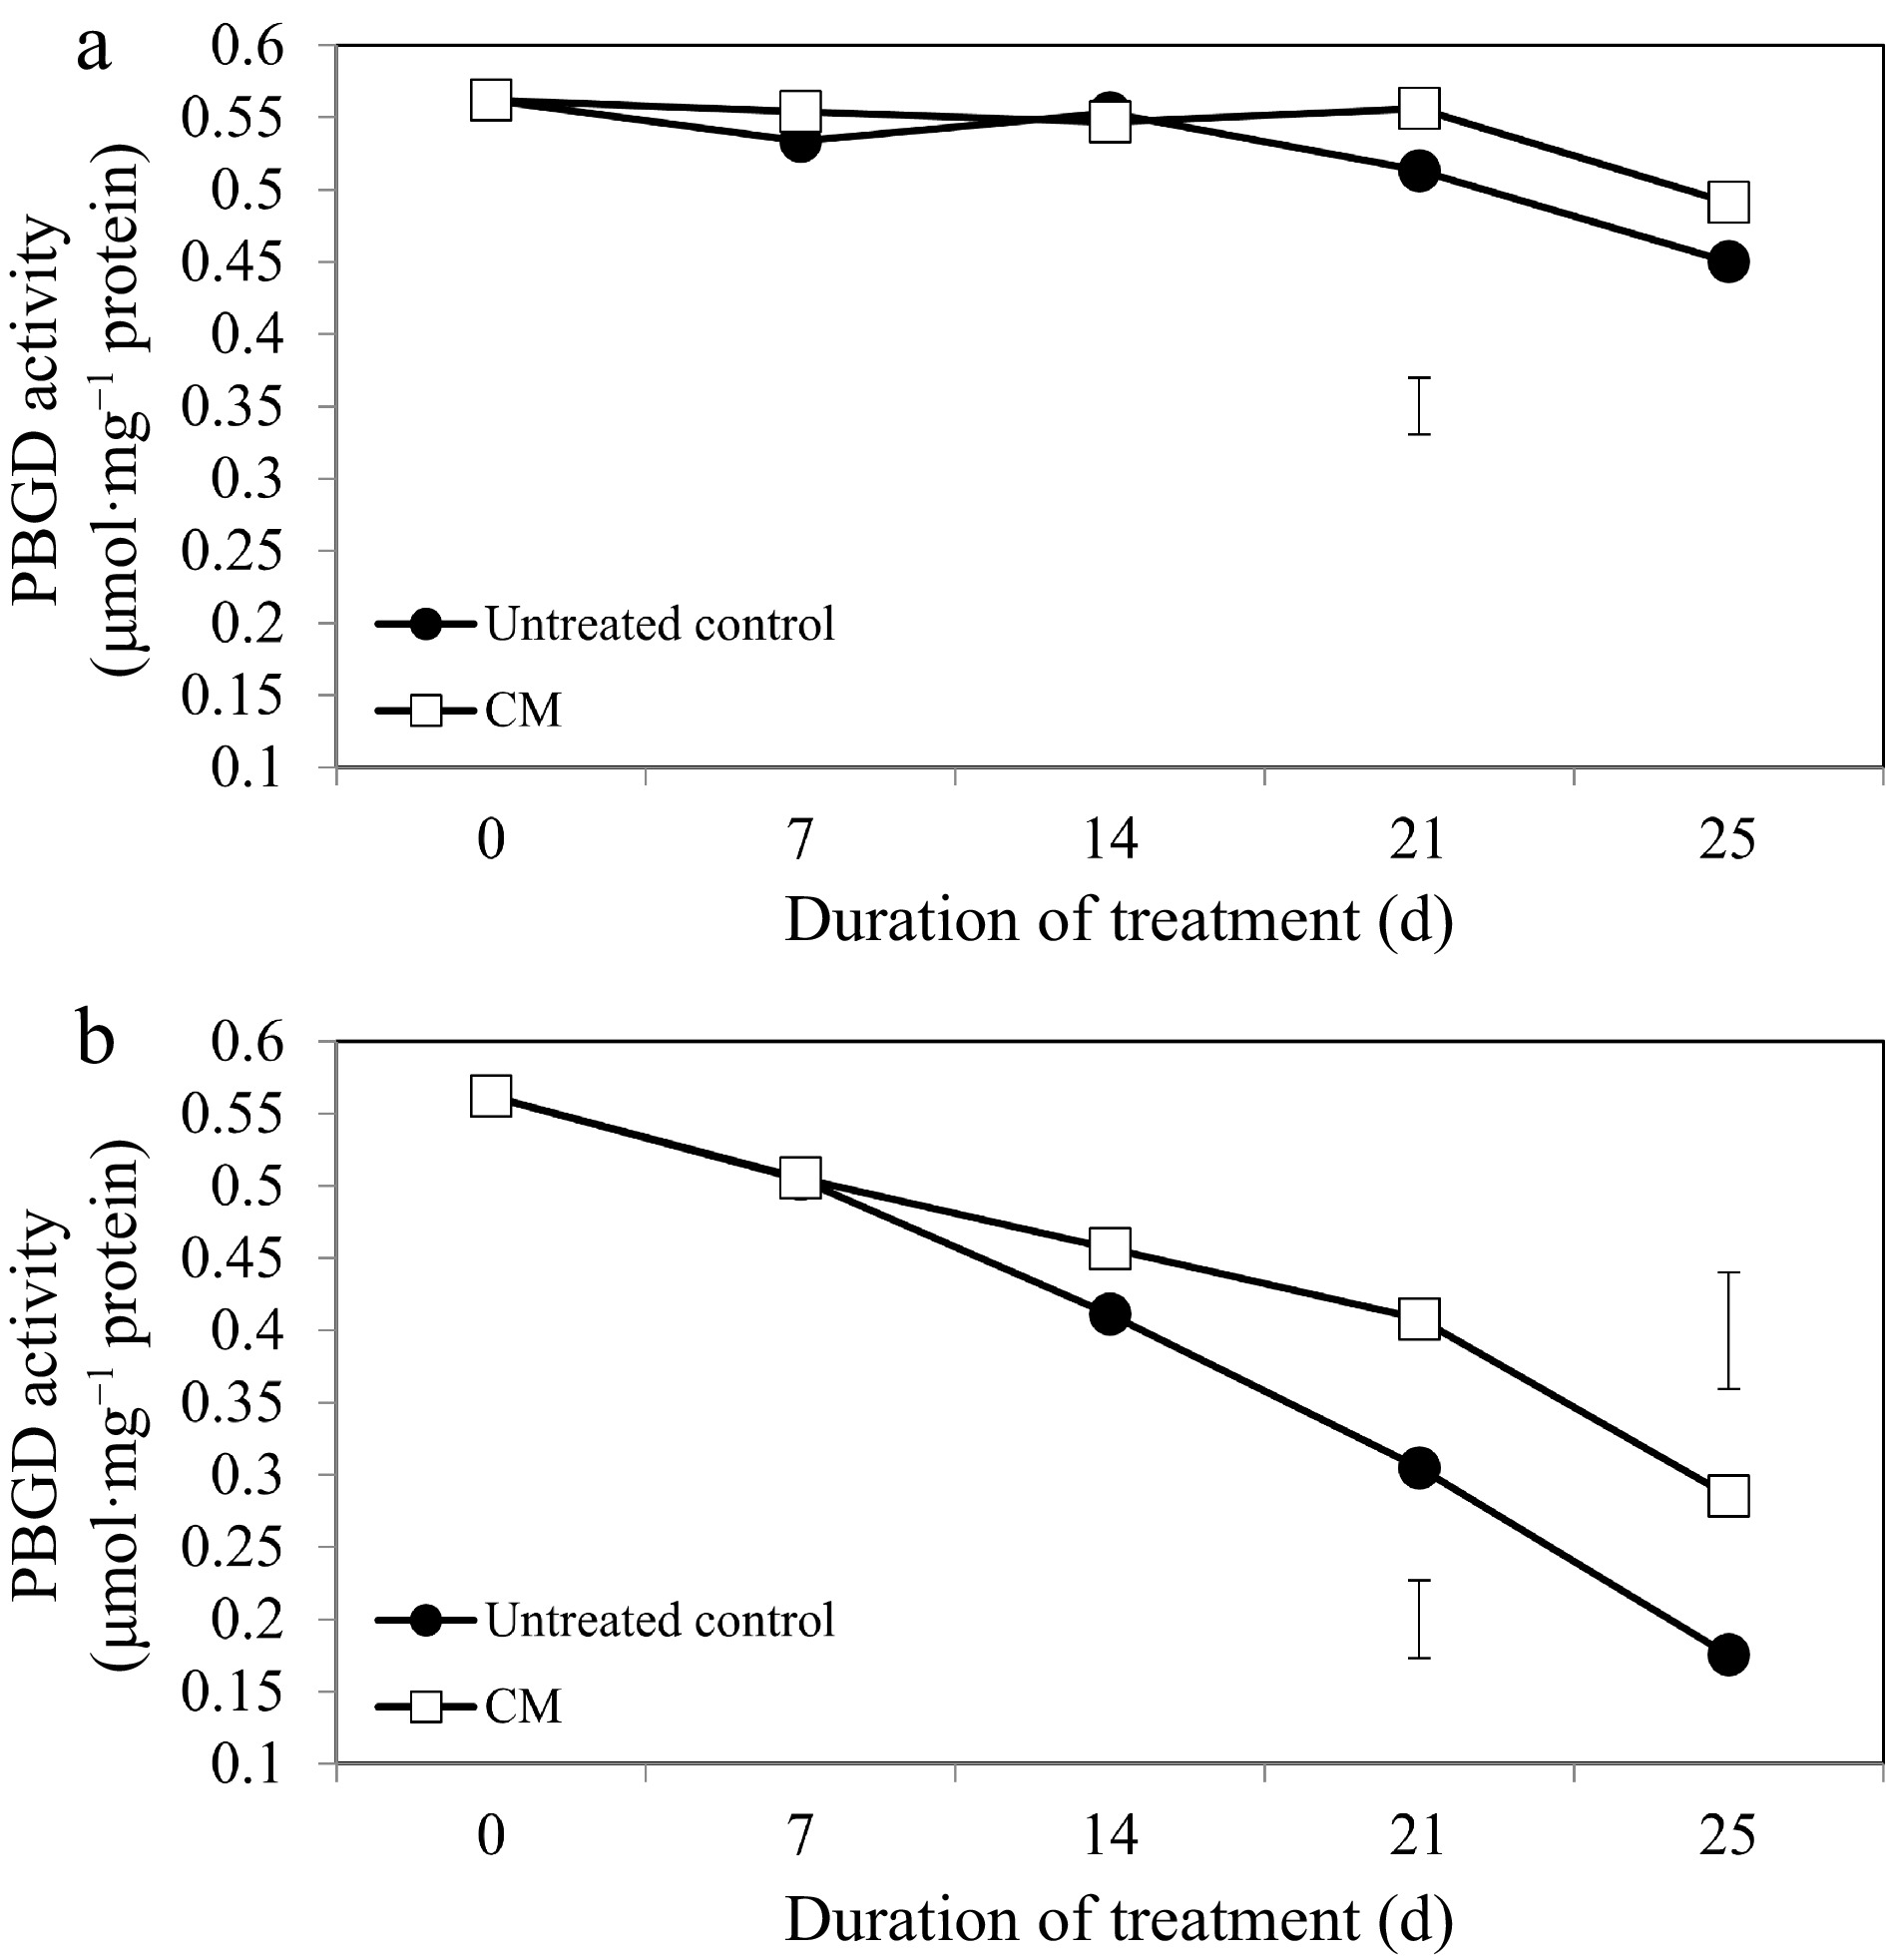
Figure 4.
Porphobilinogen deaminase enzyme activity for creeping bentgrass plants treated with CM or untreated control plants under (a) non-stress optimal temperature or (b) heat stress conditions. Each vertical bar corresponds to a given LSD value (p ≤ 0.05) derived from Fisher’s protected least significant difference (LSD) test for comparison between treatments on each day of treatment.
-
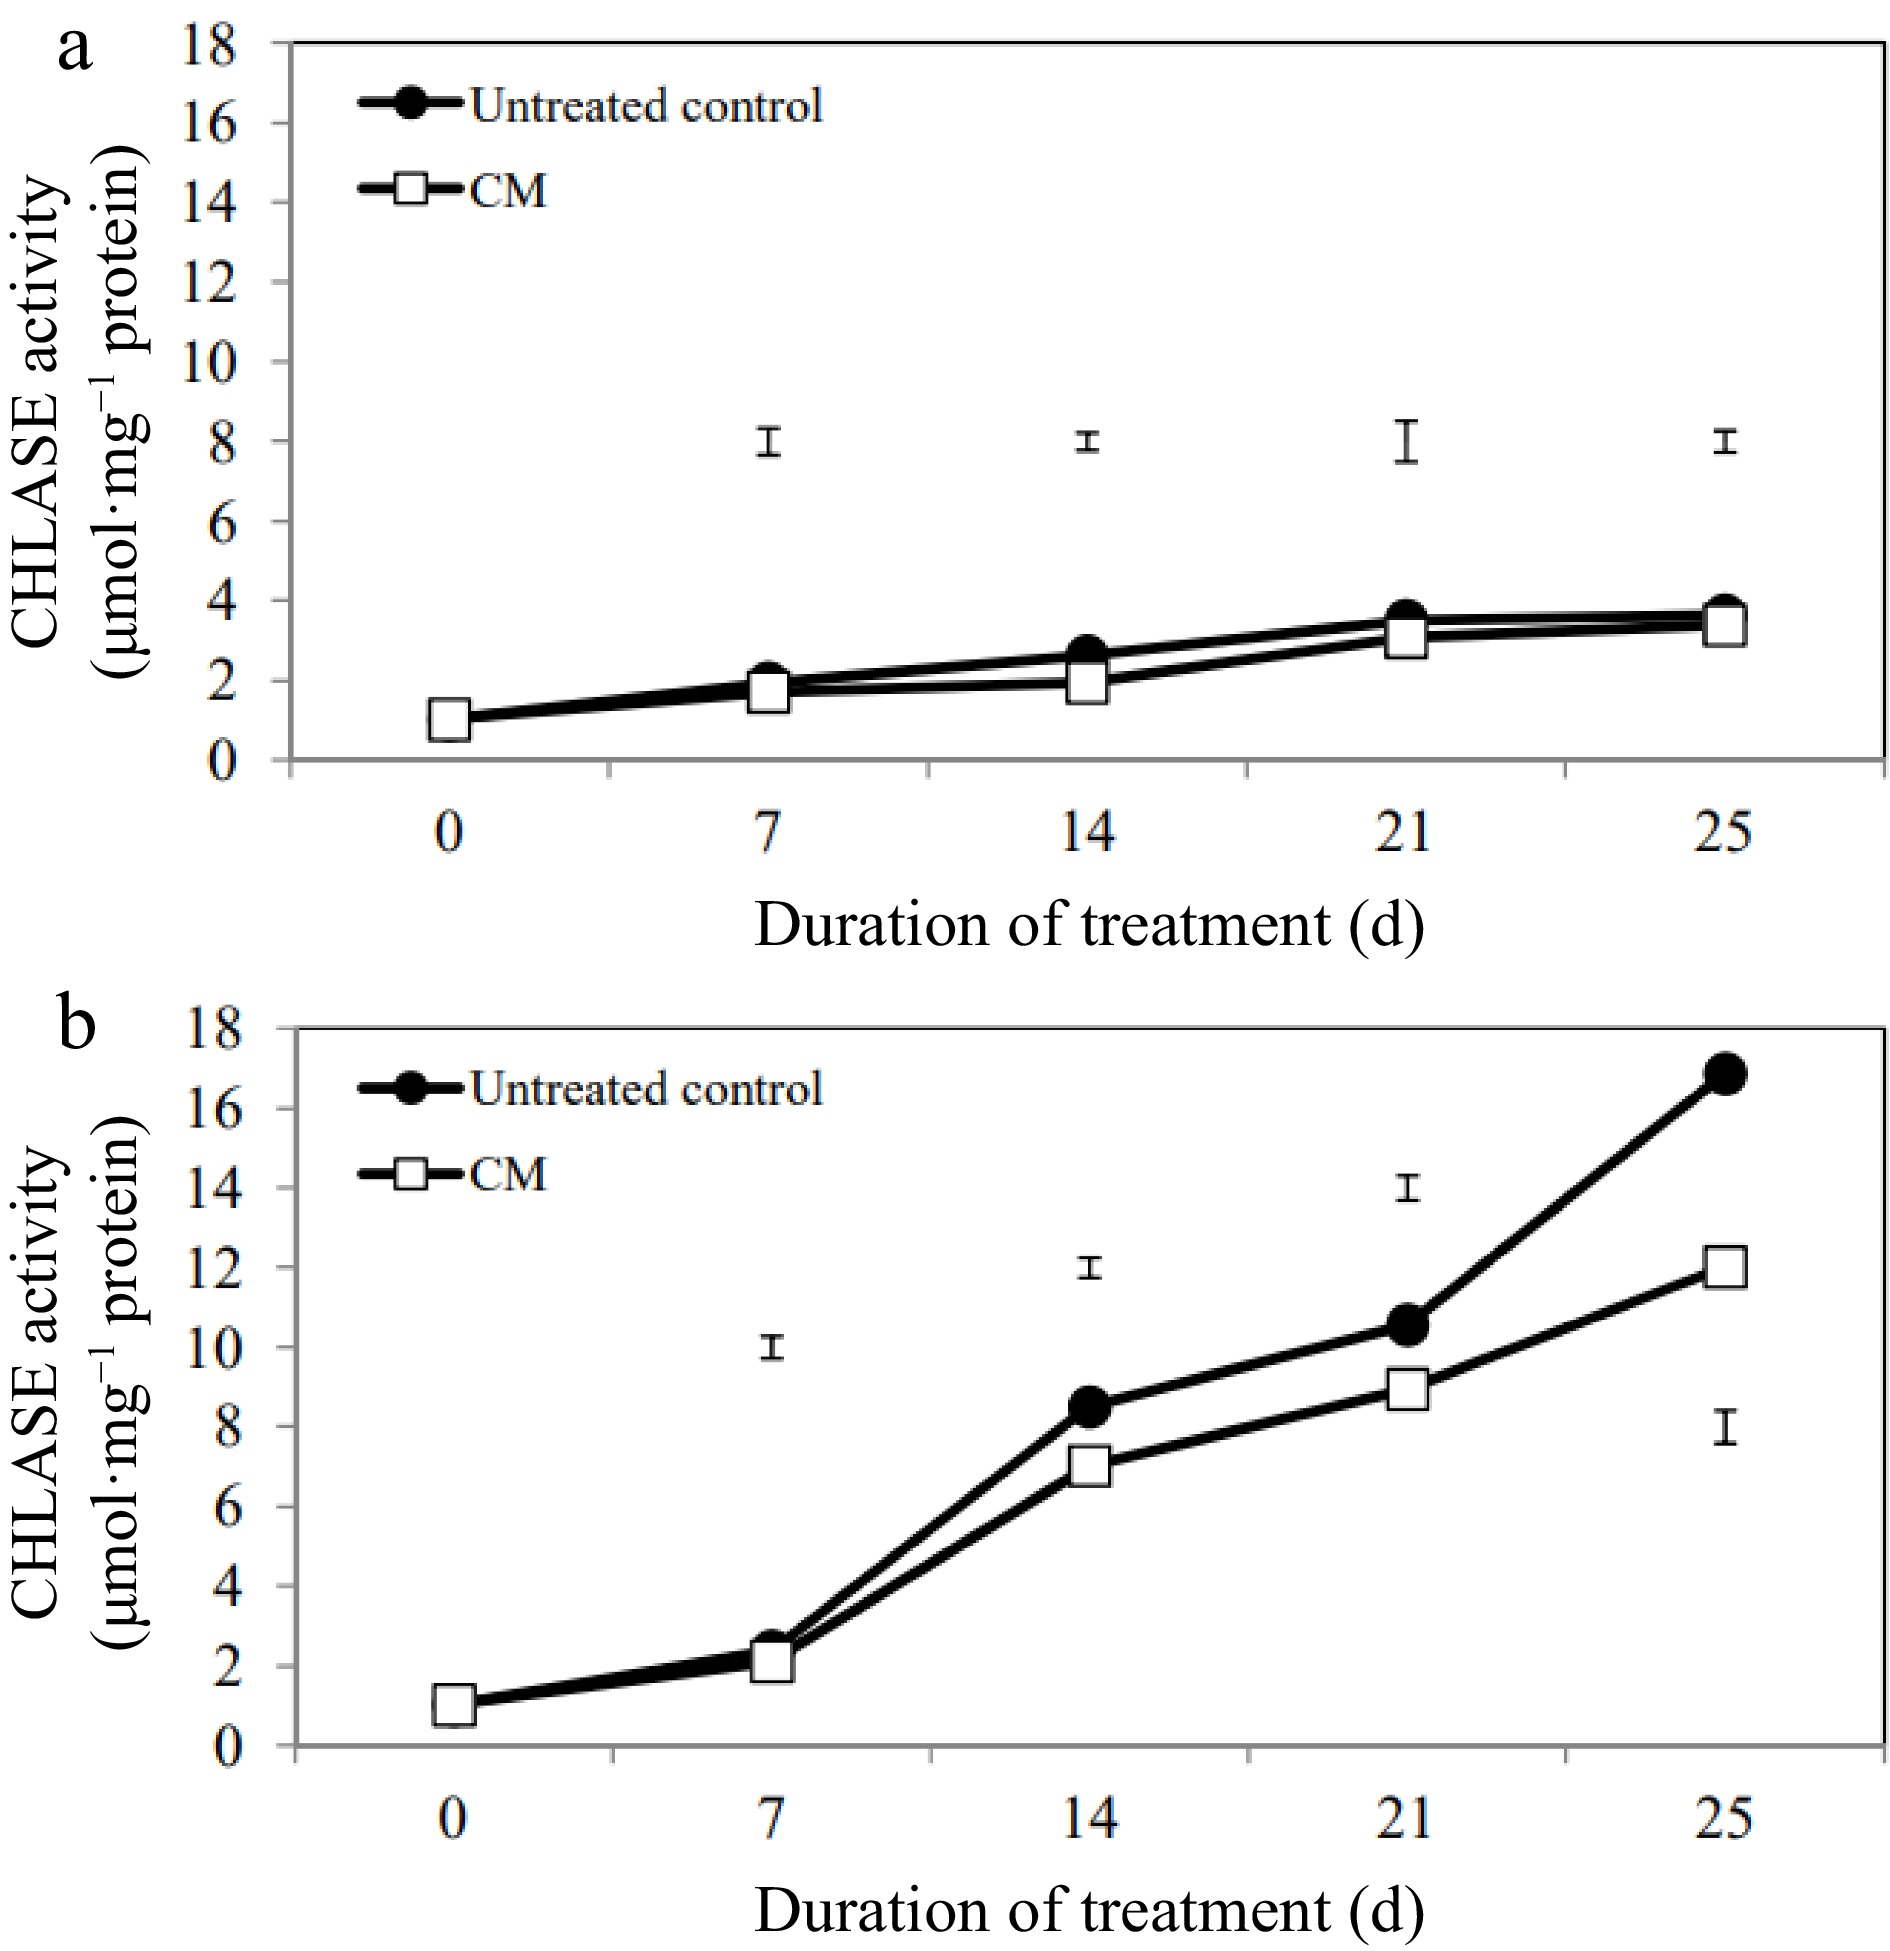
Figure 5.
Chlorophyllase enzyme activity for creeping bentgrass plants treated with CM or untreated control plants under (a) non-stress optimal temperature or (b) heat stress conditions. Each vertical bar corresponds to a given LSD value (p ≤ 0.05) derived from Fisher’s protected least significant difference (LSD) test for comparison between treatments on each day of treatment.
-
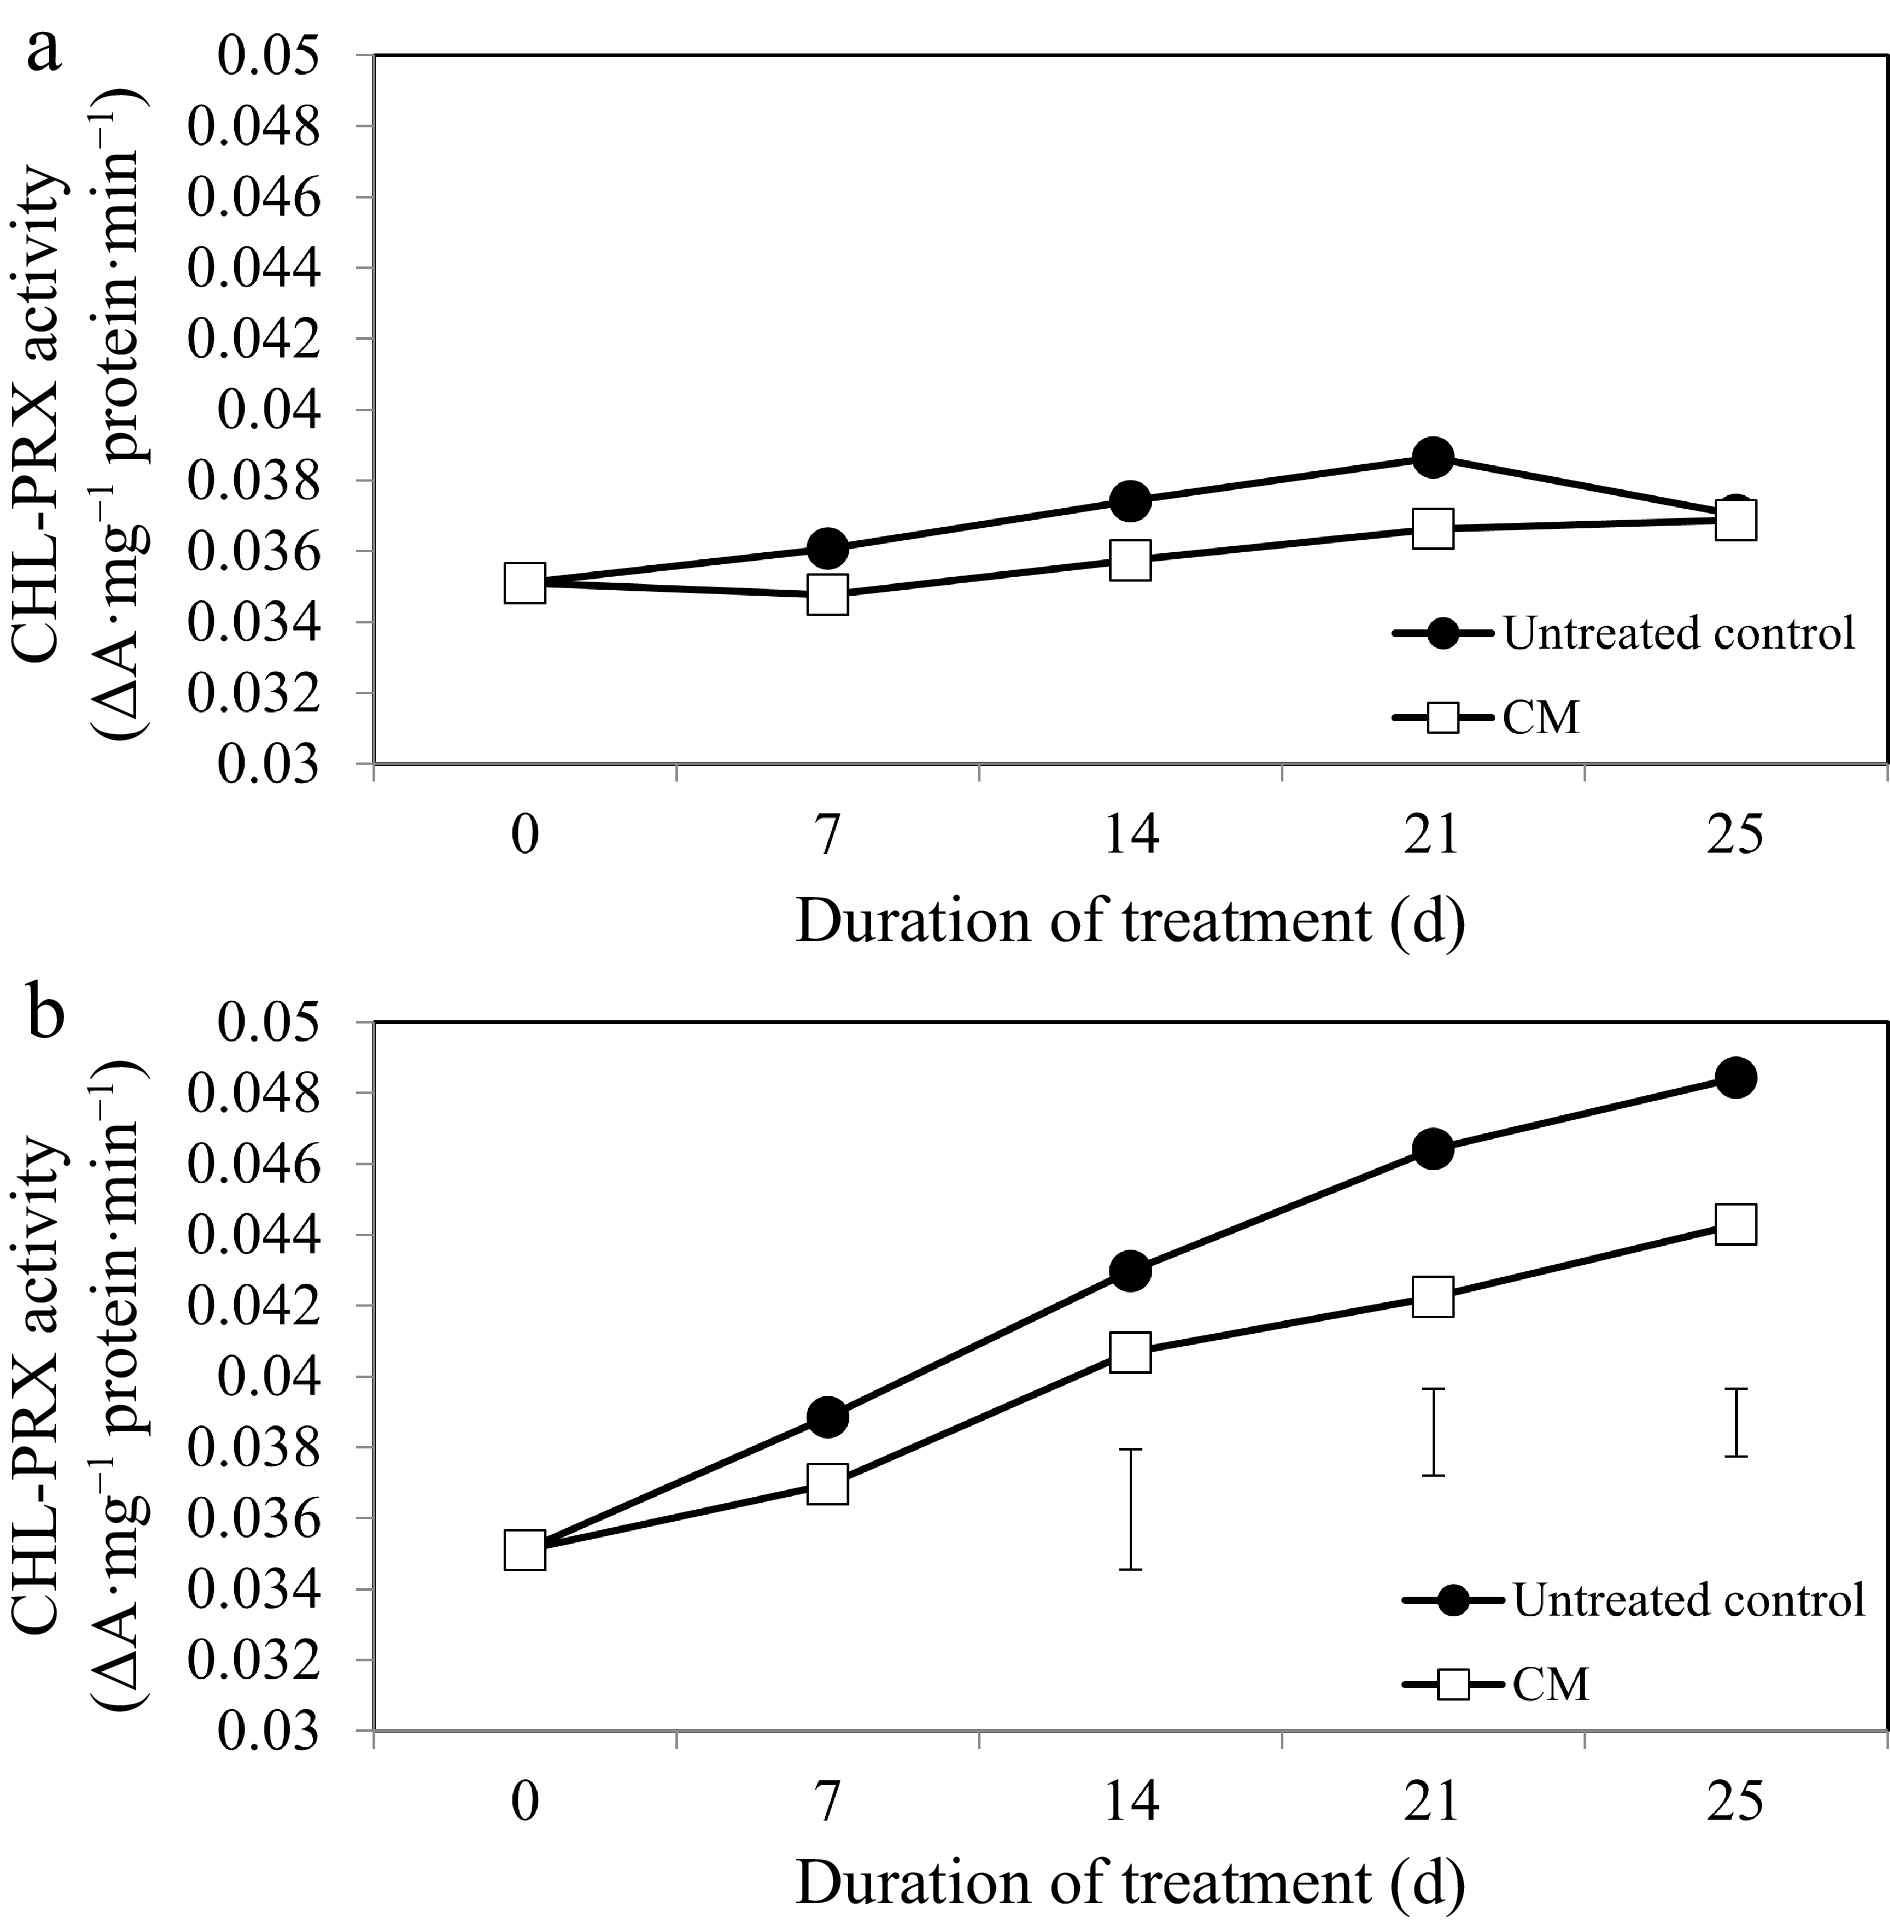
Figure 6.
Chlorophyll-degrading peroxidase enzyme activity for creeping bentgrass plants treated with CM or untreated control plants under (a) non-stress optimal temperature or (b) heat stress conditions. Each vertical bar corresponds to a given LSD value (p ≤ 0.05) derived from Fisher’s protected least significant difference (LSD) test for comparison between treatments on each day of treatment.
-
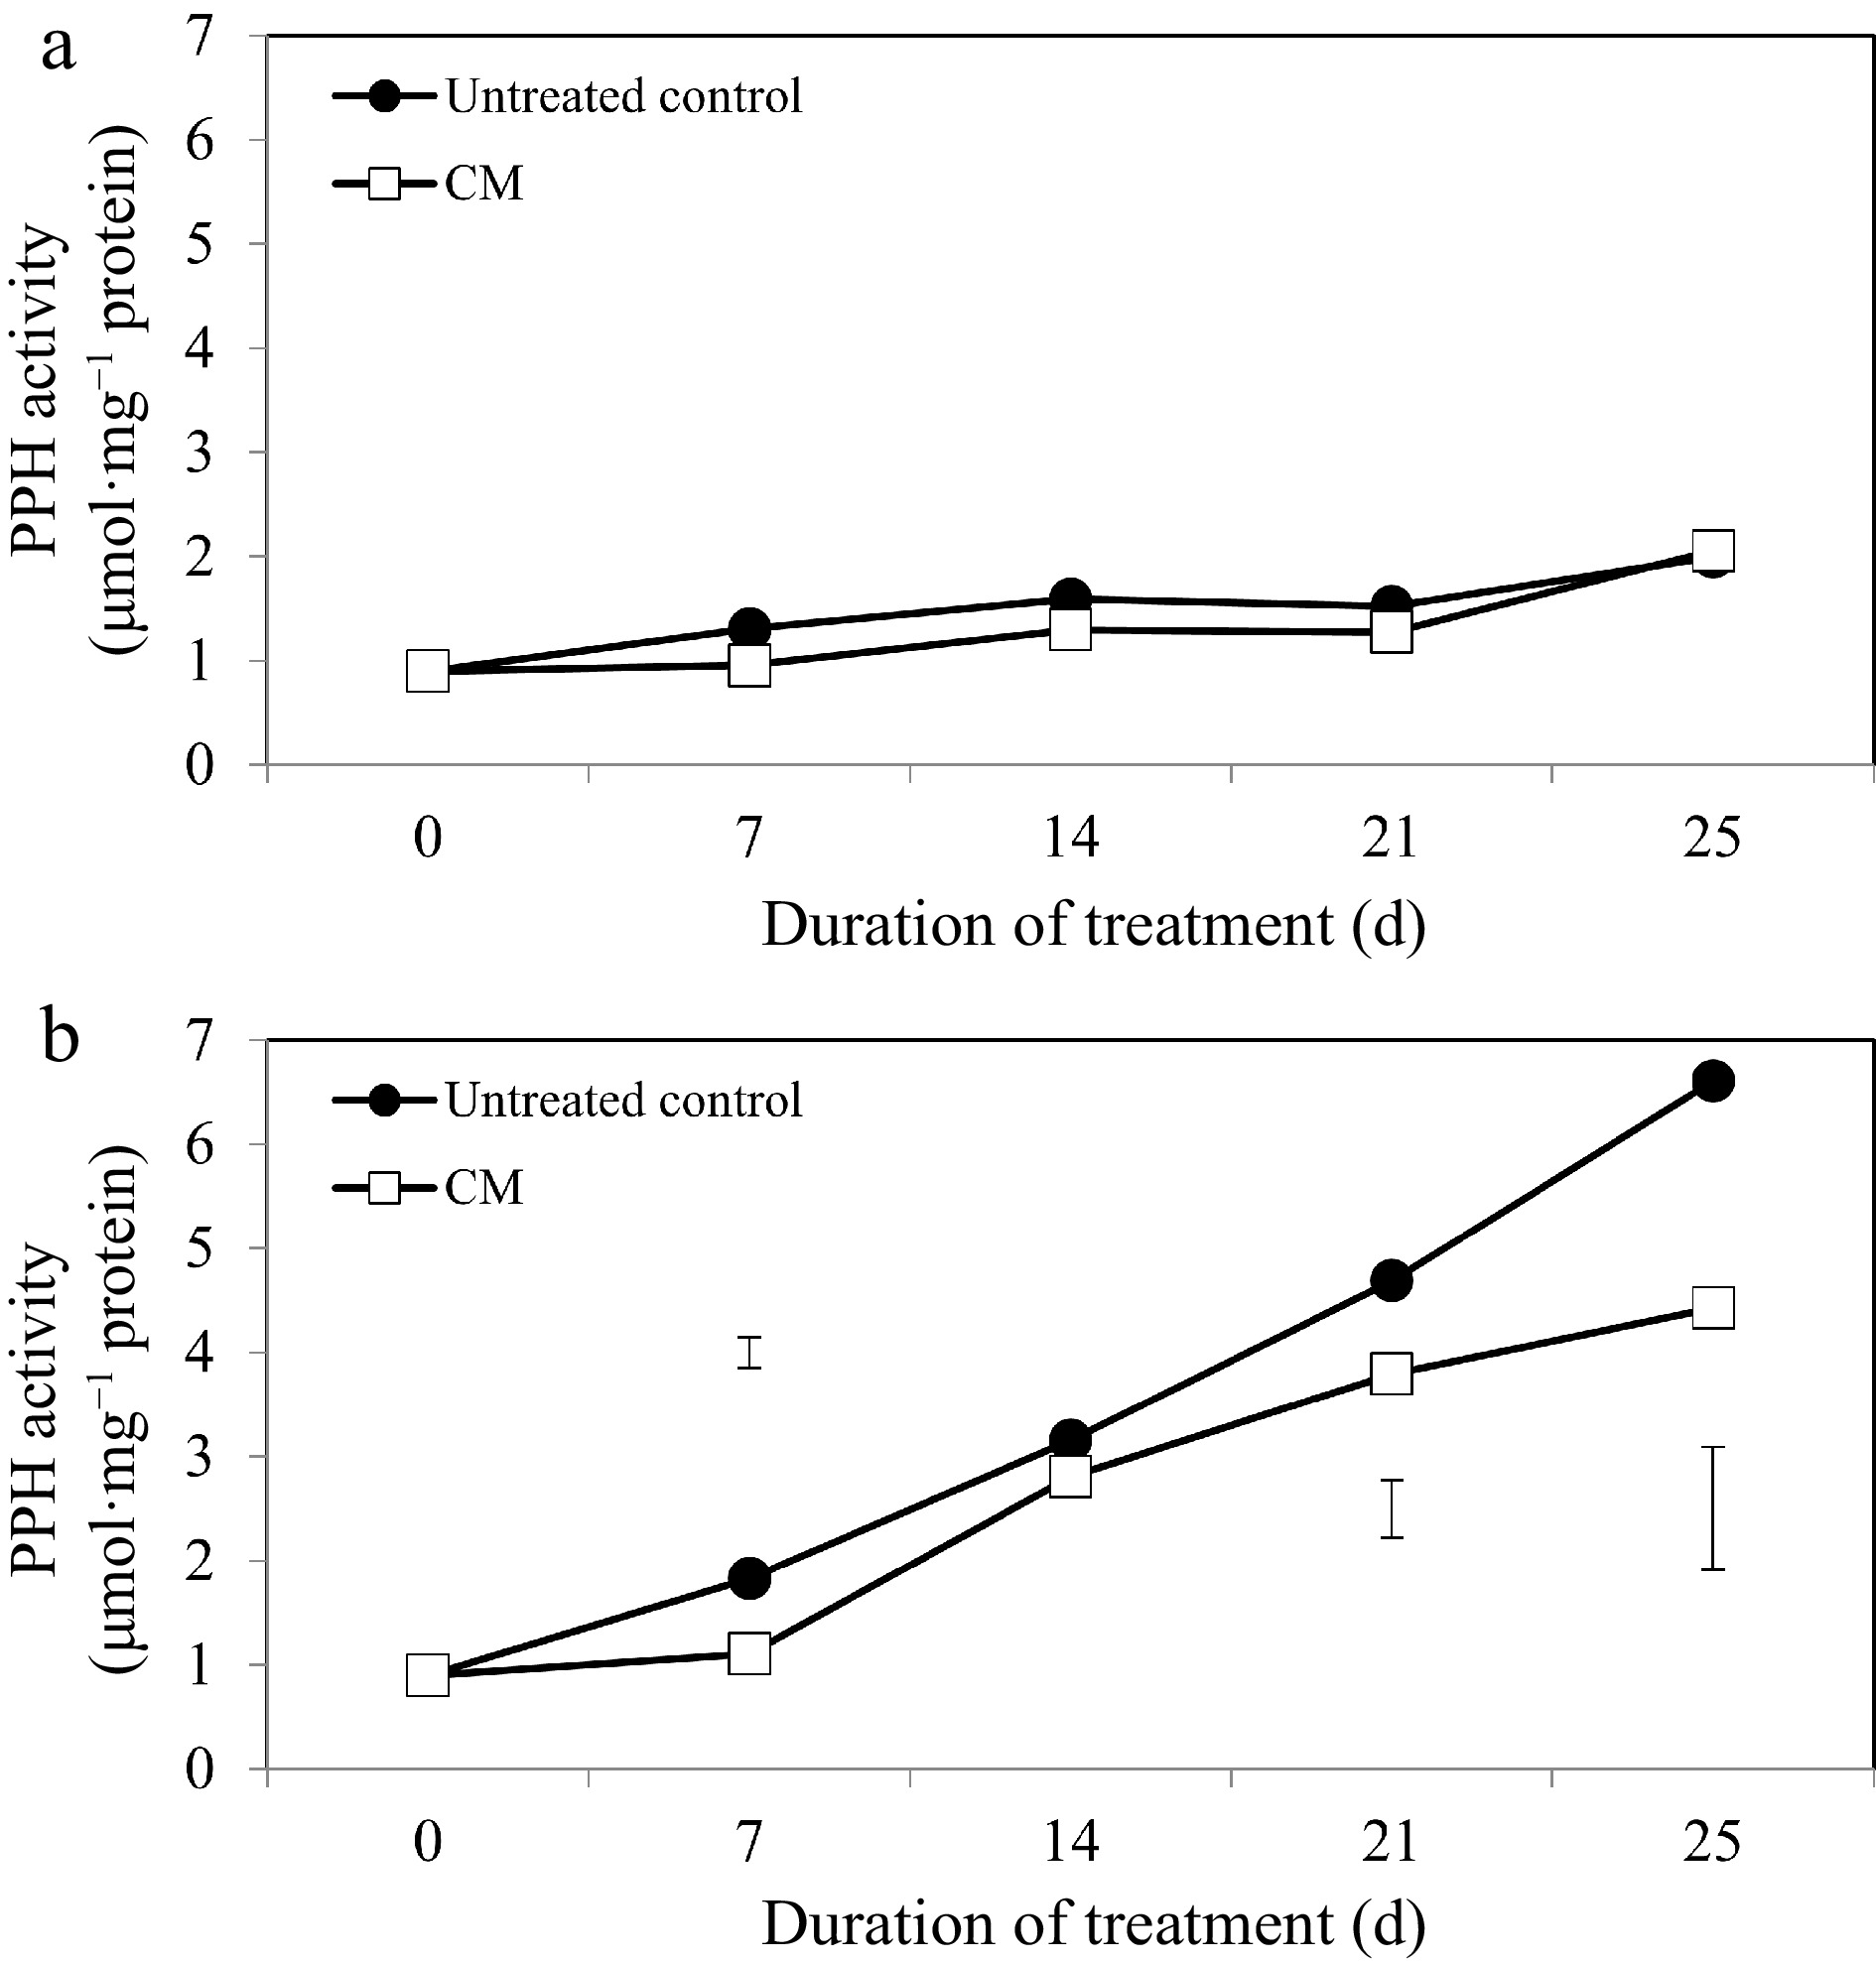
Figure 7.
Pheophytinase enzyme activity for creeping bentgrass plants treated with CM or untreated control plants under (a) non-stress optimal temperature or (b) heat stress conditions. Each vertical bar corresponds to a given LSD value (p ≤ 0.05) derived from Fisher’s protected least significant difference (LSD) test for comparison between treatments on each day of treatment.
-
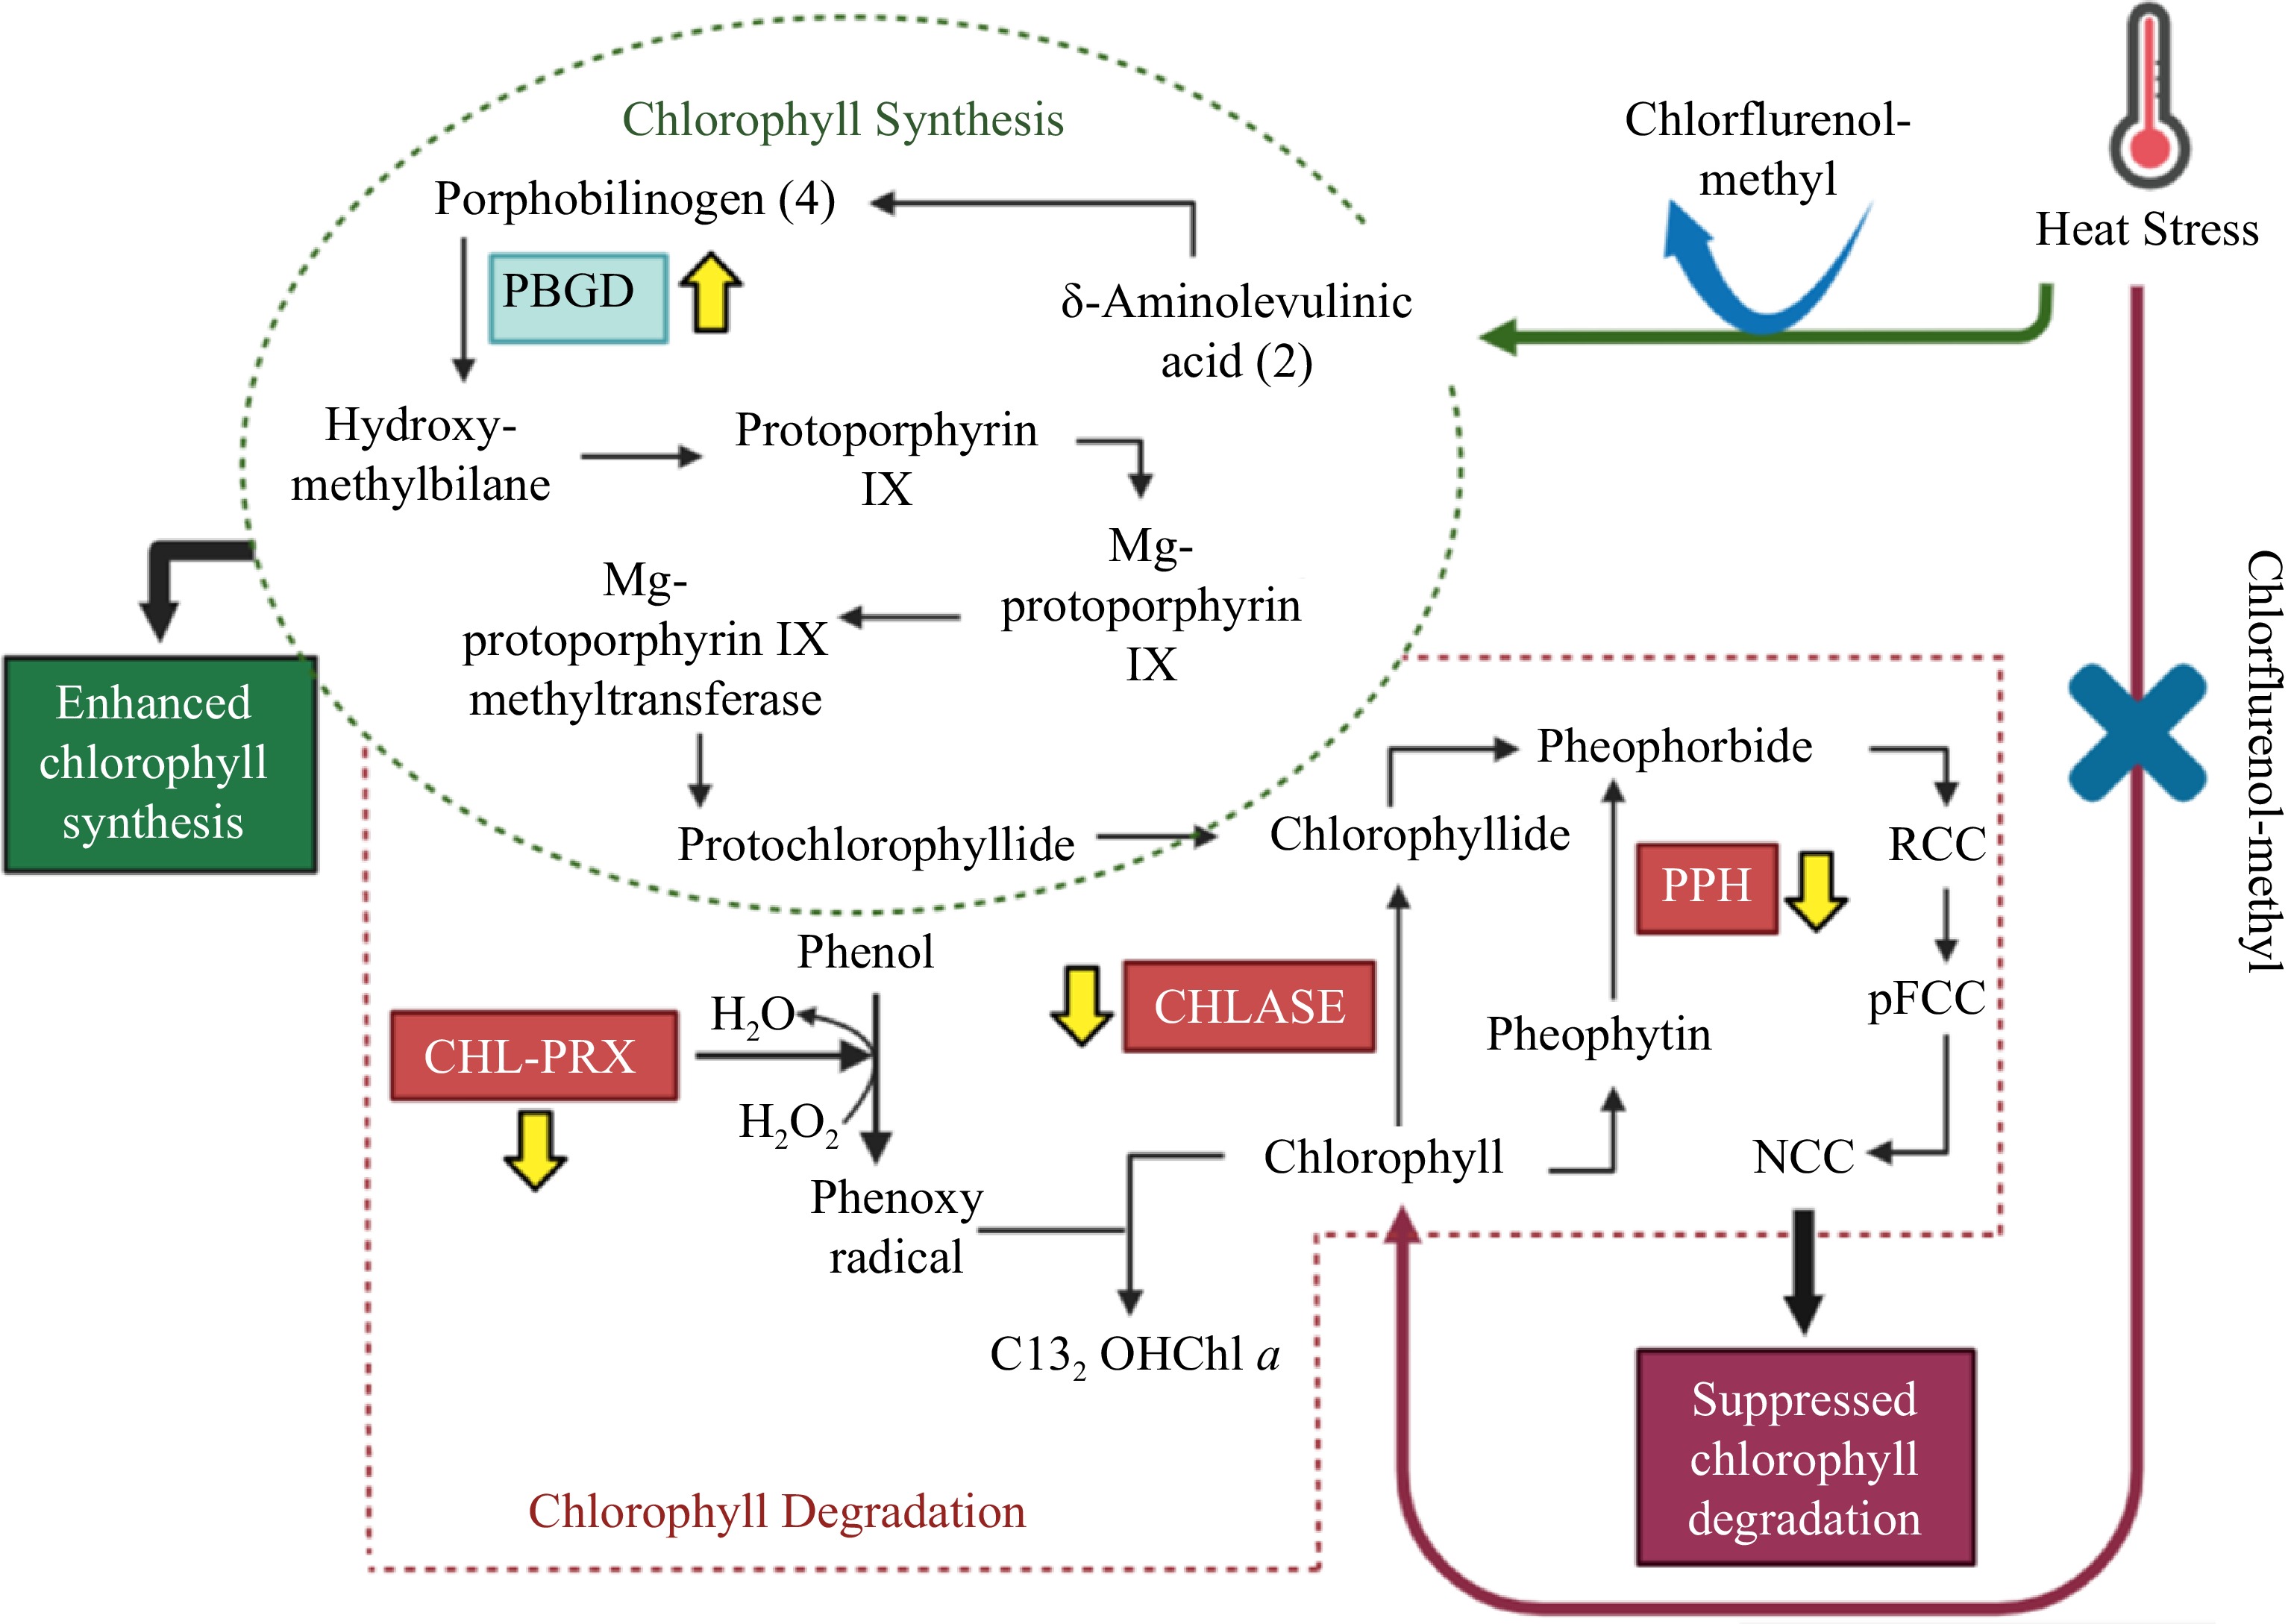
Figure 8.
Pathway map for chlorophyll synthesis and degradation in creeping bentgrass treated with CM under heat stress, showing chlorophyll enzymes enhanced or suppressed by CM treatment. Abbreviations: CHL-PRX: chlorophyll-degrading peroxidase; CHLASE: chlorophyllase; PBGD: porphobilinogen deaminase; PPH: pheophytinase.
Figures
(8)
Tables
(0)