-
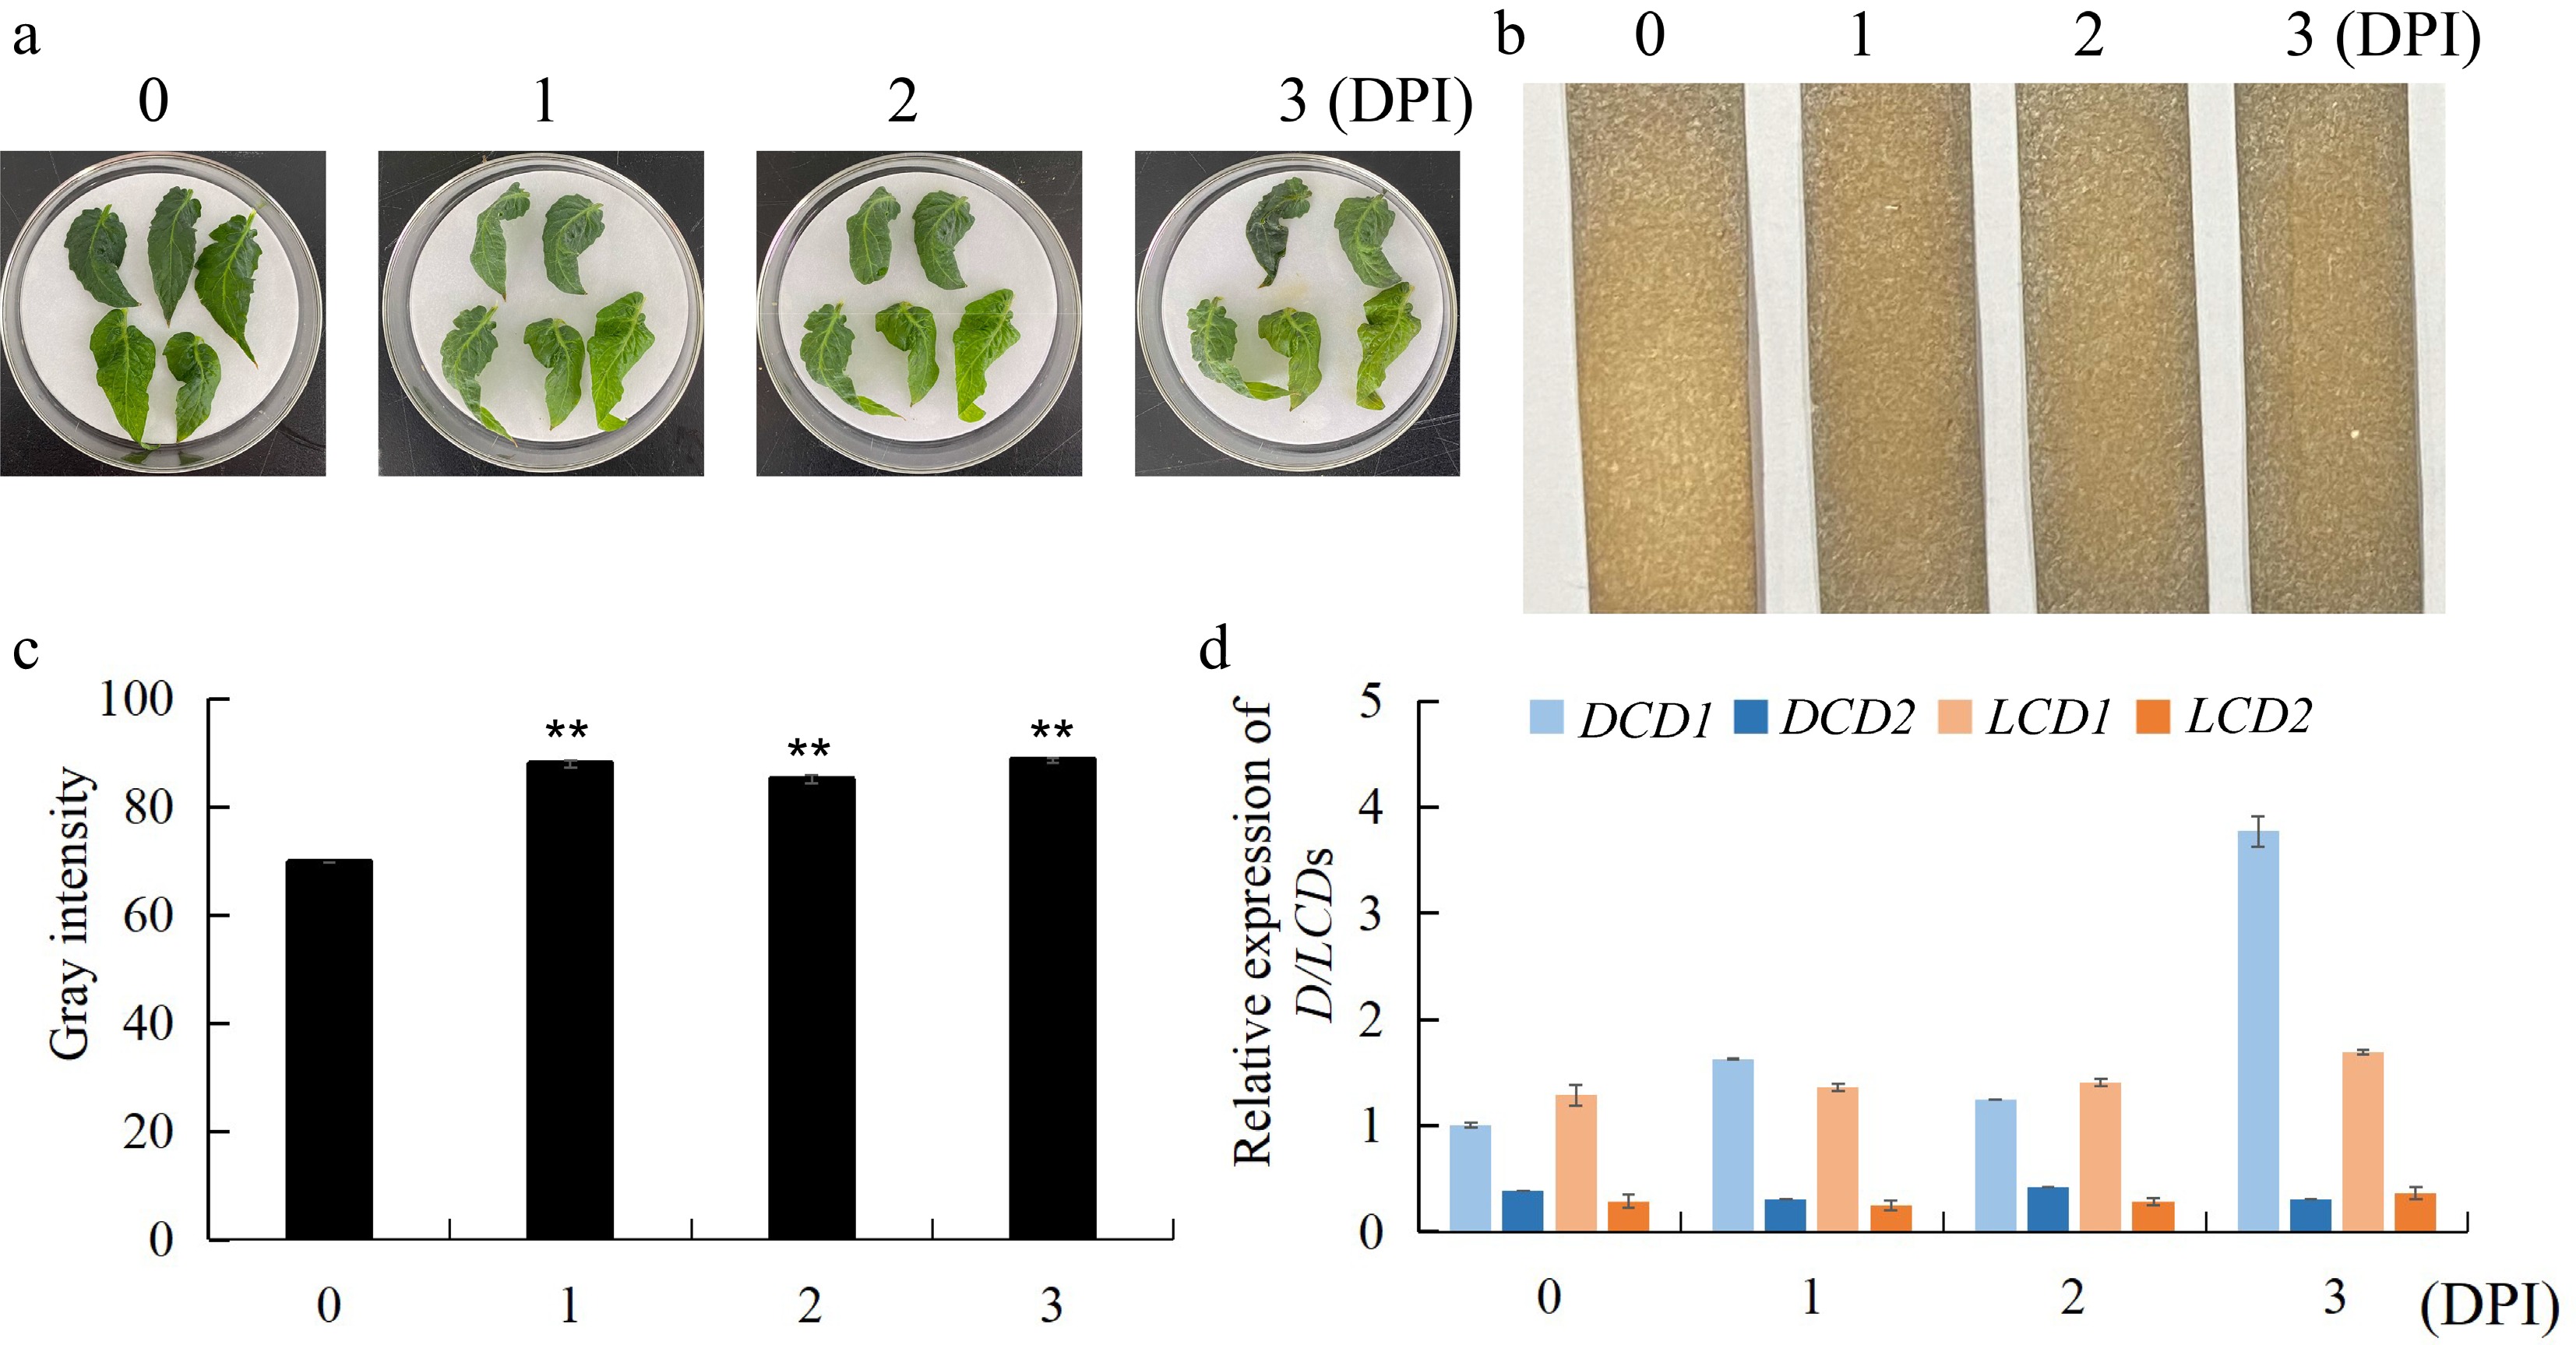
Figure 1.
Response of H2S and L/DCDs expression of tomato leaves to B. cinerea infection. (a) Phenotypes of WT leaves infected by B. cinerea for 0, 1, 2, 3 DPI. (b) The endogenous H2S production in infected WT leaves, was measured by lead acetate H2S detection strips. (c) The gray intensity analysis of strips in (b). (d) Gene expression of DCD1, DCD2, LCD1, LCD2 in WT leaves infected with B. cinerea. Data indicate mean ± SD (n = 3). The symbol ** stands for p < 0.01.
-
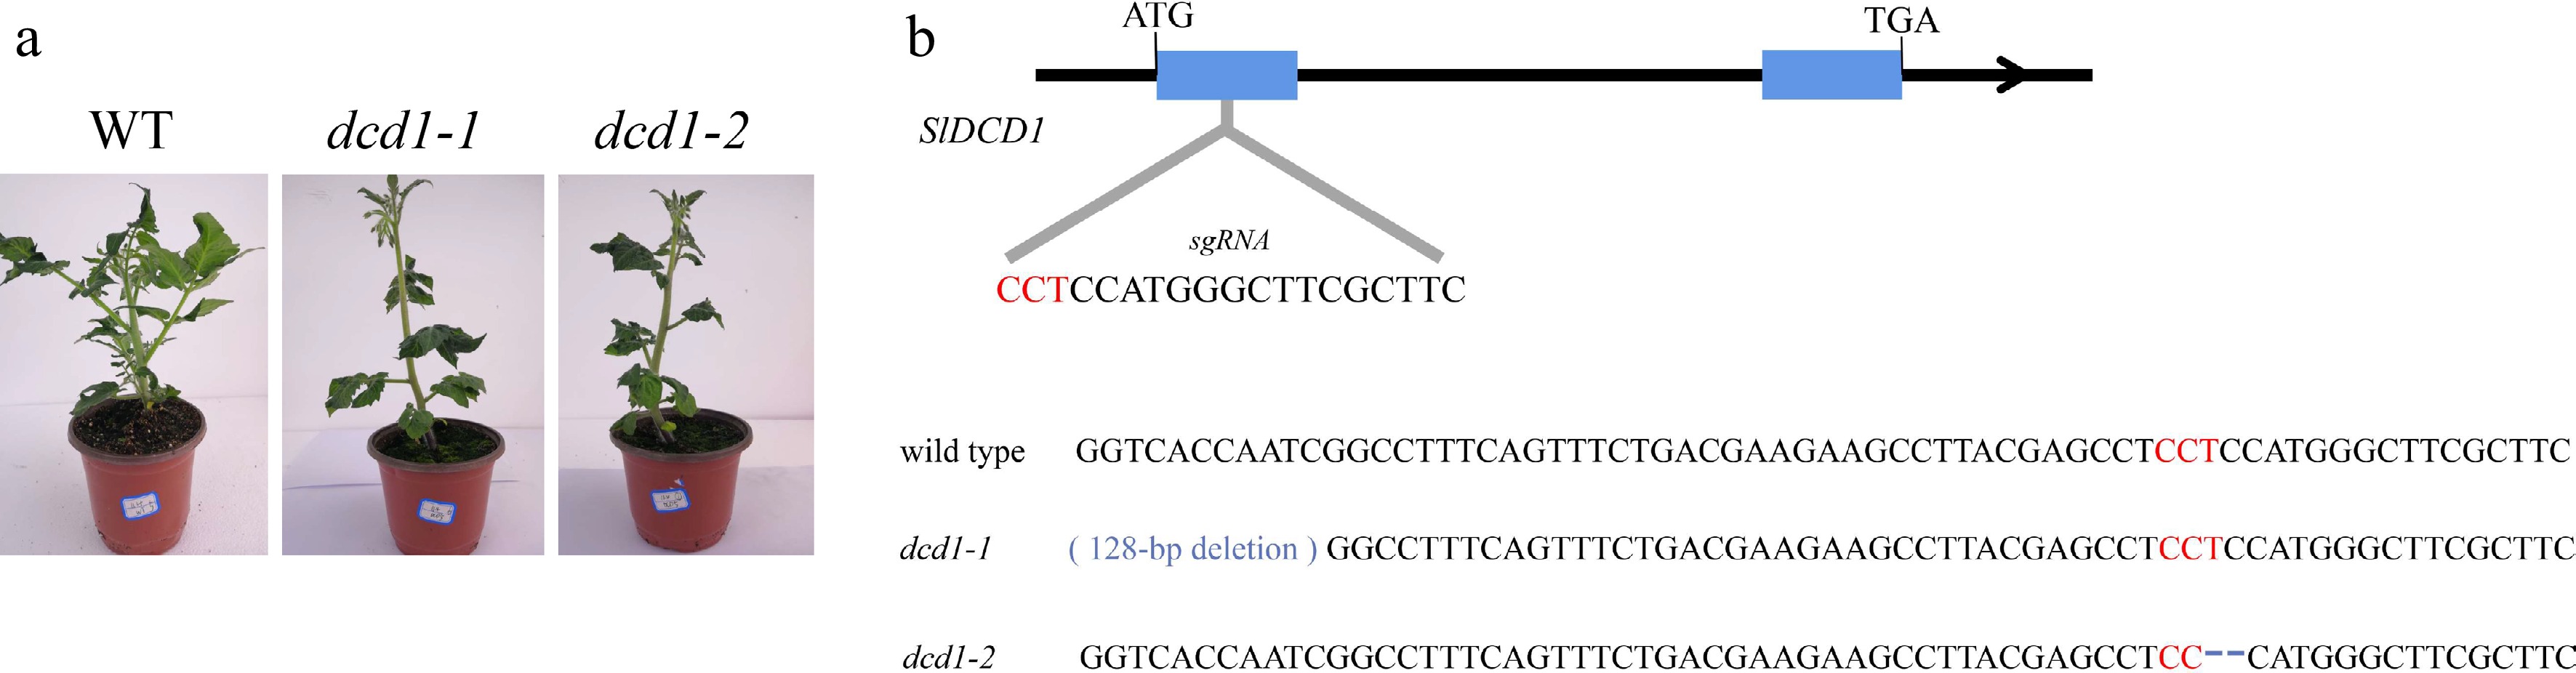
Figure 2.
The overall phenotype of the two mutant lines dcd1-1 and dcd1-2 at 45 d of growth. (a), (b) Generation of dcd1 tomato lines by CRISPR/Cas9. The protospacer-adjacent motif (PAM) is indicated in red and the dashes mean deletions of bases.
-
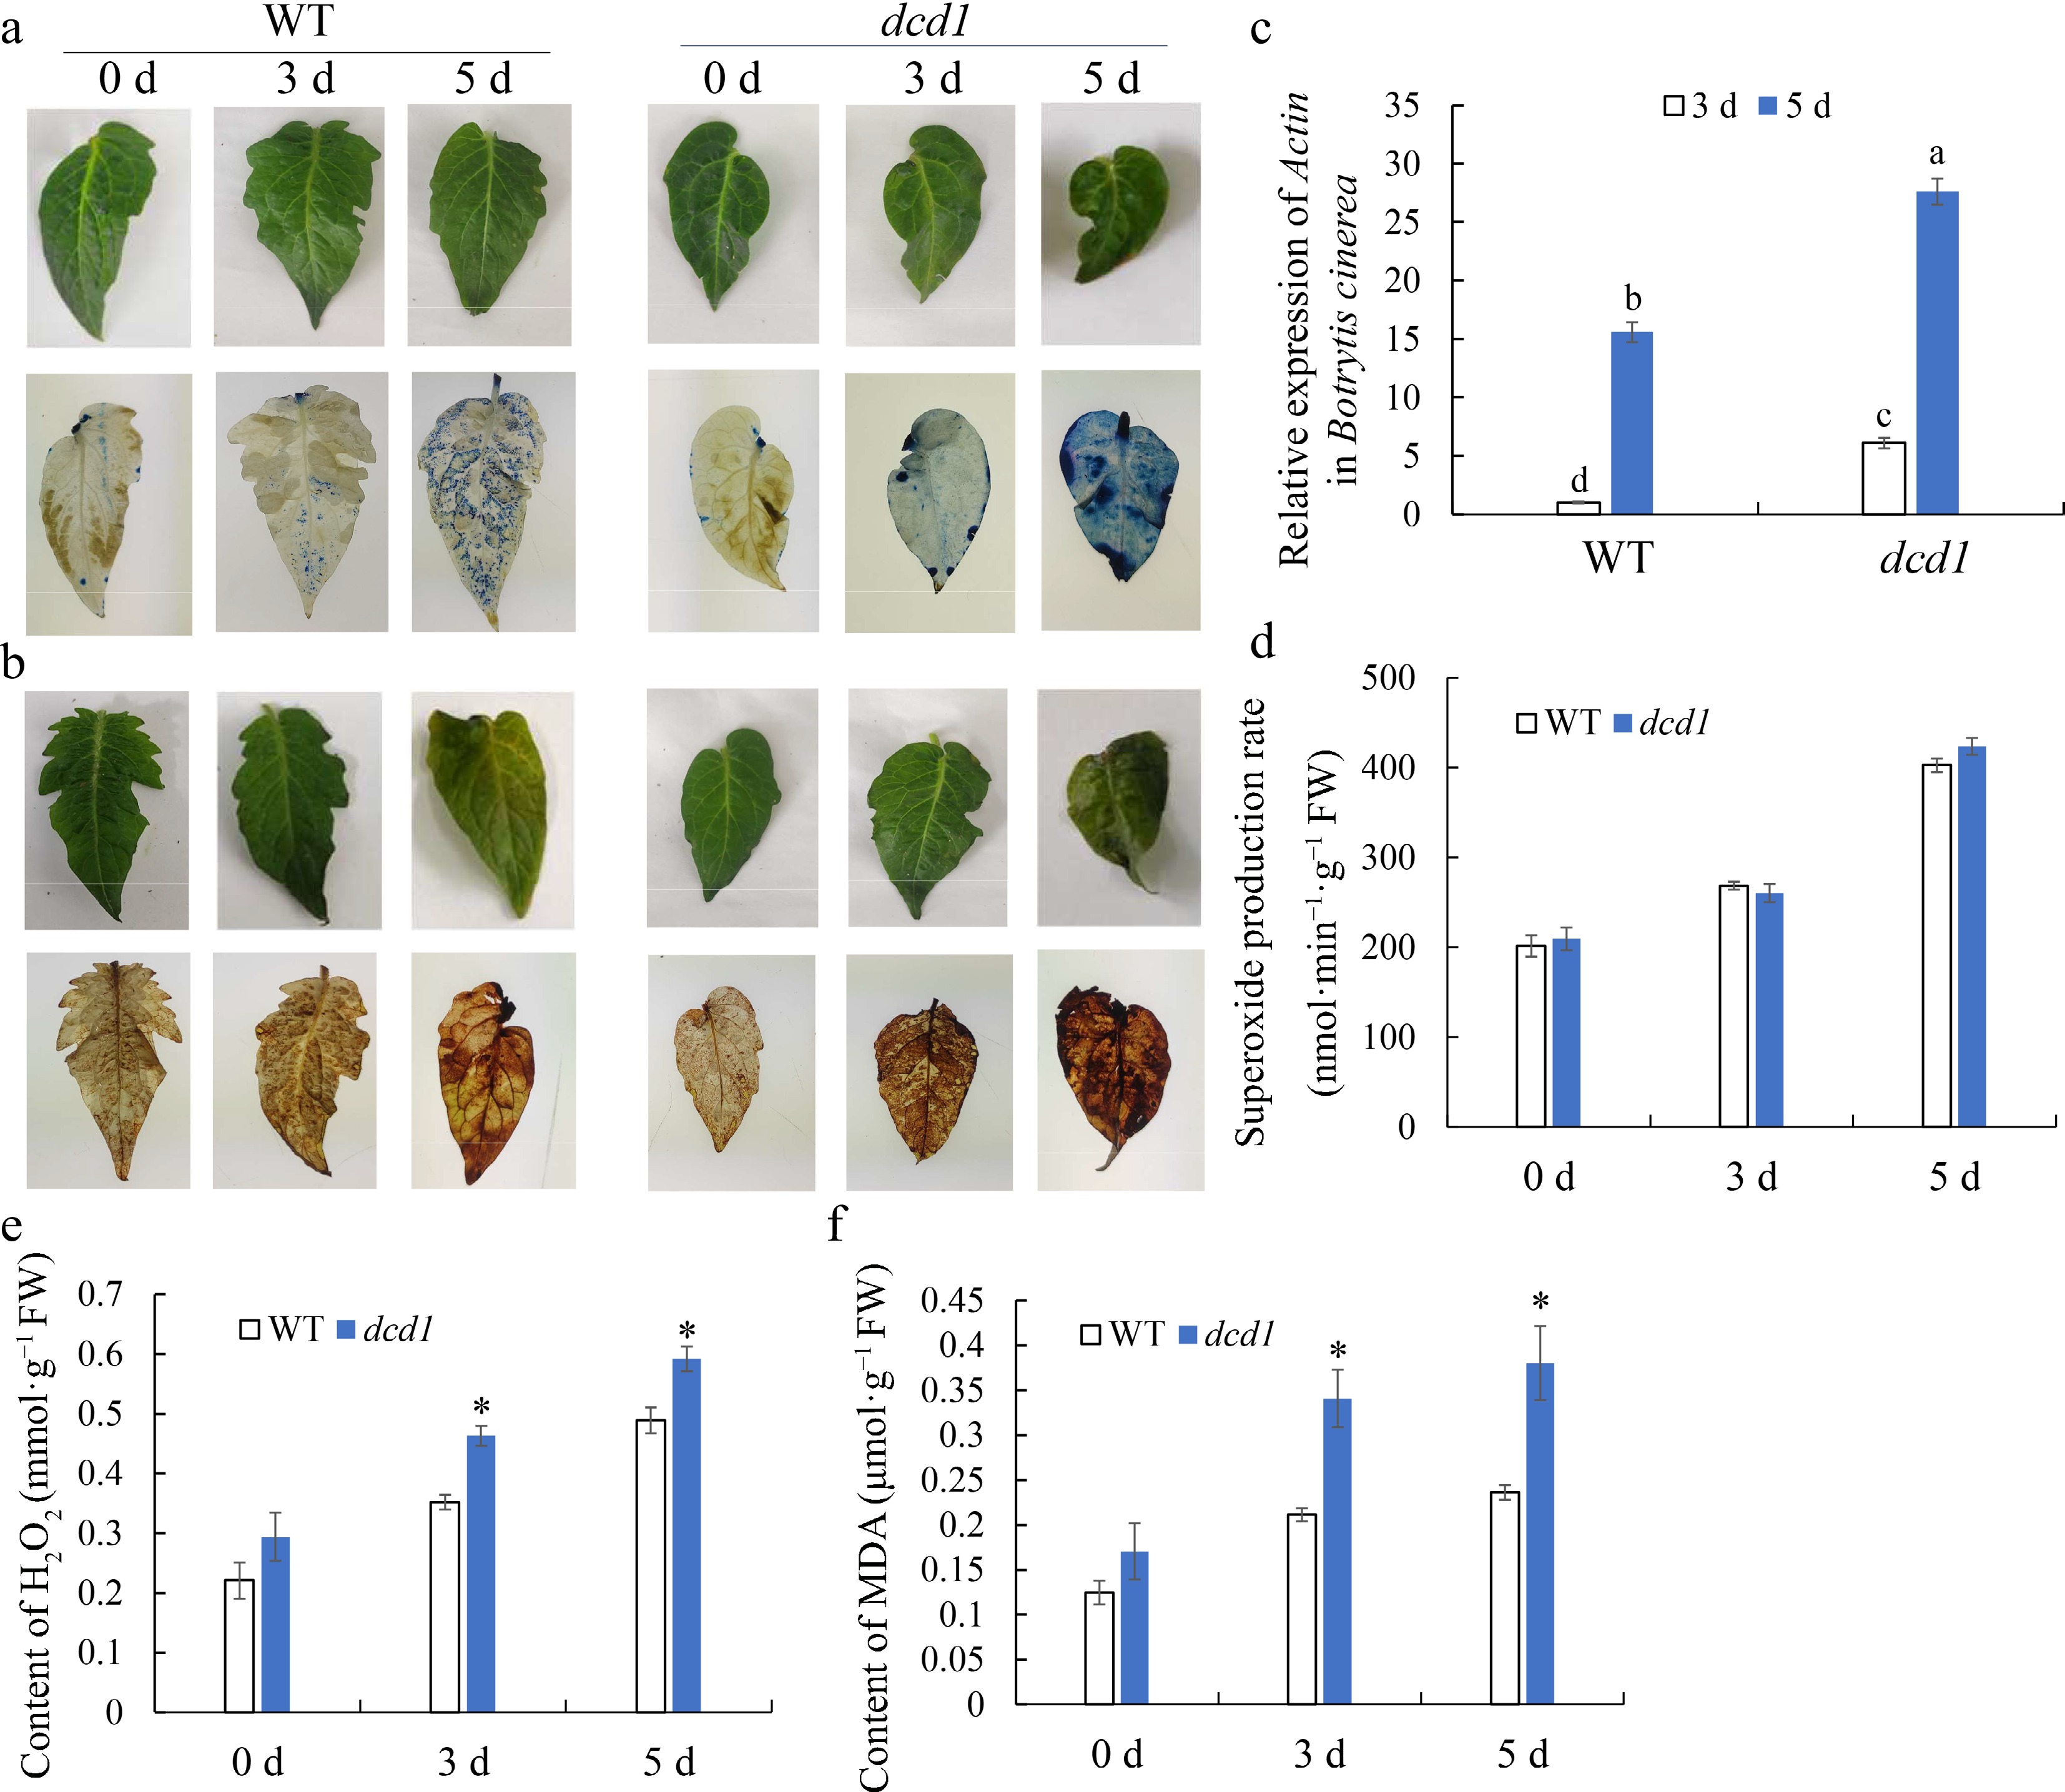
Figure 3.
Effect of dcd1 mutation on the ROS metabolism in tomato leaves infected with B. cinerea. Visualization of dead cells stained by (a) trypan blue and (b) H2O2 accumulation by DAB in tomato leaves of wild-type and dcd1 mutation. The expression of (c) B. cinerea actin gene, (d) O2.− generation rate, (e) H2O2 content and (f) MDA content in wild-type and dcd1 mutant leaves after infection with B. cinerea for 0, 3 and 5 d. Trypan blue staining and DAB staining of leaves infected with a conidial suspension were performed at different time points post inoculation (0, 3, and 5 d). The results of (c) - (f) are expressed as the mean values ± SD, n = 3. The symbols * or letters above the bars stands for student's t-test at p < 0.05.
-
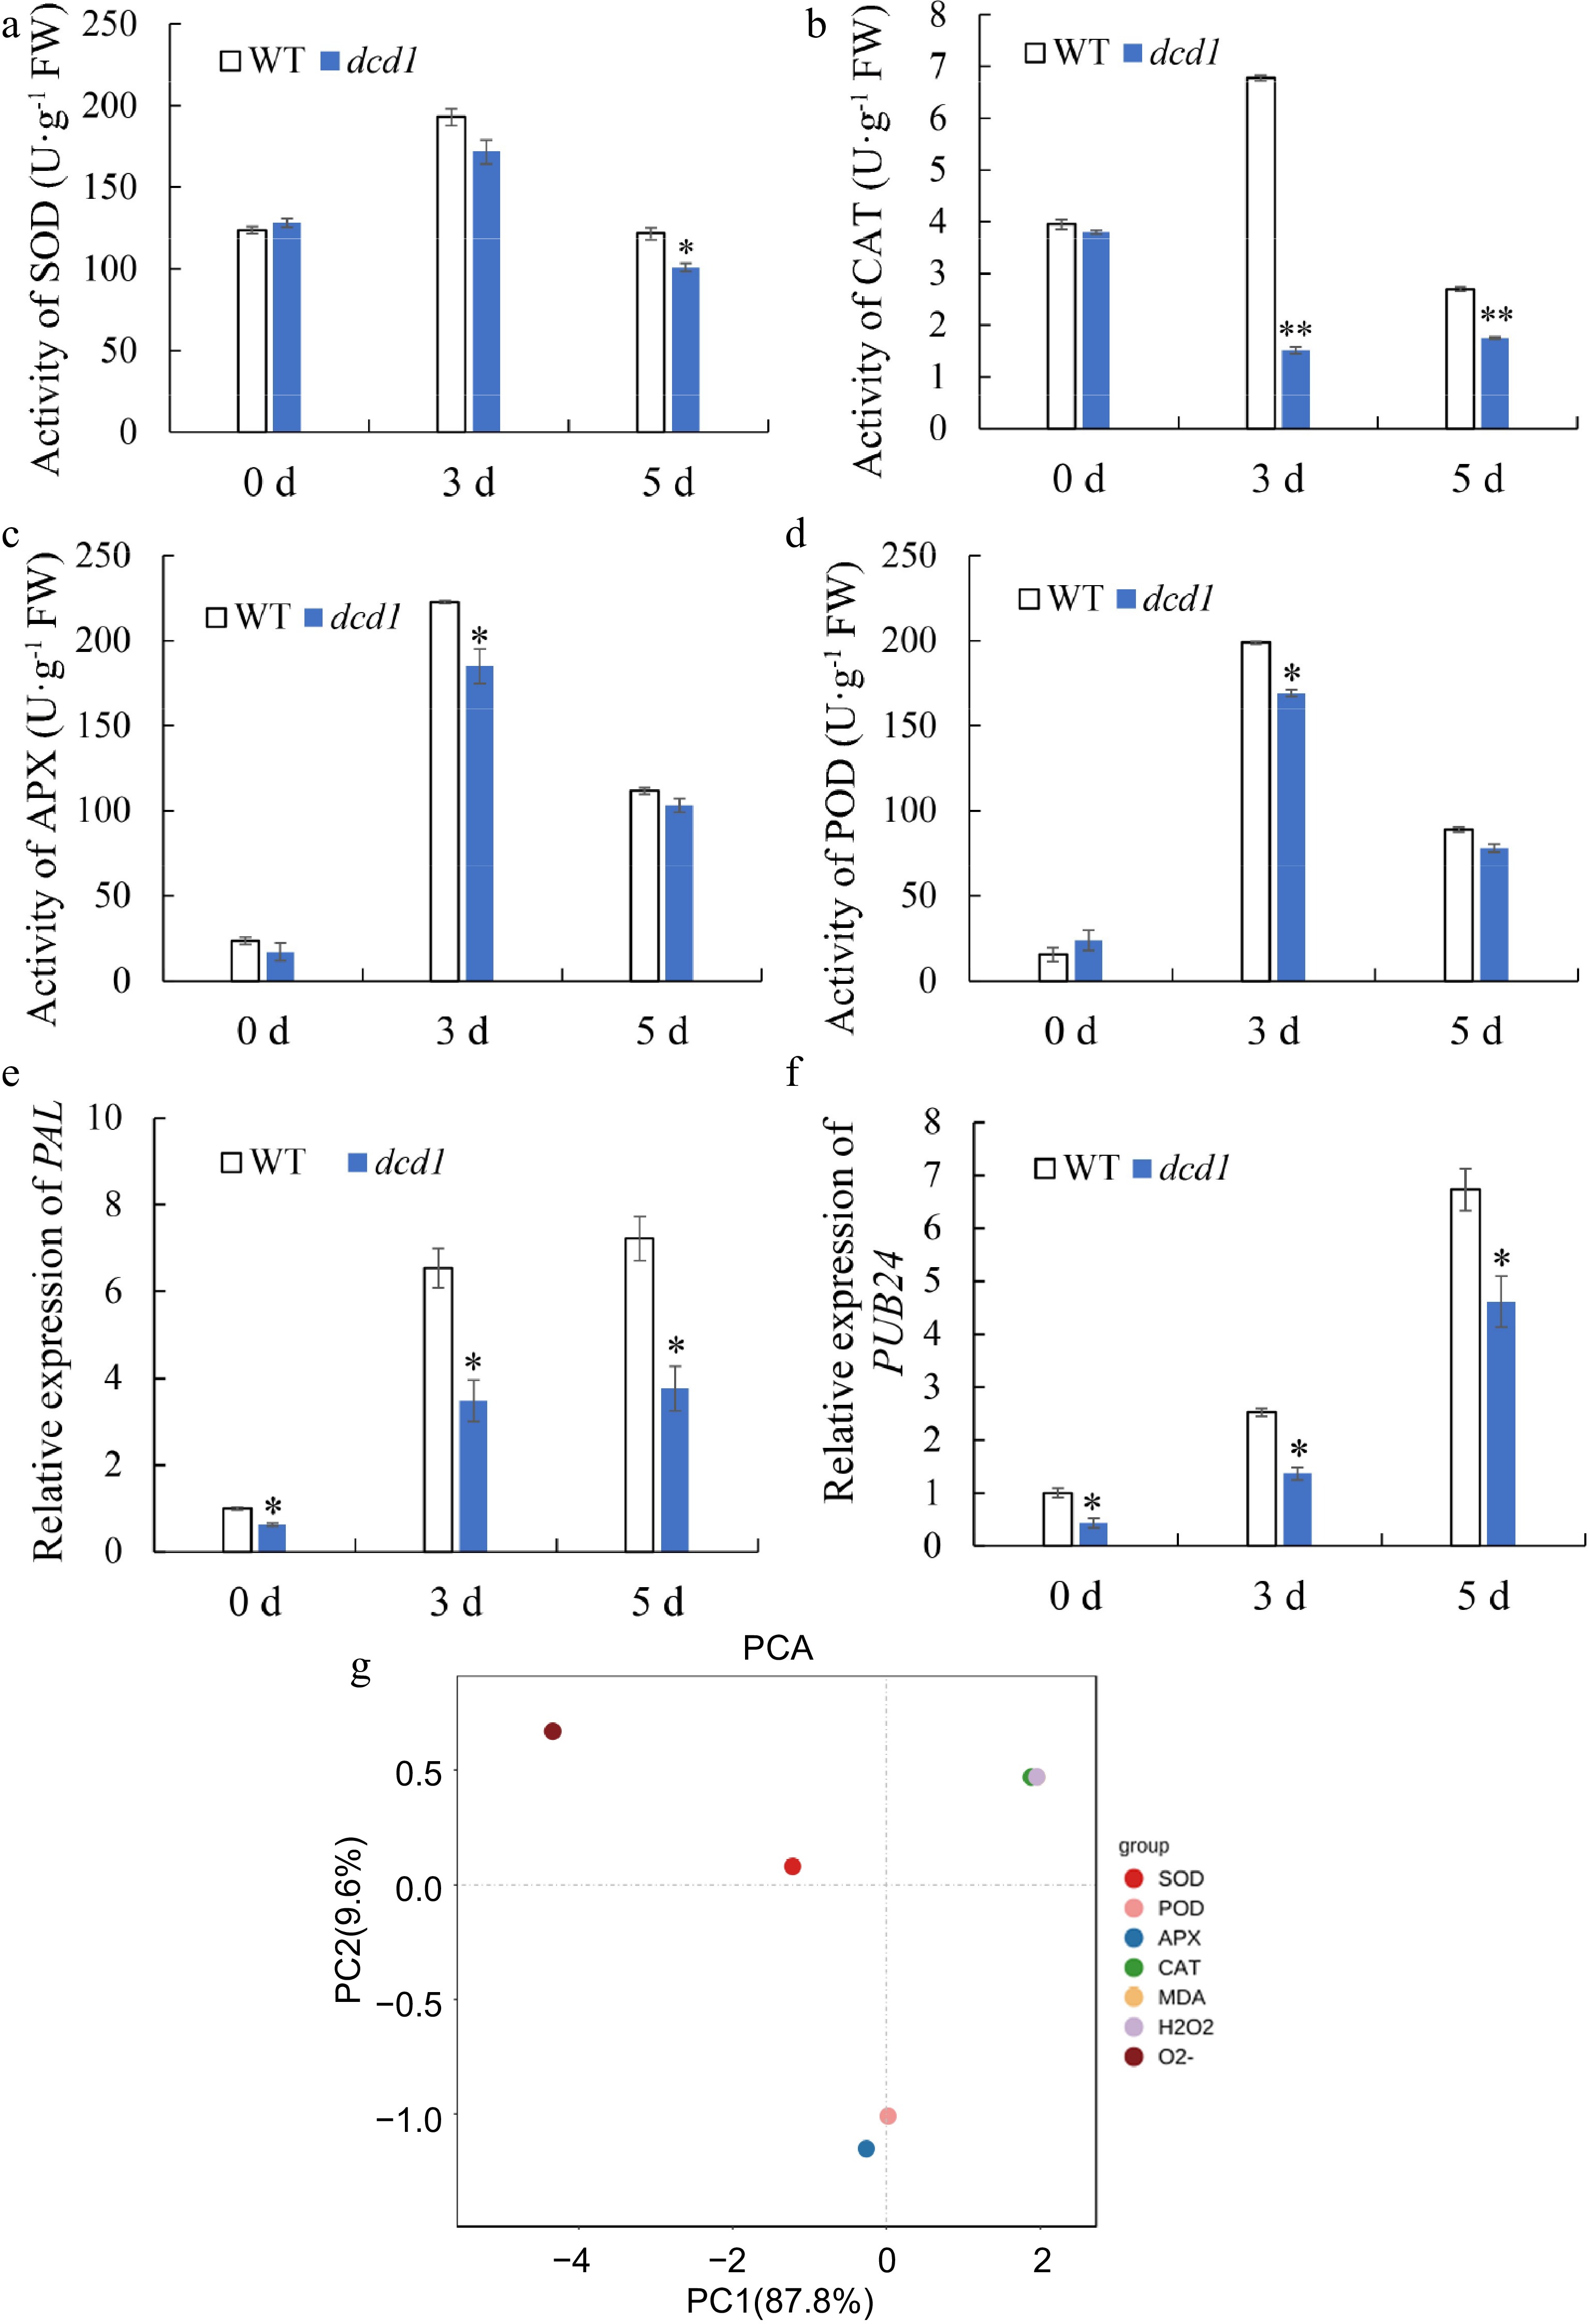
Figure 4.
Changes of antioxidant enzyme (a) CAT, (b) SOD, (c) APX, (d) POD activities and PCA analysis of the parameters of antioxidant enzyme activities and MDA content, content of H2O2, production rate of O2.− in tomato leaves after inoculating with B. cinerea for 0, 3 and 5 d. (g). The expression levels of pathogenesis-related genes (e) PAL and (f) PUB24 by RT-qPCR in tomato leaves after inoculating with B. cinerea for 0, 3 and 5 d. Data indicate mean ± SD (n=3). The symbols ** and * stand for p < 0.01 and p < 0.05, respectively.
-
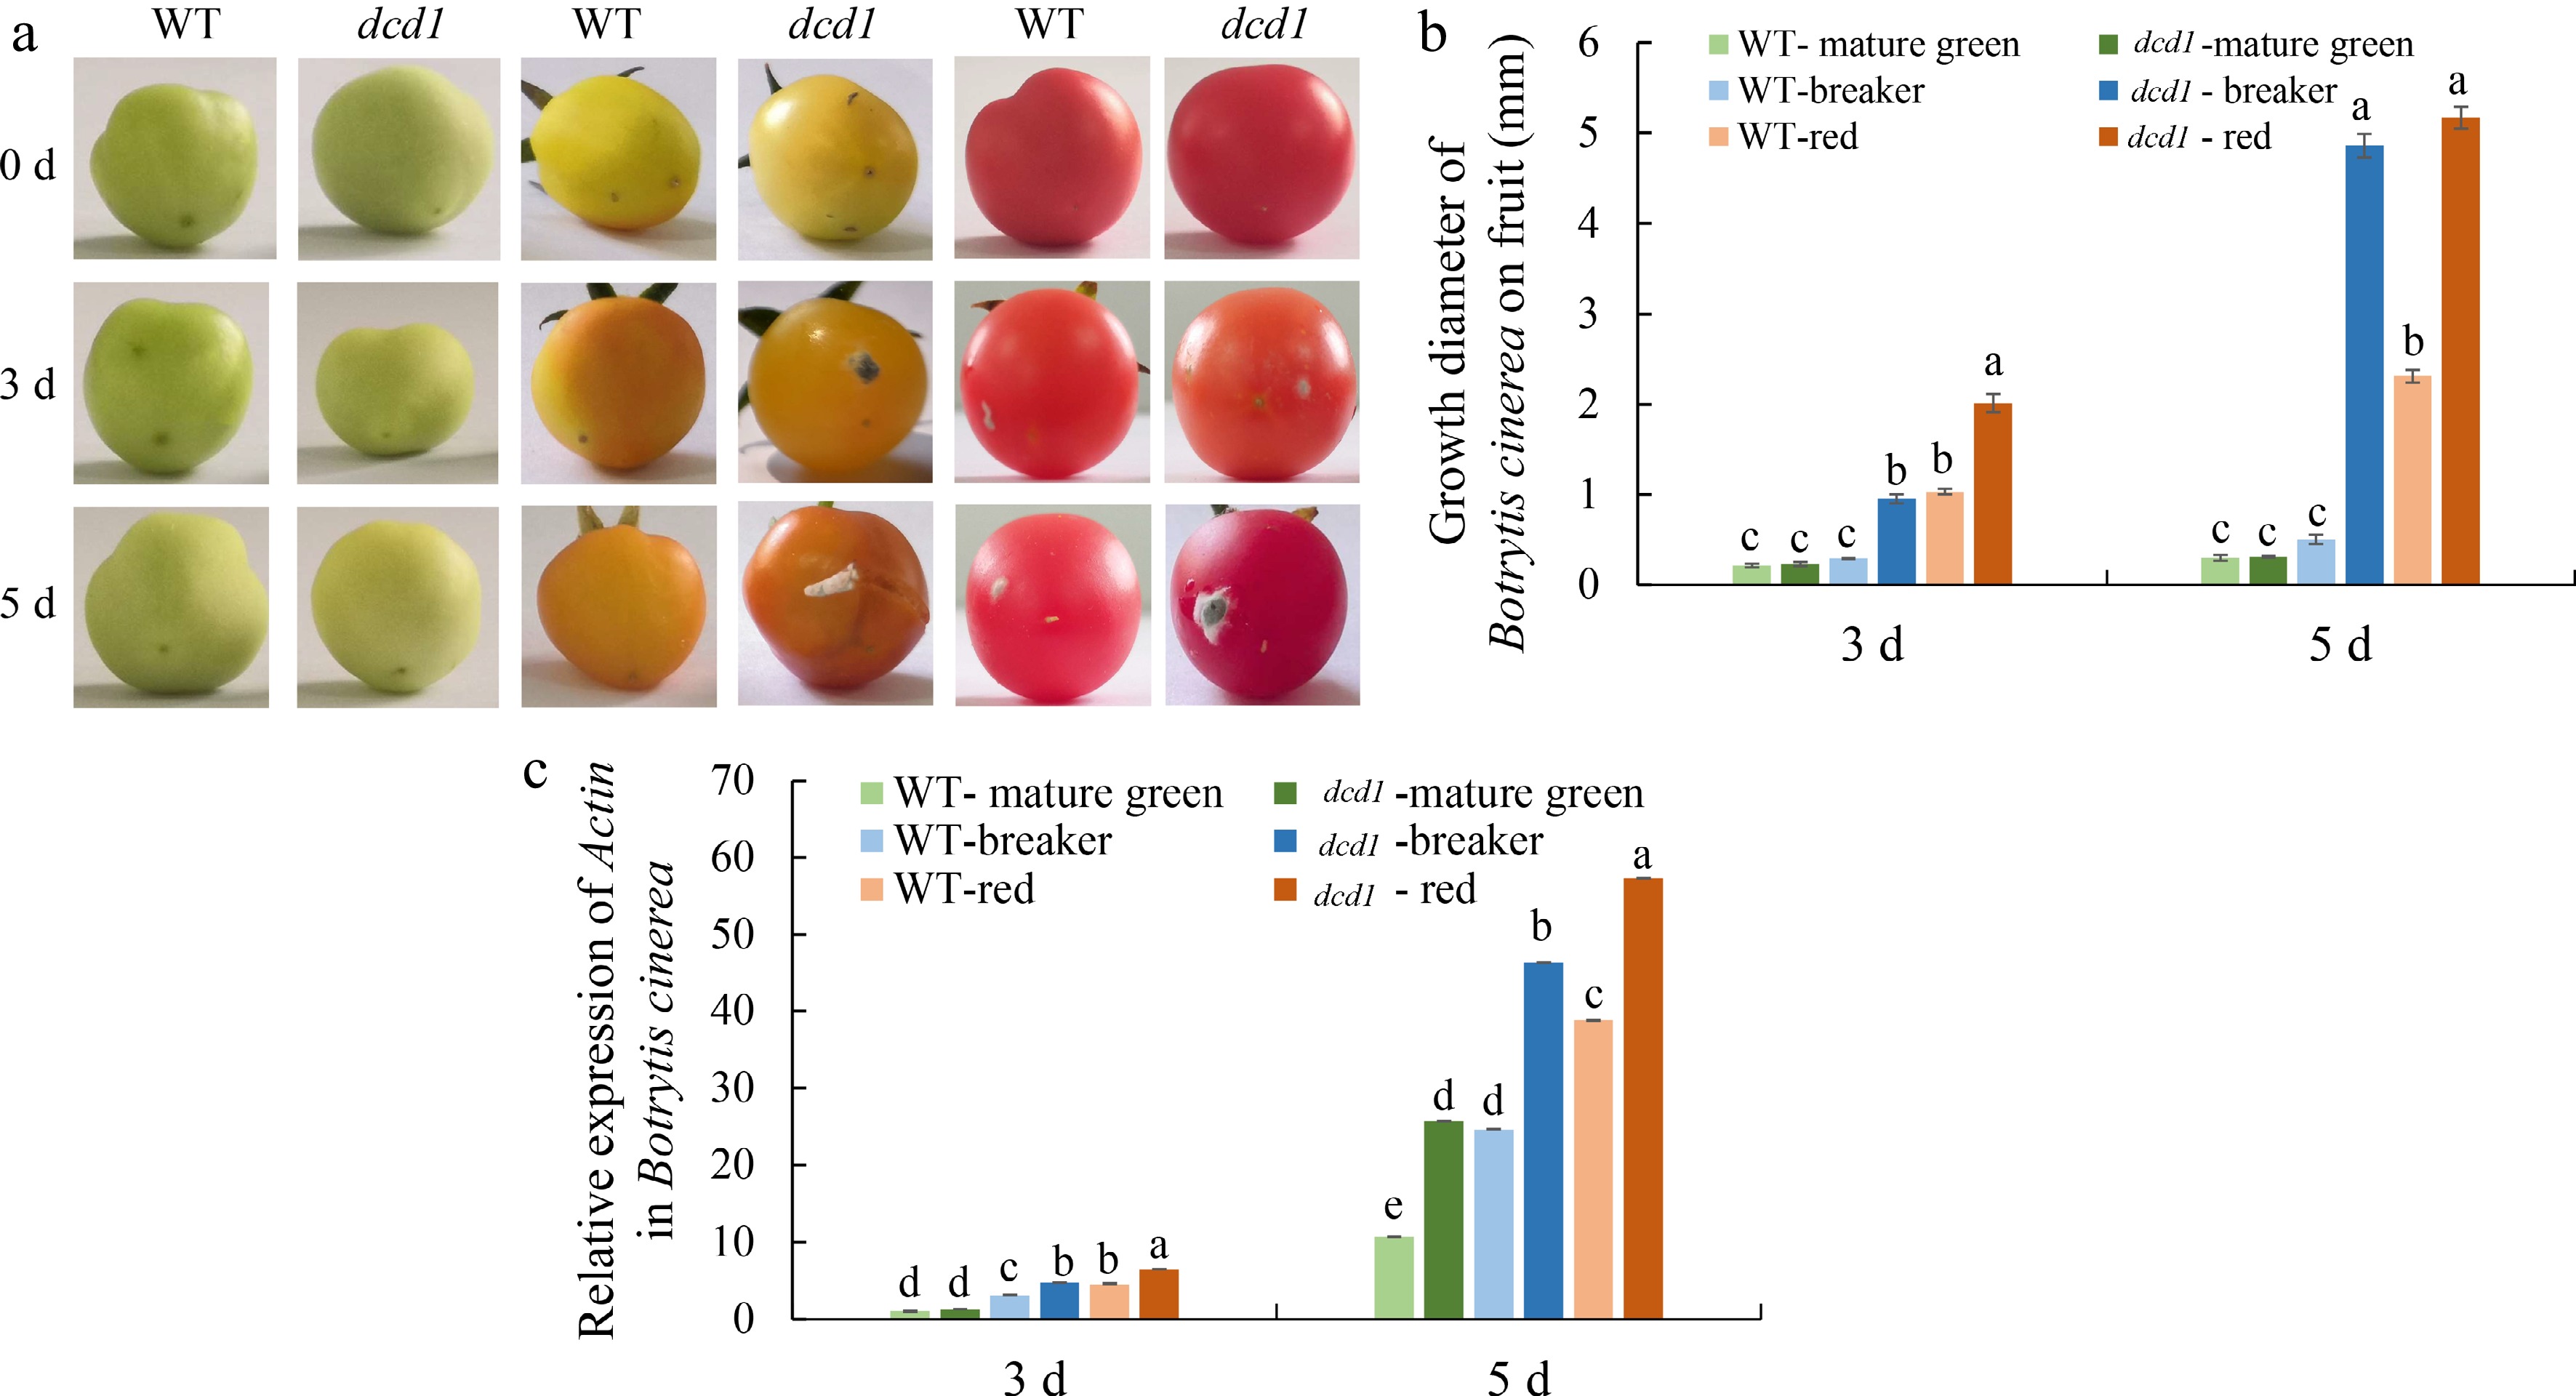
Figure 5.
Effect of WT and dcd1 mutation on defense to B. cinerea in tomato fruit at different ripening stages. (a) Images of WT and dcd1 fruits at mature green, breaker or red stages inoculated with B. cinerea for 0, 3 and 5 d. (b) Growth diameter of B. cinerea growing on the surface of WT and dcd1 fruits and (c) B. cinerea actin gene expression were detected after inoculating with B. cinerea. Values are the means ± SDs of three replicates. The letters above the bar indicate statistical significance determined by a student's t-test at the p <0.05 level.
-
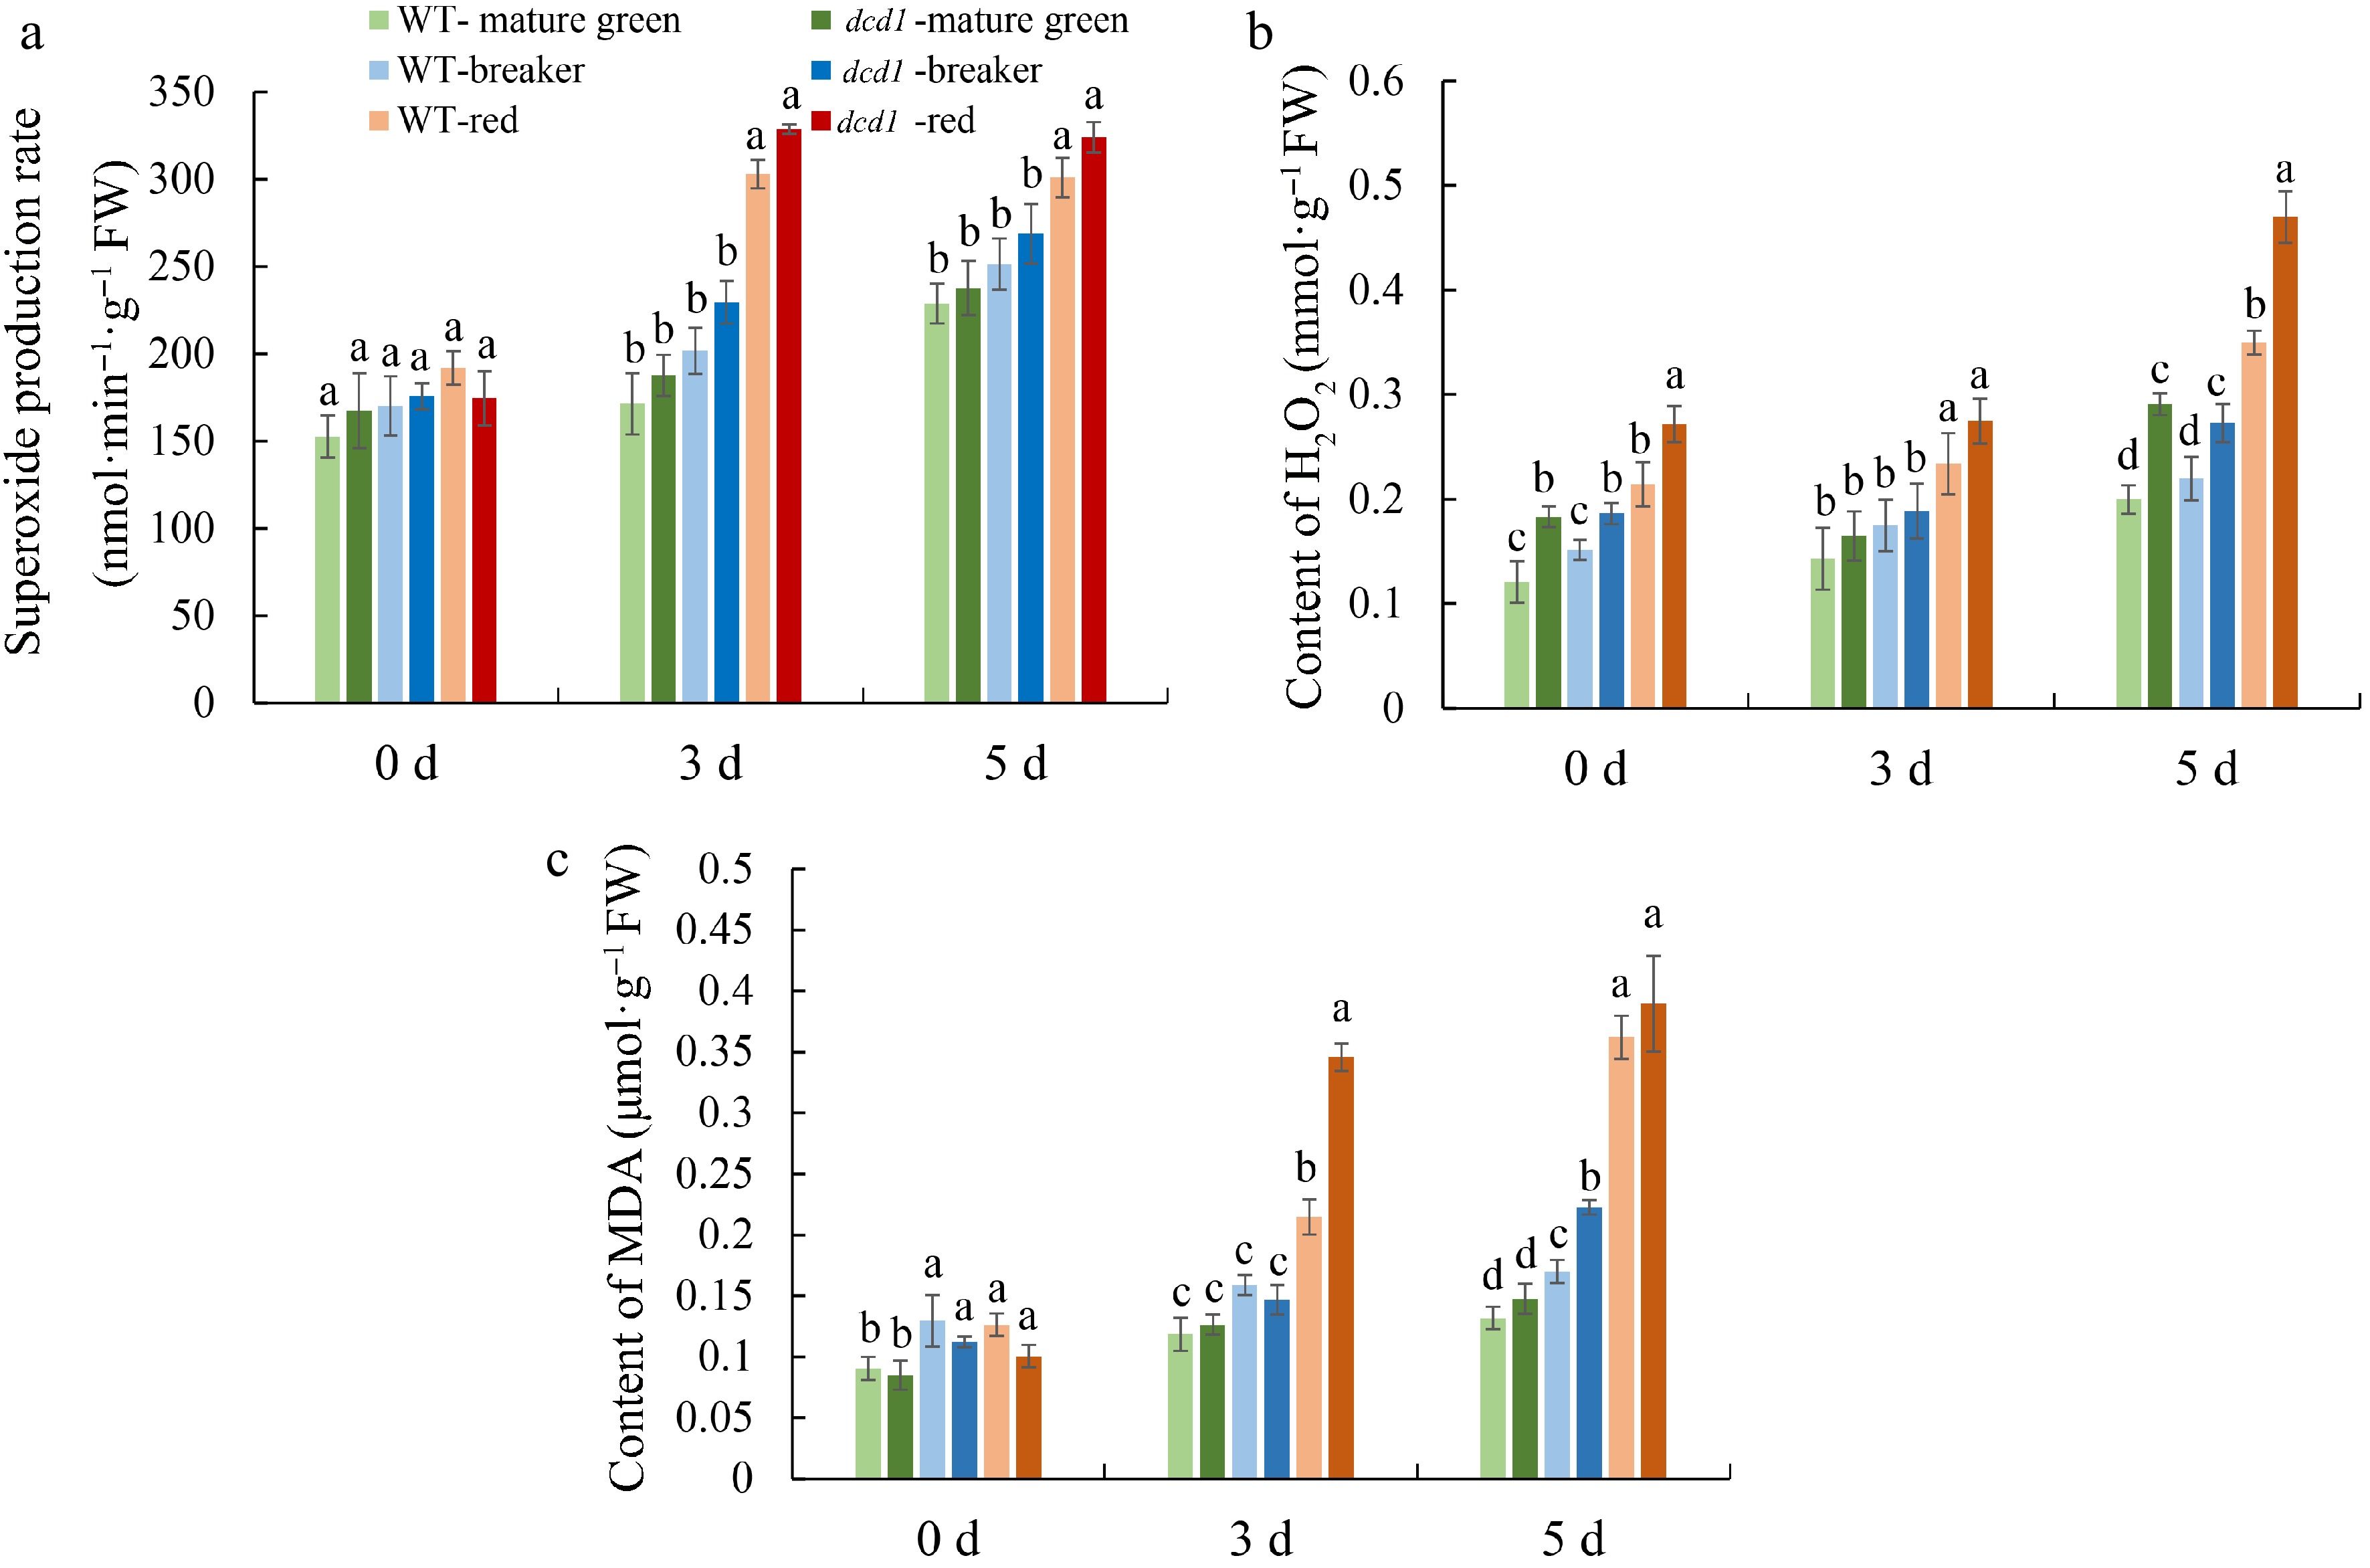
Figure 6.
Changes of (a) MDA content, (b) content of H2O2, (c) production rate of O2•− in tomato fruit of WT and dcd1 mutant at mature green, breaker and red stages after inoculating with B. cinerea at 0, 3 and 5 d. Data indicate mean ± SD (n = 3). Letters indicate statistical significance determined by a student's t-test at the p < 0.05 level.
-
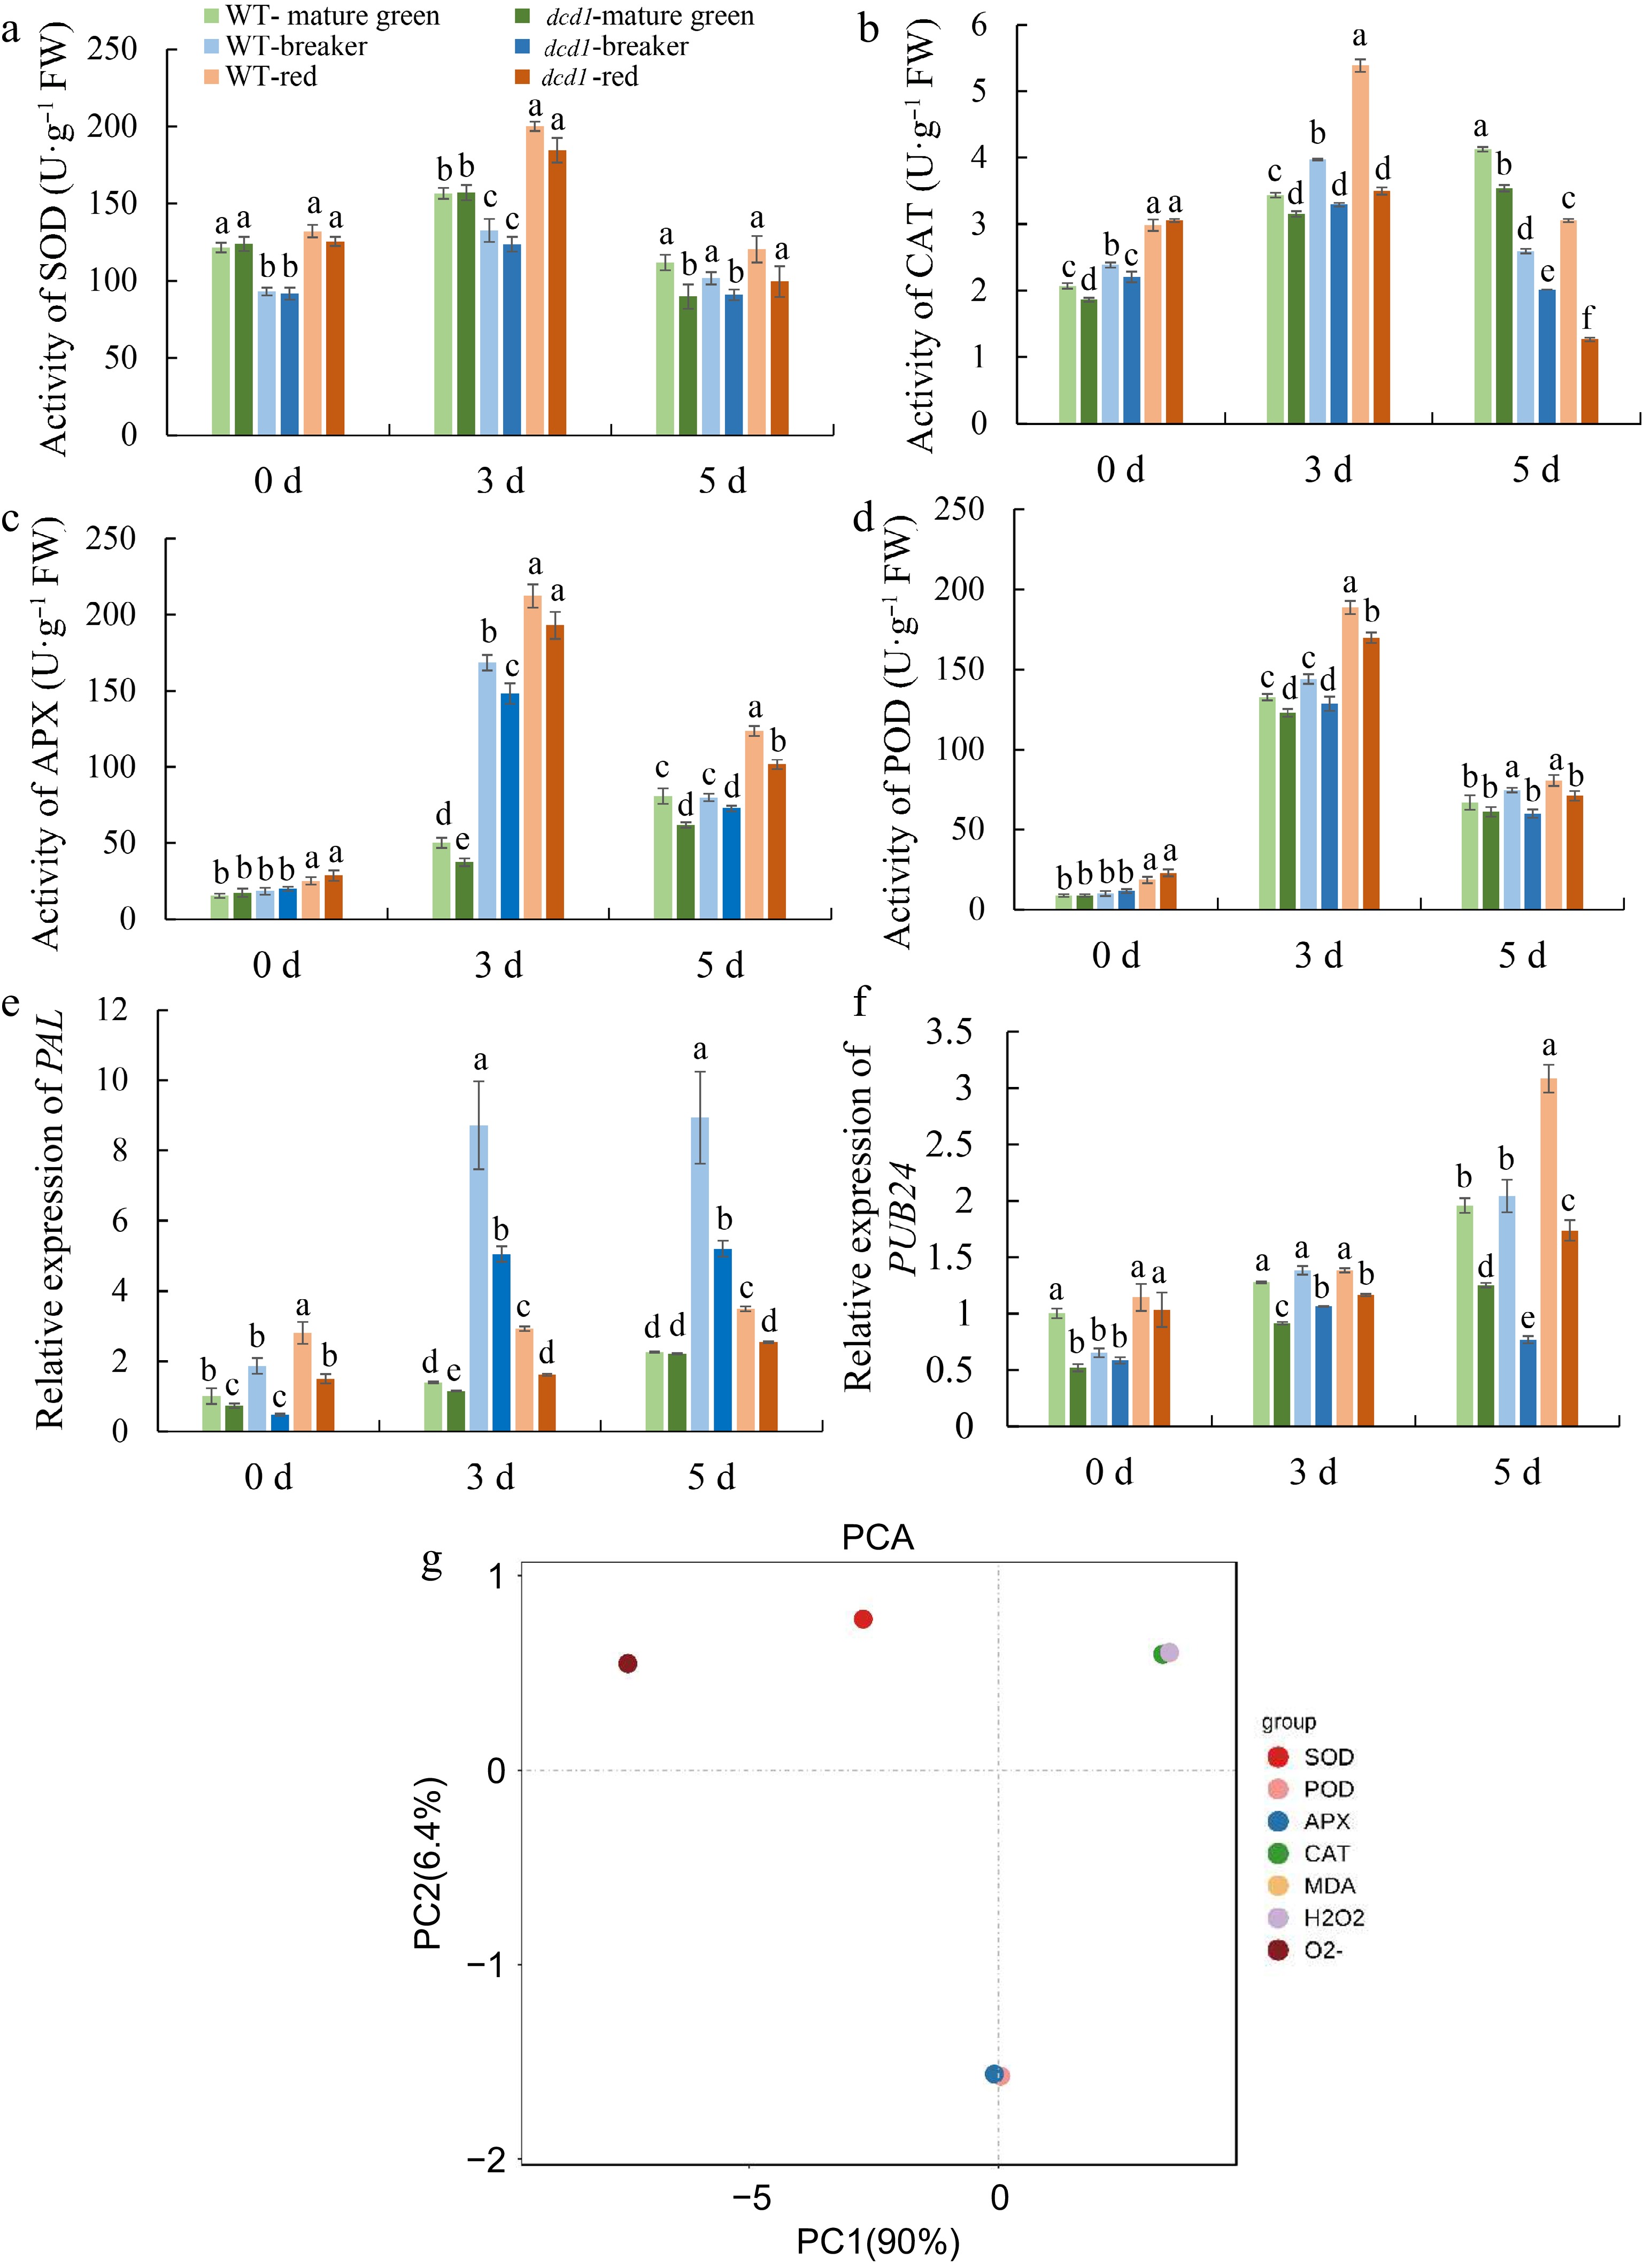
Figure 7.
Changes of antioxidant enzyme (a) CAT, (b) SOD, (c) APX, (d) POD activities and PCA analysis of enzyme activities and MDA content, content of H2O2, production rate of O2.− in tomato fruit of WT and dcd1 mutant at mature green, breaker and red stages after inoculating with B. cinerea at 0, 3 and 5 d. (g) The expression levels of pathogenesis-related genes (e) PAL and (f) PUB24 determined by RT-qPCR in WT and dcd1 tomato fruits after inoculating with B. cinerea. Data indicate mean ± SD (n = 3). Letters indicate statistical significance determined by a student's t test at the p < 0.01 level.
Figures
(7)
Tables
(0)