-
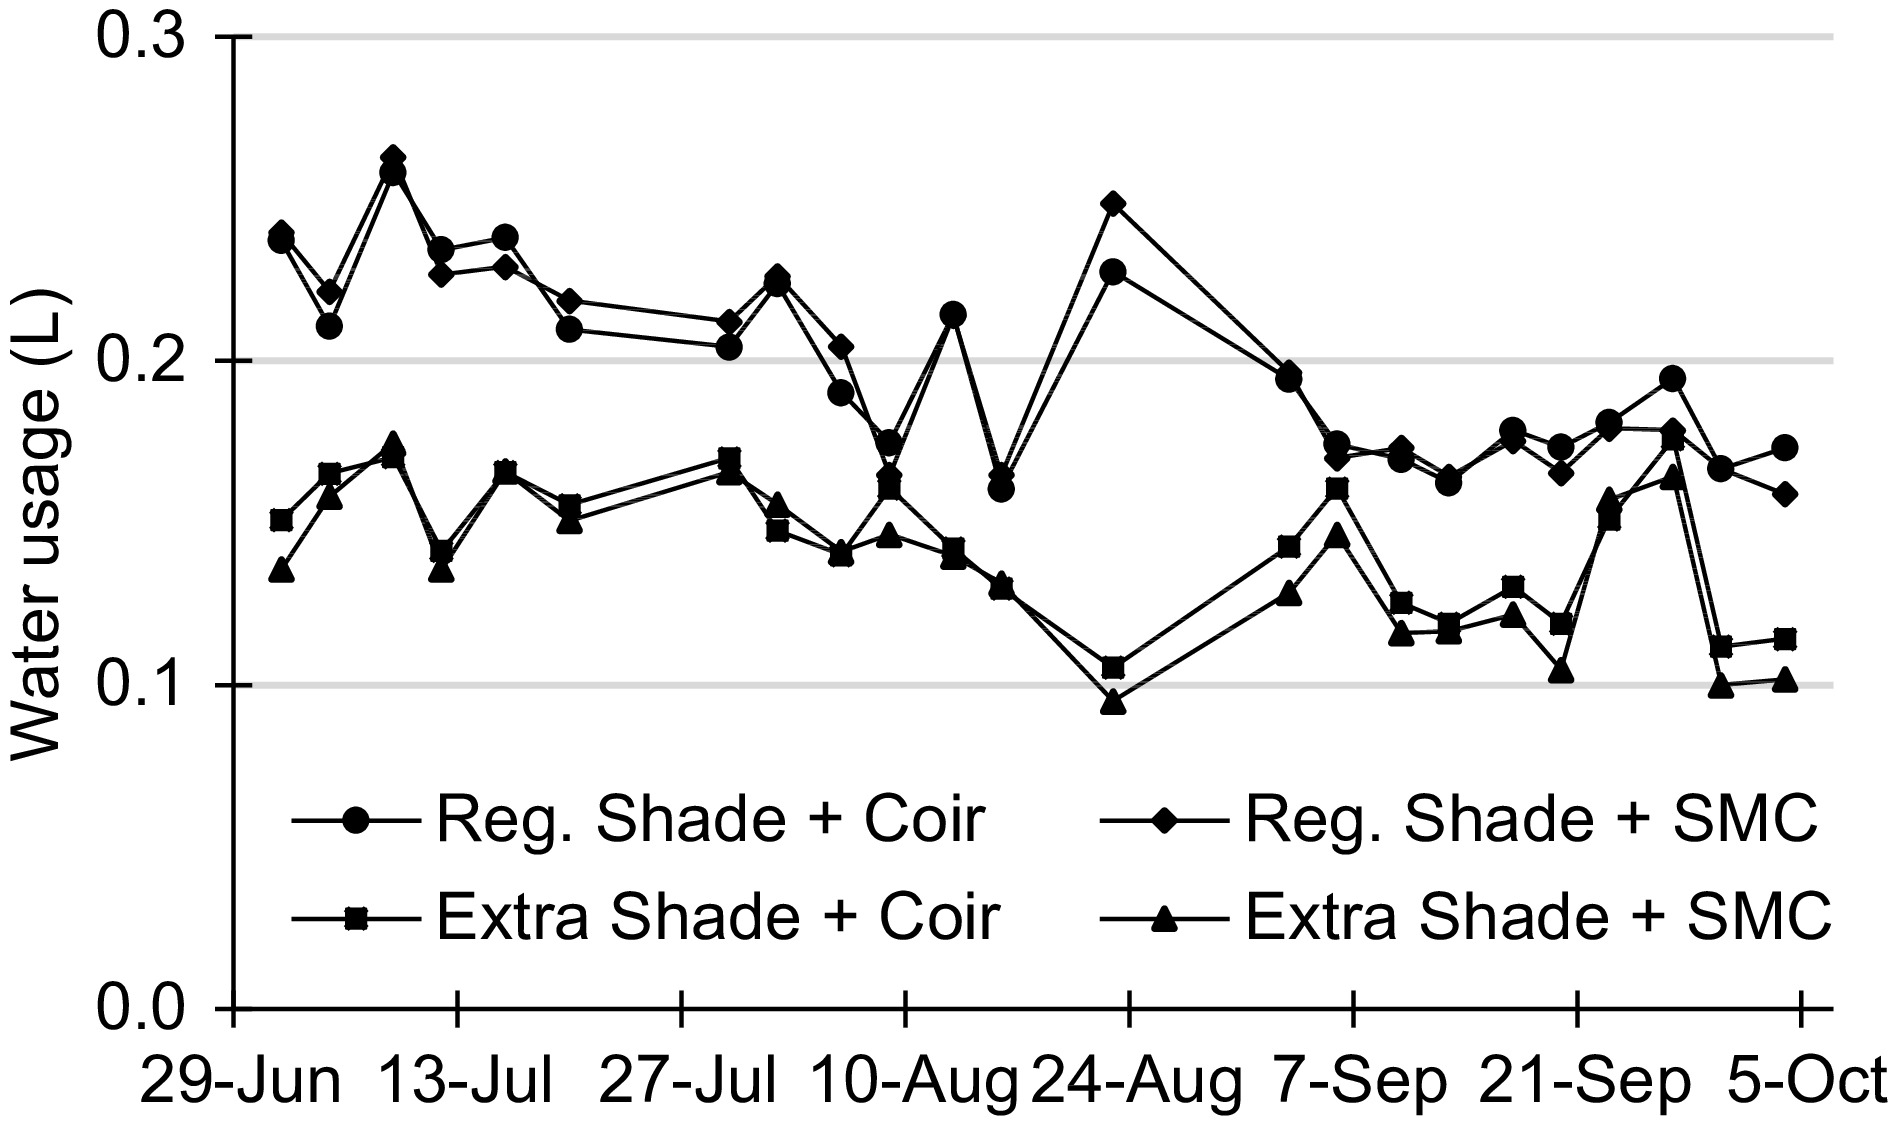
Figure 1.
Daily water usage per plant of Tango mandarin grafted on C35 throughout the experiment. The daily usage values were normalized by dividing the recorded volume by the number of days elapsed between each sampling (i.e. sampling frequency of either 3 or 4 days, twice a week).
-
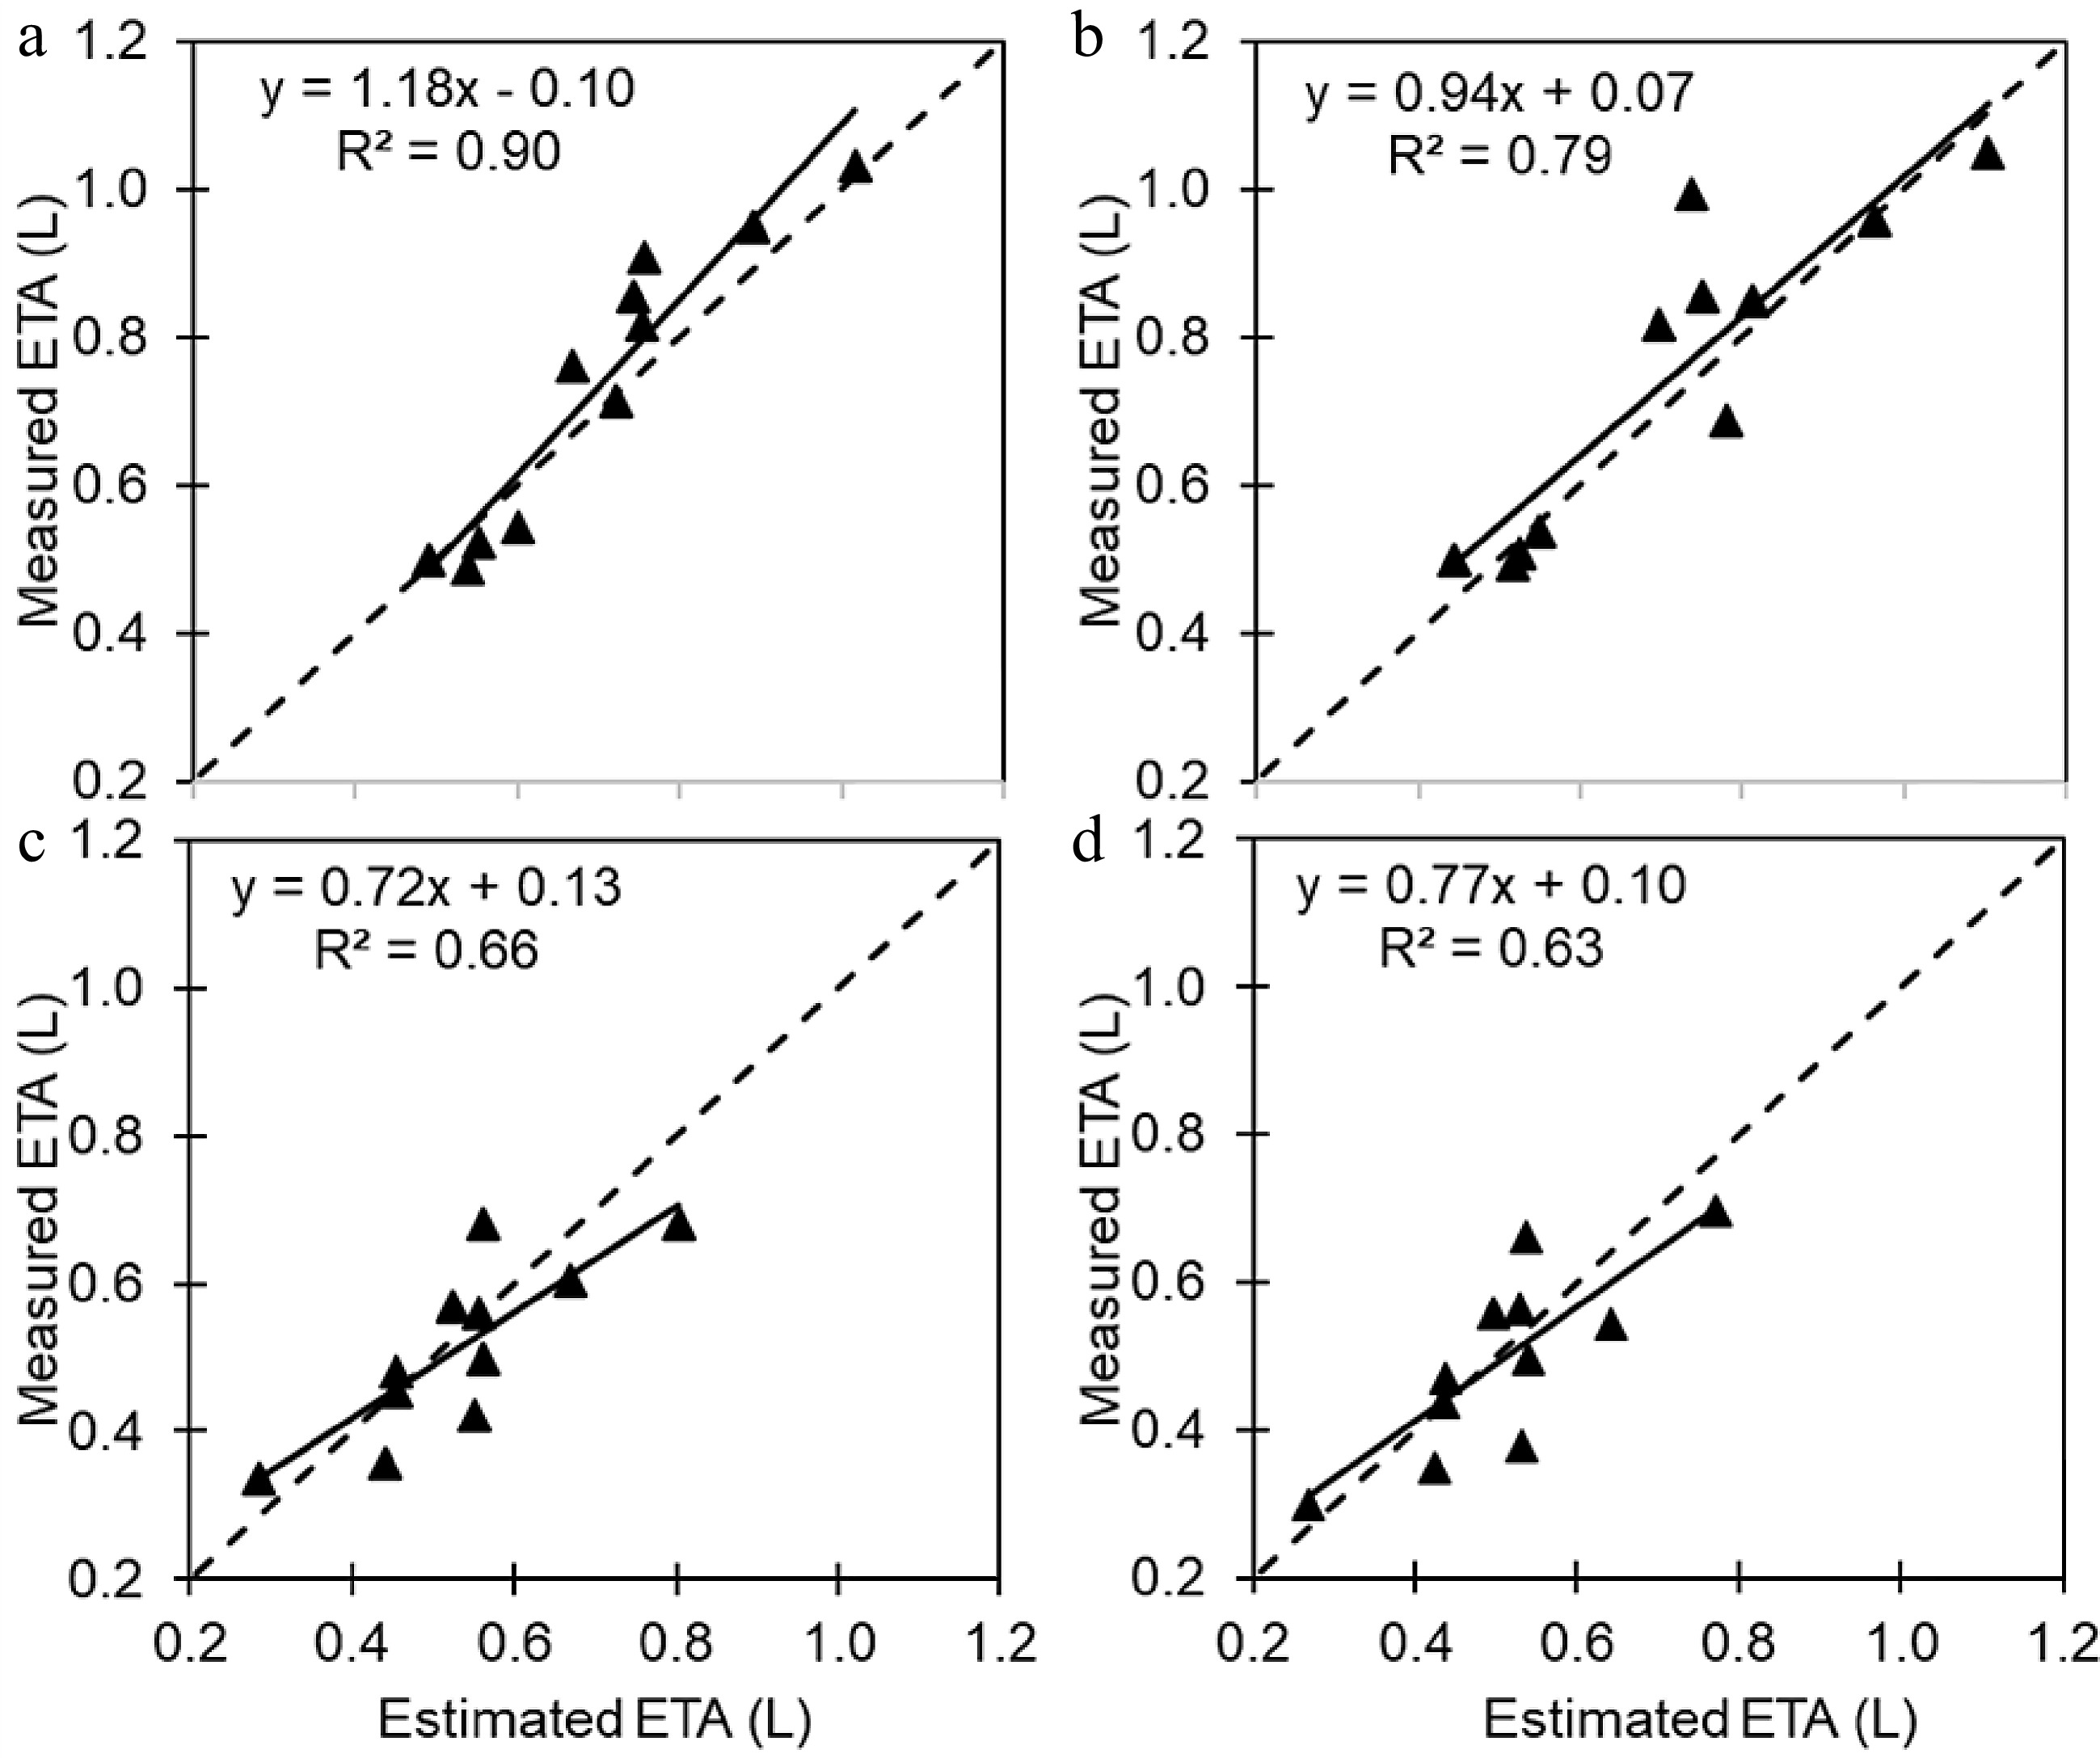
Figure 2.
Plots of measured daily actual evapotranspiration (
$ {ET}_{A} $ $ {ET}_{A} $ -
Treatment
coden Shade Substrate Fertigation
management1 2 Regular Coconut coir Flow-through 2 2 Regular Commercial mix Flow-through 3 2 Regular Coconut coir Recirculating 4 2 Regular Commercial mix Recirculating 5 2 Extra Coconut coir Flow-through 6 2 Extra Commercial mix Flow-through 7 2 Extra Coconut coir Recirculating 8 2 Extra Commercial mix Recirculating Table 1.
Details of each treatment combination.
-
Treatment combination Linear equation R2 Projected trunk diameter (mm) 1 Dt = 0.134 × t + 3.126 0.97 9.6a 2 Dt = 0.095 × t + 3.300 0.96 7.9 3 Dt = 0.115 × t + 3.283 0.98 8.8a 4 Dt = 0.082 × t + 3.499 0.98 7.4 5 Dt = 0.106 × t + 3.323 0.97 8.4a 6 Dt = 0.089 × t + 3.276 0.97 7.6 7 Dt = 0.091 × t + 3.354 0.97 7.7 8 Dt = 0.086 × t + 3.195 0.97 7.3 a Trees with a salable trunk diameter. Table 2.
Trunk growth rate in the treatments and the projected trunk diameter on target selling date.
-
Height
(cm)Diameter
(mm)Total leaf
area (cm2)Leaf
countShade Extra 39.7 ± 1.8a 4.64 ± 0.06a 678.0 ± 68.0a 48 ± 6a Regular 35.0 ± 2.2a 4.84 ± 0.07a 682.2 ± 83.2a 70 ± 7a Substrate Coir 38.6 ± 1.6a 4.90 ± 0.07a 764.8 ± 62.8a 62 ± 5a Mix 36.1 ± 1.6a 4.58 ± 0.07b 595.5 ± 62.8a 56 ± 5a Fertigation Flow-through 37.4 ± 2.2a 4.79 ± 0.07a 728.5 ± 83.2a 66 ± 7a Recirculating 37.3 ± 1.8a 4.69 ± 0.06a 631.8 ± 68.0a 53 ± 6a Means followed by different letters represent significant differences based on Tukey-Kramers' LSM (p < 0.05). Table 3.
Means and standard errors of growth parameters affected by different shade levels, substrates, and fertigation systems.
-
Reg. shade + coir Reg. Shade + mix Extra shade + coir Extra shade + mix CC 5.37 5.43 9.84 10.41 R2 0.992 0.990 0.986 0.981 Table 4.
Correction coefficients (CC) and their R2 values for each evapotranspiration model obtained using regression method.
-
Substrate Height (cm) Diameter (mm) Coir 4.7 ± 0.9a 0.74 ± 0.05a Mix 1.3 ± 1.1b 0.22 ± 0.06b Means followed by different letters represent significant differences based on t-test (p < 0.05). Table 5.
Means and standard errors of change in scion height and trunk diameter of plants subjected to drought in different substrates after 8 weeks.
-
Average daily
evapotranspiration
rate per plant (L)Potential daily water saving per plant (L) LF from this study LF 0.2 LF 0.5 LF 0.8 Reg. shade 0.20 0.11 0.05 0.20 0.80 Extra shade 0.14 0.14 0.04 0.14 0.56 Table 6.
Potential daily water saving per plant by recirculating nutrient solution based on target leaching factor (LF).
Figures
(2)
Tables
(6)