


-
Citriculture is one of the most important fruit production industries in the United States, contributing about USD
${\$} $ Screenhouses have had broad applications in warm climates where there is no need for heating at any time of the year and where the ambient climate is suitable for various types of crop production. Nonetheless, the screenhouses mandated by the regulation must have, at the very least, a semipermeable screening, with mesh approximately being 0.3 mm2[4]. The specified screen is a much tighter mesh than screens that have customarily been used in protected cultivation in the U.S., resulting in structures with much reduced air exchange and elevated air temperature during the warm months[5]. Heat stress is particularly important in container production as it is more prone to root damage; in contrast to plants growing in the ground, the media temperature in containers could be over 15 °C higher than air temperature due to solar radiation on the sidewalls of the containers[6]. Moreover, plants adapt to high temperature by enhancing evaporative leaf cooling which further increases transpiration rate[7]. Young trees grown in containers with limited capacity for water may well run out of water at the time when there is a greatest need for heat dissipation within such containers. As a result, a previous study conducted inside a protective screenhouse reported that container-grown citrus trees developed less canopy surface area and leaf area index than in-ground trees[8].
Citrus is known to grow reasonably well despite heat stress[9], but the condition is not ideal for rapid growth needed by nursery growers. Nevertheless, an intensive management practice for citrus orchard, known as Open Hydroponic System (OHS), was able to increase plant vigor and improve water uptake by implanting intensive fertigation, limited root zone, and maintaining high soil moisture in field production under unfavorable conditions[10,11]. In soilless culture, pasteurized substrate materials are used as an alternative to field soil to create completely controllable conditions for the roots[12]. Soilless culture substrates and mixes have high hydraulic conductivity along with high water and fertilizer holding capacities, while providing high levels of dissolved oxygen for root metabolism[12]. Growers in Florida mostly use either a custom blend of peat moss, pearlite, and vermiculite, a commercial mix, or coconut coir as growing media for their citrus liner production[13]. Similar to OHS, frequent irrigation to saturation was also suggested to achieve optimal growth for citrus trees grown in containers[14]. However, the latest study indicated that regulated deficit irrigation could significantly save water while still maintaining decent growth[15].
While growing citrus inside a protective screenhouse was effective in excluding the HLB vector[16], the practice significantly increases the production cost of citrus nursery[17]. Optimization of growth and yield needs to be prioritized to offset the cost. This is especially true for container-grown trees as their performance inside a protective screenhouse was still less than ideal. Furthermore, the microclimate and intensive production inside a screenhouse also require a good irrigation strategy[18]. A previous study had successfully employed a recirculated ebb-and-flow subirrigation to grow citrus liners and was able to shorten the crop cycle from transplant to grafting to 30 d[19]. In this study, a recirculating drip irrigation method was evaluated using grafted trees. The performance of common substrates, such as commercial mix and coconut coir, were compared under this new setup. The study also explored the additional shade effect by incorporating solar panels on top of an existing protective structure. The effects of these operational strategies and conditions were evaluated against plant growth parameters to determine the optimal operating conditions suitable for the soilless citrus culture. Furthermore, evapotranspiration for this specific practice was modelled to develop guidelines for growers to determine potential water saving through recirculating irrigation system compared to the traditional irrigation systems.
-
Newly budded, Tango mandarin Citrus reticulata Blanco grafted on C-35 citrange X Citroncirus spp. rootstock were obtained from Four Winds Growers (Watsonville, CA, USA) on June 2nd, 2017. Plants were transplanted into a 122 mm × 122 mm × 305 mm deep air pruning pots (8PIFND, Proptek, Watsonville, CA, USA) on the following day. These plants were hand-watered for 3 weeks to allow for acclimation before being randomly assigned for the experiment. Fresh nutrient solution was made by mixing two commercial fertilizers: Mag-Iron Special 18-6-18 (Plant Marvel, Chicago Heights, IL, USA) and YaraLiva Calcinit 15.5-0-0 (Yara, Tampa, FL, USA). The resulting composition was as follows (mg L-1) : 254.4 total nitrogen (N), 57.5 phosphorus (P, as P2O5), 172.6 potassium (K, as K2O), 133.3 calcium (Ca), 26.6 magnesium (Mg), 22.5 sulfur (S), 0.95 boron (B), 0.19 copper (Cu), 1.9 iron (Fe), 0.48 manganese (Mn), 0.01 Molybdenum (Mo), and 0.48 zinc (Zn). This composition is similar to the optimum fertilizer for citrus nursery production in soilless culture[20]. During the experiment, plants were fertigated using drip systems hourly, 10 to 11 times during the daytime, at a flow rate of 1 gal/hr with each event lasting for 1 min. This was designed to ensure a constant water saturation level while avoiding excessive algae growth on the substrates.
Trials were conducted inside two screenhouses (7.6 m × 5.5 m × 2.3 m) in Davis, CA, USA, in Summer 2017. The temperature, relative humidity, and solar radiation levels varied throughout the trial, and no additional cooling feature was installed. The experiment was conducted from June 29th to October 5th, 2017, and divided into three phases, each lasting 4 weeks (June 29th to July 26th, July 26th to August 24th, and September 7th to October 5th). During the first phase, lateral branches were pruned to train a single trunk growth and shape the young trees in accordance with standard nursery practices.
Treatments and experimental design
-
The experiment was conducted using a split-split plot design. Levels of shading were assigned to main plots, levels of fertigation management to subplots within each main-plot, and levels of substrate to sub-subplots within each subplot (Table 1). The screenhouses used in this study were with different levels of shading. The extra shaded screenhouse had a series of tubular photovoltaic (PV) modules (Solyndra, Fremont, CA, USA) installed above the roof, while the regular screenhouse did not have this feature. Inside each screenhouse, there was a rack system with eight individual gutter channels equipped with a built-in fertigation and nutrient catchment systems. Each treatment combination was replicated at two different gutters in each rack (n = 2). Plants were arranged randomly in the rack using a checkered pattern resulting in a planting density of 29 plants per m2. A total of 112 plants were used in this study where 7 plants were placed in each gutter.
Table 1. Details of each treatment combination.
Treatment
coden Shade Substrate Fertigation
management1 2 Regular Coconut coir Flow-through 2 2 Regular Commercial mix Flow-through 3 2 Regular Coconut coir Recirculating 4 2 Regular Commercial mix Recirculating 5 2 Extra Coconut coir Flow-through 6 2 Extra Commercial mix Flow-through 7 2 Extra Coconut coir Recirculating 8 2 Extra Commercial mix Recirculating The two levels of shading resulted from the installed PV modules were compared. Light penetration in the regular shading screenhouse was measured to be ~80% of the outside condition, while the light penetration in the PV screenhouse (extra shade) was only ~30%; both measurements were conducted at a solar noon on a sunny day in July using JAZ Absolute Irradiance Spectroradiometer (Ocean Optics, Dunedin, FL, USA). Two common substrates used for commercial citrus nursery production in California, coconut coir (FibreDust LLC., Cromwell, CT, USA) and commercial mix (SMC1 HP canning mix, Berger, Watsonville, CA, USA), were used in this study; the latter was a mixed substrate containing coconut coir, unground redwood, and lava rock substrates. Lastly, the fertigation method was differentiated based on the fate of the nutrient solution. In the flow-through system, the leachate was not collected, and the main reservoir was refilled with fresh nutrient solution twice a week. In the recirculating system, the leachate was collected and redistributed until the beginning of a new phase when the recirculated solution was replaced by a fresh solution. Electrical conductivity (EC) and pH of the recirculated solution were recorded twice a week using handheld EC (Oakton EcoTestr EC High, Cole Palmer, Vernon Hills, IL, USA) and pH meters (Oakton EcoTestr pH1, Cole Palmer). Throughout the experiment, the EC was not regulated while few adjustments were made to keep the pH value between 5.5 to 6.5 (Supplemental Figs S1 & S2).
Plant responses
-
Initial measurements for scion length and trunk diameter were taken at the beginning of the experiment, and the measurements for leaf counts and leaf area were taken after the first pruning and training. The scion height was measured from the grafting point to the tallest point of the plant. The trunk diameter was measured at 2.5 cm above the grafting point. During the experiment, one plant from treatment combination 5 was discarded due to rodent damage.
Leaf area was estimated using a regression model, where leaf area was regressed against the length (L), width (W), the square of length (L2), the square of width (W2), and the product (L × W)[21]. The model was built prior to the experiment using 79 randomly sampled leaves taken from pruned plant materials. Length was measured from the lamina tip to the base point of petiole along the midvein, width was measured along the widest section of the leaf, and area was measured using an LI-3100 leaf area meter (Licor, USA). The regression procedure was conducted using SAS Studio (SAS, Cary, NC, USA). The resulted best fit line (R2 = 0.994) was used to estimate the leaf area during the experiment and shown below:
$\begin{split} A=\;&0.005811+0.22289\times {L}-0.1235\times {L}^{2}-0.53934\times {W}-\\&0.14357\times {W}^{2}+1.020576\times L\times W \end{split}$ (1) where A is the estimated individual leaf area (cm2), L is the measured leaf length (cm), and W is the measured leaf width (cm).
Trunk growth
-
Weekly measurements of trunk diameter from each treatment were used to build a linear regression model, where plant trunk diameter was plotted against time[22].
$ {D}_{t}=r\times t+c $ (2) where
$ {D}_{t} $ Evapotranspiration model
-
During the experiment, temperature and relative humidity inside each screenhouse were monitored using a CS215 with a radiation shield (Campbell Scientific, Logan, UT, USA), while solar radiation was measured in term of Photosynthetically Active Radiation (PAR) using LI190/R (LI-COR, Lincoln, NE, USA). All weather data were recorded using a CR3000 data logger (Campbell Scientific, Logan, UT, USA). The sensors were installed on a pole at 2 m above the ground. Due to incomplete weather data, reference evapotranspiration was approximated using a simplified version of standardized Penman model developed by Valiantzas[23,24] and modified by Subedi & Chávez[25]:
$\begin{split} {ET}_{o}\approx\; & 0.0393{R}_{s}\sqrt{{T}_{a}+9.5}-0.19{{R}_{s}}^{0.6}{\phi }^{0.15}+\\&0.048({T}_{a}+20)\left(1-\frac{RH}{100}\right){{u}_{in}}^{0.7} \end{split}$ (3) where
$ {ET}_{o} $ $ {R}_{s} $ $ {u}_{in} $ Since the wind speed inside the screenhouse was not directly measured, the value was estimated using an empirical relationship between the wind speed outside and inside of a screenhouse (anti-thrip, 50 mesh) as proposed by Kitta et al.[26]:
$ {u}_{in}=0.19{u}_{out} $ (4) where
$ {u}_{out} $ The measured solar radiation PAR needed to be converted from a photosynthetic photon flux density (PPFD) unit into an energy unit and expanded to full spectrum before being used in Eqn 3. The conversion value of 0.0189 MJ·m−2·d−1 per µmol·m−2·s−1 was used in this study[28]. The overall conversion equation is as follows:
$ {R}_{s}=0.0189 \times \frac{\left(100\right)}{{\text%}PAR}\times PPFD $ (5) where
$ {R}_{s} $ To calculate the actual evapotranspiration (
$ {ET}_{A}) $ ${ET}_{O}$ $ {ET}_{A} $ $ {ET}_{A}=CC\times TCSA\times {ET}_{o} $ (6) where CC is the correction coefficient (L cm−3), TCSA is the trunk cross-sectional area measured at 2.5 cm above the grafting point (cm2), and
$ {ET}_{o} $ $ {ET}_{A} $ $ {ET}_{0} $ $ {ET}_{A} $ $ {ET}_{A} $ $ {ET}_{A} $ $ {ET}_{A} $ $ {ET}_{A} $ $ {ET}_{A} $ Water saving analysis
-
Water and nutrient saving in the recirculating system was calculated based on the leaching fraction (LF):
$ LF=\frac{Wl}{Wt} $ (7) with an assumption that:
$ Wt=Wl+measured\;{ET}_{A} $ (8) where LF is the leaching fraction, Wl is the leachate volume (L), Wt is the total fertigation volume (L), and measured
$ {ET}_{A} $ Statistical analysis
-
Plants in the same gutter were treated as subsamples and were averaged before subsequent analyses. The two different gutters subjected to the same treatment combination were treated as true replicates (n = 2). All the measured growth responses (height, trunk diameter, leaf area, and leaf count) at the end of experiment were evaluated using mixed effect procedure (PROC MIXED) in SAS. The comparison between means obtained from each treatment unit was performed using least square means (LSM) method adjusted according to Tukey-Kramer's (p < 0.05). Lastly, the normality of the data was checked by performing Shapiro-Wilk test.
In addition, a short pump failure during the study impacted two rows of plants from treatment combination 1 and 2 and caused two plants to die and the rest to wilt. Replications affected by these external factors were excluded from the main data analysis. Nonetheless, the previously wilted plants from these two rows were analyzed separately to investigate the substrate performance under drought condition since the shade level and fertigation method were the same for both rows. In this case, each individual plant was treated as a true replica and the analysis was conducted using unbalanced ANOVA (PROC GLM) in SAS to account for the dead plants.
-
Citrus nursery trees are normally ready for sale after 12 months from budding when the trees reach a height of about 76 cm and a trunk diameter of 9.5 mm, although 8 mm is acceptable for mandarin trees[33,34]. In this study, the average increase in scion height and trunk diameter after 14 weeks was 19.0 cm and 1.21 mm, respectively (Table 2). Similar to the previous study[22], a simple linear equation was able to accurately (R2 values > 0.95) depict the growth of trees in this study under different treatments (Table 2).
Table 2. Trunk growth rate in the treatments and the projected trunk diameter on target selling date.
Treatment combination Linear equation R2 Projected trunk diameter (mm) 1 Dt = 0.134 × t + 3.126 0.97 9.6a 2 Dt = 0.095 × t + 3.300 0.96 7.9 3 Dt = 0.115 × t + 3.283 0.98 8.8a 4 Dt = 0.082 × t + 3.499 0.98 7.4 5 Dt = 0.106 × t + 3.323 0.97 8.4a 6 Dt = 0.089 × t + 3.276 0.97 7.6 7 Dt = 0.091 × t + 3.354 0.97 7.7 8 Dt = 0.086 × t + 3.195 0.97 7.3 a Trees with a salable trunk diameter. Effect of shading, substrate, and fertigation method
-
The average final scion height and trunk diameter of plants grown under extra shade treatment were 39.7 ± 1.8 cm and 4.64 ± 0.06 mm, respectively, while the height and trunk diameter of plants grown under regular shade treatment were 35.0 ± 2.2 cm and 4.84 ± 0.07 mm, respectively (Table 3). The results showed there was no significant difference between the treatments. Thus, extra shading did not significantly affect the trunk diameter or height (Table 3). On the other hand, substrates seem to affect the scion trunk diameter. The scion trunk diameter of plants grown in coconut coir (4.90 cm) was significantly bigger than of the ones in SMC mix substrate (4.58 cm) (p < 0.05) (Table 3). Lastly, none of the growth parameters tested in this study suggested any significant difference between recirculating and flow-through systems (Table 3).
Table 3. Means and standard errors of growth parameters affected by different shade levels, substrates, and fertigation systems.
Height
(cm)Diameter
(mm)Total leaf
area (cm2)Leaf
countShade Extra 39.7 ± 1.8a 4.64 ± 0.06a 678.0 ± 68.0a 48 ± 6a Regular 35.0 ± 2.2a 4.84 ± 0.07a 682.2 ± 83.2a 70 ± 7a Substrate Coir 38.6 ± 1.6a 4.90 ± 0.07a 764.8 ± 62.8a 62 ± 5a Mix 36.1 ± 1.6a 4.58 ± 0.07b 595.5 ± 62.8a 56 ± 5a Fertigation Flow-through 37.4 ± 2.2a 4.79 ± 0.07a 728.5 ± 83.2a 66 ± 7a Recirculating 37.3 ± 1.8a 4.69 ± 0.06a 631.8 ± 68.0a 53 ± 6a Means followed by different letters represent significant differences based on Tukey-Kramers' LSM (p < 0.05). Water usage in the recirculating system
-
The type of substrate did not affect the water usage, as shown inFig. 1. On the other hand, shade intensity seems to have more influence on the water usage. Plants under regular shading condition consumed an average of 0.20 L water per day, while plants under extra shading condition consumed only 0.14 L water per day. Furthermore, the average daily water usage decreased with time, which was coincident with the trend of the temperature recorded in Davis in 2017, where July and August were the warmest months of that year (Supplemental Table S1).
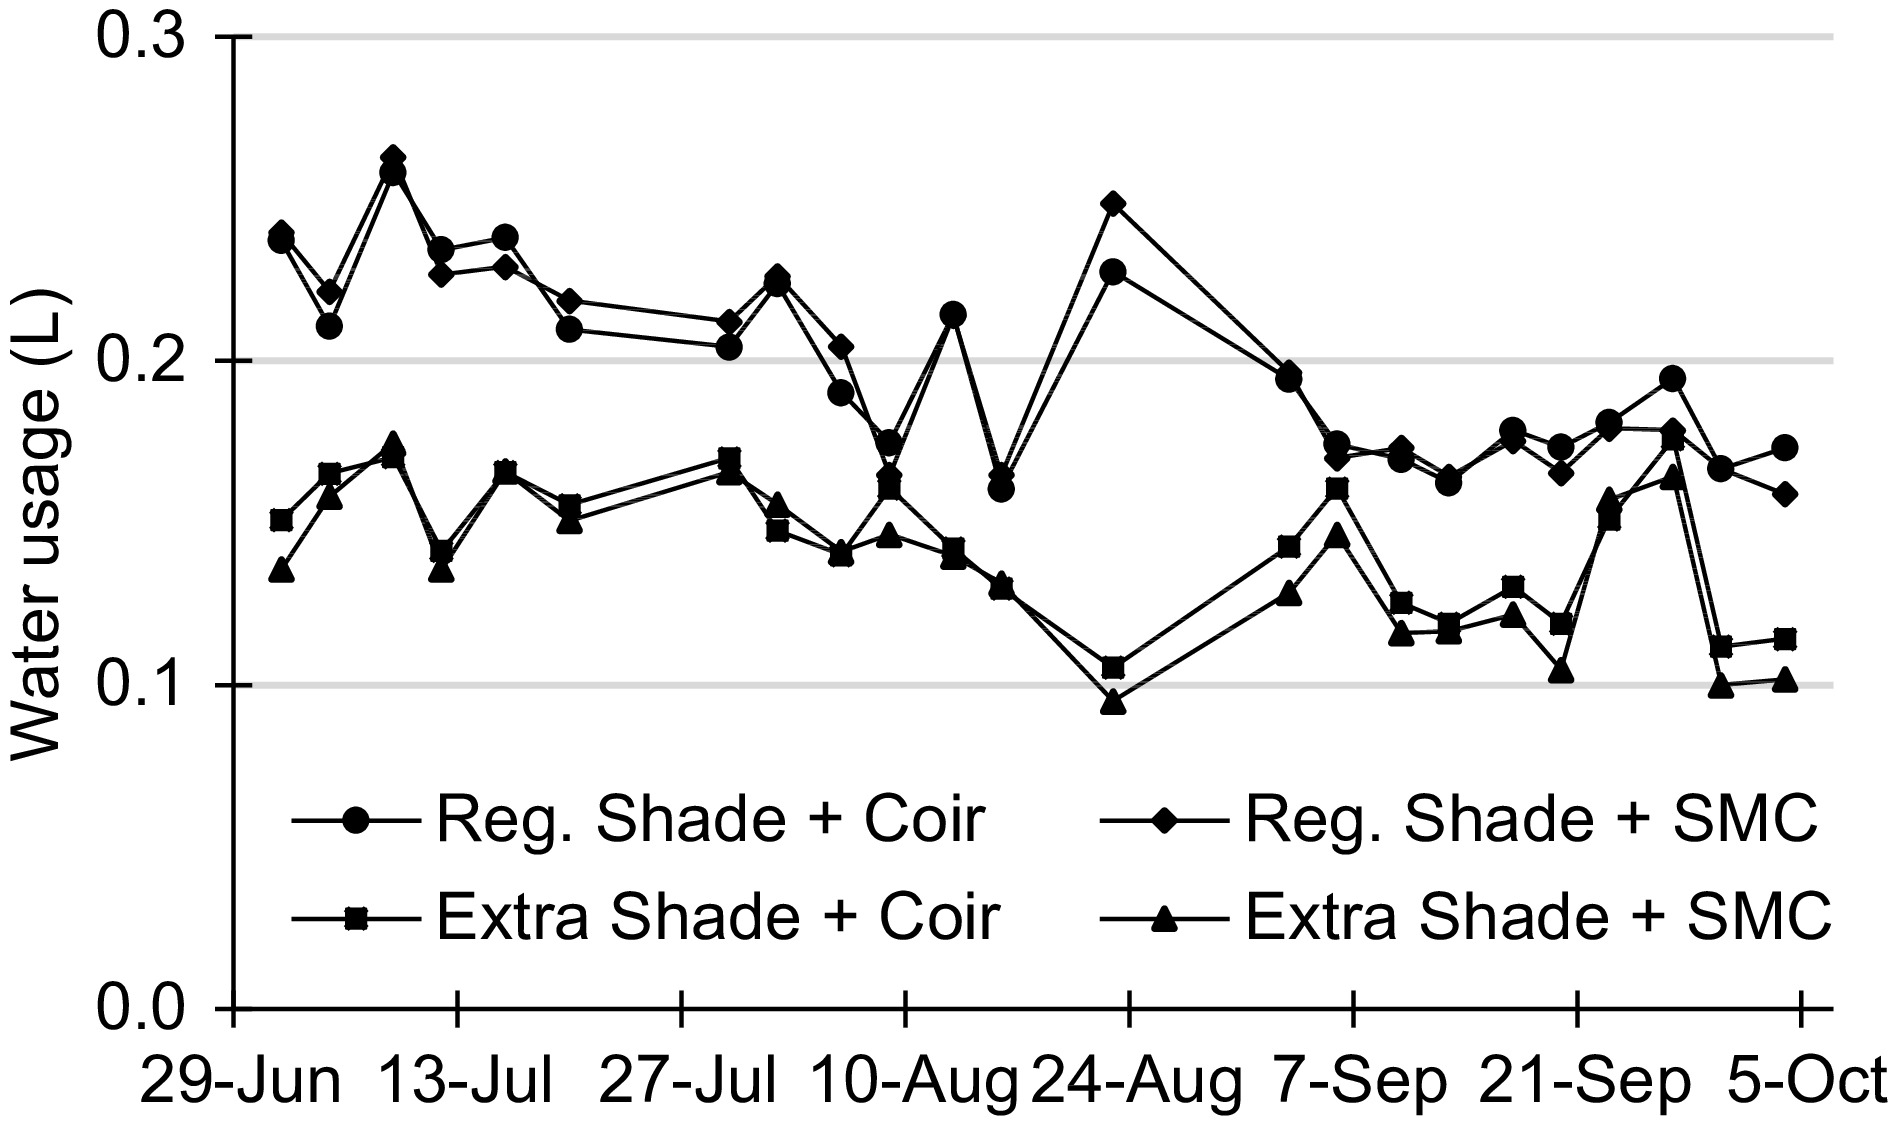
Figure 1.
Daily water usage per plant of Tango mandarin grafted on C35 throughout the experiment. The daily usage values were normalized by dividing the recorded volume by the number of days elapsed between each sampling (i.e. sampling frequency of either 3 or 4 days, twice a week).
Evapotranspiration model calibration and validation
-
The relationship between normalized
$ {ET}_{A} $ $ {measuredET}_{A}/ calculated{ET}_{0}) $ $ {ET}_{A} $ Table 4. Correction coefficients (CC) and their R2 values for each evapotranspiration model obtained using regression method.
Reg. shade + coir Reg. Shade + mix Extra shade + coir Extra shade + mix CC 5.37 5.43 9.84 10.41 R2 0.992 0.990 0.986 0.981 When measured
$ {ET}_{A} $ $ {ET}_{A} $ 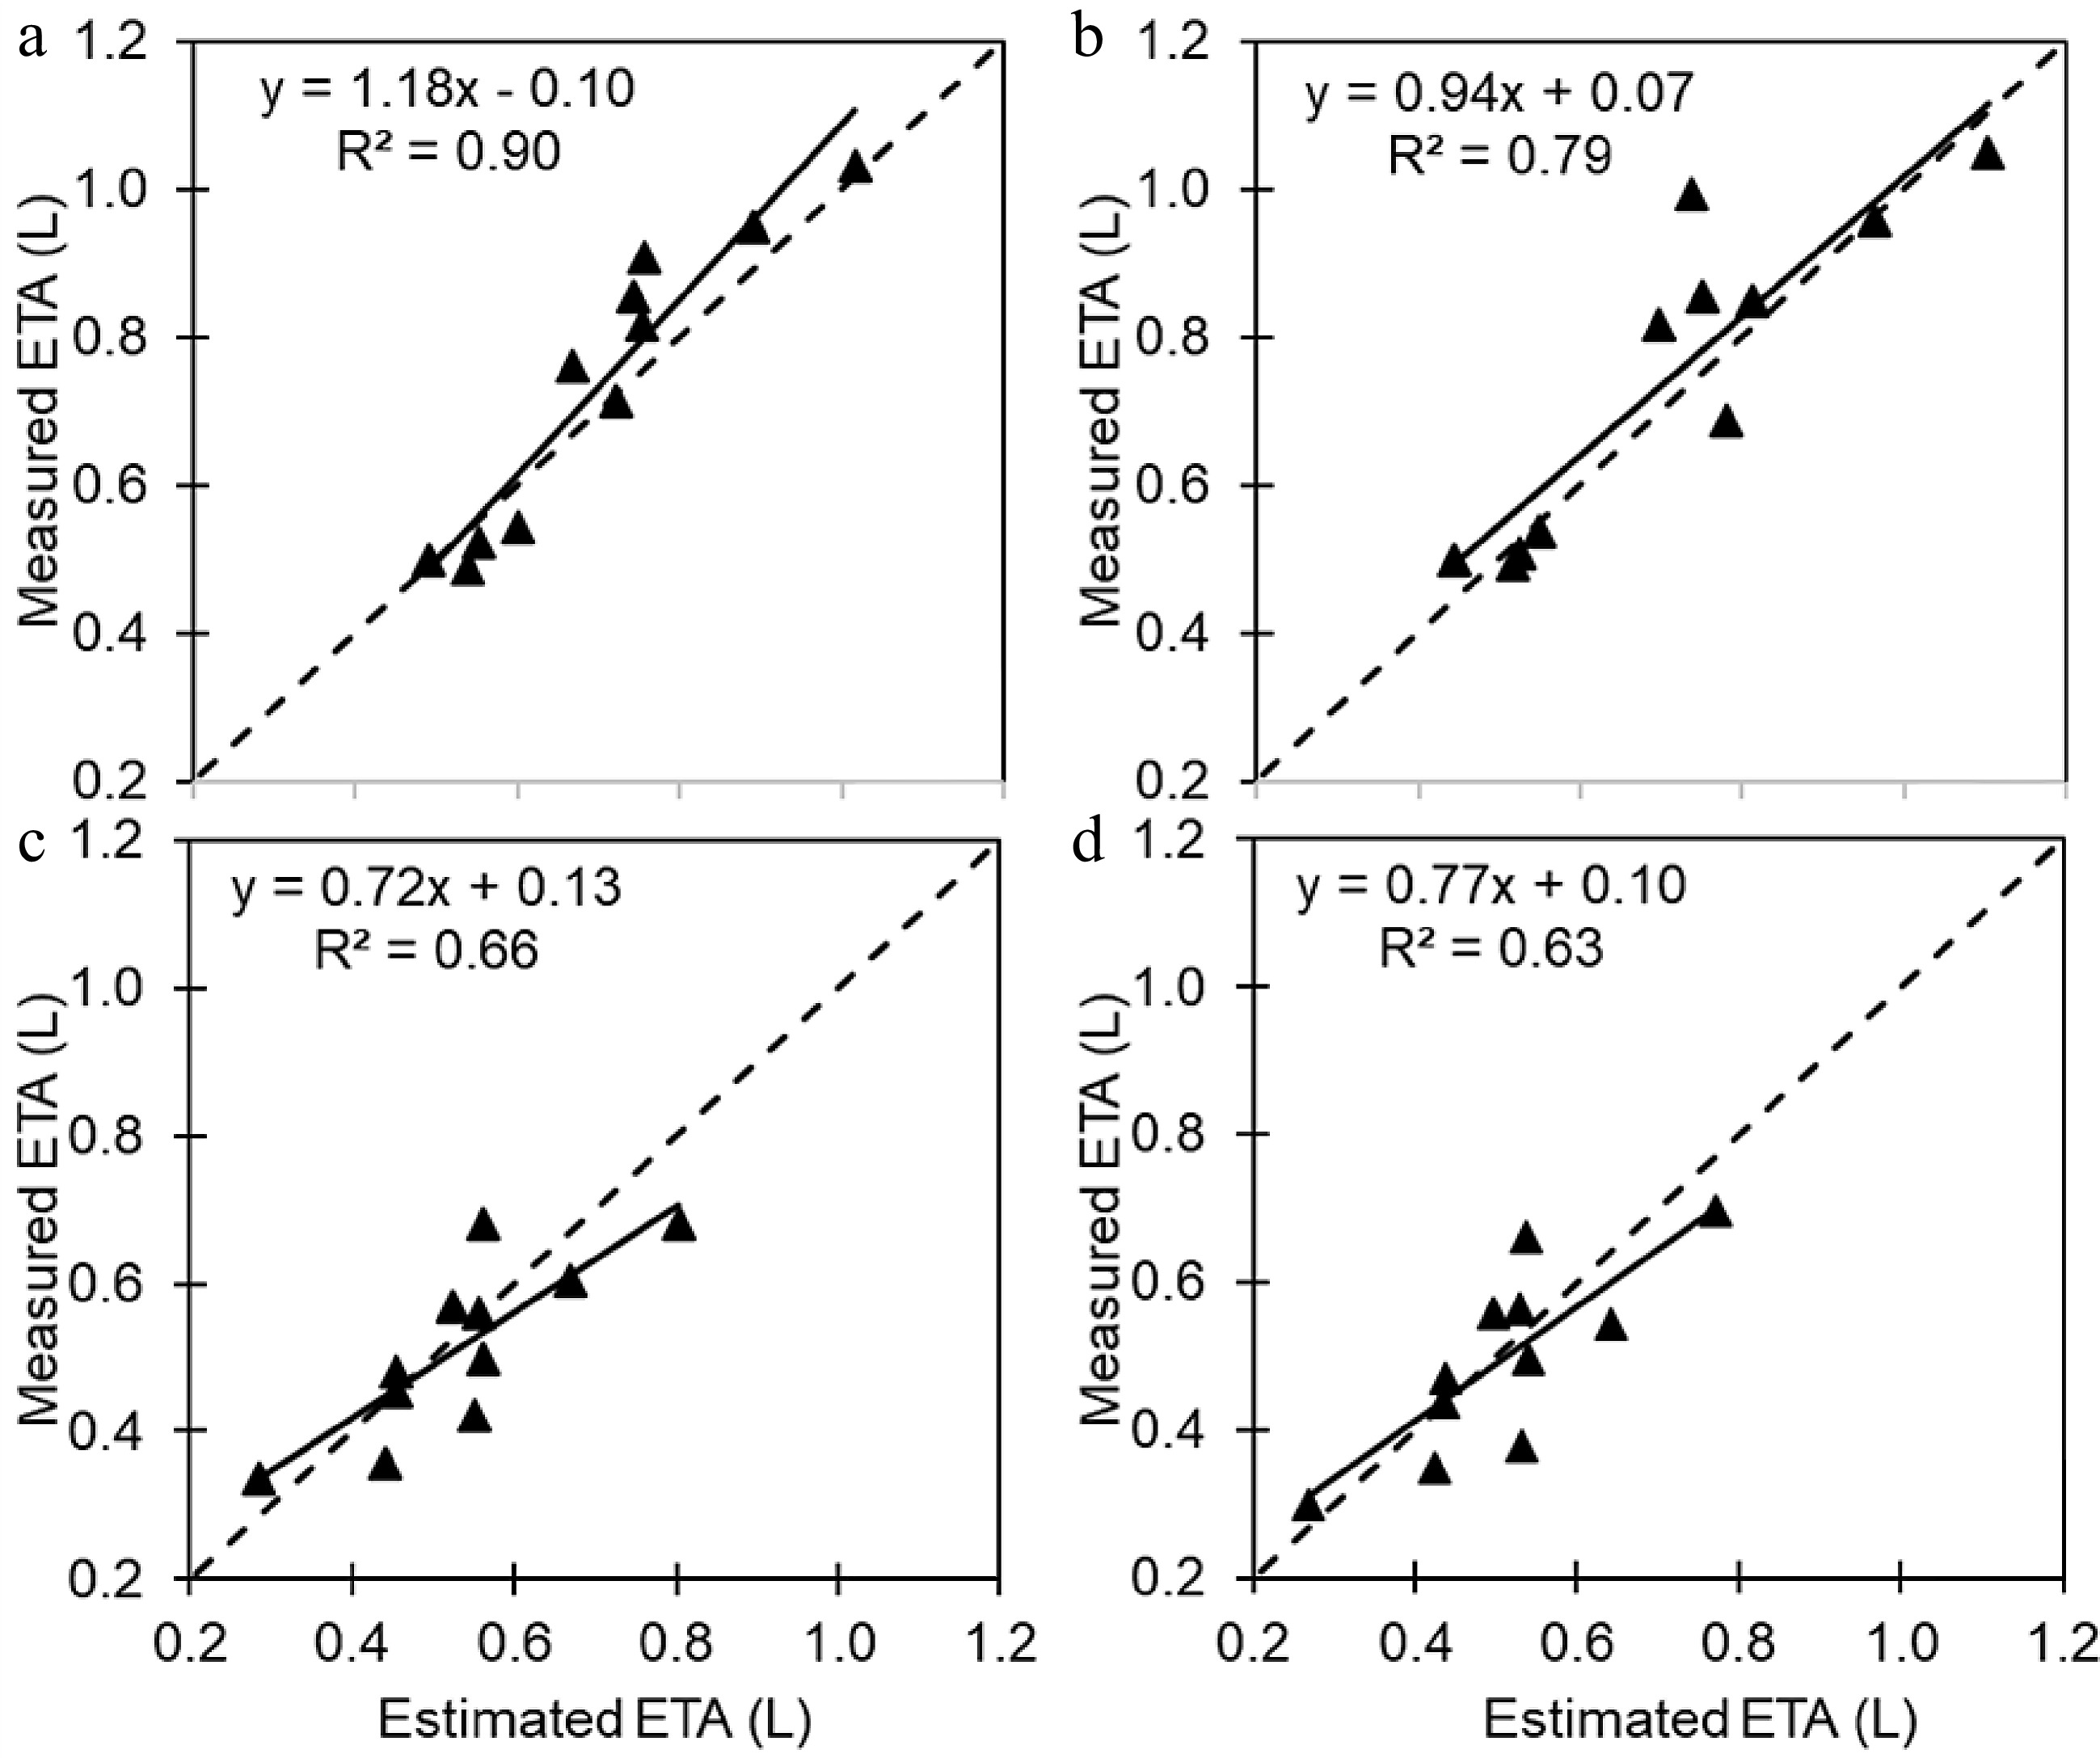
Figure 2.
Plots of measured daily actual evapotranspiration ($ {ET}_{A} $) versus estimated $ {ET}_{A} $in (a) regular shading and coir, (b) regular shading and mix, (c) extra shading and coir, and (d) extra shading and mix scenarios. The solid line represents the trendline, and the dashed line represents a 1:1 relationship.
-
Nursery growers typically are more concerned about reaching the salable trunk diameter as the trees normally reach the ideal height before the target selling date. The projected trunk diameter (Table 2) for some trees were slightly less than the target at 50 weeks after the beginning of the trials (about 12 months after budding). The high air temperature could be responsible for the reduced growth found in this study as heat stress in plants was known to cause disruption in photosynthetic membranes by deactivation of the Calvin cycle[35]. The recorded daytime temperature inside both screenhouses during this study often exceeded the ideal temperature range (15.5 to 31.5 °C) for citrus.
Effect of shading
-
The result from this study contradicted previous studies conducted under similar environmental conditions (temperature and solar radiation), which indicated shading could improve the growth of young citrus by reducing midday depression of stomatal conductance, hence increasing maximum CO2 assimilation rate[36,37]. However, the maximum light interception through shading in the previous studies were about 50% to 60%, which was lower than the value measured in this study (~70%). The additional light interception caused by the PV panels resulted in low PPFD in the extra shade treatment, where the average maximum PPFD was found to be 350−650 µmol·m−2·s−1. This value was lower than the ideal PPFD range (600−700 µmol·m−2·s−1) for the maximum CO2 assimilation rate in citrus[38]. Therefore, insufficient sunlight might be the limiting factor for plant growth and might explain the less obvious effect of shading here.
Nonetheless, extra shading might provide benefit in terms of lowering air temperature inside the screenhouse (up to 3 °C during the solar noon period). Avoiding excessive heat in leaves in hot and arid conditions was found to increase the total chlorophyll content in navel orange seedlings as a result of lesser chlorophyll degradation[39]. On the other hand, plants grown under the regular shade might be subjected to excessive radiation since the average PPFD measured in the regular screenhouse was over two times higher than the value in the screenhouse with PV panels. Excessive radiant energy could reduce leaf stomatal conductance resulting in limited plant growth[38].
Even though the effect was statistically not significant, extra shading might lower the total number of leaves per plant but not affect the overall total leaf area per plant (Table 3). This suggested that individual leaf from the plants grown under extra shading treatment was larger than the one from plants grown under regular shading treatment. This result was expected as shaded leaves often developed a greater surface area to improve light interception and maximize photosynthetic gain in light limiting condition[37,40]. Larger leaves, however, require much greater investment in supporting structures[41]. This biomass allocation could explain the general trade-off between leaf size and leaf number in trees as seen in this study and other studies[42,43].
Effect of substrates
-
The two substrates had different physical properties which affects how water was retained in the substrates. Coconut coir has a lower porosity and better water holding capacity than lava rocks and redwood bark used in the SMC mix[12]. In this study, nutrient was supplied continuously to the plants during the day so that substrates were most likely saturated with water for most of the day. Under the saturated conditions, having substrates with a higher porosity (like SMC mix) might be beneficial to ensure proper aeration in the rootzone. However, it was suspected that the porosity of the substrate could be insignificant in this study where air-pruning container was used to grow the plants; this container is specially designed to improve aeration in the rootzone. Therefore, coconut coir was preferable over the SMC mix due to its superior water holding capacity which allowed plants to absorb the nutrient more readily throughout the day.
Another advantage of coconut coir was observed during an unintentional drought event caused by the pump failure. During this event, the plants in SMC mix substrate suffered severe damage with two dying, while all plants growing in coconut coir survived. Moreover, the damage was qualitatively worse in SMC mix plants than in coconut coir plants. Based on the observation of all the surviving plants at 8 weeks following the incident, plants in coir had significantly greater (p < 0.05) height and trunk diameter growth (4.7 cm and 0.74 mm, respectively) than the ones in SMC mix substrate (1.3 cm and 0.22 mm, respectively) (Table 5).
Table 5. Means and standard errors of change in scion height and trunk diameter of plants subjected to drought in different substrates after 8 weeks.
Substrate Height (cm) Diameter (mm) Coir 4.7 ± 0.9a 0.74 ± 0.05a Mix 1.3 ± 1.1b 0.22 ± 0.06b Means followed by different letters represent significant differences based on t-test (p < 0.05). Effect of fertigation methods
-
Some growers were hesitant to adopt a recirculating system due to the perceived risk of phytopathogen contamination and toxic accumulation of organic compounds from root exudates and microbial metabolites[44]. However, no disease was visually found during the experiment. Although microbial composition in the substrate was not tested in this study, past studies mentioned that accumulation of plant-derived substrates in a recirculating system supported the growth of antagonistic fungi to Pythium spp. and Phytophthora[45,46].
Evapotranspiration model
-
The correction coefficient used in this study were similar to the more universally used crop coefficient; both coefficients were used to translate the reference evapotranspiration rate to the actual evapotranspiration rate. Traditionally,
$ {ET}_{O} $ $ {ET}_{A} $ $ {ET}_{A} $ $ {ET}_{A} $ $ {ET}_{O} $ $ {ET}_{A} $ Model implementation
-
Growers could apply the proposed model to design an efficient fertigation schedule. Implementing a recirculating system could further maximize the water and nutrient use efficiency. Since the leachate in the recirculating system was collected and reintroduced back to the system, water and nutrient saving in the recirculating system could be calculated based on the LF, which equals to the ratio of the leachate volume over the total fertigation volume (Eqn 7). LF varies largely as a function of several parameters, but under normal growing conditions, it ranges between 0.20 and 0.50. Although in some cases, such as at the beginning of the crop cycle or with low temperatures, this value could increase to 0.80[48]. Nonetheless, many best management practices (BMPs) recommend LF not to exceed 0.25 to ensure proper rewetting of the substrate while reducing water use[49]. In practice, however, many container nurseries often disregard the recommendation and maintain the LF at equal or above 0.50[50].
In the recirculating system experiment, LF was ranged from 0.34 to 0.41 for plants under regular shading treatment and from 0.47 to 0.54 for plants under extra shading treatment (Supplemental Fig S3). The applied LF values were higher than the BMP’s recommendation to avoid inadequate water problem during the most vigorous growth of plants. Under the conditions during this study, the recirculating system was able to save between 0.11 to 0.14 L of water daily per plant (Table 6). Using Eqn 6, 7, and 8, growers could estimate the amount of water and nutrient they could save by implementing a recirculating system. Table 6 described the amount of water that growers could save depending on their target LF.
Table 6. Potential daily water saving per plant by recirculating nutrient solution based on target leaching factor (LF).
Average daily
evapotranspiration
rate per plant (L)Potential daily water saving per plant (L) LF from this study LF 0.2 LF 0.5 LF 0.8 Reg. shade 0.20 0.11 0.05 0.20 0.80 Extra shade 0.14 0.14 0.04 0.14 0.56 Future scope of research
-
Since this study was conducted only for one season, a future study may be conducted in multiple seasons to validate the growth performance of this specific plant species. Future study should expand the levels of shading evaluated and include a data point at light saturation level since this study suggested that would be an optimal shade level for this system. The study could also include CO2 monitoring at leaf scale to detect the CO2 assimilation rate at different conditions. Lastly, the study could be compared with other cultural methods being tested in Florida for optimizing growth and yield of citrus grown inside a protective screenhouse[17].
-
The results suggested that high shading level might be beneficial in this system in terms of lowering heat radiation and evapotranspiration rate. However, the level of shading should be adjusted so that the light intensity inside the screenhouse was close to the light saturation point of the plants to optimize plant growth. Compared to commercial mix, coconut coir had superior physical properties. Better water holding capacity provided insurance for the plants in case of drought induced by mechanical failure. In contrary to the belief of some growers, this study showed that recirculating nutrient solution for up to one month didn't cause any adverse impact to the plant growth nor introducing any diseases. In addition, implementing recirculating systems could lower the production cost due to higher water and nutrient use efficiency. Lastly, the model developed in this study could be used to predict the amount of evapotranspiration inside a screenhouse. This evapotranspiration model could be incorporated into the irrigation management plan in the future to increase the water use efficiency.
This work was supported by the California Citrus Nursery Board and the University of California-Davis Jastro-Shield Research Award.
-
The authors declare that they have no conflict of interest. The funders had no role in the design of the study, in the collection, analyses, or interpretation of data, in the writing of the manuscript, or in the decision to publish the results.
- Supplemental Figure S1 Fluctuation of electrical conductivity (EC) in recirculating system. Discontinuity in the graph indicates missing data.
- Supplemental Figure S2 Fluctuation of pH in recirculation system. Discontinuity in the graph indicates missing data.
- Supplemental Figure S3 Leaching fraction (LF) of different treatments throughout the experiment.
- Supplemental Table S1 Recorded weather data and calculated reference evapotranspiration (ETo) inside the two screenhouses during experiment.
- Copyright: © 2023 by the author(s). Published by Maximum Academic Press, Fayetteville, GA. This article is an open access article distributed under Creative Commons Attribution License (CC BY 4.0), visit https://creativecommons.org/licenses/by/4.0/.
-
About this article
Cite this article
Putri FE, Lieth JH, Hung TC. 2023. Optimization of citrus nursery production in soilless culture under controlled environment. Technology in Horticulture 3:13 doi: 10.48130/TIH-2023-0013 

Optimization of citrus nursery production in soilless culture under controlled environment
- Received: 04 April 2023
- Accepted: 24 May 2023
- Published online: 03 July 2023
Abstract: Citrus nursery production in California must be conducted under a controlled environment, such as a screenhouse, due to citrus greening disease. Unfortunately, the limited air movement inside a screenhouse creates a non-ideal condition for the growth of crops. In this study, several operational strategies were evaluated to determine the optimal conditions for growing newly grafted Tango mandarin Citrus reticulata Blanco trees inside a screenhouse. Furthermore, an evapotranspiration model was developed to understand the water usage inside the screenhouse by the plants. The results suggested that higher shade intensity generated lower heat radiation and evapotranspiration rates. Nonetheless, the shading level should be adjusted close to the light saturation point of the plants to maximize its benefit for plant growth. Coconut coir was found to be a better substrate compared to a commercial citrus mix due to its superior performance under drought conditions and ability to produce plants with bigger trunk diameters. Lastly, recirculating the water was encouraged for soilless systems since the practice was found to increase the water use efficiency and did not cause negative effects to the plants. These results, along with the model developed in this study, can be used to optimize future management practices in citrus nursery production.
-
Key words:
- Screenhouse /
- Evapotranspiration /
- Recirculating system