-
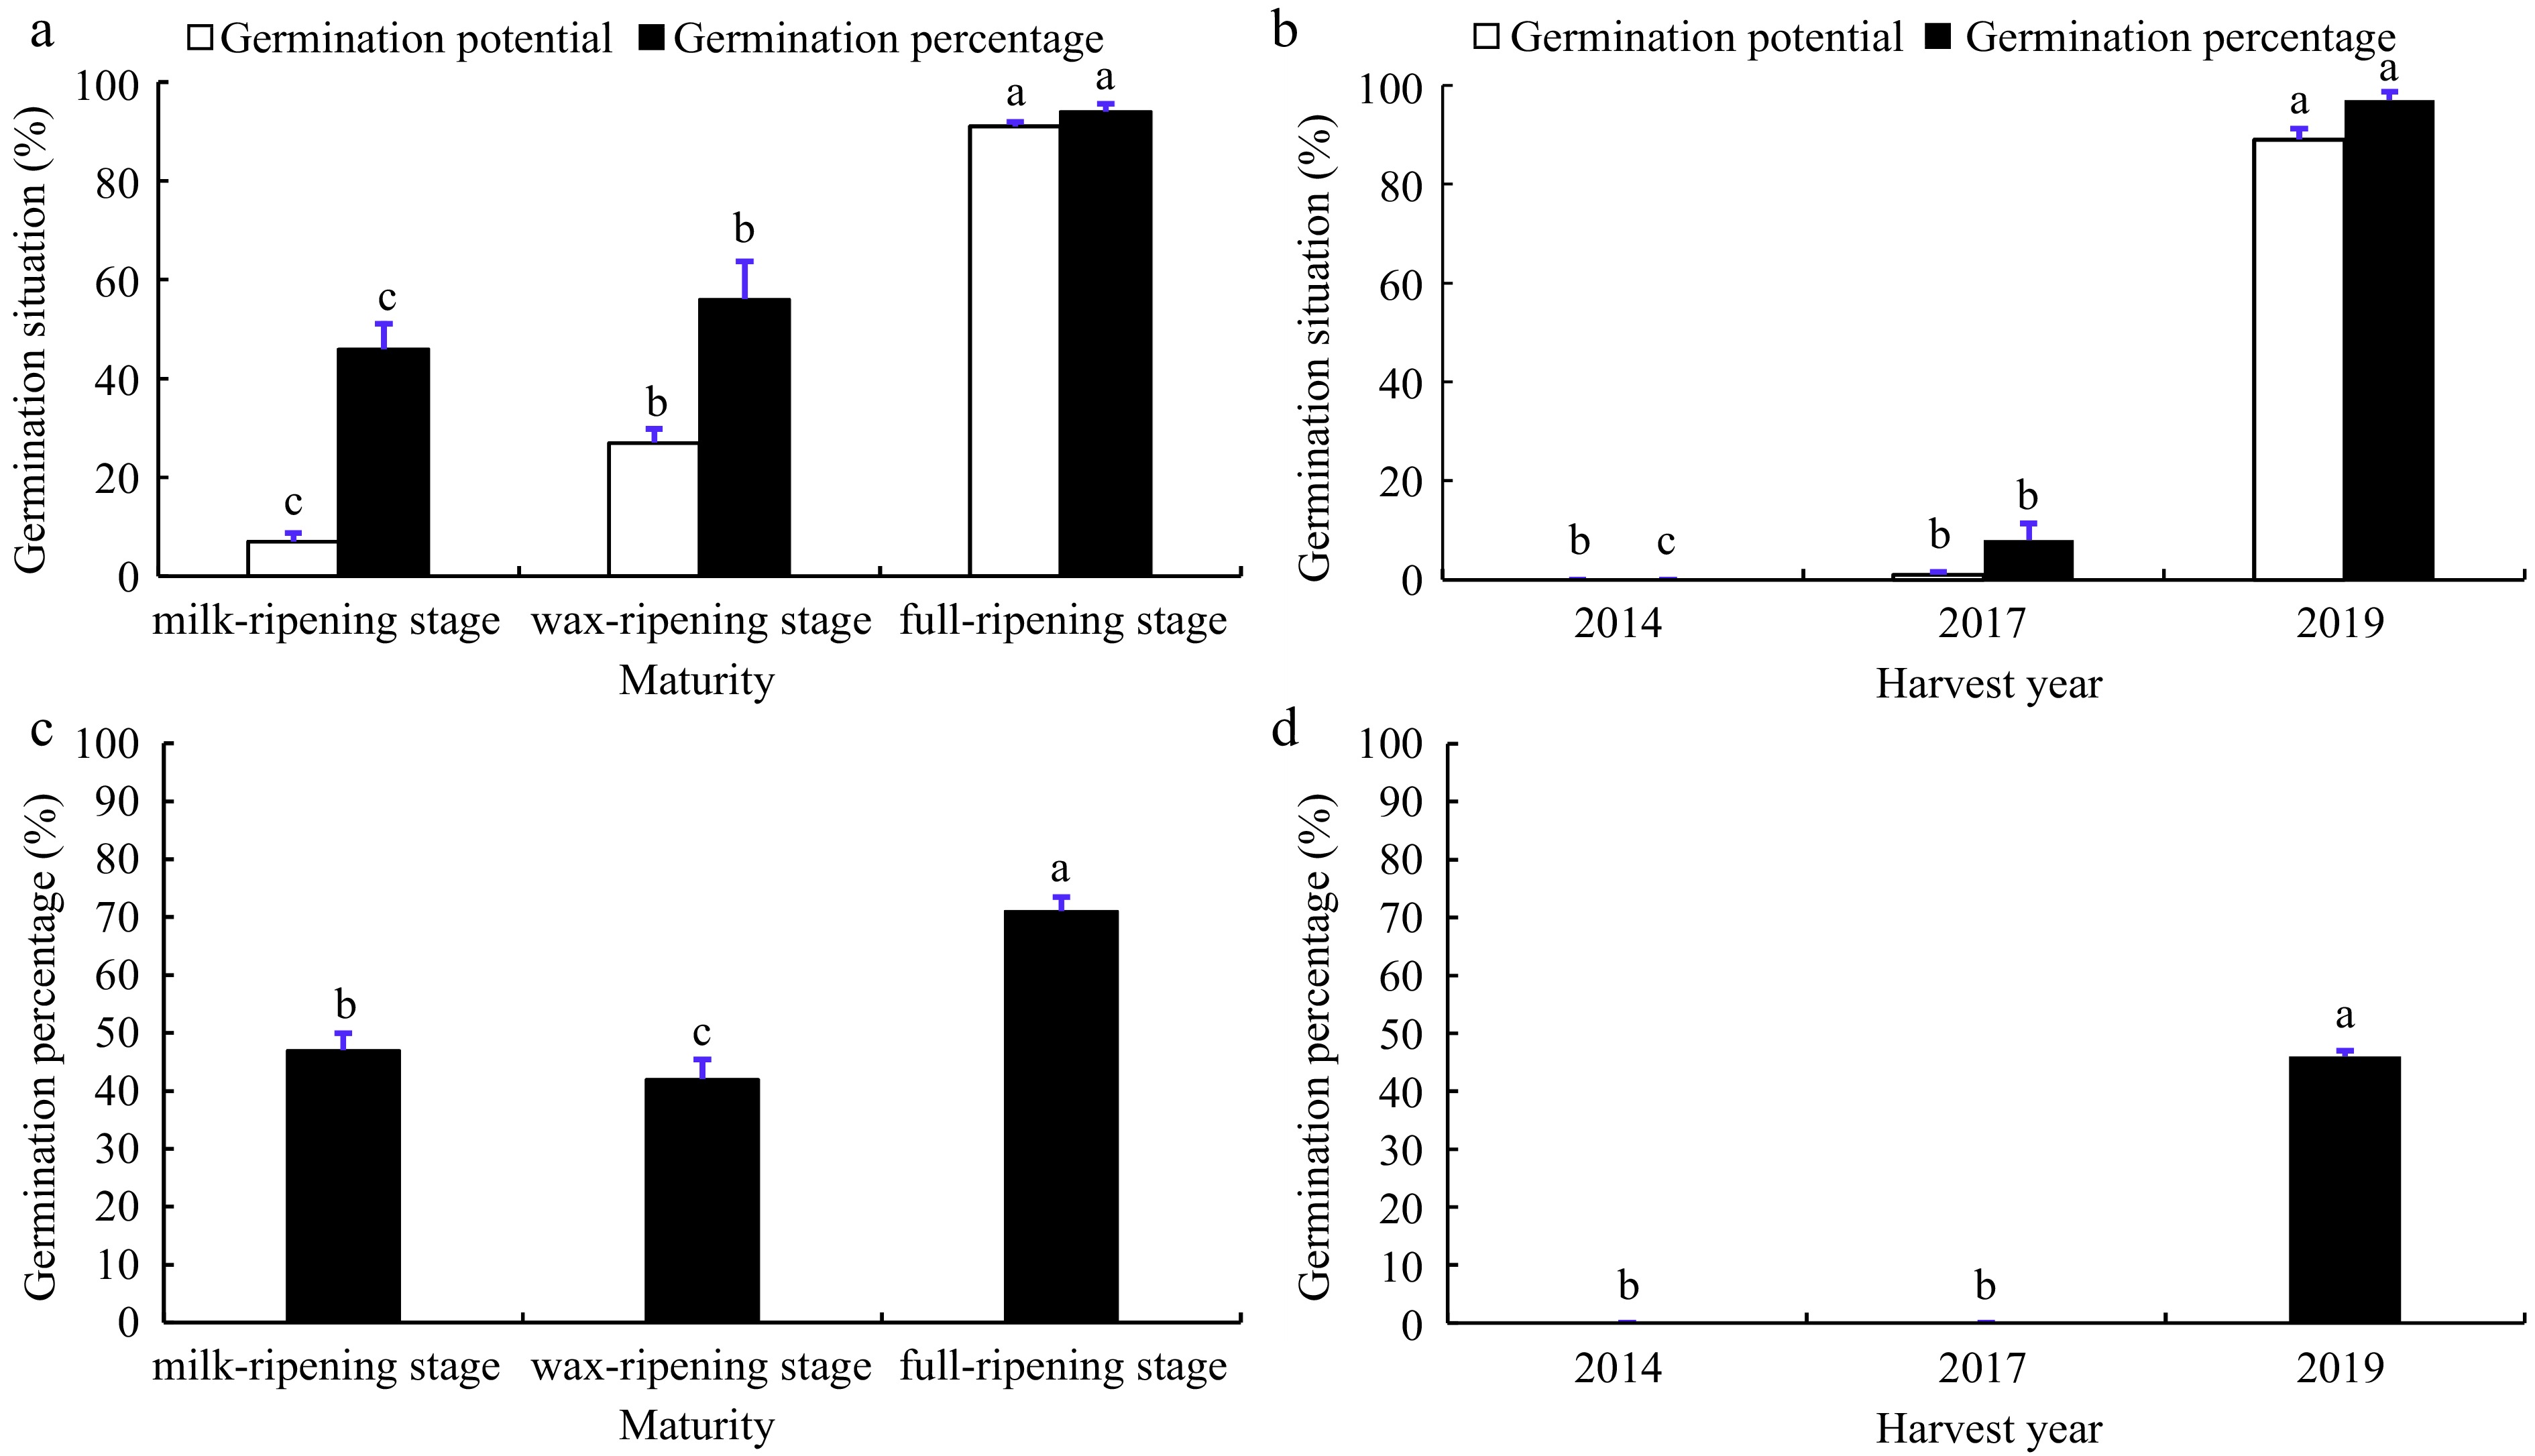
Figure 1.
Germination situation of smooth bromegrass seeds under different conditions. Data in (a) and (b) were the germination potential and germination percentage of smooth bromegrass seeds at different maturity levels and harvest years under standard germination test, respectively. Data in (c) and (d) were the germination percentage of smooth bromegrass seeds at different maturity levels and harvest years after artificial accelerated aging, respectively. Different lowercase letters represent significant difference between different treatments during the experimental period (p < 0.05). Bars represent the mean values of four replicates ± standard deviation (SD).
-
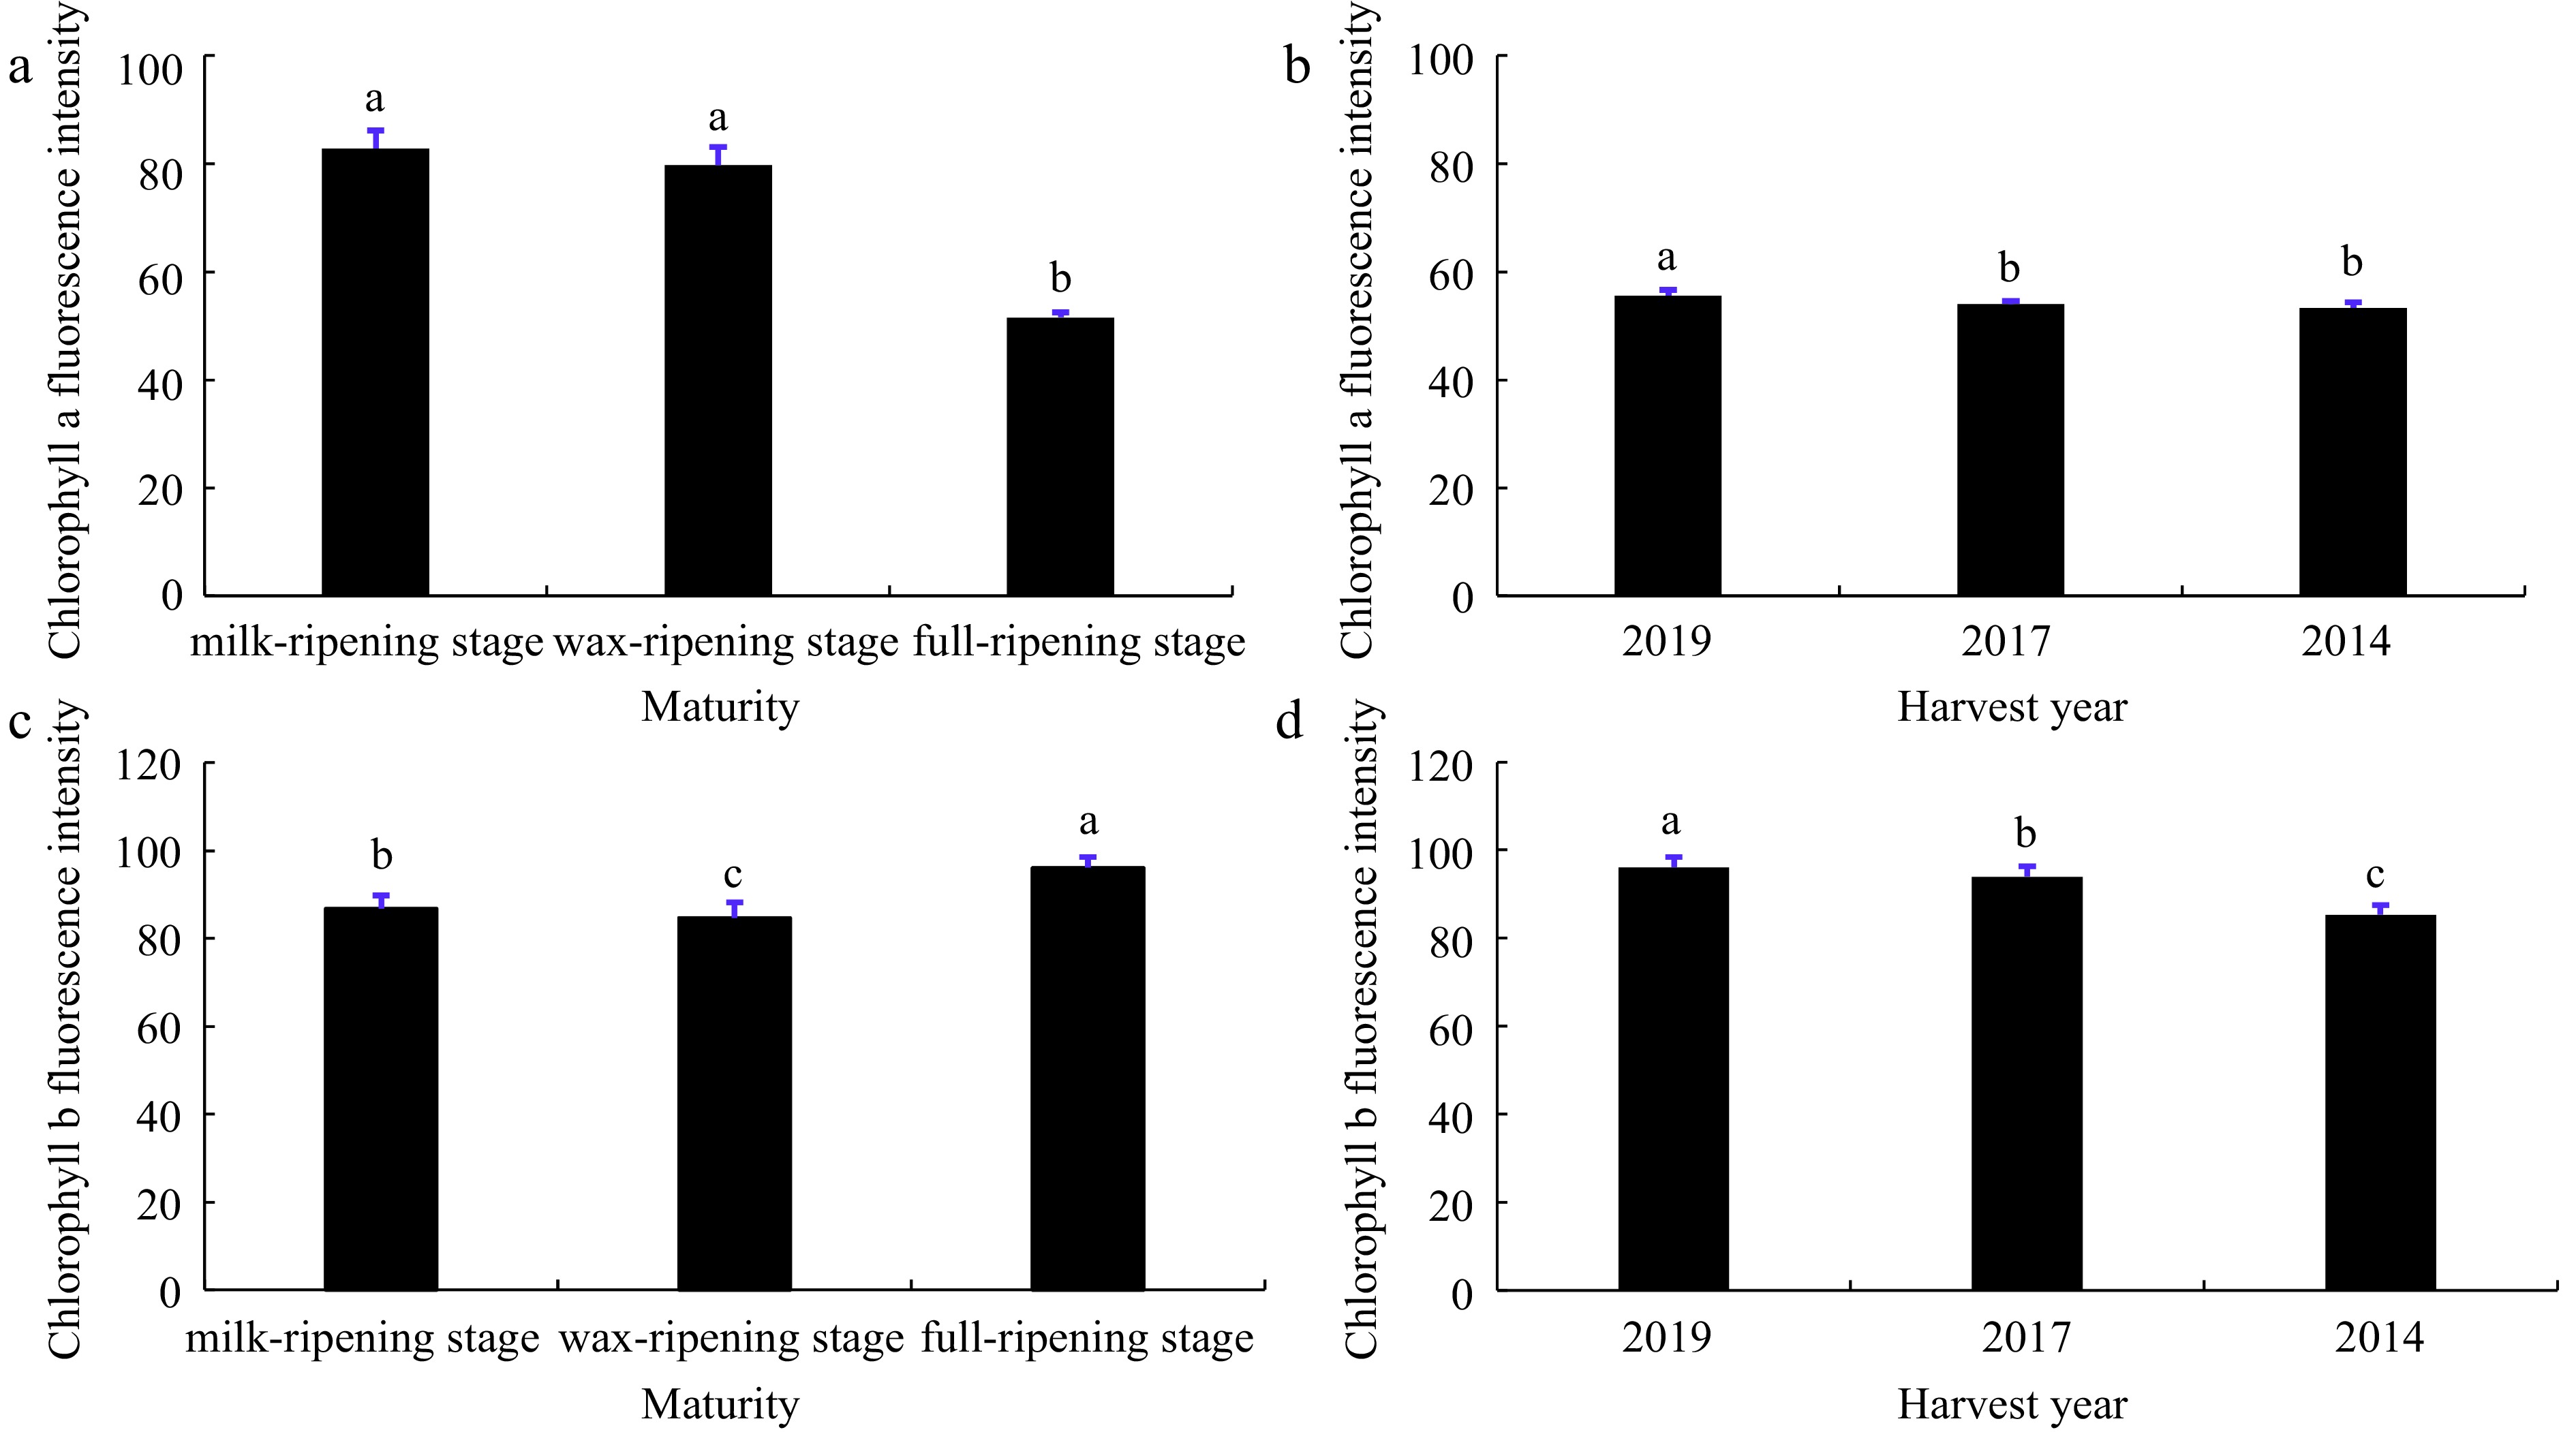
Figure 2.
Chlorophyll a and chlorophyll b fluorescence intensity of smooth bromegrass seeds at different maturity levels and harvest years. Data in (a) and (b) were chlorophyll a fluorescence intensity of seeds at different maturity levels and harvest years, respectively. Data in (c) and (d) were chlorophyll b fluorescence intensity of seeds at different maturity levels and harvest years, respectively. Different lowercase letters represent significant difference between different treatments during the experimental period (p < 0.05). Bars represent the mean values of four replicates ± SD.
-
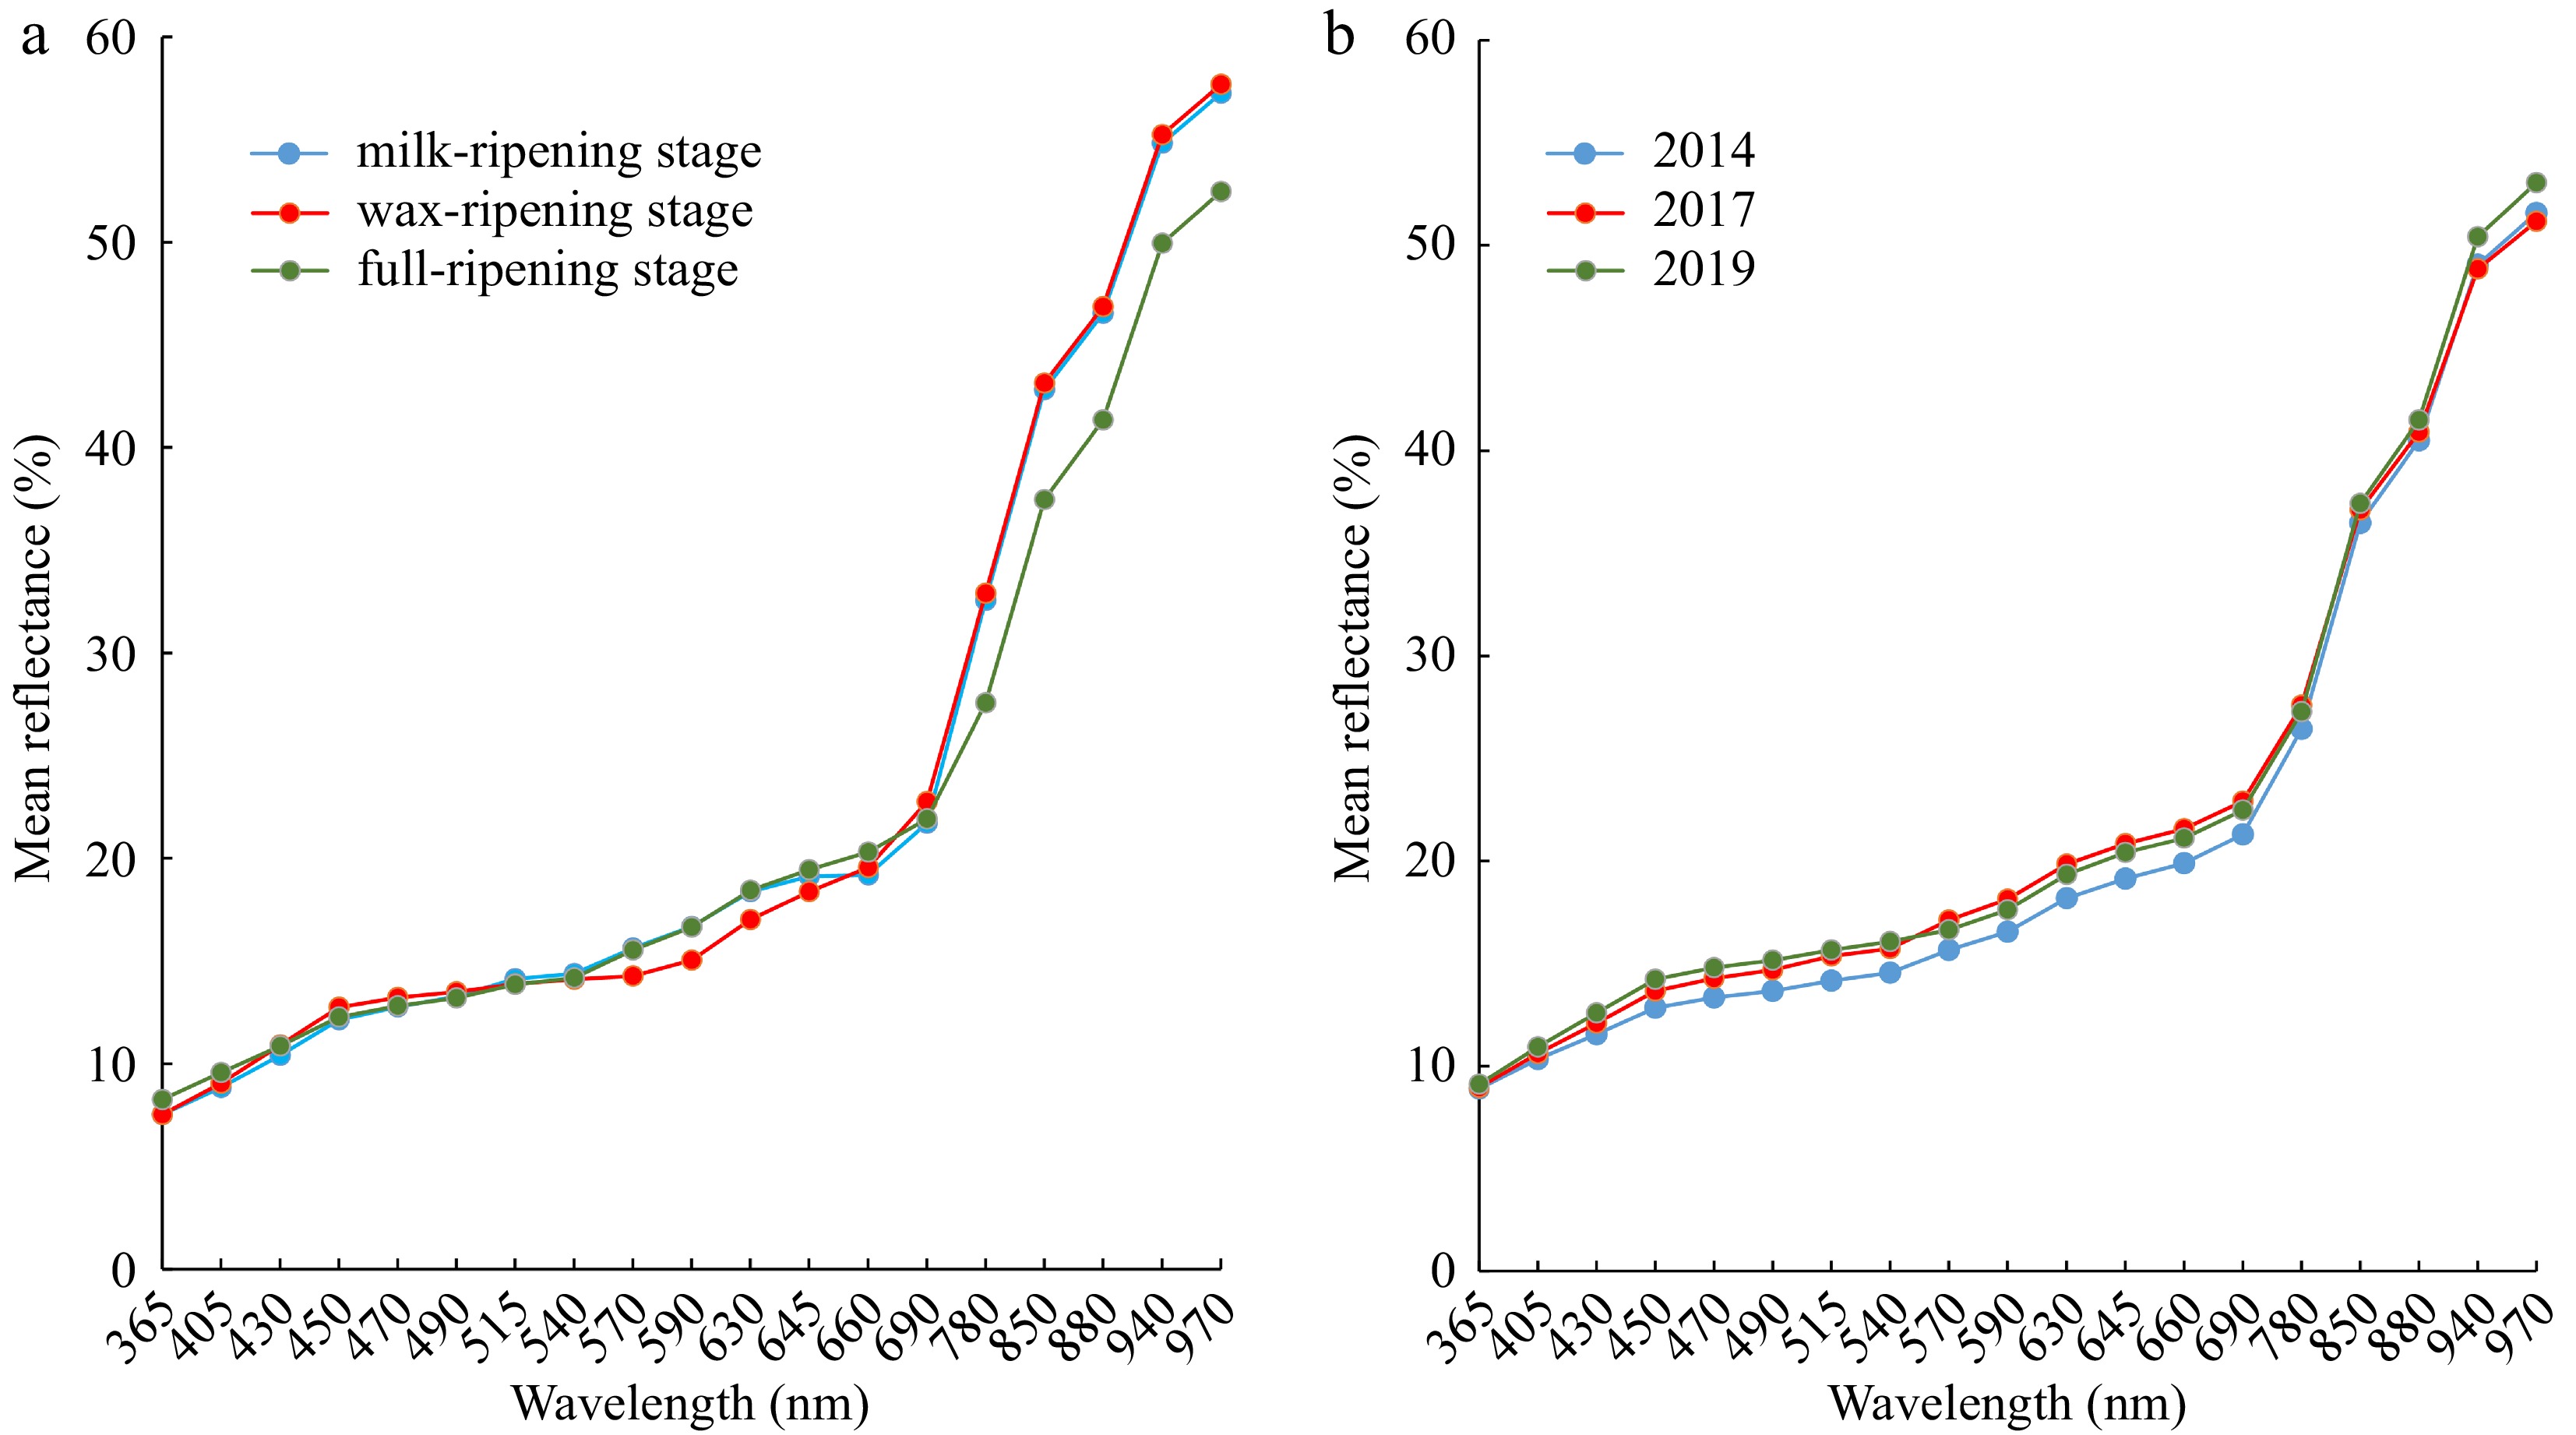
Figure 3.
Mean spectral reflectance of smooth bromegrass seeds at (a) different maturity levels and (b) harvest years.
-
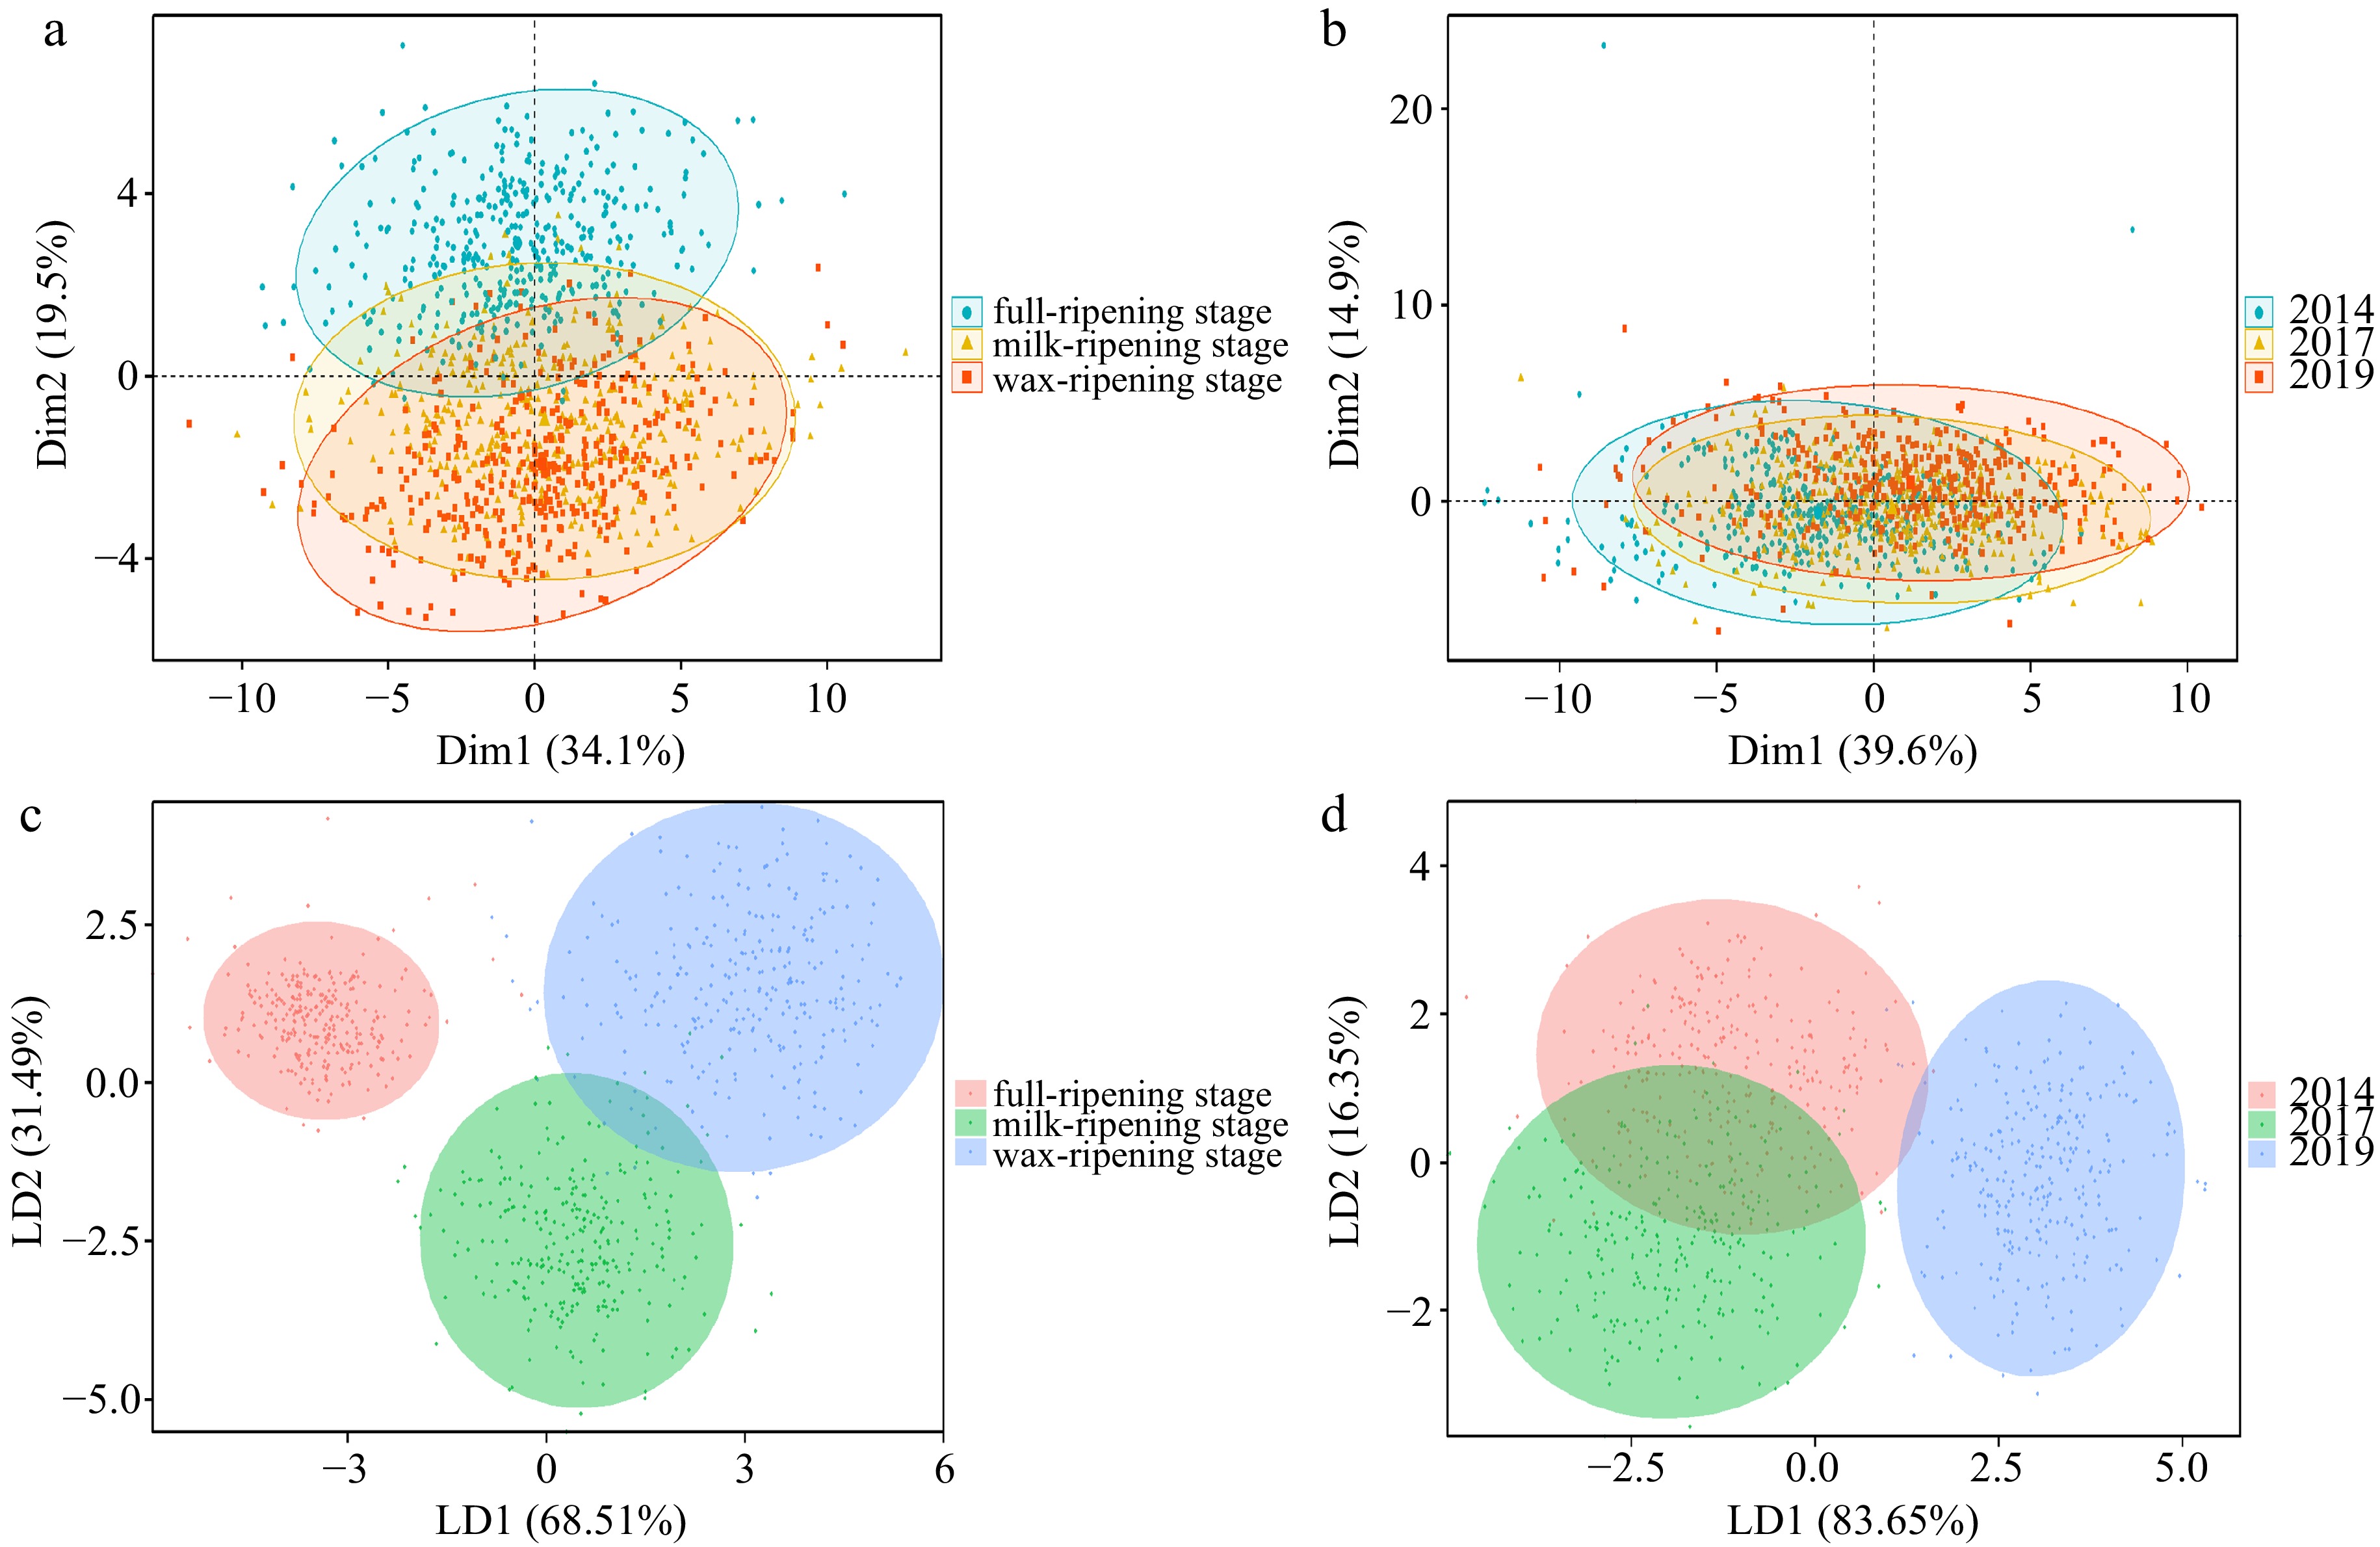
Figure 4.
Multivariate analysis based on multispectral data of smooth bromegrass seeds. Principal component analysis of smooth bromegrass seeds at (a) different maturity levels and (b) harvest years. LDA model diagram of smooth bromegrass seeds at (c) different maturity levels and (d) harvest years.
-
Characteristic Different maturity Different harvest years Milk-ripening stage Wax-ripening stage Full-ripening stage 2019 2017 2014 Area (mm2) 12.61 ± 2.095c 12.89 ± 1.777b 13.45 ± 1.668a 15.87 ± 2.675b 17.74 ± 2.845a 16.14 ± 2.512b Length (mm) 9.87 ± 0.901a 9.65 ± 0.904b 9.89 ± 0.744a 12.55 ± 1.793b 13.44 ± 2.004a 12.58 ± 1.843b Width (mm) 1.81 ± 0.278c 1.90 ± 0.211b 2.02 ± 0.212a 2.19 ± 0.282b 2.31 ± 0.283a 2.16 ± 0.253b Length-width ratio 0.18 ± 0.029c 0.20 ± 0.024b 0.20 ± 0.022a 0.18 ± 0.029 0.17 ± 0.027 0.18 ± 0.039 Compactness Circle 0.18 ± 0.028c 0.19 ± 0.023b 0.20 ± 0.019a 0.17 ± 0.025a 0.17 ± 0.021b 0.18 ± 0.036a Compactness Ellipse 0.99 ± 0.008b 0.99 ± 0.006a 0.99 ± 0.008b 0.96 ± 0.029b 0.96 ± 0.025b 0.97 ± 0.022a BetaShape_a 1.73 ± 0.221c 1.79 ± 0.182b 1.92 ± 0.237a 3.30 ± 1.878 3.33 ± 2.059 3.07 ± 1.415 BetaShape_b 1.58 ± 0.199c 1.69 ± 0.174b 1.78 ± 0.208a 2.74 ± 1.169 2.75 ± 1.032 2.61 ± 0.847 Vertical Skewness −0.07 ± 0.051c −0.04 ± 0.034a −0.06 ± 0.046b −0.10 ± 0.088 −0.09 ± 0.076 −0.09 ± 0.07 CIELab L* 46.28 ± 2.959b 44.72 ± 3.395c 47.06 ± 2.306a 51.43 ± 2.578a 51.06 ± 2.442b 48.42 ± 2.047c CIELab A* 6.17 ± 1.402b 4.96 ± 1.443c 7.94 ± 0.787a 6.26 ± 0.73b 7.71 ± 0.847a 7.67 ± 0.823a CIELab B* 17.78 ± 1.682b 12.58 ± 3.04c 18.58 ± 1.32a 17.57 ± 1.658c 20.18 ± 1.56a 19.68 ± 1.879b Saturation 19.06 ± 1.844b 13.50 ± 3.132c 20.66 ± 1.392a 18.80 ± 1.738c 21.79 ± 1.674a 21.33 ± 1.932b Hue 1.23 ± 0.066a 1.17 ± 0.112b 1.17 ± 0.03b 1.23 ± 0.033a 1.21 ± 0.028b 1.19 ± 0.109c Note: Different lowercase letters in the same line indicate significant differences, while the same letters indicate no significant differences (p < 0.05). The number of repetitions for this experiment was n = 4 for each seed lot samples. Table 1.
Comparative analysis of morphological characteristics of smooth bromegrass seeds with different maturity levels and different harvest years.
-
Model Index Different maturity Different harvest year M vs W W vs F M vs F 2014 vs 2017 2017 vs 2019 2014 vs 2019 LDA Sensitivity (%) 96.6 99.2 99.2 91.6 98.3 96.6 Specificity (%) 91.7 99.2 100.0 88.4 100.0 98.3 Precision (%) 92.0 99.2 100.0 88.6 100.0 98.3 Accuracy (%) 94.2 99.2 99.6 90.0 99.2 97.5 SVM Sensitivity (%) 95.8 98.3 100.0 89.9 96.6 95.0 Specificity (%) 91.7 97.5 98.3 82.6 95.9 95.0 Precision (%) 91.9 97.5 98.3 83.6 95.8 95.0 Accuracy (%) 93.8 97.9 99.2 86.3 96.3 95.0 RF Sensitivity (%) 85.7 98.3 97.5 81.5 89.9 89.1 Specificity (%) 89.3 98.3 96.7 74.4 88.4 82.6 Precision (%) 88.7 98.3 96.7 75.8 88.4 83.5 Accuracy (%) 87.5 98.3 97.1 77.9 89.2 85.8 Note: M stands for milk-ripening stage, W stands for wax-ripening stage and F stands for full-ripening stage. Table 2.
Prediction of smooth bromegrass seeds with different maturity levels and harvested in different harvest years by LDA, SVM and RF models.
-
Sample Classification Actual number of CCS Correctly predicted number of CCS Actual number of RSS Correctly predicted number of RSS Accuracy of prediction (%) Maturity level D 301 247 899 877 93.7% F 7 5 1193 1165 97.5% A 109 70 1091 1095 97.1% N 783 769 417 324 91.1% A + N 892 811 308 218 85.8% Harvest year D 766 691 434 404 91.3% F 3 3 1197 1176 98.3% A 12 9 1188 1102 92.6% N 419 390 781 705 91.3% A + N 431 386 769 742 94.0% Note: CCS stands for Corresponding classification samples, RSS stands for Remaining sorted samples. N stands for normal seedlings, A stands for abnormal seedlings, F stands for fresh ungerminated seeds and D stands for dead seeds. Table 3.
Germination prediction of smooth bromegrass seeds with different maturity levels and harvest years based on nCDA.
-
Model Index Different maturity Different harvest years N A F D N A F D LDA Sensitivity (%) 79.9 0 0 12.4 88.4 0 0 96.5 Specificity (%) 40.5 99.7 99.7 94.5 96.5 99.2 99.2 87.1 Precision (%) 72.6 0 0 42.3 93.4 0 0 92.8 Accuracy (%) 66.7 91.7 98.9 74.2 93.6 98.3 98.3 93.1 SVM Sensitivity (%) 80.8 0 0 0 86.0 0 0 97.4 Specificity (%) 40.5 100.0 100.0 100.0 97.0 100.0 100.0 84.1 Precision (%) 72.8 NA NA NA 94.1 NA NA 91.4 Accuracy (%) 67.2 91.9 99.2 75.3 93.1 99.2 99.2 92.5 RF Sensitivity (%) 79.1 0 0 12.4 69.0 0 0 93.0 Specificity (%) 39.7 99.7 100.0 95.6 93.1 100.0 100.0 72.0 Precision (%) 72.1 0 NA 47.8 84.8 NA NA 85.1 Accuracy (%) 65.8 91.7 99.2 75.0 84.4 99.2 99.2 85.3 Note: N stands for normal seedlings, A stands for abnormal seedlings, F stands for fresh ungerminated seeds and D stands for dead seeds. Table 4.
Germination prediction of smooth bromegrass seeds with different maturity levels and harvested in different years by LDA, SVM and RF models.
Figures
(4)
Tables
(4)