


-
The seed industry is fundamental to ensure food security and basic to realize agricultural modernization[1]. Seed vigour is one of the important indicators to evaluate seed quality, which is a comprehensive evaluation of seed activity intensity and characteristics during germination and seedling emergence, including seed germination percentage, seedling emergence rate, seedling growth potential and uniformity, plant resistance and production potential.[2,3]. Seeds with high vigour have obvious growth advantages, fast emergence, strong stress resistance and high yield, while seeds with low vigour cannot emerge normally, or cannot grow normally after seedling emergence, with poor resistance, lack of seedlings and broken monopoly and have low yield[4]. Therefore, it is very important to evaluate seed vigour quickly and accurately and select seeds with high vigour for agricultural production.
In recent years, the research and development of rapid and non-destructive seed quality testing technology has gradually become a new trend in the field of seed quality testing. This is due to some drawbacks of the current conventional standard testing methods, such as destructive, and time-consuming testing procedures that are highly dependent on the professional technology and relevant experience of analysts[5]. Non- destructive methods of testing have evaluated the seed quality according to a range of characteristics such as morphology, internal structure, chlorophyll content and chemical composition. Specifically, there are mainly different methods based on chemical properties (e.g., electronic noses), electrical properties (e.g., dielectric properties), acoustic properties (e.g., acoustic signals) and optical properties. There were a number of studies on non-destructive and rapid testing of seed vigour by using RGB image technology, X-ray testing technology, near infrared spectroscopy testing technology (NIR), hyperspectral technology and multispectral technology based on optical properties, and have made some progress[6−10].
Red-Green-Blue (RGB) imaging technology have been applied to seed germination ability and vigour testing studies by capturing macroscopic phenotypic changes in seeds (e.g., size, shape, colour, surface texture, etc.)[6,11], but this method was difficult to distinguish genetically and phenotypically similar seeds[12]. X-ray detection technology uses ultra-high X-ray penetration to explore the correlation between the internal morphology of seeds and physiological potential, so as to label and sort inferior seeds[13]. Nevertheless, the interpretation of X-ray images is considered a subjective and tedious task by seed analysts[14]. The wavelength range of near-infrared spectroscopy (NIS) is 780−2526 nm, and the chemical components within the seed such as water, oil, fibre compounds and fatty acids have absorption peaks in this band[15]. However, NIR technique uses diffuse reflectance integrating sphere sampling. Its spot can only project to a limited area and the sensitivity is low, so the obtained spectral data cannot represent the whole seed sample[16]. Hyperspectral imaging technology is characterized by super multi-band, high spectral resolution and combination of atlas, showing a high classification accuracy in predicting rice seed vigour[9]. Its spectral range contains important bands for identifying phytochromes inside seeds[17]: chlorophyll a (430 nm, 662 nm and 680 nm) and chlorophyll b (448 nm and 642 nm)[18], but suffers from problems of overlapping spectral information and more redundant bands, which will affect the efficiency and accuracy of later modeling to a certain extent[19].
Multispectral Imaging (MSI) is an emerging non-destructive physical measurement technique that combines computer vision and spectroscopy, and can quickly and accurately determine surface characteristics such as surface color and texture of the target object as well as detecting the intrinsic chemical composition and uses spectral reflectance to show differences and variations[20]. It has the characteristics of simple operation, high sensitivity, fast data extraction and non-destructive to the target object. It has been used in non-destructive testing studies on the seed vigour of leguminous crops such as alfalfa (Medicago sativa), soybean (Glycine max) and cowpea (Vigna unguiculata)[10, 21−24]. In addition, there were many studies on the application of this technology in the seed health testing of Gramineae[25−28] but few reports on the testing of seed vigour in Gramineae.
Smooth bromegrass (Bromus inermis) is a perennial plant of Bromus genus of Gramineae. It is known as the 'king of forage grasses' because of its excellent characteristics of drought resistance, cold resistance, salt tolerance, high yield, good palatability and high nutritional value. Seed quality is the most important characteristic affecting seed value, and mainly reflected by seed vigour. Therefore, timely testing of the vigour of smooth bromegrass seed is important for its storage, transportation and preservation and utilization of germplasm resources. At present, there is no standard method for the determination of seed vigour of smooth bromegrass in the International Rules for Seed Testing[29], The Specification of Seed Testing for Forage and Turfgrass-Accelerated Aging for Vigour Test[30] is the only industry standard issued in China that includes seed vigour testing method for smooth bromegrass. Most domestic scholars have applied this method to the germination testing of smooth bromegrass seed[31,32], but there were some shortcomings such as long test period, tedious operation steps and damage to seeds. The objective of this study was to explore and evaluate the capability and feasibility of identifying and testing smooth bromegrass seed vigour at different maturity levels and different harvest years based on multispectral imaging technology, and to lay the foundation for exploring the application of multispectral imaging technology in the seed vigour standard testing and other important seed quality indicators.
-
'Yuanye' smooth bromegrass seeds from different harvest years (2014, 2017 and 2019) and different maturity stages (milk-ripening, wax-ripening and full-ripening) were used as experimental materials. This variety was introduced from Canada and the seeds were provided by Beijing Zhengdao Seed Company. In 2013, we set up a seed production field for 'Yuanye' smooth bromegrass at the Experimental Station of China Agricultural University, Chengde State Yuershan Pasture, Hebei Province, China (41°44' N, 140°16' E), at an altitude of 1460 m. The site belongs to the semi-arid continental monsoon climate zone, with an average annual temperature of 0.5 °C, summer temperature of 17.4 °C and annual precipitation of 366.93 mm. The seed production field area was 0.52 hm2, row spacing was 30 cm, the actual sowing volume was 38.5 kg·ha−1, sowing with compound fertilizer, seed mixing volume was 190 kg·ha−1, and compound fertilizer N-P2O5-K2O content was 15%. The smooth bromegrass seeds harvested in 2014, 2017 and 2019 were all sown in 2013 and stored in the Forage Seed Laboratory of China Agricultural University at 4°C. Smooth bromegrass seeds of different maturity levels were observed and sampled in the field in July 2021. Smooth bromegrass is a panicle mostly with six whorls, named from bottom to top (Supplemental Fig. S1). The 1st and 2nd whorls as the lower layer, the 3rd and 4th whorls as middle and the 5th and 6th whorls as the upper layer. It was observed that flowering of smooth bromegrass started from the middle layer and spread towards the upper and lower layers. Within each spikelet, seeds are numbered from the base upwards (Supplemental Fig. S2). Through field observation and comparing the length, width and dry weight of different seeds, we found that the 1st and 2nd seeds were at the same maturity level. Therefore, the sampling method of this experiment was determined to take the first and second seeds of a spikelet in the middle layer (3rd and 4th whorls i.e., where flowering began) of smooth bromegrass at milk-ripening, wax-ripening and full-ripening stages as experimental seed samples (Supplemental Fig. S3). At each maturity stage, 200 spikelets were taken from the field, a total of 400 seeds. The seeds of milk-ripening stage were collected on 23 July, 2021, wax-ripening stage were collected on 1 August, 2021, and full-ripening stage were collected on 11 August, 2021.
Multispectral imaging
-
The multispectral imaging instrument VideometerLab4 (Videometer A/S, Herlev, Denmark) was used to take the images of seed samples. Before photographing the seed samples, the instrument calibration and light setup were needed, which involved calibration of absolute reflectance with a light and dark reference object, and geometric alignment with a dotted plate. Excitation/emission combinations of 660/700 nm and 405/600 nm were then added to the default light settings to capture fluorescence images of chlorophyll a and b[33,34]. This was a completely independent analysis and the data obtained were not involved in the multivariate analysis. By placing the seed sample at the bottom of the instrument sphere, a high-resolution multispectral raw image of 2,056 × 2,056 pixels can be obtained within seconds. The obtained raw image included 19 different wavelengths (365−970 nm), and then operated on the raw image to distinguish seed samples from extraneous background. Afterwards, the object analysis tool (Blob tool) in the VideometerLab software was opened to obtain measurement indicators such as area, length-width ratio, color index, saturation, mean spectral reflectance and histogram of the pixel distribution for each seed.
Four hundred seeds were randomly taken from each seed lot, 50 seeds were put in a Petri dish each time and then placed in the multispectral instrument to extract and export morphological data and spectral data from each seed. The germination test was conducted according to the order in which the seeds were placed in the Petri dish, so that the results of each seed germination test should correspond to its multispectral information data. The experiment was conducted in September 2021.
Determination of germination characteristics of seeds
-
Germination tests were conducted on smooth bromegrass seeds harvested in different years and the seeds harvested in 2021 with different maturity levels.[30] Four hundred seeds randomly taken from each lot were used for germination tests after obtaining their multispectral information, which were conducted in October and November 2021. Smooth bromegrass seeds were placed in 11.5 cm x 11.5 cm Petri dishes padded with three layers of moist filter paper, and germinated in an incubator at 15/25 °C with alternating light and dark for 8 h and 16 h. The first count of normal seedlings on the 7th day and the last count was on the 14th day. The normal seedlings, abnormal seedlings, fresh seeds and dead seeds were recorded at the last count, and the germination potential and germination percentage were calculated according to the following formula:
Germination potential (%) = (number of normal seedlings at the first count / total number of seeds tested) × 100%;
Germination percentage (%) = (number of normal seedlings at the end of germination / total number of seeds tested) × 100%;
Artificial accelerated aging determination of seed vigour
-
The germination percentage of seeds after artificial accelerated aging was determined according to Specification of Seed Testing for Forage and Turfgrass- Accelerated Aging for Vigour Test.[30] Seeds were spread evenly in the aging box and put into aging incubator, with a distance of 2.5−3.0 cm between the aging box and the inner wall of the aging incubator (LH-150S,Zhejiang Topu Yunnong Technology Co., China) and two adjacent aging boxes. At least 400 seeds were placed in an ageing box and aged at 42 °C and 90% to 100% relative humidity for 48 h. The seeds were removed immediately after ageing and germination test was carried out within 1 h. The results of the seed vigour determination were expressed as the percentage of normal seedling number to total number of seeds tested at the end of germination.
Data analysis
-
The spectral information and morphological information of seeds collected by multispectral were used for several multivariate analyses as follows:
Principal component analysis (PCA), as an exploratory technique for multivariate data analysis, is used to obtain the overview of system variation in data. To analyze the average spectral and morphological characteristics data of smooth bromegrass seeds with different maturity levels and harvest years, we selected the first two principal components based on exploring the variation between morphologic data and spectral data of smooth bromegrass seeds with different maturity levels and harvest years.
Normalized canonical discriminant analysis (nCDA) is used as a transformation construction method and the calculations behind it are more like PCA, but more supervised. According to the spectral characteristics of seeds with different germination situations, we labeled them as different layers to generate a single band visual analysis image, which was used to read the data results.
Three supervised classification discriminant analysis methods, support vector machine (SVM), linear discriminant analysis (LDA) and random forest (RF), were used to model the classification of smooth bromegrass seeds at different maturity levels and different harvest years. For the hyperparameters of the SVM model, the kernel function was chosen to be linear, the penalty factor c was set to 0.5 and the other hyperparameters were set to their default values. For the hyperparameters of the RF model, ntree was 500, mtry was 3, and the other hyperparameters were default values.
The training process of the three classification models was as follows:19 spectral information and 14 morphological index data of three different maturity levels of milk-ripening, wax-ripening and full-ripening smooth bromegrass seeds and three different harvest years of 2014, 2017 and 2019 were used as classification characteristic information, respectively. The seeds were randomly divided into training and validation sets according to the ratio of 7:3. In other words, a total of 400 samples for each seed lot, 280 seeds were randomly selected as training samples and the remaining 120 seeds were used as validation samples to build SVM, LDA and RF recognition models for seeds of different maturity levels and different harvest years, respectively. Accuracy, Sensitivity, Specificity and Precision of the SVM, LDA and RF models were calculated using the confusion matrix obtained from the validation set, and these metrics were calculated as follows[35]:
Accuracy = (TX + TY) / (TX + TY + FX + FY) × 100%;
Sensitivity = TX / (TX + FY) × 100%;
Specificity = TY / (TY + FX) × 100%;
Precision = TX / (TX + FX) × 100%.
In the formula, X and Y represent two samples, TX represents the X sample with correct prediction, TY represents the Y sample with correct prediction; FX represents the Y sample that is predicted to be an X sample; FY means sample X that is predicted to be sample Y.
PCA, SVM, LDA and RF were implemented using the FactoMineR, e1071, MASS and random Forest packages in the R package, respectively. The nCDA analysis used the MSI-Transformation Builder function in VideometerLab Software V.3.22.0.
-
The results of the standard germination test showed that the seed germination potential and germination percentage increased significantly with the increase of maturity. The germination potential increased from 7% to 91%, and the germination percentage of seeds at milk-ripening stage was only 46%, at wax-ripening stage 56% and at full-ripening stage it could rise to 94% (Fig. 1a). On the other hand, the seed germination potential and germination percentage decreased significantly with increasing length of post-harvest storage. Seeds harvested in 2019 had a germination percentage of 97% and a germination potential of 89%. The germination percentage of seeds harvested in 2017 had dropped to 8% after storage for four years, with only 1% germination potential, while the current germination potential and germination percentage of seeds harvested in 2014 were 0% (Fig. 1b).
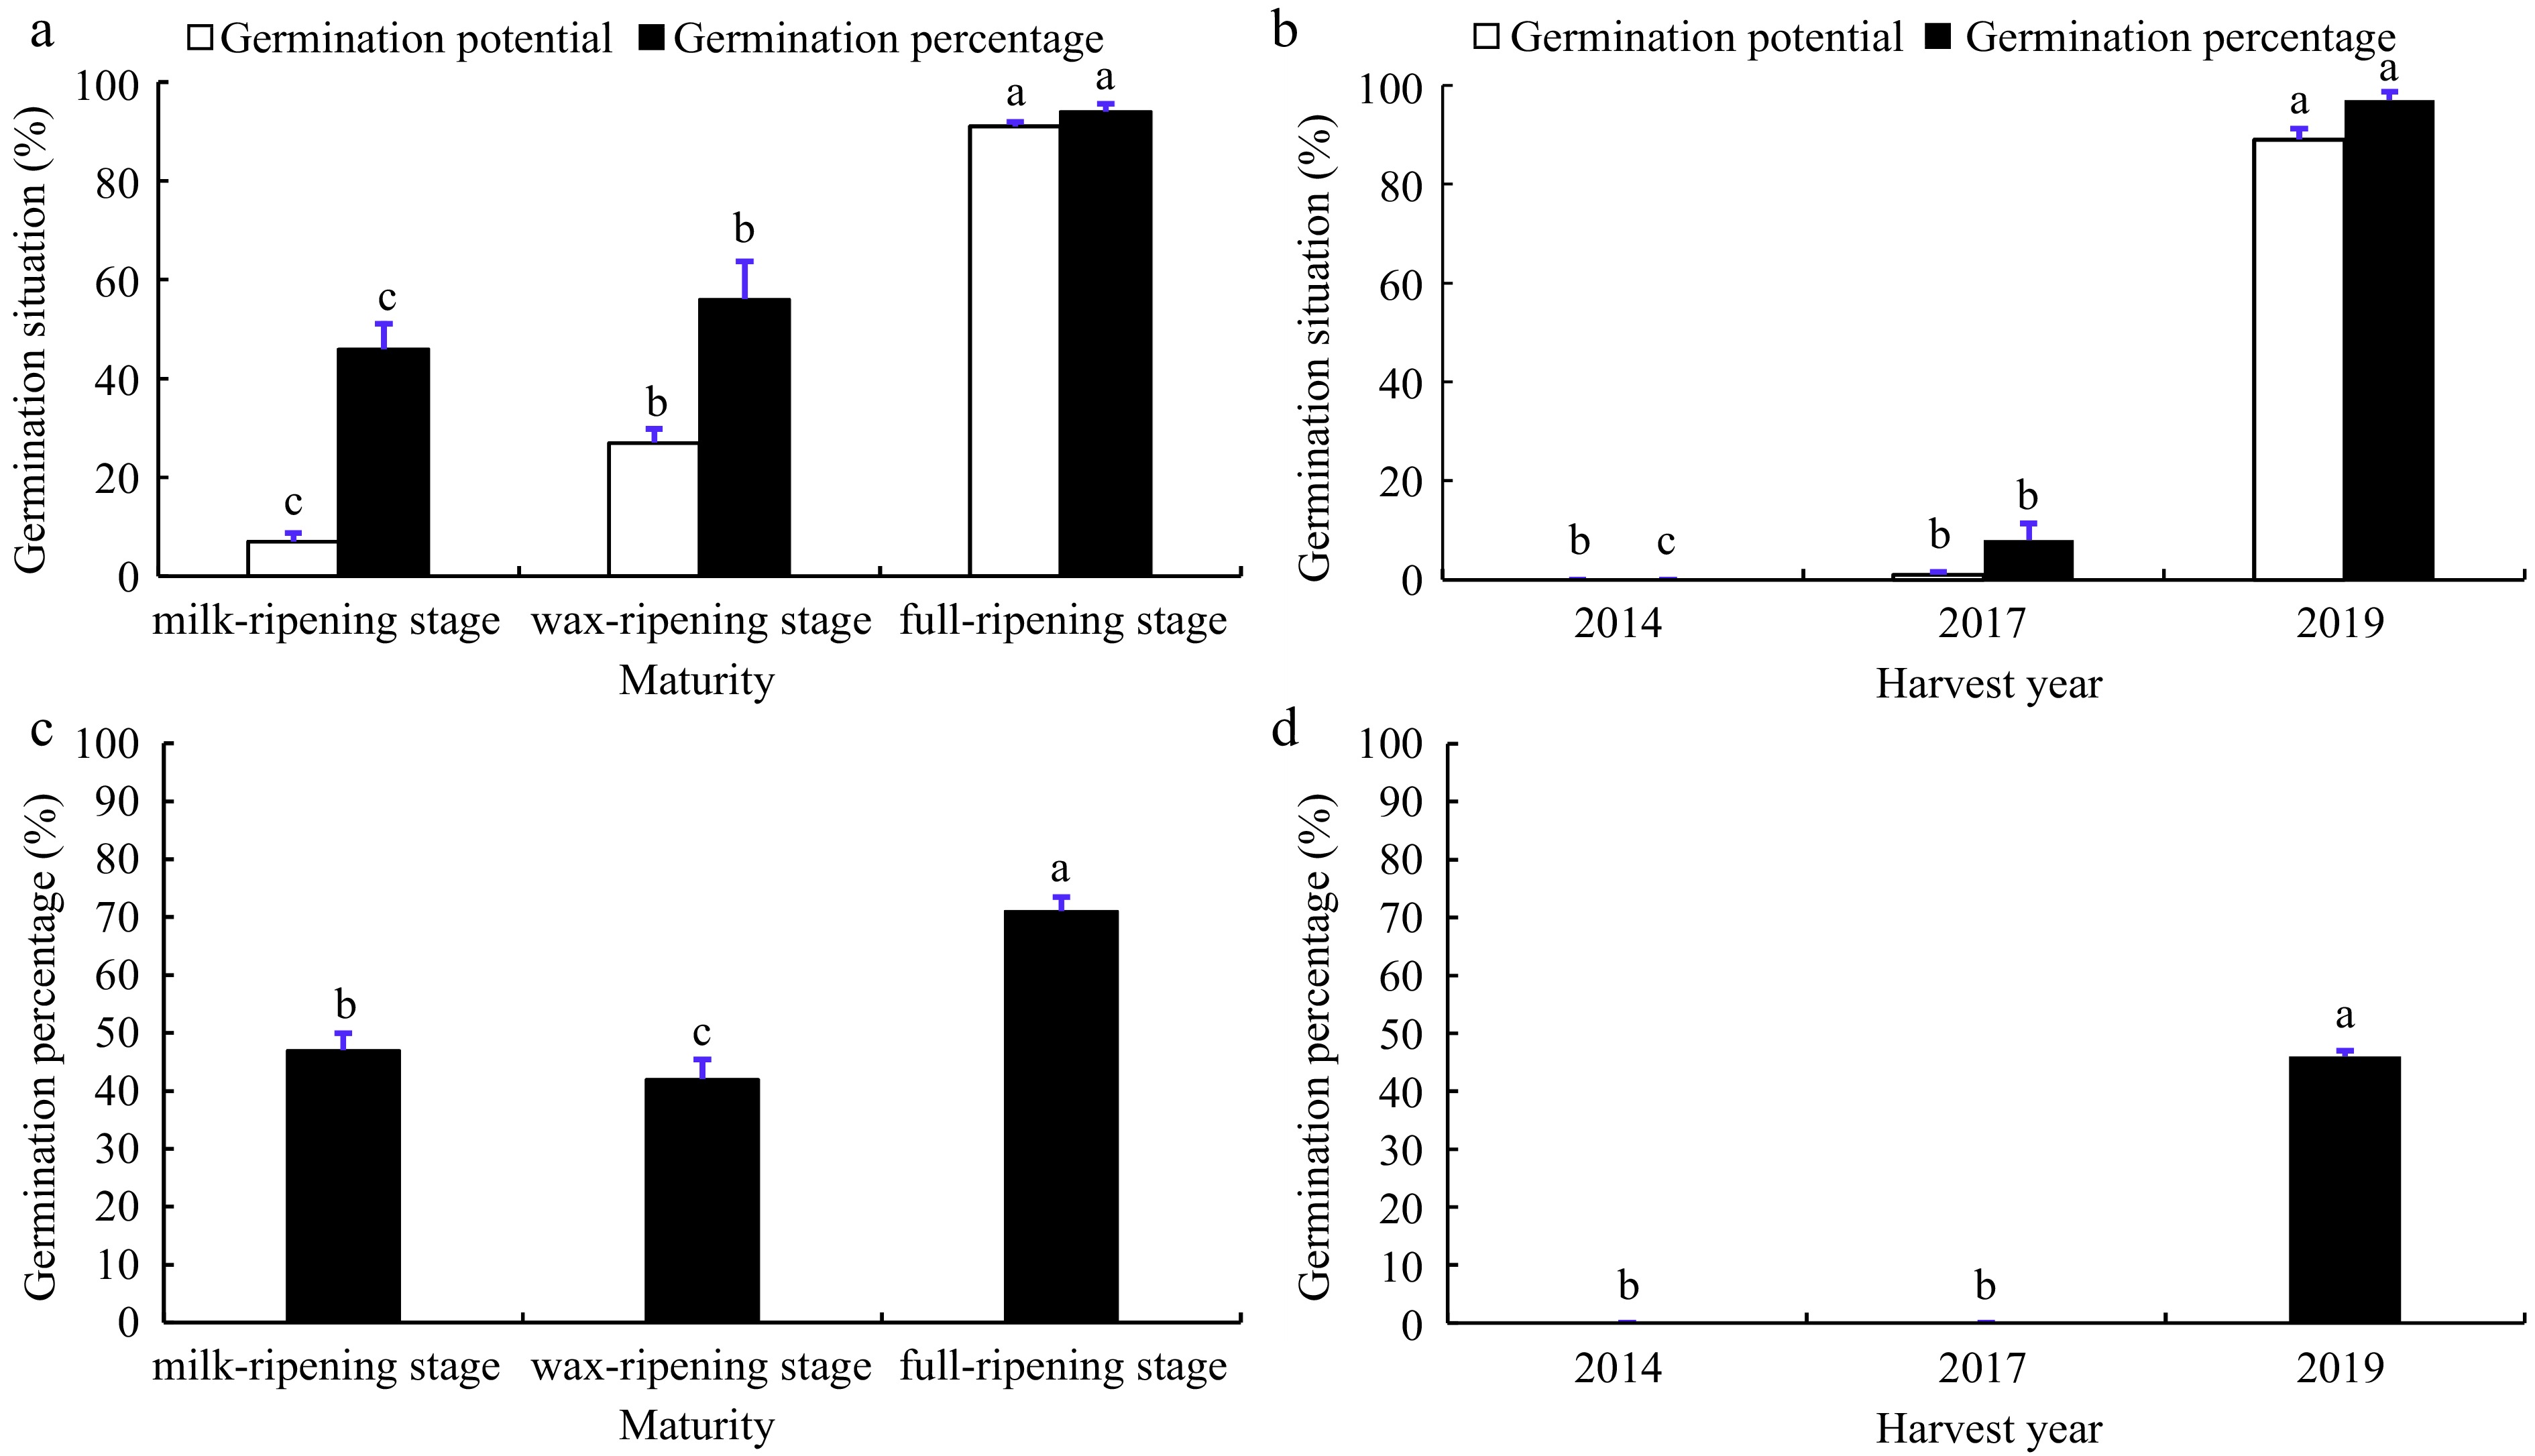
Figure 1.
Germination situation of smooth bromegrass seeds under different conditions. Data in (a) and (b) were the germination potential and germination percentage of smooth bromegrass seeds at different maturity levels and harvest years under standard germination test, respectively. Data in (c) and (d) were the germination percentage of smooth bromegrass seeds at different maturity levels and harvest years after artificial accelerated aging, respectively. Different lowercase letters represent significant difference between different treatments during the experimental period (p < 0.05). Bars represent the mean values of four replicates ± standard deviation (SD).
The results of artificial accelerated aging test of seed vigour showed that there were significant differences in germination percentage among three different maturity levels. The seeds at the full-ripening stage had the highest germination percentage and the seeds at the wax-ripening stage had the lowest germination percentage (Fig. 1c). For the seeds of three different harvest years, the germination percentage of seeds harvested in 2014 and 2017 were 0%, which were low vigour seeds, and seeds harvested in 2019 were high vigour seeds (Fig. 1d).
Chlorophyll fluorescence measurement
-
Fluorescence intensity maps of chlorophyll a and b captured by multispectral showed that among the seeds of different maturity levels, seeds at the milk-ripening and wax-ripening stages showed higher value of chlorophyll a, significantly higher than the full-ripening stage, and seeds at the full-ripening stage had the highest value of chlorophyll b (Fig. 2a & c). While among the seeds from different harvest years, the seeds harvested in 2019 had the highest content of chlorophyll a and chlorophyll b, and the values of chlorophyll a and chlorophyll b showed a gradient decrease with increasing storage year (Fig. 2b & d).
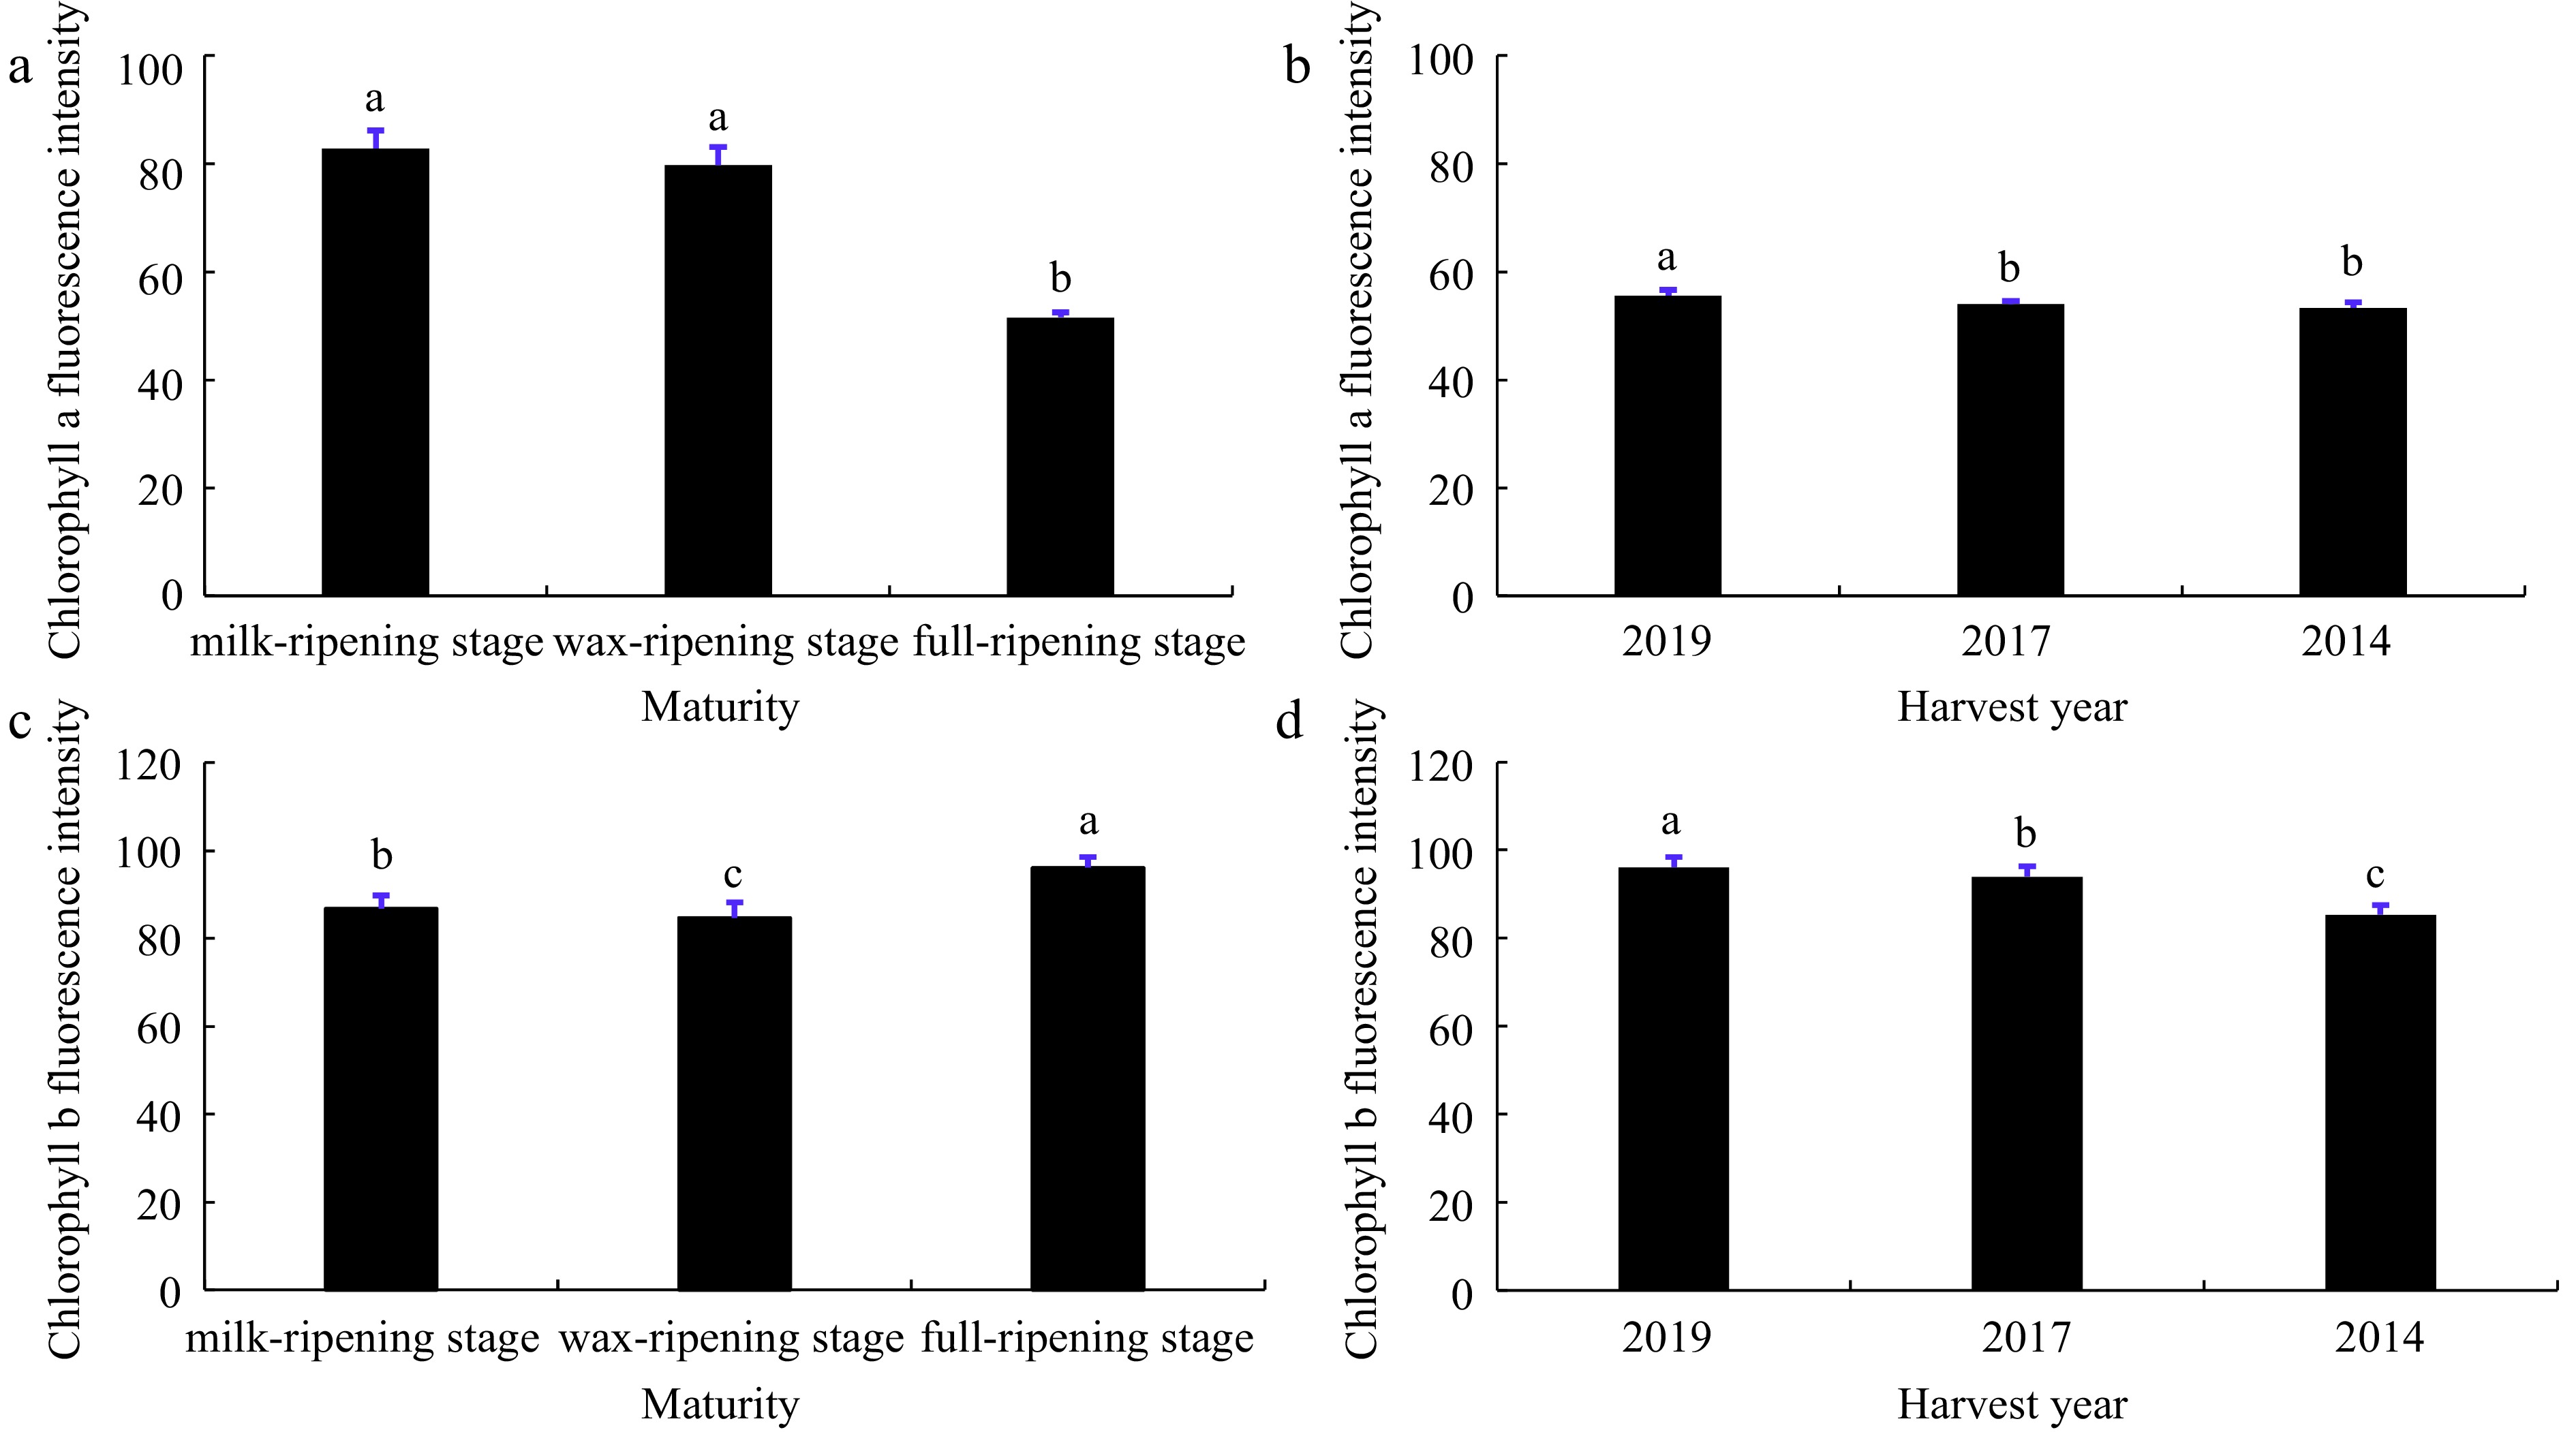
Figure 2.
Chlorophyll a and chlorophyll b fluorescence intensity of smooth bromegrass seeds at different maturity levels and harvest years. Data in (a) and (b) were chlorophyll a fluorescence intensity of seeds at different maturity levels and harvest years, respectively. Data in (c) and (d) were chlorophyll b fluorescence intensity of seeds at different maturity levels and harvest years, respectively. Different lowercase letters represent significant difference between different treatments during the experimental period (p < 0.05). Bars represent the mean values of four replicates ± SD.
Analysis of morphological and spectral data
-
Fourteen morphological characteristics of each seed lots were extracted by multispectral imaging, and seeds of different maturity levels and different harvest years were compared separately. The results showed significant differences in 11 indicators among seed lots of different maturity levels (p < 0.05), with significant differences in area, length-width ratio, shape parameters, color parameters and saturation among seed lots at different maturity levels, and in hue indicators, the seeds at milk-ripening stage were significantly higher than the seeds at wax-ripening stage and the full-ripening stage. There were 10 significant differences among seed lots in different harvest years (p < 0.05), among which there were significant differences in CIELab L* and CIELab B* of color parameters, saturation and hue, as well as in length-width ratio and shape parameters (Table 1).
Table 1. Comparative analysis of morphological characteristics of smooth bromegrass seeds with different maturity levels and different harvest years.
Characteristic Different maturity Different harvest years Milk-ripening stage Wax-ripening stage Full-ripening stage 2019 2017 2014 Area (mm2) 12.61 ± 2.095c 12.89 ± 1.777b 13.45 ± 1.668a 15.87 ± 2.675b 17.74 ± 2.845a 16.14 ± 2.512b Length (mm) 9.87 ± 0.901a 9.65 ± 0.904b 9.89 ± 0.744a 12.55 ± 1.793b 13.44 ± 2.004a 12.58 ± 1.843b Width (mm) 1.81 ± 0.278c 1.90 ± 0.211b 2.02 ± 0.212a 2.19 ± 0.282b 2.31 ± 0.283a 2.16 ± 0.253b Length-width ratio 0.18 ± 0.029c 0.20 ± 0.024b 0.20 ± 0.022a 0.18 ± 0.029 0.17 ± 0.027 0.18 ± 0.039 Compactness Circle 0.18 ± 0.028c 0.19 ± 0.023b 0.20 ± 0.019a 0.17 ± 0.025a 0.17 ± 0.021b 0.18 ± 0.036a Compactness Ellipse 0.99 ± 0.008b 0.99 ± 0.006a 0.99 ± 0.008b 0.96 ± 0.029b 0.96 ± 0.025b 0.97 ± 0.022a BetaShape_a 1.73 ± 0.221c 1.79 ± 0.182b 1.92 ± 0.237a 3.30 ± 1.878 3.33 ± 2.059 3.07 ± 1.415 BetaShape_b 1.58 ± 0.199c 1.69 ± 0.174b 1.78 ± 0.208a 2.74 ± 1.169 2.75 ± 1.032 2.61 ± 0.847 Vertical Skewness −0.07 ± 0.051c −0.04 ± 0.034a −0.06 ± 0.046b −0.10 ± 0.088 −0.09 ± 0.076 −0.09 ± 0.07 CIELab L* 46.28 ± 2.959b 44.72 ± 3.395c 47.06 ± 2.306a 51.43 ± 2.578a 51.06 ± 2.442b 48.42 ± 2.047c CIELab A* 6.17 ± 1.402b 4.96 ± 1.443c 7.94 ± 0.787a 6.26 ± 0.73b 7.71 ± 0.847a 7.67 ± 0.823a CIELab B* 17.78 ± 1.682b 12.58 ± 3.04c 18.58 ± 1.32a 17.57 ± 1.658c 20.18 ± 1.56a 19.68 ± 1.879b Saturation 19.06 ± 1.844b 13.50 ± 3.132c 20.66 ± 1.392a 18.80 ± 1.738c 21.79 ± 1.674a 21.33 ± 1.932b Hue 1.23 ± 0.066a 1.17 ± 0.112b 1.17 ± 0.03b 1.23 ± 0.033a 1.21 ± 0.028b 1.19 ± 0.109c Note: Different lowercase letters in the same line indicate significant differences, while the same letters indicate no significant differences (p < 0.05). The number of repetitions for this experiment was n = 4 for each seed lot samples. Through multispectral data collection and analysis, the average reflectance of smooth bromegrass seeds at 570−645 nm in wax-ripening stage was completely separate from that of milk-ripening stage and full-ripening stage, and the average reflectance of smooth bromegrass seeds at 780−970 nm in full-ripening stage was differed considerably from that of milk-ripening stage and wax-ripening stage (Fig. 3a). The average reflectance of smooth bromegrass seeds harvested in 2014 at 450−690 nm was completely separate from those smooth bromegrass seeds harvested in 2017 and 2019, and the mean reflectance of smooth bromegrass seeds harvested in 2019 at 940−970 nm differed significantly from those in 2014 and 2017 (Fig. 3b).
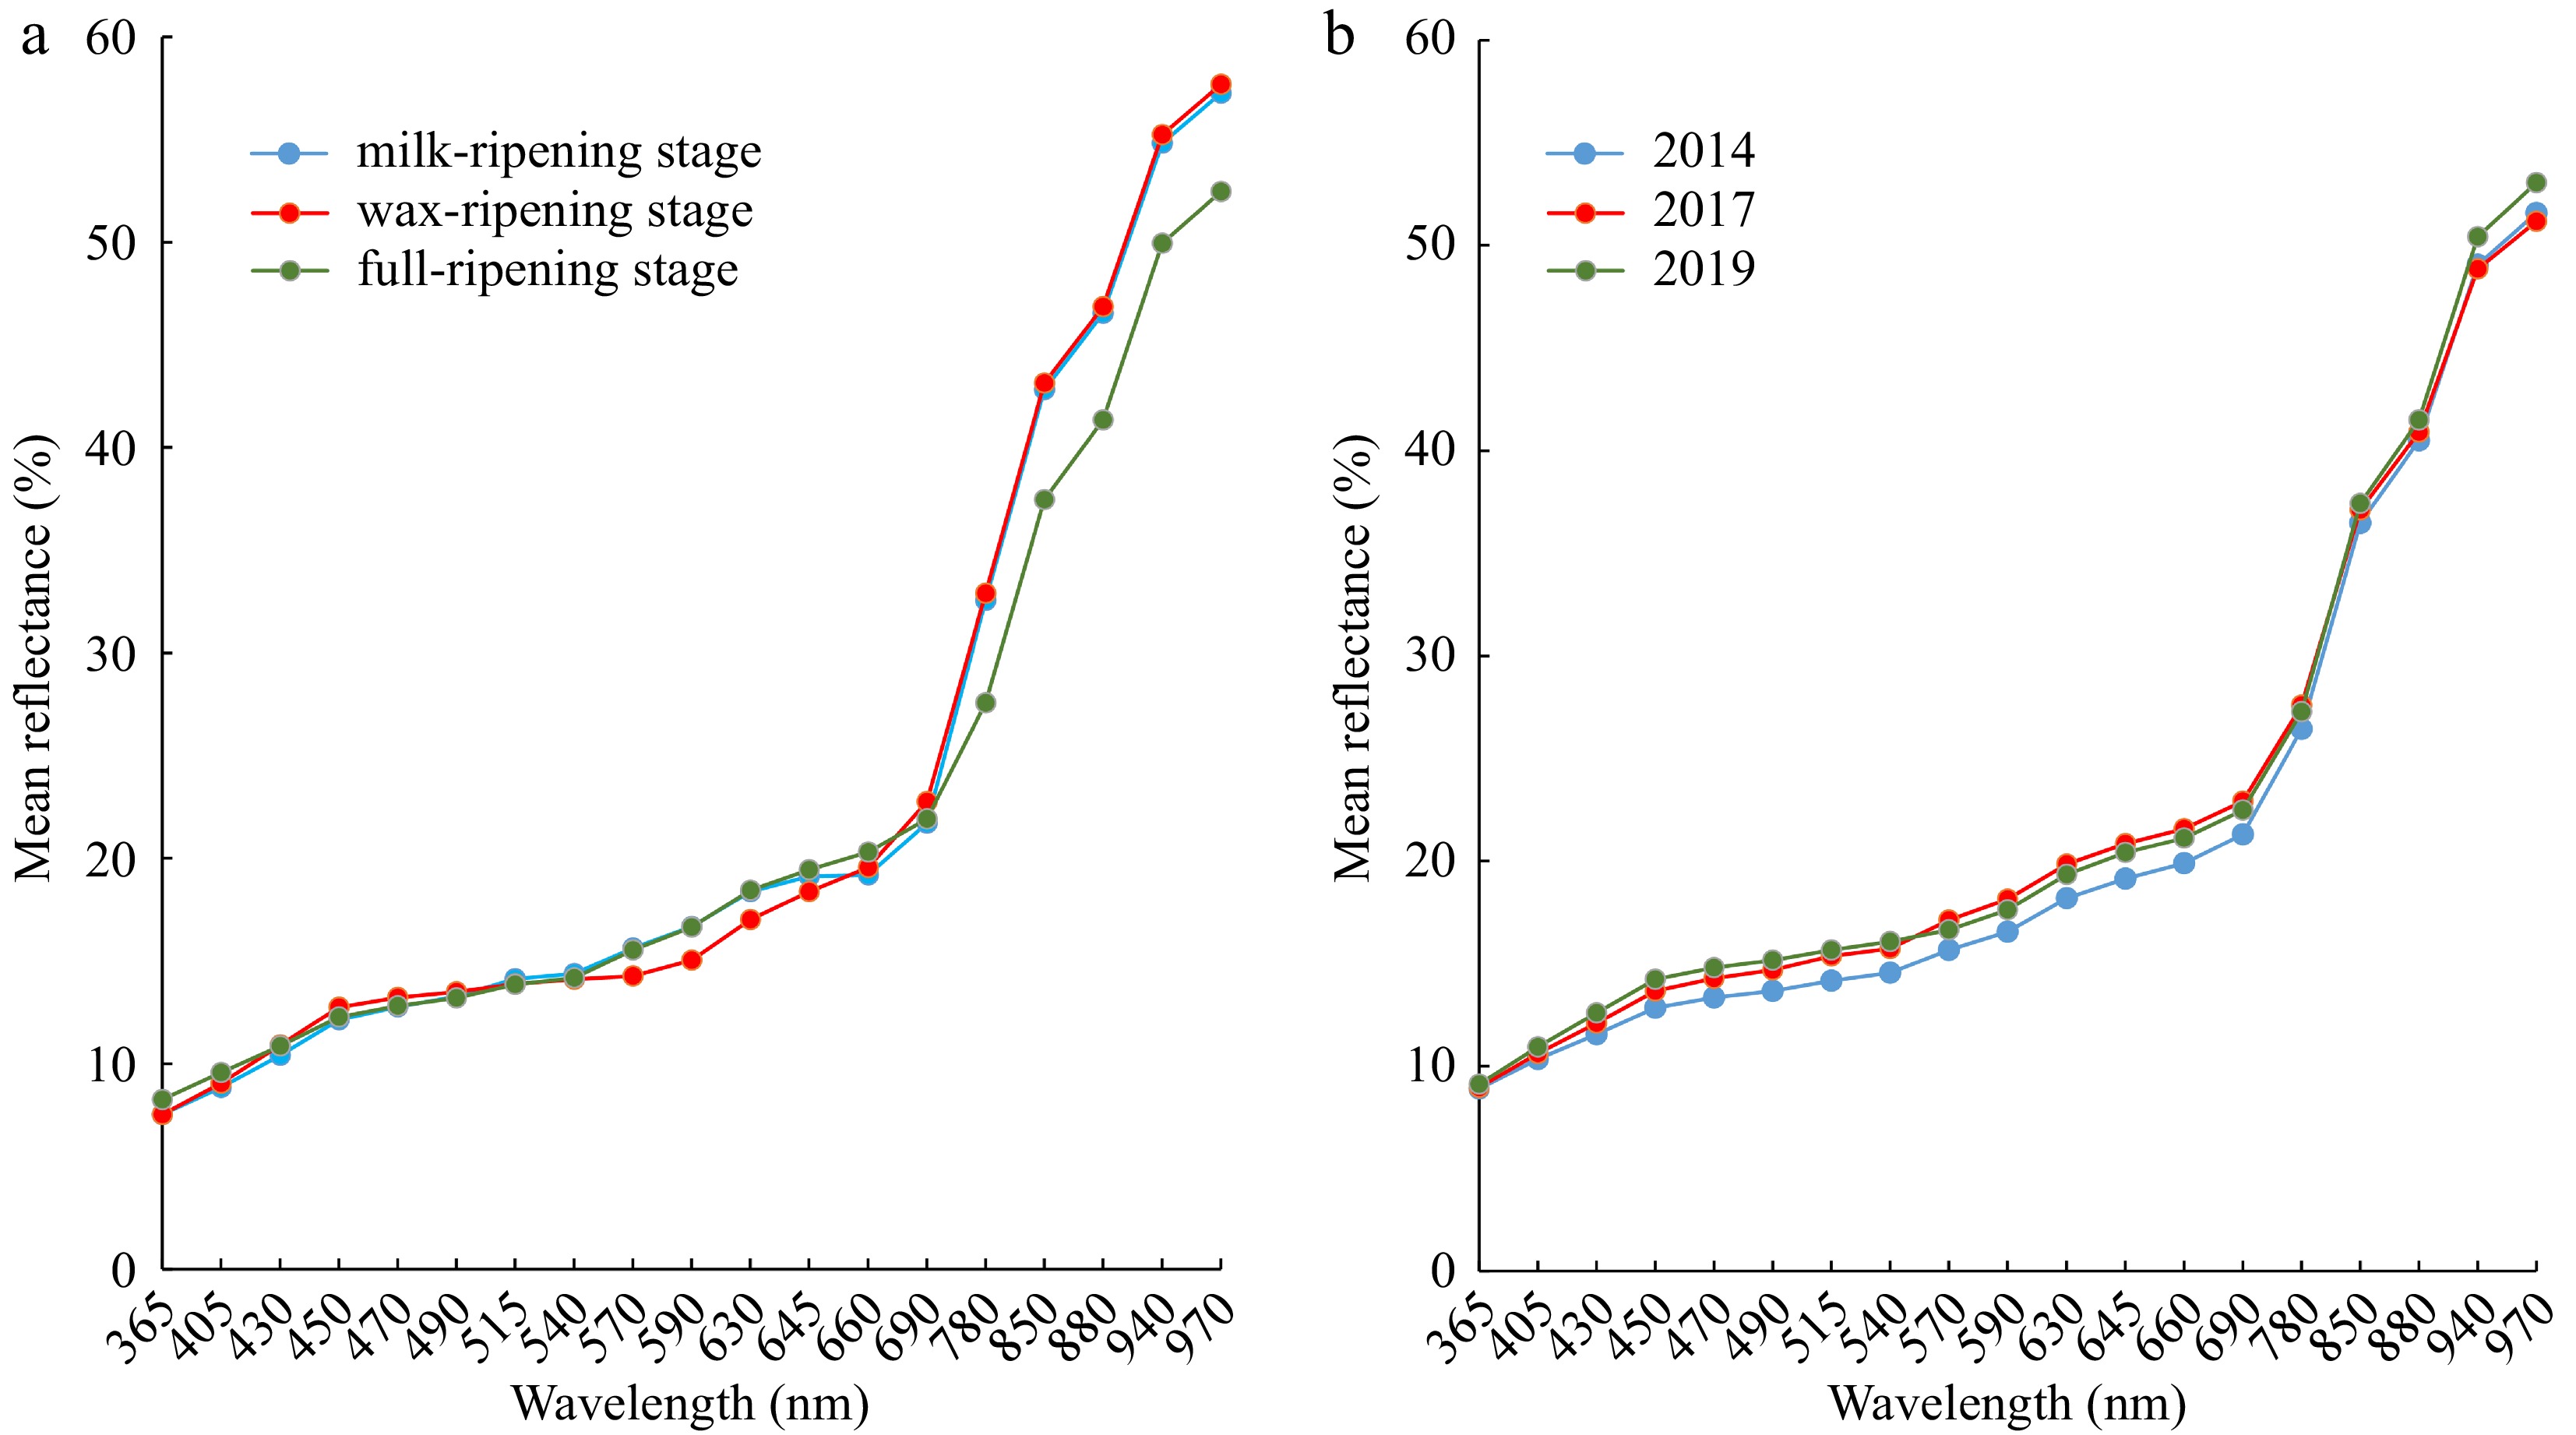
Figure 3.
Mean spectral reflectance of smooth bromegrass seeds at (a) different maturity levels and (b) harvest years.
Multivariate analysis
-
The results of the principal component analysis based on morphological and spectral features showed that for seeds at different maturity levels, the first two principal components explained only 53.6% of the original variance, and there was more overlap in the 95% confidence ellipses in the PC1/PC2 two-dimensional plots for seed samples at milk-ripening and wax-ripening stages. Comparatively speaking, there was less overlap between the seeds at full-ripening stage and seeds at the other two stages (Fig. 4a). For seeds from different harvest years, the first two principal components explained only 54.5% of the original variance and had a large overlap, this indicated that there was a high degree of similarity among samples and that PCA was not effective in clustering smooth bromegrass seeds of different maturity levels and different years (Fig. 4b). In addition, all spectral data were positively correlated with the principal component 1(PC1), with 490 nm, 515 nm, 540 nm and 690 nm contributing more to PC1. Morphological character data saturation, color parameter CIELab A* and CIELab B* were positively correlated with principal component 2(PC2) of smooth bromegrass seeds at different maturity levels (Supplemental Fig. S4a), while negatively correlated with PC2 of smooth bromegrass seeds at different harvest years (Supplemental Fig. S4b). In terms of the separation effect of smooth bromegrass seeds with different maturity levels, LDA could clearly distinguish the smooth bromegrass seeds of full-ripening, milk-ripening and wax-ripening stage, with the best distinction of full ripening stage seeds (Fig. 4c). For smooth bromegrass seeds of different harvest years, although the seeds harvested in 2014 and 2017 both had low vigour, they also had a good differentiation effect, and the seeds harvested in 2019 had the best discrimination with other seeds (Fig. 4d).
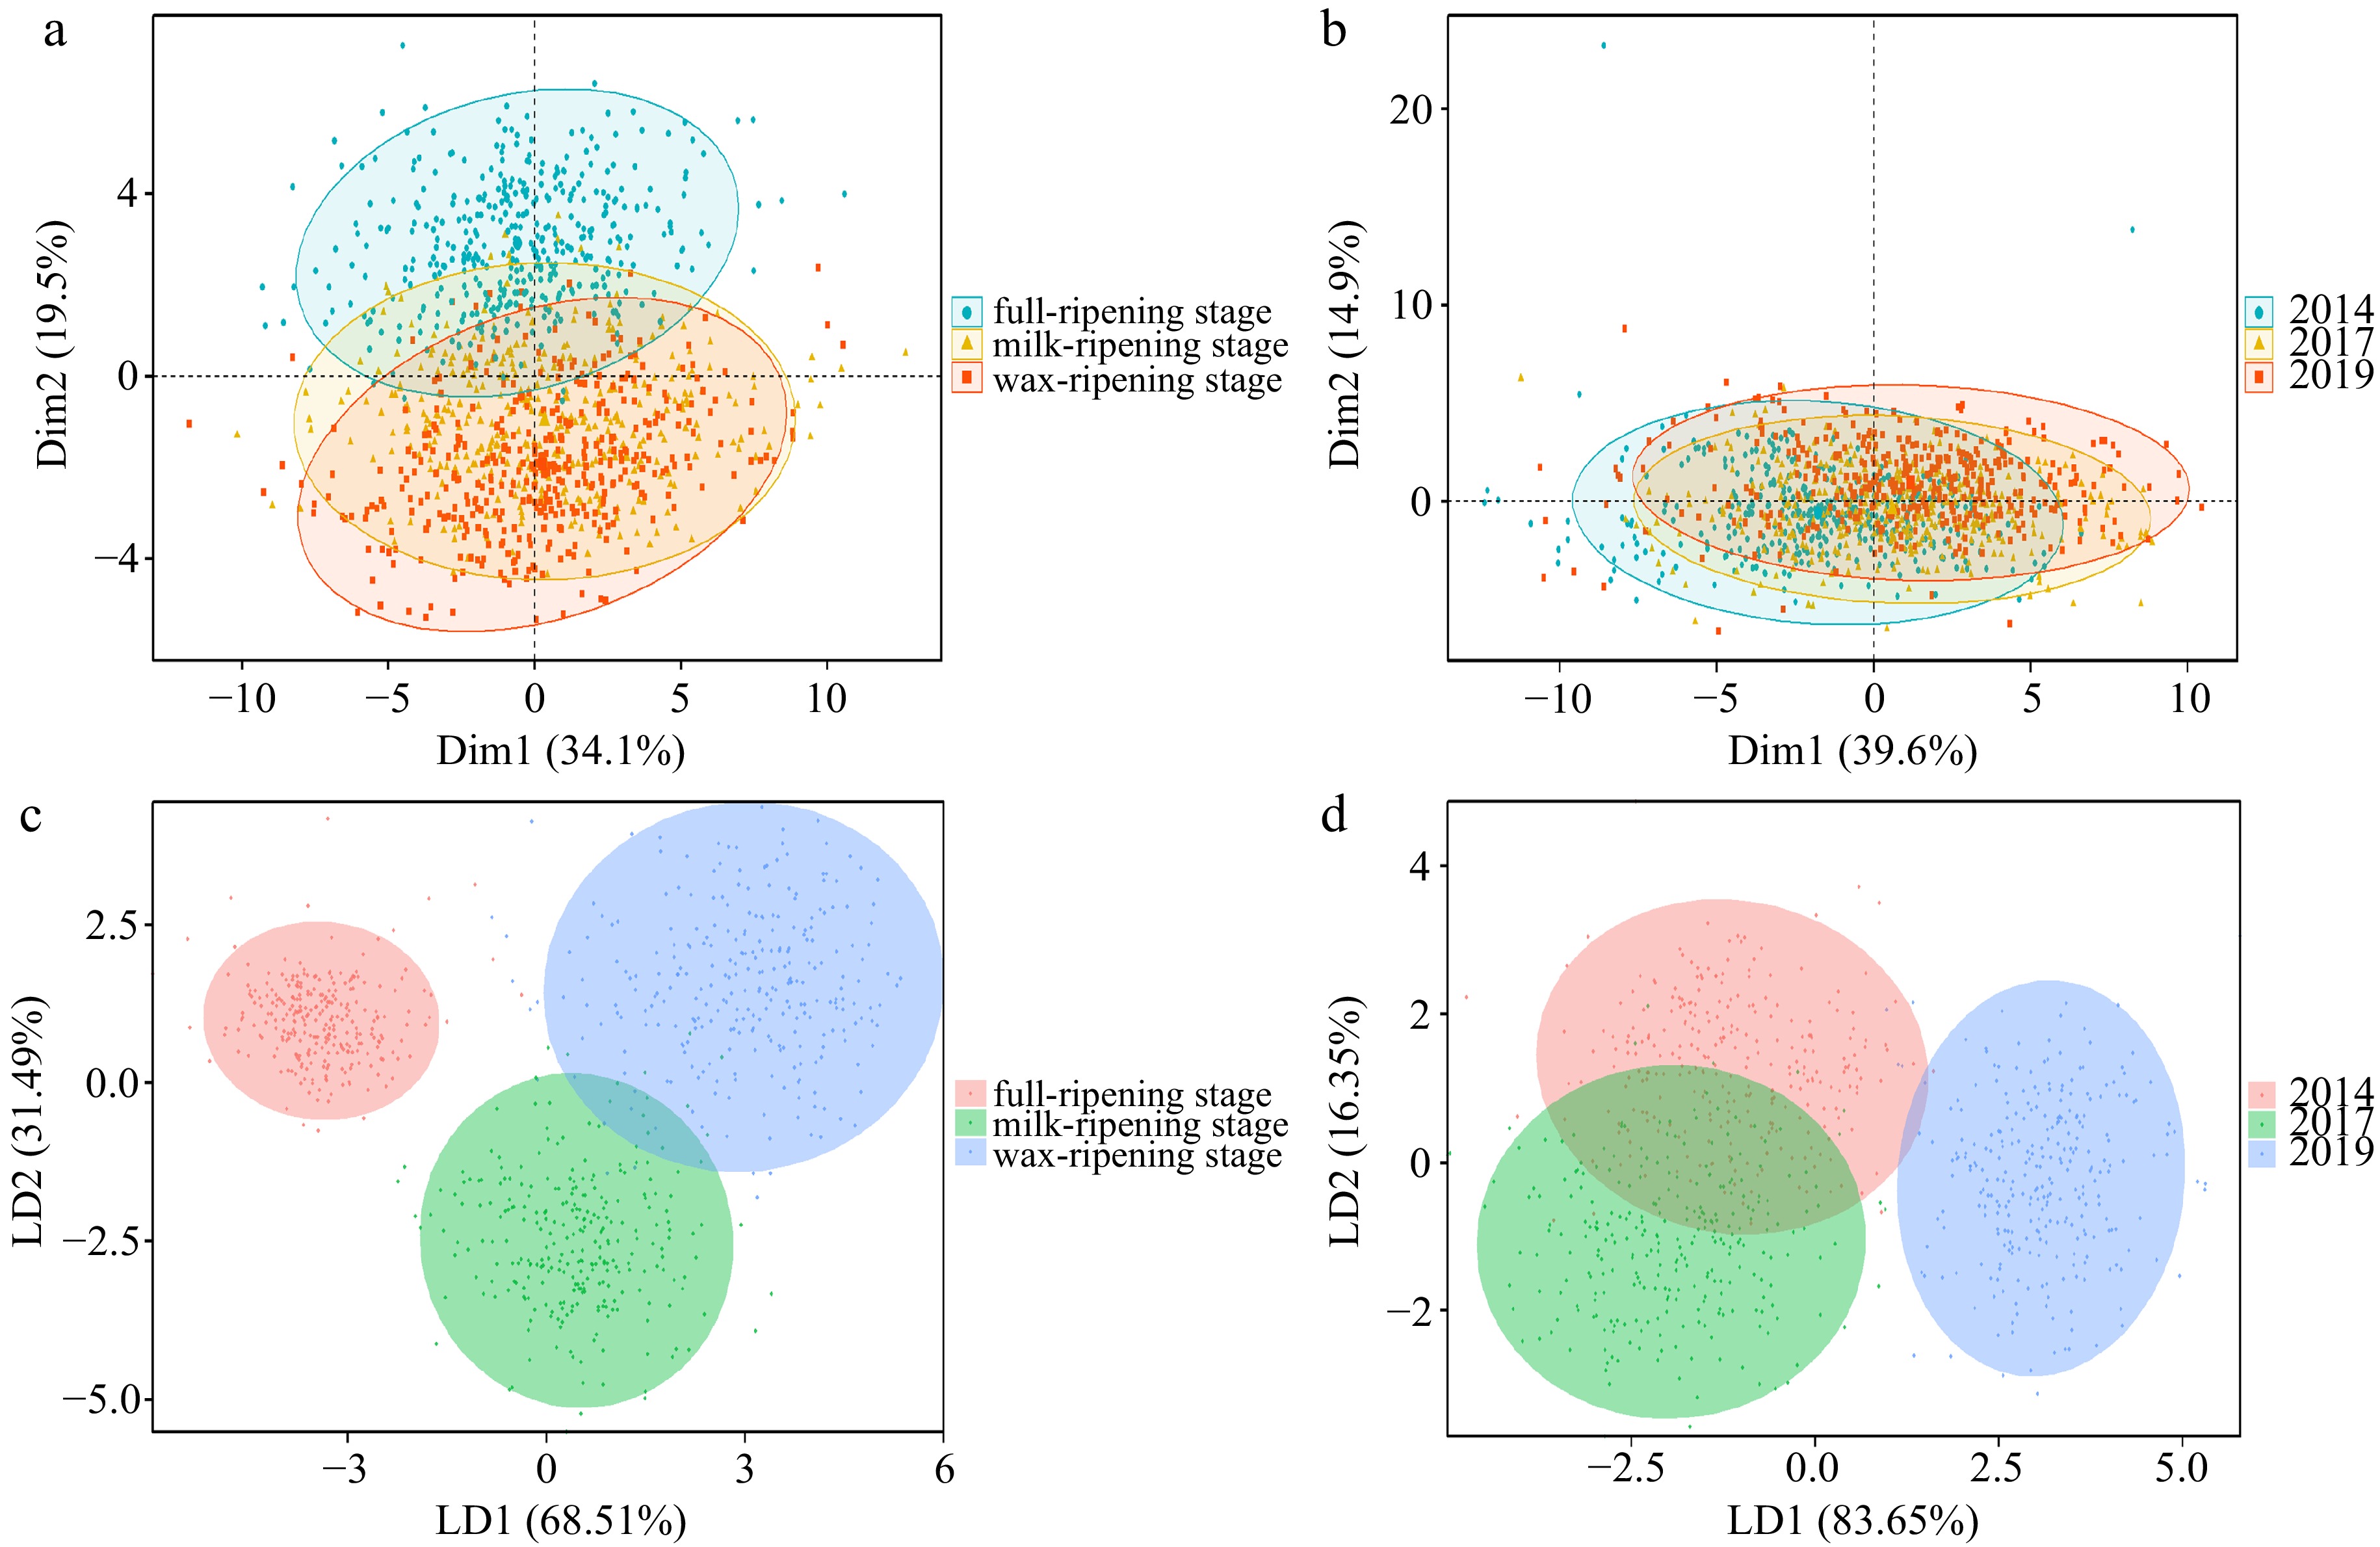
Figure 4.
Multivariate analysis based on multispectral data of smooth bromegrass seeds. Principal component analysis of smooth bromegrass seeds at (a) different maturity levels and (b) harvest years. LDA model diagram of smooth bromegrass seeds at (c) different maturity levels and (d) harvest years.
The LDA model had the best prediction effect on seed differentiation at different maturity levels and harvest years compared to the RF and SVM. The accuracy of LDA could reach 94.2% (milk-ripening vs wax-ripening stages), 99.2% (wax-ripening vs full-ripening stages) and 99.6% (milk-ripening vs full-ripening stages), respectively (SVM was 93.8%, 97.9% and 99.2%, RF was 87.5%, 98.3% and 97.1%), with an average accuracy of 97.7%, and the sensitivity, specificity and accuracy could also reach more than 96.0% on average (Table 2). At same time, LDA could also distinguish seeds at different harvest years, and the accuracy was able to reach 90.0% (2014 vs 2017), 99.2% (2017 vs 2019) and 97.5% (2014 vs 2019), respectively (SVM was 86.3%, 96.3% and 95.0%, RF was 77.9%, 89.2% and 85.8%), with an average accuracy of 95.6%, and the sensitivity, specificity and precision were high, which could reach more than 95.0% on average (Table 2).
Table 2. Prediction of smooth bromegrass seeds with different maturity levels and harvested in different harvest years by LDA, SVM and RF models.
Model Index Different maturity Different harvest year M vs W W vs F M vs F 2014 vs 2017 2017 vs 2019 2014 vs 2019 LDA Sensitivity (%) 96.6 99.2 99.2 91.6 98.3 96.6 Specificity (%) 91.7 99.2 100.0 88.4 100.0 98.3 Precision (%) 92.0 99.2 100.0 88.6 100.0 98.3 Accuracy (%) 94.2 99.2 99.6 90.0 99.2 97.5 SVM Sensitivity (%) 95.8 98.3 100.0 89.9 96.6 95.0 Specificity (%) 91.7 97.5 98.3 82.6 95.9 95.0 Precision (%) 91.9 97.5 98.3 83.6 95.8 95.0 Accuracy (%) 93.8 97.9 99.2 86.3 96.3 95.0 RF Sensitivity (%) 85.7 98.3 97.5 81.5 89.9 89.1 Specificity (%) 89.3 98.3 96.7 74.4 88.4 82.6 Precision (%) 88.7 98.3 96.7 75.8 88.4 83.5 Accuracy (%) 87.5 98.3 97.1 77.9 89.2 85.8 Note: M stands for milk-ripening stage, W stands for wax-ripening stage and F stands for full-ripening stage. Prediction of seed germination
-
In addition, we also predicted the germination of each smooth bromegrass seed according to the nCDA model in VideometerLab4 software, and the accuracy of the model prediction was verified and evaluated by the actual results after the standard germination test was completed. The standard germination results of seed samples at different maturity levels and harvest years were classified and recorded separately according to dead seeds (D), fresh ungerminated seeds (F), abnormal seedlings (A) and normal seedlings (N), and the respective prediction accuracies were calculated separately.
The calculated nCDA prediction results showed that, regarding seed samples of different maturity levels, the prediction accuracy of dead seeds with no vigour could reach 93.7%, normal seedlings with high vigour could reach 91.1%, abnormal seedlings and fresh ungerminated seeds could reach 97.1% and 97.5%, but the sum of abnormal and normal seedlings, i.e., seeds capable of germination (A + N), only reached 85.8%. For seed samples from different harvest years, the prediction accuracy of dead seeds was 91.3%, the prediction accuracy of normal seedlings could reach 91.3%, the prediction accuracy of abnormal seedlings and fresh ungerminated seeds could reach 92.6% and 98.3%, but the prediction accuracy of seeds that could germinate (the sum of abnormal seedlings and normal seedlings) could reach 94.0% (Table 3).
Table 3. Germination prediction of smooth bromegrass seeds with different maturity levels and harvest years based on nCDA.
Sample Classification Actual number of CCS Correctly predicted number of CCS Actual number of RSS Correctly predicted number of RSS Accuracy of prediction (%) Maturity level D 301 247 899 877 93.7% F 7 5 1193 1165 97.5% A 109 70 1091 1095 97.1% N 783 769 417 324 91.1% A + N 892 811 308 218 85.8% Harvest year D 766 691 434 404 91.3% F 3 3 1197 1176 98.3% A 12 9 1188 1102 92.6% N 419 390 781 705 91.3% A + N 431 386 769 742 94.0% Note: CCS stands for Corresponding classification samples, RSS stands for Remaining sorted samples. N stands for normal seedlings, A stands for abnormal seedlings, F stands for fresh ungerminated seeds and D stands for dead seeds. Overall, the SVM model was better than both LDA and RF models in predicting the germination of smooth bromegrass seeds harvested in different years. However, the accuracy of both LDA and SVM models for predicting normal seedlings, abnormal seedlings, fresh ungerminated seeds and dead seeds was above 90.0%, and the accuracy of predicting abnormal seedlings and fresh ungerminated seeds was the same, the prediction accuracy of LDA was up to 98.3% and SVM was up to 99.2%. For the seed samples of different maturity levels, it was similar to the prediction of germination of seeds harvested in different years. The accuracy of LDA model and SVM model for predicting fresh ungerminated seeds was higher, which were 98.9% and 99.2%, respectively. And the prediction accuracy of LDA model and SVM model for abnormal seedlings was more than 90.0%. However, for normal seedlings and dead seeds, the prediction accuracy of both models was lower. The prediction accuracy of normal seedlings was less than 70.0%, and that of dead seeds was less than 80.0% (Table 4).
Table 4. Germination prediction of smooth bromegrass seeds with different maturity levels and harvested in different years by LDA, SVM and RF models.
Model Index Different maturity Different harvest years N A F D N A F D LDA Sensitivity (%) 79.9 0 0 12.4 88.4 0 0 96.5 Specificity (%) 40.5 99.7 99.7 94.5 96.5 99.2 99.2 87.1 Precision (%) 72.6 0 0 42.3 93.4 0 0 92.8 Accuracy (%) 66.7 91.7 98.9 74.2 93.6 98.3 98.3 93.1 SVM Sensitivity (%) 80.8 0 0 0 86.0 0 0 97.4 Specificity (%) 40.5 100.0 100.0 100.0 97.0 100.0 100.0 84.1 Precision (%) 72.8 NA NA NA 94.1 NA NA 91.4 Accuracy (%) 67.2 91.9 99.2 75.3 93.1 99.2 99.2 92.5 RF Sensitivity (%) 79.1 0 0 12.4 69.0 0 0 93.0 Specificity (%) 39.7 99.7 100.0 95.6 93.1 100.0 100.0 72.0 Precision (%) 72.1 0 NA 47.8 84.8 NA NA 85.1 Accuracy (%) 65.8 91.7 99.2 75.0 84.4 99.2 99.2 85.3 Note: N stands for normal seedlings, A stands for abnormal seedlings, F stands for fresh ungerminated seeds and D stands for dead seeds. -
According to the results of germination test and artificial accelerated aging test of smooth bromegrass seeds, the seed vigour was highest at the full-ripening stage among different developmental stages. Moreover, the smooth bromegrass seed vigour gradually decreased with increasing storage time in different storage years, which was the same as the results of Zhang et al.[22] on alfalfa seeds at different maturity levels and different storage years. In addition, our study showed that the maturity level of smooth bromegrass seeds was positively correlated with seed germination percentage, and this was in agreement with the results of Mao et al.[36] on the vigour of smooth bromegrass seeds at different stages of development.
Chlorophyll is a fluorophore, and its fluorescence is used as a non-invasive tool to evaluate plant photosynthesis. Contrary to the principle used in plants, chlorophyll fluorescence usually had negative effects in seeds[37]. Immature carrot and tomato seeds emitted high chlorophyll fluorescence, and these seeds had lower physiological quality compared to less fluorescence seeds[33,38]. Chlorophyll fluorescence of kale seeds was negatively correlated with their germination percentage[39]. These results were consistent with our findings. We quantified chlorophyll fluorescence intensities a and b using autofluorescence-spectral images acquired at 660/700 nm and 405/600 nm excitation/emission combinations. The result of chlorophyll fluorescence imaging indicated that there was accumulation and degradation of chlorophyll molecules in both the growth and developmental stages of seeds. Smooth bromegrass seeds at milk-ripening stage had a lower germination percentage but showed a higher fluorescence intensity of chlorophyll a, indicating that the chlorophyll within the seeds harvested at this stage was not yet completely degraded, which was similar to the results of Kenanoglu et al.[40] on pepper seeds of different maturity levels. The chlorophyll a content of seeds remained at a high level at the wax-ripening stage and began to decrease significantly at the full-ripening stage, indicating that the degradation of chlorophyll a molecule mainly occurred at this developmental stage. The content of chlorophyll b molecule was still accumulated to a certain extent during the developmental stage of the seeds and began to degrade slowly during the storage stage after maturation. The fluorescence intensity of chlorophyll b varied with seed vigour during the developmental and storage stages of the seeds.
According to the morphological data and spectral data of smooth bromegrass seeds, the projected area and aspect ratio of seeds increased with maturity levels, indicating a positive correlation between seed size and vigour at the seed development stage, which was consistent with the findings of Zhang et al.[22] on alfalfa; whereas there was no significant correlation between the size and vigour of smooth bromegrass seeds at different harvest years. CIELab is an international standard for colour inspection[41], consisting of a luminance parameter (L) and two colour parameters (A and B). The three parameters CIELab L*, CIELab A* and CIELab B* obtained by multispectral imaging could be applied to determine the maturity and viability of seeds[42]. The color parameters CIELab L*, CIELab A* and CIELab B* of smooth bromegrass seeds at different maturity levels were significantly different. CIELab L* and CIELab B* of seeds at three harvest years were significantly different, and CIELab L* values were positively correlated with seed vigour. Overall, it seemed that the two colour indicators (CIELab L* and CIELab B*) had greater potential in distinguishing smooth bromegrass seeds at different maturity stages or different harvest years. Due to the presence of various overlapping peaks and the complex chemical composition of the seeds, the spectral assignment of absorption bands and their interpretation is quite complex[43]. As mentioned above, plant pigments, water, oil, fiber compounds and fatty acids have maximum absorption peaks at specific wavelengths. So we speculated that the mean spectral reflectance of seeds with different vigour levels at 450~690 nm and 940~970 nm was quite different, which may be related to the change of seed color, chlorophyll content, lipid content and water content during seed growth and development and storage stages[10,43,44]. And differences in the mean reflectance of smooth bromegrass seeds at different maturity stages from 780 to 940 nm may be due to some chemical differences in seeds[10].
Previous studies have shown that the combination of LDA and multispectral data gives superior results[21,22,35], and the same results were also shown in the present experiment. The LDA model outperformed PCA, SVM and RF in predicting seed vigour, with model error rates of less than 10.0% for smooth bromegrass seeds at different harvest years and less than 6.0% for seeds at different maturity levels. In terms of the prediction of seed germination, the prediction accuracy of LDA model for normal seedlings and dead seeds of smooth bromegrass in different harvest years was above 90.0%, while the prediction accuracy of LDA model for normal seedlings and dead seeds of smooth bromegrass at different maturity levels was lower than 75.0%. This may be due to the fact that the LDA model combined with multispectral was not suitable for the determination of seed viability, or the small range of wavelengths obtained by multispectral did not allow for deep collection of key information for evaluating seed viability resulting in the combined multivariate analysis methods not being able to distinguish well seeds of different viabilities. Therefore, in the application of seed vigour testing, we can consider the organic combination of different testing technologies, and the advantages complement each other, which can achieve more desirable results, and this will be an important development direction in non-destructive testing technology for seed quality.
The nCDA algorithm is integrated into the VideometerLab4 multispectral imaging system and allows for rapid presentation of classification maps to visually distinguish seed vigour[23]. According to the nCDA prediction results, it could be seen that the effect of distinguish seeds with different maturity levels, different harvest years and different germination states of seeds was relatively ideal, which could reach more than 90.0%, and the average prediction accuracy could also reach more than 93.0%, respectively. It was able to achieve 91.1% and 91.3% accuracy in predicting normal seedlings, so nCDA was also ideal for predicting the germination percentage of smooth bromegrass seeds. In addition, the test results showed that nCDA had a high ability to predict dead seeds with an average accuracy of 92.5%, and had great potential for predicting seed vigour or viability of smooth bromegrass. The prediction accuracy of germinating components (the sum of abnormal and normal seedlings) of smooth bromegrass seeds at different maturity levels was lower than that of abnormal and normal seedlings, respectively. However, the prediction accuracy of germinating components at different harvest years was higher than that of abnormal and normal seedlings respectively. This may be due to the fact that abnormal and normal seedlings of different maturity levels could not be better grouped by the nCDA model, and abnormal and normal seedlings of different harvest years could be better grouped by this model.
It is worth noting that in the results of the artificial accelerated ageing determination for seed vigour of smooth bromegrass in different harvest years, the germination percentage of seeds harvested in 2014 and 2017 was both 0%, suggesting that the vigour of the two seed lots was the same. However, there were differences in the germination percentage of seed harvested in 2014 and 2017 under standard germination tests, 0% and 8% respectively, indicating that the standard method of artificial accelerated ageing was not sensitive and accurate in the evaluating the seeds of low vigour and no vigour. In this experiment, multispectral imaging was used to collect the spectral and morphological information of smooth bromegrass seeds from two harvested years, 2014 and 2017, and the prediction accuracy of seeds from the two years in the LDA model was 90.0%, and the four morphological indicators of seed size, color parameters, saturation and hue obtained by multispectral also showed significant differences. Therefore, multispectral imaging was more sensitive and accurate in the evaluation and differentiation of seed vigour compared to artificial accelerated ageing methods, and could capture the subtle morphological and spectral differences between seed lots, which has a better application prospect for the evaluation and detection of seed vigour. In addition, multispectral was almost non-destructive to seeds in the whole process of collecting spectral and morphological information of smooth bromegrass seed samples, which played a very important role in the conservation and utilization of germplasm resources.
-
Based on multispectral technology, by extracting morphological data and spectral information of seeds and combining with LDA model, the seed vigour of smooth bromegrass could be tested more accurately, and the seed viability and germination percentage of smooth bromegrass could also be tested more accurately by combining with nCDA model. The method above was applicable to the determination of seeds with different vigour levels caused by different maturity levels in the process of seed formation and development, and also to the determination of seeds with different vigour levels caused by natural aging in different storage years after physiological maturity, which has good applicability and representativeness. In conclusion, the results of this study confirmed the feasibility of multispectral imaging techniques combined with multivariate analysis methods to rapidly achieve differentiation of smooth bromegrass seed vigour, which has a good prospect in non-destructive testing for seed vigour.
This research was supported by Reproduction and Industrialization Demonstration of High-quality Forage Seeds (2020-Pro-Sci-Tech in Inner Mongolia, China-Technology Innovation Center of Forage Seed Industry-3), and the earmarked fund for CARS (CARS-34).
-
The authors declare that they have no conflict of interest.
- Supplemental Fig. S1 Image of smooth bromegrass inflorescence
- Supplemental Fig. S2 Schematic diagram of smooth bromegrass spikelet.
- Supplemental Fig. S3 Seed schematic diagram of different maturity level of smooth bromegrass.
- Supplemental Fig. S4 PCA loading diagram of smooth bromegrass seeds at different maturity levels (a) and different harvests (b).
- Copyright: © 2023 by the author(s). Published by Maximum Academic Press, Fayetteville, GA. This article is an open access article distributed under Creative Commons Attribution License (CC BY 4.0), visit https://creativecommons.org/licenses/by/4.0/.
-
About this article
Cite this article
Yang S, Zhang S, Yi K, Wei K, Zeng H, et al. 2023. Rapid non-destructive testing of smooth bromegrass (Bromus inermis) seed vigour using multispectral imaging. Grass Research 3:12 doi: 10.48130/GR-2023-0012 

Rapid non-destructive testing of smooth bromegrass (Bromus inermis) seed vigour using multispectral imaging
- Received: 15 February 2023
- Accepted: 19 May 2023
- Published online: 03 July 2023
Abstract: Seed vigour is an important indicator to evaluate the seed quality, and the testing of seed vigour is crucial during the growth and development of seeds. Multispectral imaging is an emerging non-destructive testing technology that has been gradually utilized in the field of seed quality testing in recent years. In this study, we used multispectral imaging to obtain image and spectral information of smooth bromegrass seeds with different maturity levels and different harvest years, and combined with five multivariate analysis methods of principal component analysis (PCA), linear discriminant analysis (LDA), support vector machine (SVM), random forest (RF) and normalized canonical discriminant analysis (nCDA) to distinguish and estimate. Results showed that LDA could predict the seed vigour of smooth bromegrass more accurately, and the accuracy of seed prediction could reach 94.2%−99.6% for different maturity levels and 90.0%−99.2% for different harvest years, which was the best differentiation model. On the prediction of seed germination, the accuracy of the LDA model in predicting normal seedlings of smooth bromegrass seeds in different harvest years (93.6%) was higher than different maturity levels (66.7%). The prediction accuracy of nCDA could reach 93.7% and 91.3% for dead seeds with different maturity levels and different harvest years, and 91.1% and 91.3% for high vigour seeds, respectively. The above results confirmed the feasibility of the multispectral imaging techniques combined with the multivariate analysis methods for rapid and non-destructive differentiation of seed vigour of smooth bromegrass, and it also showed good application prospects in the seed vigour testing field.