


-
Phosphorus (P) is an essential element for turfgrass growth and reproduction. Existing in the soil in both inorganic and organic forms, P for plant growth is taken up by plants as the orthophosphate ions
$\text H_2 {\text {PO}}_4^{-} $ ${\text {HPO}}_4^{2-} $ Phosphite (H3PO3), unlike phosphate, is a non-nutrient form of an essential element, P. Phosphite is a generic name used to describe alkali metal salts of phosphorus acid (H3PO3), which also may be called phosphonate[3]. Phosphite has long been recognized for its fungicidal abilities[4−7], and has been evaluated for its ability to control Pythium (spp.)[8], cyanobacteria[9], dollar spot (Clarireedia jacksonii)[10]and pink snow mold (Microdochium nivale)[7, 11−12] in turfgrasses. Thus, phosphite has long been included in various commercial fungicides and in liquid fertilizers not registered as fungicides, with a common source being potassium phosphite. The inclusion of phosphite in fertilizers is a regulatory issue in flux, and registration/labeling/inclusion regarding phosphite in fertilizers will vary by state and country.
Plants take up phosphite ions, with significant accumulation at 6 weeks after application, with some translocation to roots of creeping bentgrass (Agrostis stolonifera) velvet bentgrass (Agrostis canina) and Poa annua[13]. Plants do not metabolize phosphite into other forms, and it will persist in plant tissue[4,5]. So, when used as a fungicide repeated application of phosphite products is needed, as phosphite would be removed with grass tissue after mowing[11,13].
While most research was conducted on non-turfgrass crops, the effect of phosphite as a P source on plants tends to be highly dependent on the phosphate status of the plants[14,15]. Typically, if soil solution phosphate is high, then application of phosphite is not harmful to the plant. If soil solution phosphate is low, then application of phosphite could be toxic to the plant[15]. For example, relatively low phosphite concentrations in solution culture (1−2 mM) did not affect phosphate-fertilized oilseed rape (Brassica napus L.) suspension cells, but phosphate-starved oilseed rape was far more susceptible to the deleterious effects of phosphite[16]. In that work the presence of phosphite caused a 20 to 25% reduction in whole-seedling fresh weights, but only in the phosphate-starved seedlings.
In a study with hydroponically cultivated celery (Apium graveolens L.), phosphite was supplied in both low (0.05 mmol·L−1) and high (0.5 mmol·L−1) phosphate solutions. When a high rate of phosphite was applied (2 mmol·L−1) the growth of low phosphate-fertilized celery was significantly decreased[17]. In other work, the same total amount of P was applied to spinach (Spinacia oleracea L.), using different ratios of phosphate:phosphite. No matter what the level of total P, plant growth was significantly reduced as the proportion of phosphite in the ratio increased[18]. Other work by the same researchers found that if phosphate was limiting for lettuce (Lactuca sativa L.) production, less phosphite was needed to cause damage. Conversely, higher rates of phosphite (to 2 mmol·L−1), did not affect lettuce yield if sufficient phosphate (0.3 mmol·L−1) was present[19]. In still additional work foliar application of phosphite decreased shoot and grain dry weight of bean (Phaseolus vulgaris L.) when soil phosphate was deficient, and there was no effect when the beans were grown in high phosphate soil[20]. Regardless of the level of soil P, the addition of phosphite reduced the shoot and grain dry weight of bean, when compared to treatments to which no phosphite had been added[20].
The reason why plants are damaged in low phosphate-high phosphite situations was explored in work which examined phosphate starvation-induced gene expression[3]. Researchers found that the cause of suppression of phosphate starvation was the intervention of phosphite in signal transduction, with the pathway considering phosphite as phosphate. As a result, plants could not perceive phosphate deficiency, even in an extremely low concentration of phosphate[3]. Phosphate starvation inducible genes, such as LePT2 (high affinity Pi transporters), LePS2 (APase) and TPSI1 (novel genes) were not expressed in phosphate-absent tomato (Solanum lycopersicum L.) when phosphite was present in the growth media[6,16]. In a study with Brassica spp., the enzyme (APase) and transporters (high-affinity plasmalemma phosphate translocator) of the phosphate starvation response were reduced by application of phosphite, with a 75% reduction in APase[16].
Although phosphite is not transformed to any other compound in the plant, in the soil it is converted to phosphate, with an approximate half-life of phosphite oxidation to phosphate of 12−16 weeks[21]. In that study soil microorganisms (such as Pseudomonas fluorescens) metabolized phosphite to phosphate[21]. Due to this slow conversion, some plants grew better in the second year or in subsequent crops, after applying phosphite fertilizer[5,22], as soil phosphite would have been converted to phosphate, subsequently available for plant uptake[17]. In other work, soil phosphate content increased slightly after 7 d (to 74 mg·kg−1) as compared to that measured in control plots (52 mg·kg−1) after applying 7.5 g·P·m−2 as KH2PO3 (potassium phosphite) solution. After 30 d, extractable
${\text{PO}}_4^{2-} $ Other than the work cited above[23] research that explores the conversion of soil phosphite to phosphate is essentially relegated to two early studies, with very limited data[15,21]. The work by Adams & Conrad was conducted on four soil types (San Joaquin clay loam, Aiken clay loam, Corning gravelly loam, Daulton sandy loam), but only data from the San Joaquin soil was reported. For the other soils it was only noted that 'comparable results were obtained'[21]. Since this early work showed that soil phosphite is converted to phosphate, more work which examines the rapidity with which this conversion occurs could be of value, especially in other soil types. This would allow agronomists to better consider the impact of long-term phosphite applications on soil phosphate, and possible effects on plant growth.
Phosphite is often applied in turfgrass systems, both as a fungicide and as a part of fertilizers marketed as 'stress control' products, with no stated fungicidal claim. The phosphite in such products is usually not included in the guaranteed analysis, and typically no P fertilizer value is accorded the phosphite (this will vary, by state and country). Given the lack of information on phosphite transformation in various soil types, and the possible effects on turfgrass growth, the objectives of this study were to: 1) evaluate phosphite applications in combination with rates of soil phosphate for effects on creeping bentgrass and perennial ryegrass performance, and, 2) conduct a laboratory incubation study to quantify the conversion of phosphite to phosphate.
-
Two runs of this study were conducted at the Plant Science Research Center (PSRC), under ambient light conditions (Auburn, AL, USA). The first experiment was conducted from 18 April 2014 to 10 June 2014 (7 weeks) and the second from 12 August 2015 until 22 September 2015 (6 weeks). For the first run (Run 1), an experimental unit was a single pot (14.5 cm diameter) containing 100% sand into which perennial ryegrass was seeded. Six weeks prior to the start of each experiment 1.8 g (0.11 kg·m−2) of 'Eagle Select' perennial ryegrass seed blend (cultivars were 'Playoff II', 'Allsport 3', and 'Greenville') were placed on top of 1365 g sand in each pot, and another 70 g of sand covered the seed.
As it's uncommon to have soil with zero P content in practice, for the second run (Run 2) the growth medium was changed from 100% sand used in Run 1 to a Marvyn loamy sand containing 19 mg·kg−1 P (fine-loamy, kaolinitic, thermic Typic Kanhapludult), with the experiment installed as described previously. Sand and soil were collected from the Auburn University Turfgrass Research Unit (Auburn, AL, USA). Before the start of the experiment, bulk soil samples were analyzed for nutrient content (Table 1).
Table 1. Initial soil-test results† for all soil used in greenhouse and laboratory experiments.
mg·kg−1 pH P K Ca Mg greenhouse-ryegras Run 1 0 2.5 28 2 7.4 Run 2 19 42 70.5 18.5 5.7 greenhouse- bentgrass Run 1 2 9 73.5 23.5 4.9 Run 2 2 10.5 110.5 31.5 4.7 laboratory incubation Marvyn
loamy sand2 36.5 464 35.5 6.5 †Mehlich 1 soil test extraction. Treatments were three commercial phosphite/phosphate sources: 1) Turfite (Headland Amenity Ltd., Caldecote, Cambridge, UK), 2) TKO (Growth Products, White Plains, NY, USA), and, 3) triple super phosphate (TSP) (Table 2). These three P sources were all applied at four P rates: 13, 26, 40, and 52 kg·P·ha−1. All materials were converted from phosphite- and phosphate-P content to a P basis for equal observation. Thus, P rates were based on P from phosphite/phosphate, phosphite, or phosphate, varying with source (Table 2). The study design was a completely randomized design with five replications used for each treatment.
Table 2. Nutrient/active ingredient content of phosphite/phosphate, phosphite and phosphate products for greenhouse perennial ryegrass, bentgrass, and laboratory soil incubation studies.
Commercial trade name Manufacturer Formulated from Percent P Percent
from PO3Percent
from PO4%N-P-K Studies Used Turfite Headland Amenity Ltd. Cambourne, Cambridgeshire, UK Phosphoric acid
Ammonium phosphate
Ammonium citrate8.9 75.9 24.1 8-9-0† ryegrass TKO Growth Products. White Plains, NY 10603, USA Phosphorous acid
Potassium hydroxide29.6 100 0 0-0-22† ryegrass soil Title Phyte Harrell's. Lakeland, FL 33802, USA Mono- and Di- Potassium phosphite 15.0§ 100 0 0-0-25† ryegrass bentgrass soil Alude Cleary Chemical, Dayton, NJ¶ 08810, USA Mono- and Di- Potassium Salts of Phosphorous Acid 11.0± 100 0 n/a bentgrass Triple super phosphate Piedmont Fertilizer Company. Opelika, AL 36801, USA Triple superphosphate 20.7 0 100 0-20-0 ryegrass soil † Guaranteed analysis does not include P contribution from phosphite. ¶ Manufacturer and formulation specifications for this product at the time of this work (newer product currently with NuFarm). § Calculated on 571 g·H3PO3·L−1, 1,455 g·L−1. ± Calculated on 401 g·H3PO3·L−1, specific gravity of 1.35. Phosphorus treatments were incorporated with soil once at the beginning of the study before seeding, and all other nutrients were supplied weekly via a P-depleted Hoagland's nutrient solution, applied at 20 ml per pot to supply 4.2 mg·N·pot−1 (0.2 g·N·m−2) per week. Treatments were not balanced to uniformity for added N or K, since Hoaglands solution was used. Turfgrass was watered as needed to prevent turfgrass stress. All pots were placed randomly on the greenhouse bench every day, after watering or observation.
In both runs, clippings were harvested twice (monthly). Dry weight of clippings was recorded and clippings were saved for tissue P analyses, following standard procedures[24], followed by analysis via inductively coupled argon plasma spectrometry[24]. Phosphorus uptake in above-ground plant tissue was determined (for each separate harvest) by multiplying tissue dry weight by phosphorus concentration.
Greenhouse study 2 – creeping bentgrass (Agrostis stolonifera)
-
This study was conducted twice, using creeping bentgrass that was established as vegetative samples (7 cm diameter) in 14 cm (height) by 14.5 cm (diameter) pots. Bentgrass ('Penn G-2') was collected from a 5-year-old putting green (maintained at a cutting height of 0.3 cm, with cutting 6 of 7 d) at the Auburn University Turfgrass Research Unit (Auburn, AL, USA) on 17 July, 2015 and 22 Sept, 2015 (for each of two separate runs). Plugs were washed clean of soil, and were placed into pots filled with a USGA-type greens mix[25]. Pots were filled with 500 g of a USGA-type mix (80% sand/20% reed sedge v/v). Soil test analyses are in Table 1. The experiment was conducted in the greenhouse (Plant Science Research Center, Auburn, AL, USA), using ambient light.
This study consisted of two Runs, with the first conducted from 29 July to 22 Sept, 2015 (8 weeks), and the second from 1 Oct to 23 Nov, 2015 (7 weeks), with the experiment started anew in each Run. Clippings of bentgrass were collected once at the end of each Run (the bentgrass was not clipped for the duration of the experiment), with dry weight of clippings recorded, and saved for tissue P analyses (ICP)[24]. Roots were saved for dry weight determination. Phosphorus uptake was also determined by multiplying tissue dry weight by phosphorus concentration.
Treatments were 5 P rates, all as triple superphosphate (0, 15, 30, 60, 120 kg·P·ha−1), with and without phosphite sources that were applied at labeled fungicidal or product rates (Table 2). Phosphite products were Alude (a phosphite fungicide) and Title Phyte (fertilizer containing phosphite). Following labeled directions, Alude was sprayed every other week (three applications) and Title Phyte was applied weekly (six applications), at labeled rates. These rates were 3.2 ml Alude per m2 and 1.3 ml Title Phyte per m2 (approximately 5.0 kg·P·ha−1 in each Alude treatment, and 3.5 kg·P·ha−1 in each Title Phyte treatment). All other nutrients were supplied weekly via a P-depleted Hoaglands solution, applied at 20 ml per pot (4.2 mg N) per week. Pots were watered every day to prevent turfgrass stress, and rerandomized on the greenhouse bench weekly (completed randomized design with five replications).
Soil incubation study
-
This study was initiated on 2 July 2014, and continued until 15 January 2015. The study was conducted using sealable plastic tubs (17 × 15 × 13 cm) to which soil and treatments had been added. One soil type was used: a Marvyn loamy sand (Fine-loamy, kaolinitic, thermic Typic Kanhapludult). Initial nutrient content of this soil is shown in Table 1. Three phosphite or phosphate sources (Triple super phosphate, TKO, and Title Phyte) were all applied at four P rates: 56, 84, 112, and 140 kg·P·ha−1 (Table 2). All phosphite and phosphate in the products were converted to a P-basis for uniformity and rate calculations.
Each tub was filled with 500 g of soil, and watered uniformly to 80% of field capacity. All materials were applied and mixed thoroughly with the soil. Each tub was sealed and placed into a growth chamber set to a constant 21 °C temperature. Each week tubs were removed, opened to stimulate air movement, and resealed. Tubs were replaced randomly in the growth chamber.
After 20 d of incubation, soil samples were taken every month, with soil in each tub mixed thoroughly before sampling. Each month the following was carried out: 1) a 2 g subsample was removed and dried to measure soil moisture content, 2) a 5 g subsample was extracted with CaCl2 (50 ml 0.01 M), and, 3) a 5 g subsample was extracted with Mehlich I soil extract[26]. Samples were analyzed for P via two methods. First was the determination of P via inductively coupled argon plasma spectrometry (ICP)[27]. Second was the separate measurement of phosphite and phosphate via ion chromatography (IC)[27].
Data were analyzed through two-way ANOVA by using the general linear model (PROC GLM) in SAS for most analysis (SAS Institute, Cary, NC, USA), and Harvest was included as another factor when applicable. Since the greenhouse experiments were repeated in time (perennial ryegrass and bentgrass) the data was first analyzed to determine if there were significant differences due to experiment Run, and in every case there were differences. Thus, data is shown by Run, and then averaged over treatment if the interaction between treatments (P Rate and P source) was not significant. An ANOVA table for ryegrass and bentgrass study can be found in Table 3. If the interaction was significant then that data is shown through a table or figure of interaction effects. Data with continuous variables (P Rate) was analyzed by and is shown as regression analyses, while mean separation was used to separate differences due to P sources. Clipping data (dry weight) was summed for multiple harvests (ryegrass), and then analyzed. Since tissue P content was analyzed for each harvest, that data is shown by harvest for each Run (ryegrass).
Table 3. ANOVA table for perennial ryegrass and creeping bentgrass studies.
Source ANOVA Ryegrass study Top growth Dry weight Tissue P content P uptake Run1 Run2 Run1 Run 2 Run1 Run2 Harvest (H) − − * * NS ** P rate (R) NS ** * ** NS ** P source (S) NS * * ** * ** R × P NS ** NS NS NS ** H × R − − NS NS NS * H × S − − * * NS * H × R × P − − NS NS NS * Source Bentgrass study Tissue dry weight Tissue P content P uptake Root dry weight Run1 Run2 Run1 Run2 Run1 Run2 Run1 Run2 P rate (R) NS NS ** ** * *** NS NS P source (S) *** *** *** *** *** *** ** * R × P NS NS ** ** ** ** * *** *Significant at P = 0.05; ** significant at P = 0.01; *** significant at P = 0.001; NS = nonsignificant at P = 0.05. -
For Run 1 of the study, the total dry weight of ryegrass topgrowth (both harvests combined and weighed) was unaffected by P Rate, P source, or their interaction, possibly due to overall low plant available P content, as the study was conducted in 100% sand with zero soil P (data not shown). However, in Run 2, when the study was conducted in loamy sand with 19 mg·kg−1 soil P, the interaction of P Rate and P source was significant (P = 0.04), and those results are shown in Table 4. For two P products (Turfite and TSP) the addition of P increased perennial ryegrass growth, to a P rate of 40 kg·ha−1. Both the Turfite and TSP sources contained fertilizer phosphate (Table 2), and thus that P would have been available for plant use and growth. The TKO only supplied P as phosphite (Table 2), and lack of a plant response may have been due to the time required to conversion of phosphite to phosphate[21]. The studies in this research were conducted for 8 weeks, which was the minimum time previously found for significant conversion of soil phosphite to phosphate[23].
Table 4. Effect of P rate and P source (TSP (phosphate), TKO (phosphite), Turfite (phosphate/phosphite)) on the dry weight of perennial ryegrass topgrowth. Run 2 of a greenhouse experiment.
P Rate
(kg·ha−1)Dry weight of topgrowth (g) P source Turfite TKO TSP 0 0.28 0.28 0.28 13 0.37 ab†† 0.41 a 0.32 b 26 0.39 a 0.43 a 0.40 a 40 0.48 a 0.36 b 0.41 ab 52 0.43 a 0.39 a 0.36 a Regression Q† NS Q † From linear regression (each column), Q = significant quadratic response within each P source; NS – no linear or quadratic response. †† From mean separation, means followed by the same letter are not significantly different from each other (alpha = 0.05), between P sources (each row), within each P rate. Tissue P and P uptake
-
Tissue P and P uptake (tissue P x dry weight) results were similar to that found with dry matter yield. That is, in Run 1 of the experiment the interaction between P rate and P source was not significant for tissue P or P uptake (either of the two harvests). In Run 2 the interaction of P rate and P source was significant for P uptake (P = 0.07 and 0.02 for harvests 1 and 2, respectively), but not for tissue P content (P = 0.91 and 0.43).
Since tissue P content was not a part of significant interactions, main effects can be discussed. For tissue P, in every harvest of both Runs tissue P linearly increased as P rate increased (data not shown). This is not surprising, as initial soil-test P was low (0 and 19 mg·P·kg−1, for the two soils, respectively)[28], and so in both cases P fertilization would have been recommended. Across both Runs, average tissue P was 2,509 mg·kg−1 in ryegrass not fertilized with P, increasing to 7,754 mg·kg−1 in ryegrass fertilized with 52 kg·P·ha−1. When the P source (TSP, TKO or Turfite) was significant (as was in Run 1, Harvest 1 and Run 2, Harvest 2), tissue P concentrations occurred in the following significant order: P in ryegrass fertilized by TSP > than that found in ryegrass fertilized by TKO or Turfite > than that measured in ryegrass receiving no P (P = 0.05). Since the most phosphate was supplied as TSP this is a likely effect. Only ¼ of P from Turfite was phosphate, and there was no phosphate in the TKO (Table 2).
For P uptake, only the main effect of P source was significant in Run 1, while the interaction of P source and P rate was significant in Run 2 (both harvests). In Run 1 P uptake followed the results found with tissue P, with greatest P in ryegrass fertilized with TSP, followed by P in ryegrass fertilized with either TKO or Turfite, which was greater than P uptake from unfertilized ryegrass (data not shown). Within the interaction, in Run 2, Harvest 1, ryegrass fertilized with TSP or Turfite had greater uptake of P as P rate increased (Table 5), a response not observed when TKO was applied. This response was likely a fact that both Turfite and TSP contained some amount of fertilizer phosphate, while TKO only contained phosphite, which is not an immediate fertilizer nutrient. At the second harvest, which occurred at 8 weeks of growth, P uptake increased as a function of P rate in every P source, likely a result of the conversion of applied phosphite to phosphate within that time period[15,21,23].
Table 5. Effect of P rate and P source (TSP (phosphate), TKO (phosphite), Turfite (phosphate/phosphite)) on P uptake by perennial ryegrass as affected by P source, two harvests in Run 2 of the experiment.
P source P rate
(kg·ha−1)Tissue P uptake (mg−1·pot−1) Turfite TKO TSP Harvest 1, Run 2 0 0.03 0.03 0.03 13 0.12 0.14 0.09 26 0.18 0.17 0.17 40 0.15 0.10 0.19 52 0.15 0.12 0.26 Regression Q† NS L Harvest 2, Run 2 0 0.02 0.02 0.02 13 0.11 a 0.08 a 0.08 a 26 0.17 a 0.15 a 0.13 a 40 0.30 a 0.17 b 0.15 b 52 0.32 a 0.23 b 0.17 c Regression L L L † From regression, L= significant linear, or Q = quadratic response within each P source and Harvest/Run, NS = not significant. Greenhouse bentgrass study
Dry weight of plant tissue
-
In both Runs the dry weight of bentgrass tissue was unaffected by P rate, and the interaction of P rate and P source was not significant (Table 3). Application of phosphite materials at labeled rates/timing never decreased tissue yield, and in some cases yield was increased. For example, in Run 1 the application of Alude increased dry weight of clippings (when compared to the control) at P rates of 15, 60 and 120 kg·P·ha−1. In Run 2 this same effect was observed at 0, 15, 30, and 60 kg·P·ha−1. While the active ingredient of TitlePhyte is similar to Alude, application of TitlePhyte was less likely to increase yield, and such effects were only significant at 120 kg·P·ha−1 (Run 1) and 0 kg·P·ha−1 (Run 2). Averaged over all rates of P fertilization and both Runs, the average dry weight of bentgrass tissue was 1.2, 1.3, and 1.6 g per pot for bentgrass which received no treatment, TitlePhyte, or Alude, respectively (P = 0.07).
Tissue P and P uptake
-
For both tissue P and P uptake, the interaction of P rate and phosphite addition was significant (P = 0.05). Results for tissue P and P uptake were the same, and so only P uptake will be discussed.
As P rate increased both tissue P and P uptake increased, but only in the treatments not receiving supplemental phosphite (Fig 1). Once phosphite was applied, P uptake was always significantly greater than that measured in bentgrass not receiving any phosphite. Tissue data was collected after 8 (Run 1) or 7 (Run 2) weeks of growth, and some portion of applied phosphite may have been converted to phosphate by that point, thus being utilized by the bentgrass.
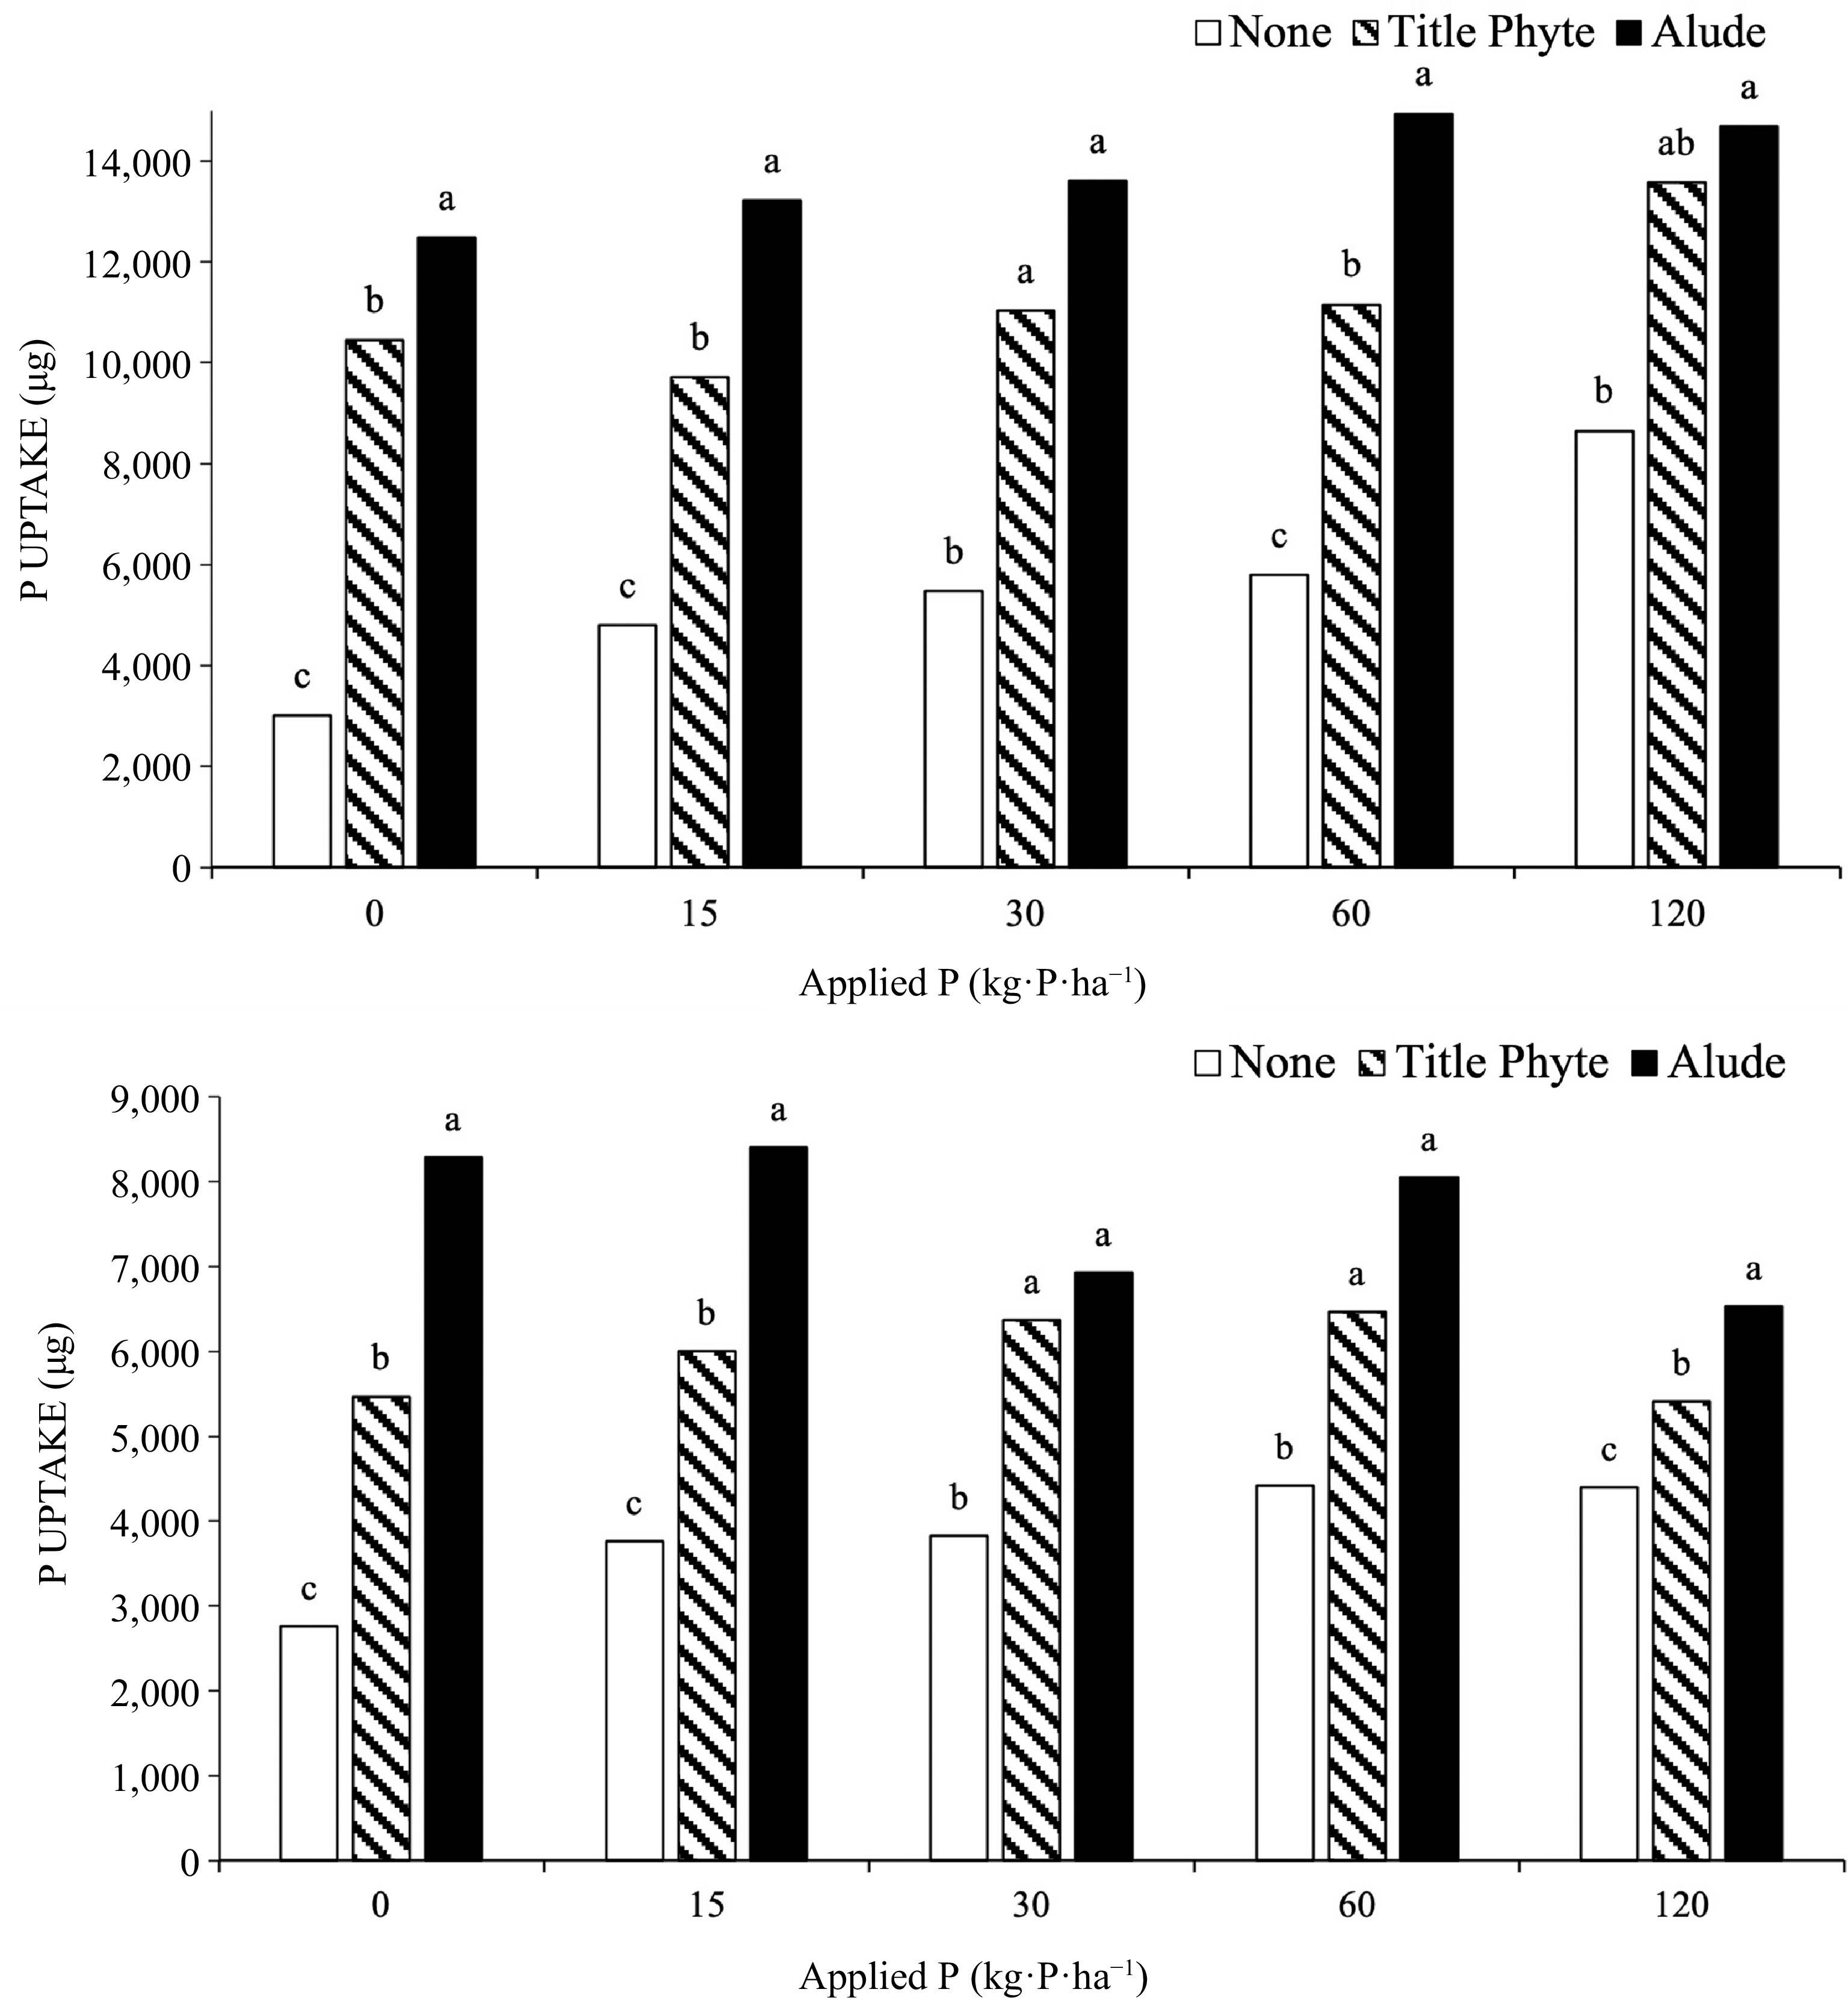
Figure 1.
Effect of P rate (provided through TSP) and phosphite products on P uptake by creeping bentgrass, Run 1 (top) and Run 2 (bottom). Treatments with the same letter above the bars are not significantly different (α = 0.05) within an experiment and each rate of P fertilization.
In these experiments labeled application rates/timings were followed, so that Alude was applied biweekly, three times, at 3.2 mL·product·m−2 for a total of 15 kg·P·ha−1 applied (P was all phosphite). TitlePhyte was applied weekly, six times at 1.3 mL·product·m−2, for a total of 21 kg·P·ha−1 (P was phosphite). Phosphorus uptake was not directly linked to these P rates, as bentgrass to which Alude was applied often had greater P uptake (Fig 1). For P uptake, this was partly due to the fact that bentgrass to which Alude was applied had more tissue growth. As with the ryegrass experiments, the application of phosphite products, even in the presence of very low soil phosphate, did not negatively affect bentgrass shoot growth.
Dry weight of roots
-
In both Runs the interaction of P rate and phosphite application was significant (Fig 2). When no phosphate was added root growth was reduced when a phosphite product was applied. This was significant in both runs for the application of Alude, and in Run 1 for the application of TitlePhyte (Fig 2). In general, as P rate increased above 15 kg·P·ha−1 this effect was largely gone, and root growth was generally unaffected by phosphite application, in the presence of phosphate.
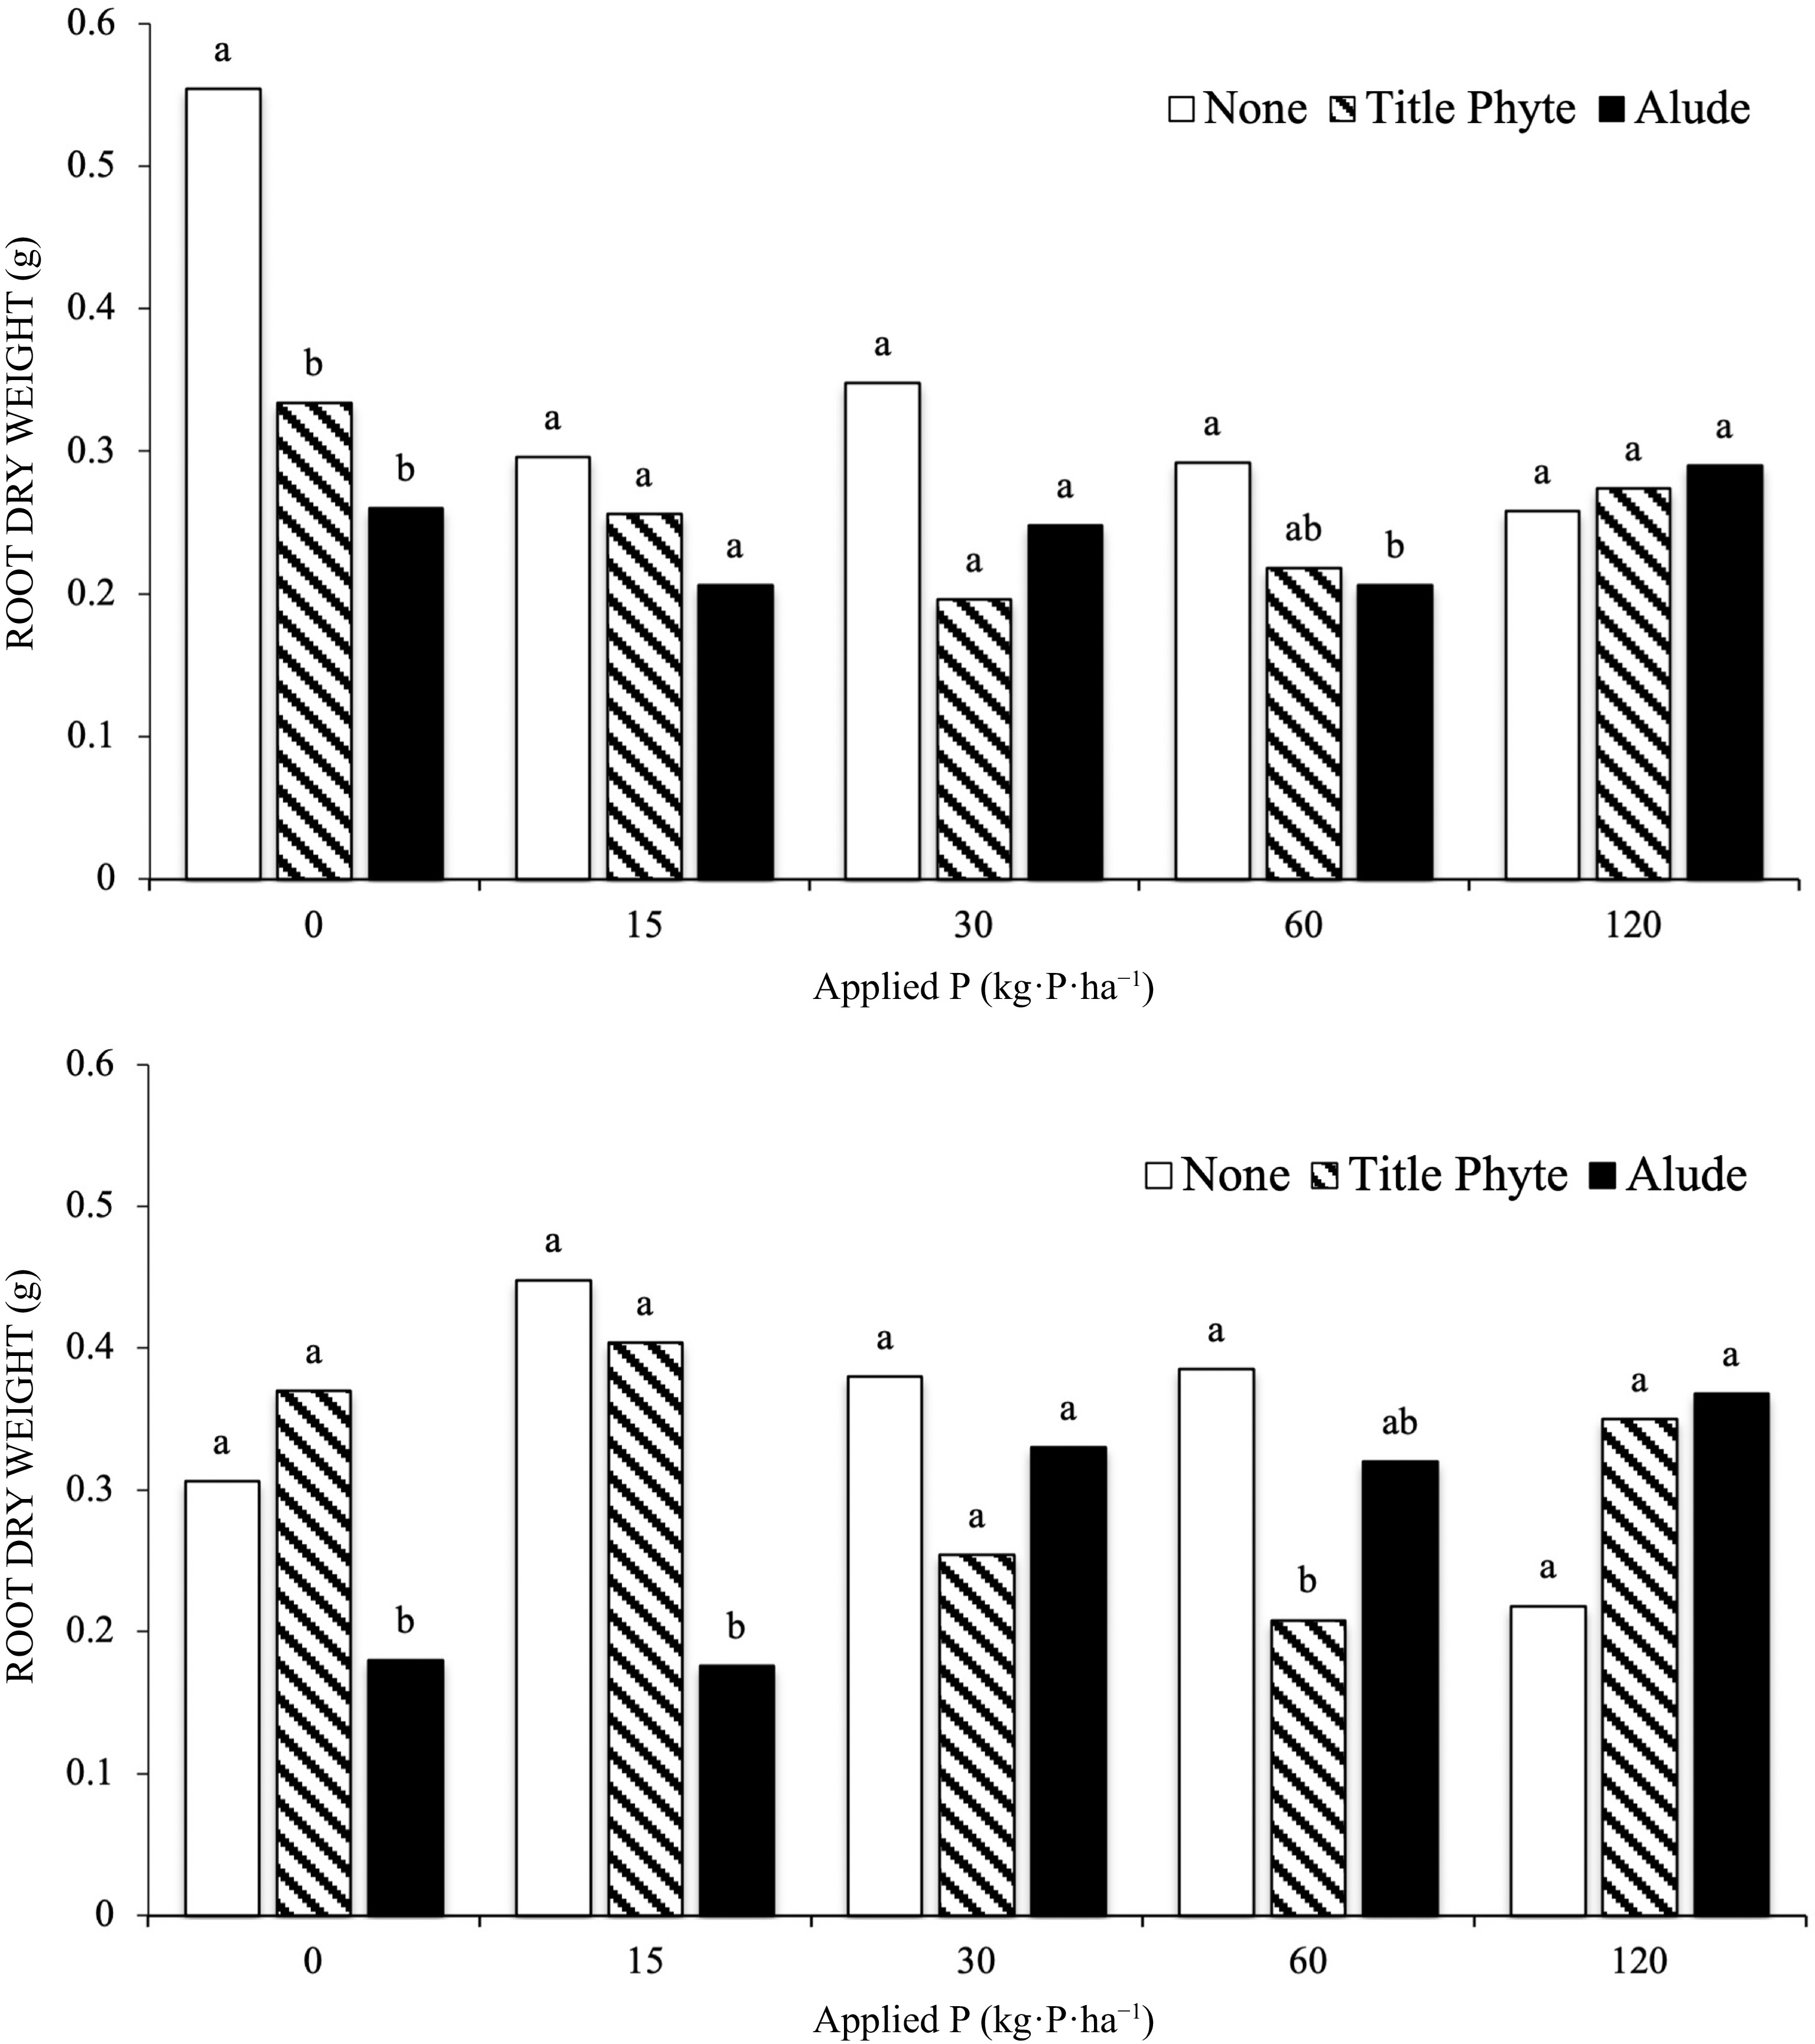
Figure 2.
Effect of P rate (provided through TSP) and phosphite products on creeping bentgrass root dry weight, Run 1 (top) and Run 2 (bottom). Treatments with the same letter above the bars are not significantly different (α = 0.05) within an experiment and each rate of P fertilization.
This effect – that plant growth parameters are negatively affected by greater amounts of phosphite when phosphate is limited, has been shown previously[17,18,29,30], and specifically for roots (Brassica rape var. peruviridis)[14]. Our result with bentgrass is similar to this cited work, as root growth was reduced when phosphite was applied, in the presence of low levels of phosphate. Initial soil-test P was 2 mg·kg−1 for this work, well below the level at which P fertilization would be recommended (Table 1). Thus, simply providing some amount of recommended P fertilizer would eliminate this negative effect. This effect was not observed in the ryegrass experiments.
Incubation study
-
Two soil extractions were used for the incubation study: CaCl2, for a relative measure of weakly sorbed and solution P, and Mehlich-1, the common soil-test extractant used in the southeastern United States[24]. Use of CaCl2 extracted low amounts of measurable P, which were not high enough for subsequent phosphite and phosphate analyses via ion chromatography. Thus, Mehlich-1 extracts were used for subsequent IC analyses.
Soil treated with either phosphite material (TKO or TitlePhyte) had exactly the same response over time, and so only results from the TSP and TKO treatments are shown (Fig 3). When the phosphite material was added to soil it became undetectable after one month. The conversion of phosphite to phosphate was essentially complete in that first month, and this was the same in both phosphite treatments (TKO or TitlePhyte).
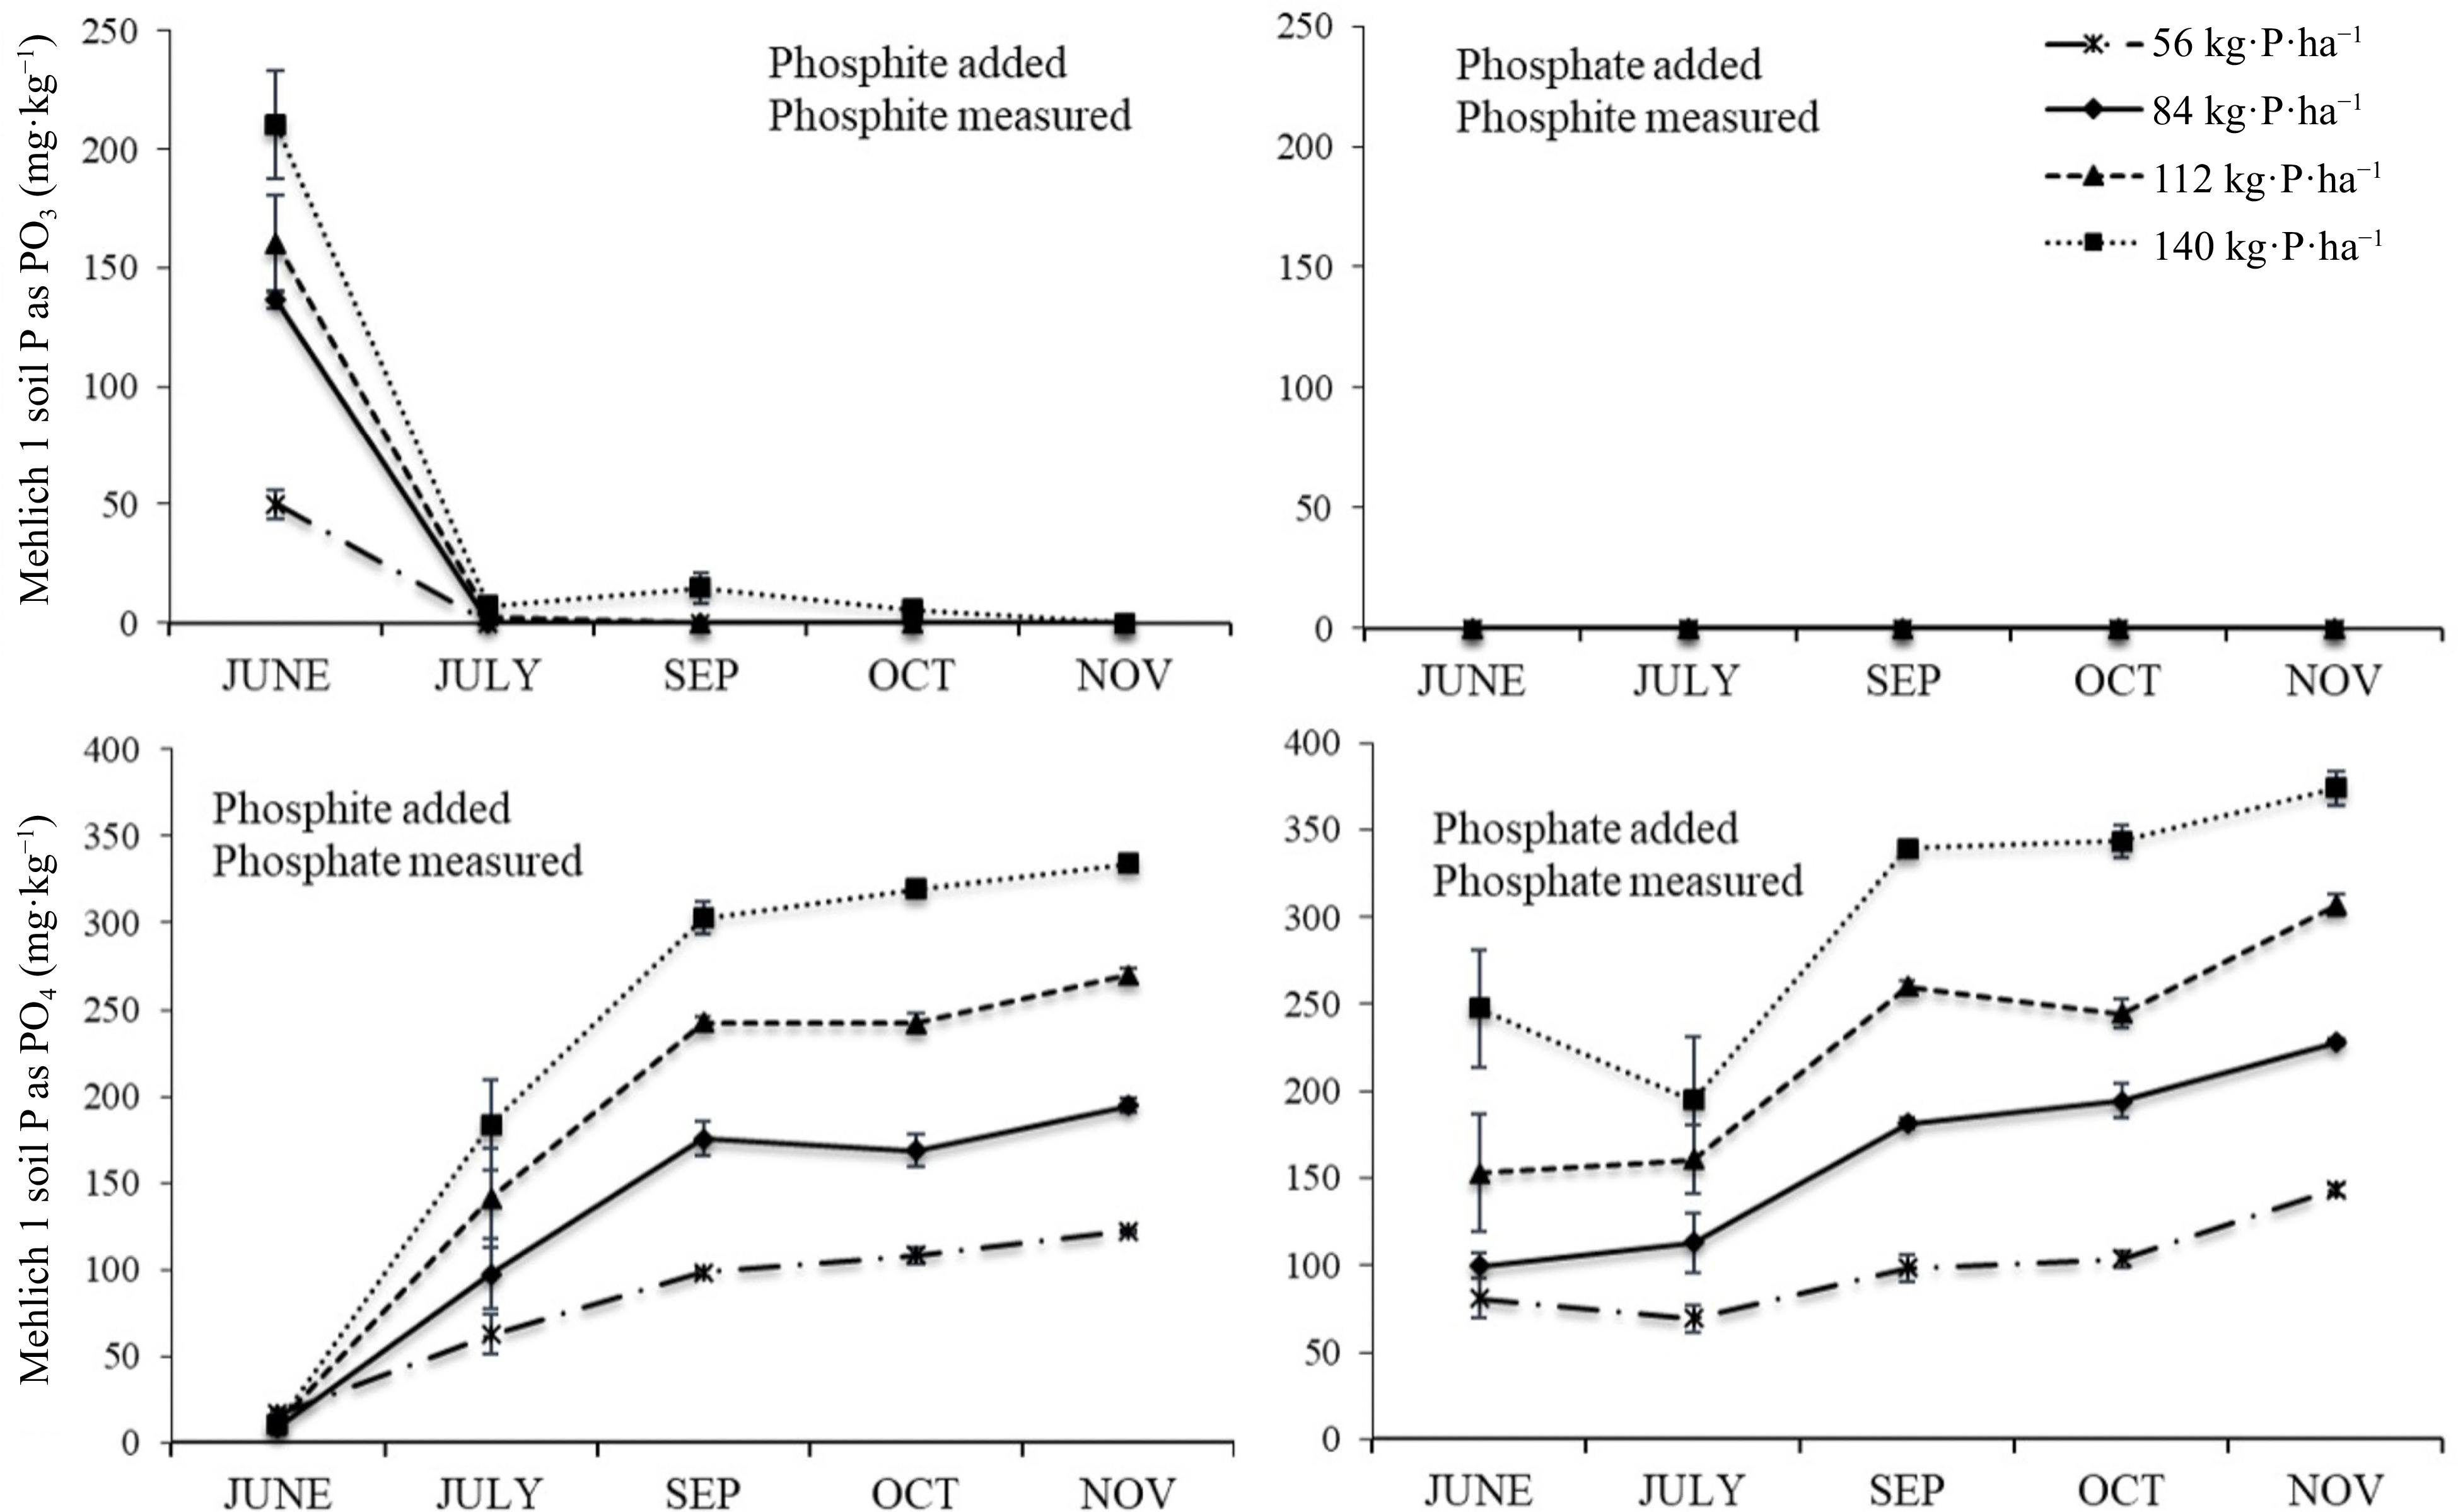
Figure 3.
Mehlich-1 extractable phosphite (top) and phosphate (bottom) as affected by the addition of phosphite supplied as TKO (left) or phosphate supplied as TSP (right) at four rates of P.
The inclusion of the phosphate-only treatment shows the lack of conversion when phosphite was not present (Fig 3). As expected, extractable P increased as P rate increased, and there was also a slight increase over time.
This study found a more rapid conversion of phosphite than found in the small number of previous studies. In one paper extracted phosphite was halved over a 16 week incubation period, driven by a wide range of soil microorganisms[21]. In work with alfalfa (Medicago sativa L.) separate fertilizations with phosphite and phosphate (no factorial treatments were included) found that growth in phosphite-treated soil did not equal that from phosphate-treated soil until 90 d (~13 weeks) after fertilization with the phosphate or phosphite[22]. In other work, applications of various phosphite materials were detrimental to initial plantings of red clover (Trifolium pratense L. var. sativum (Mill.)), ryegrass (Lolium multiflorum L.) and alfalfa, and toxicity was most evident when phosphite applications were high. However, subsequent crops were unaffected by residual phosphite, reflecting the transformation of phosphite to phosphate in the soil[15]. Unfortunately, the exact length of each experiment was not provided in the paper, but included photographs and crop descriptions allow estimates of 8 to 16 weeks before planting of the second crops. It was also noted that the conversion of phosphite to phosphate was more rapid in a limed soil (soil pHs not given) than unlimed[15].
In this study, the majority of phosphite was converted to phosphate within 30 d. This is more rapid than results from previous studies, which found a half-life of 3–4 months[21]. Based on their work, the oxidation of phosphite to phosphate in soil was largely due to the microbial activity within soil. The soil used in this study (Maryvn loamy sand) was different from the soil used in previous studies, so different soil-dwelling bacteria may have a particular microbial activity thus affecting the time of oxidation of phosphite to phosphate.
Sufficient research has shown that, in the presence of low soil phosphate, application of phosphite may negatively affect plant growth. Most often, this was shown in cell culture[16], growth media[6], or hydroponic experiments[14,17,18,31]. When studies were done in soil, negative effects from applied phosphite were more mixed. In some cases, application of phosphite in low phosphate soil negatively affected plant growth[14,18,20], while in other work, application of phosphite did not suppress or promote strawberry (Fragaria x ananassa Duch.) growth[32]. Typically, when phosphite did not create a negative effect, it was because soil phosphate was adequate for plant growth[9,11], or because phosphate was not included as a factorial treatment variable in the study[32].
In this work the addition of phosphite, even when soil phosphate was minimal had no negative effect on ryegrass shoot or root growth, or bentgrass shoot growth. This may be a function of our rates. In soil-based work, negative effects of phosphite (in low phosphate conditions) were observed at phosphite rates of 75 and 150 kg·P·ha−1, regardless of the soil phosphate status[20]. In contrast, our highest rate of phosphite was 52 kg·P·ha−1, for the ryegrass study.
Additionally, plant species clearly has a role. We observed no significant negative effects from the application of phosphite in our ryegrass work, and in fact what is likely beneficial fungicidal effects were observed. However, in the bentgrass, root length was shortened when labeled rates of phosphite-containing materials were applied, but only when phosphate was extremely low in the soil. The P soil-test result in the soil mix for the bentgrass work would have certainly resulted in a recommendation for the application of P fertilizer, which would have eliminated any negative effects from the phosphite applications.
-
In this work, the application of phosphite materials at labeled and recommended rates did not negatively affect the topgrowth of perennial ryegrass or creeping bentgrass. While the root growth of bentgrass was reduced when phosphite was applied, this only occurred at soil-test phosphate levels that were minimal. Thus, for turfgrass managers, it is important to determine soil test phosphorus levels if phosphite-containing products are a regular part of their application program as our results have shown the negative effects of phosphite applications when soil P is low. Application of P fertilization would rectify this issue. Conversion of applied phosphite, in the soil, to phosphate occurs more quickly than measured in previous work. We measured almost 100% conversion of soil phosphite to phosphate within 30 d. This effect needs additional work, in a wide range of soils, and with more frequent sampling times, in a wider range of soils, to better understand the process.
-
The authors declare that they have no conflict of interest.
- Copyright: © 2023 by the author(s). Published by Maximum Academic Press, Fayetteville, GA. This article is an open access article distributed under Creative Commons Attribution License (CC BY 4.0), visit https://creativecommons.org/licenses/by/4.0/.
-
About this article
Cite this article
Chang B, Guertal E. 2023. Phosphite, phosphate, and their interactions in soil and turfgrass. Grass Research 3:13 doi: 10.48130/GR-2023-0013 

Phosphite, phosphate, and their interactions in soil and turfgrass
- Received: 31 March 2023
- Accepted: 24 May 2023
- Published online: 02 August 2023
Abstract: Phosphate (H3PO4) is the recognized P fertilizer source, while phosphite (phosphorous acid) (H3PO3) is often considered and labeled as a fungicide. However, the exact role of phosphite is unclear - is it functioning as a fertilizer, fungicide, or both? In turfgrass maintenance, phosphite is sometimes included in fertilizers, with no specific fungicidal claims attached. Previous work has shown that applications of phosphite can be detrimental to plant growth, especially if soil is low in phosphate. In the soil, phosphite will convert to phosphate, but the time required for that conversion is not well quantified. Thus, project objectives were: 1) evaluate how application of phosphite, phosphate and their combination affected turfgrass growth, and, 2) quantify the conversion of applied phosphite to phosphate, in soil. Two greenhouse studies and one soil incubation study were used to evaluate phosphite and phosphate, and their combined and separate effects on ryegrass and bentgrass, and soil conversion. Phosphite materials (labeled fungicides and phosphite-containing fertilizers) were applied based on P rate or at labeled rates. In the soil incubation study, phosphite was converted to phosphate within one month. In the greenhouse trials ryegrass was unaffected or positively benefited by application of phosphite, even at low levels of soil phosphate. In the bentgrass trials, root growth was reduced when phosphite was applied, but only when soil-test phosphate was < 2 mg·kg−1. When ryegrass and bentgrass were fertilized with any level of phosphate (> 15 kg·P·ha−1) deleterious effects of phosphite on plant growth were not observed.
-
Key words:
- Ryegrass /
- Bentgrass /
- Phosphite /
- Phosphate /
- Soil incubation /
- Phosphorus uptake