-

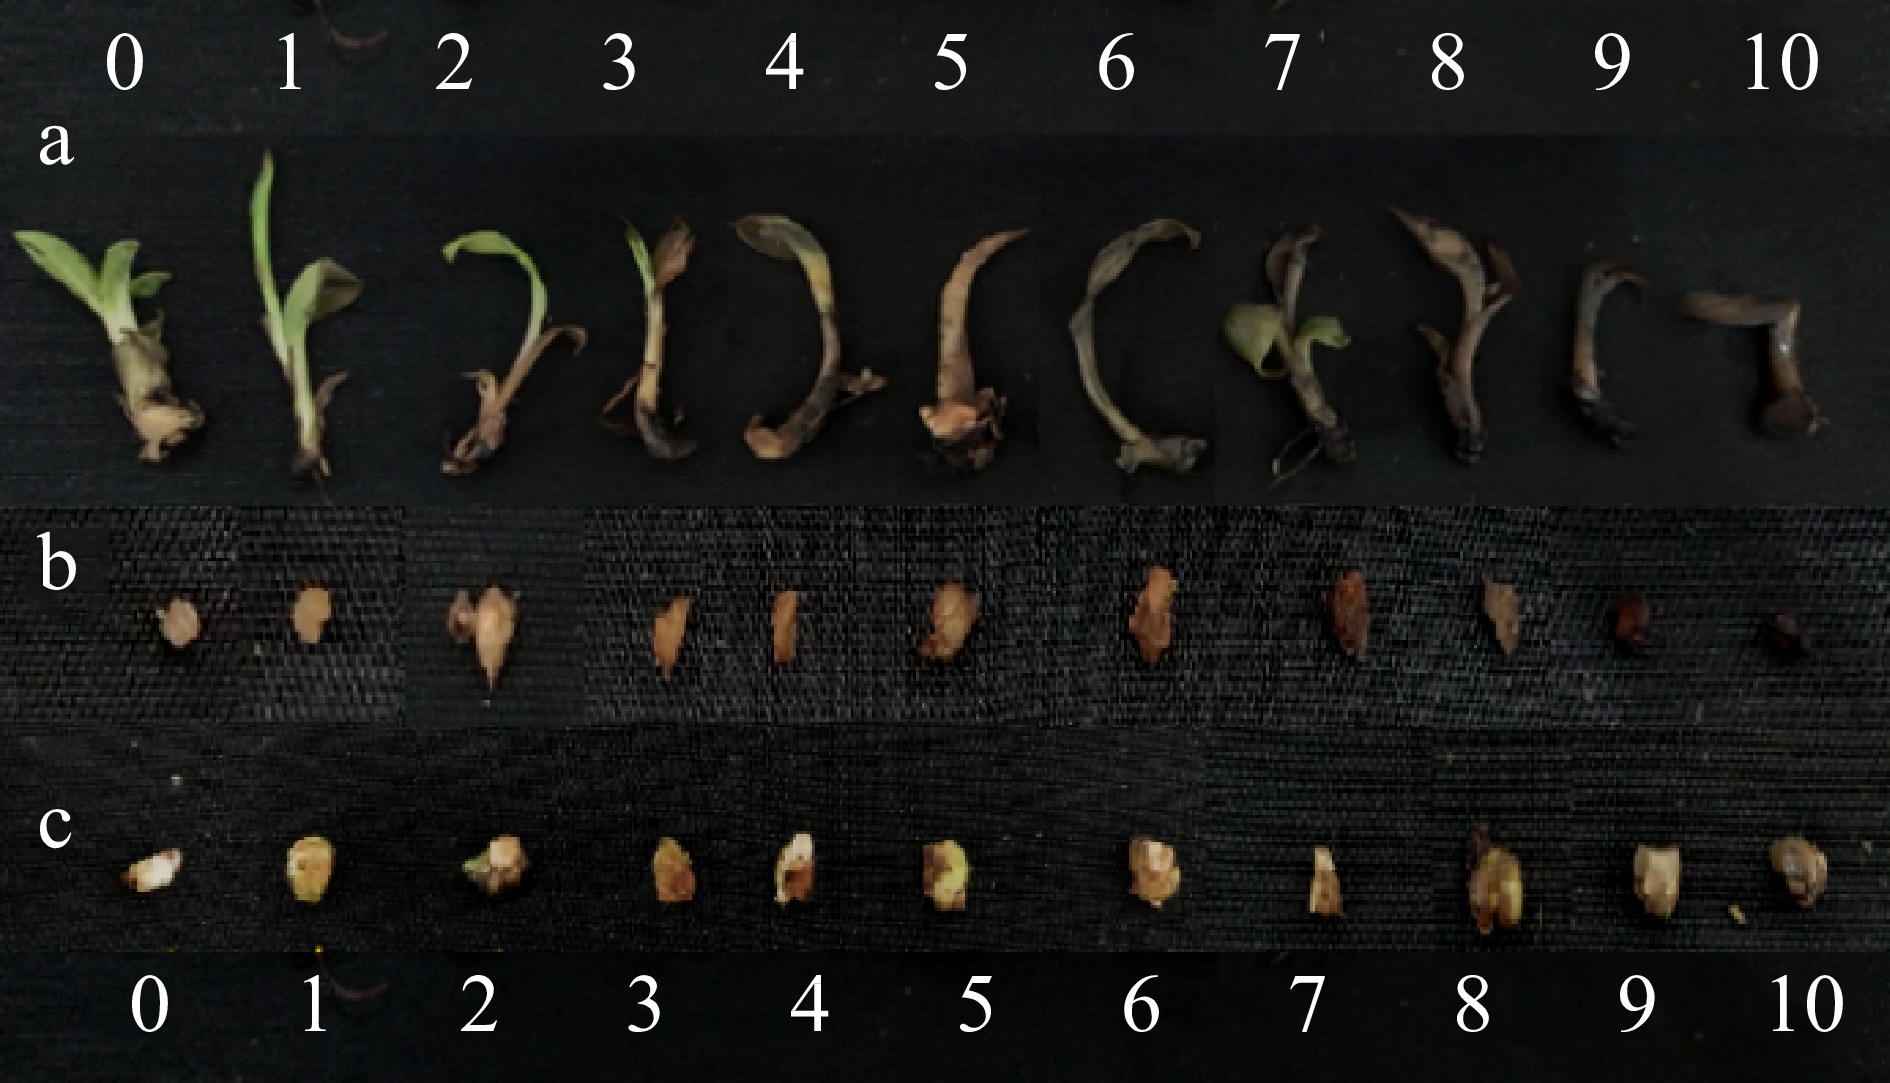
Figure 1.
Ten point rating scales produced in this study for measuring degree of wilting in (a) tissue cultured plantlets, (b) calli, and (c) multiple bud clumps, as caused by Fusarium toxins.
-

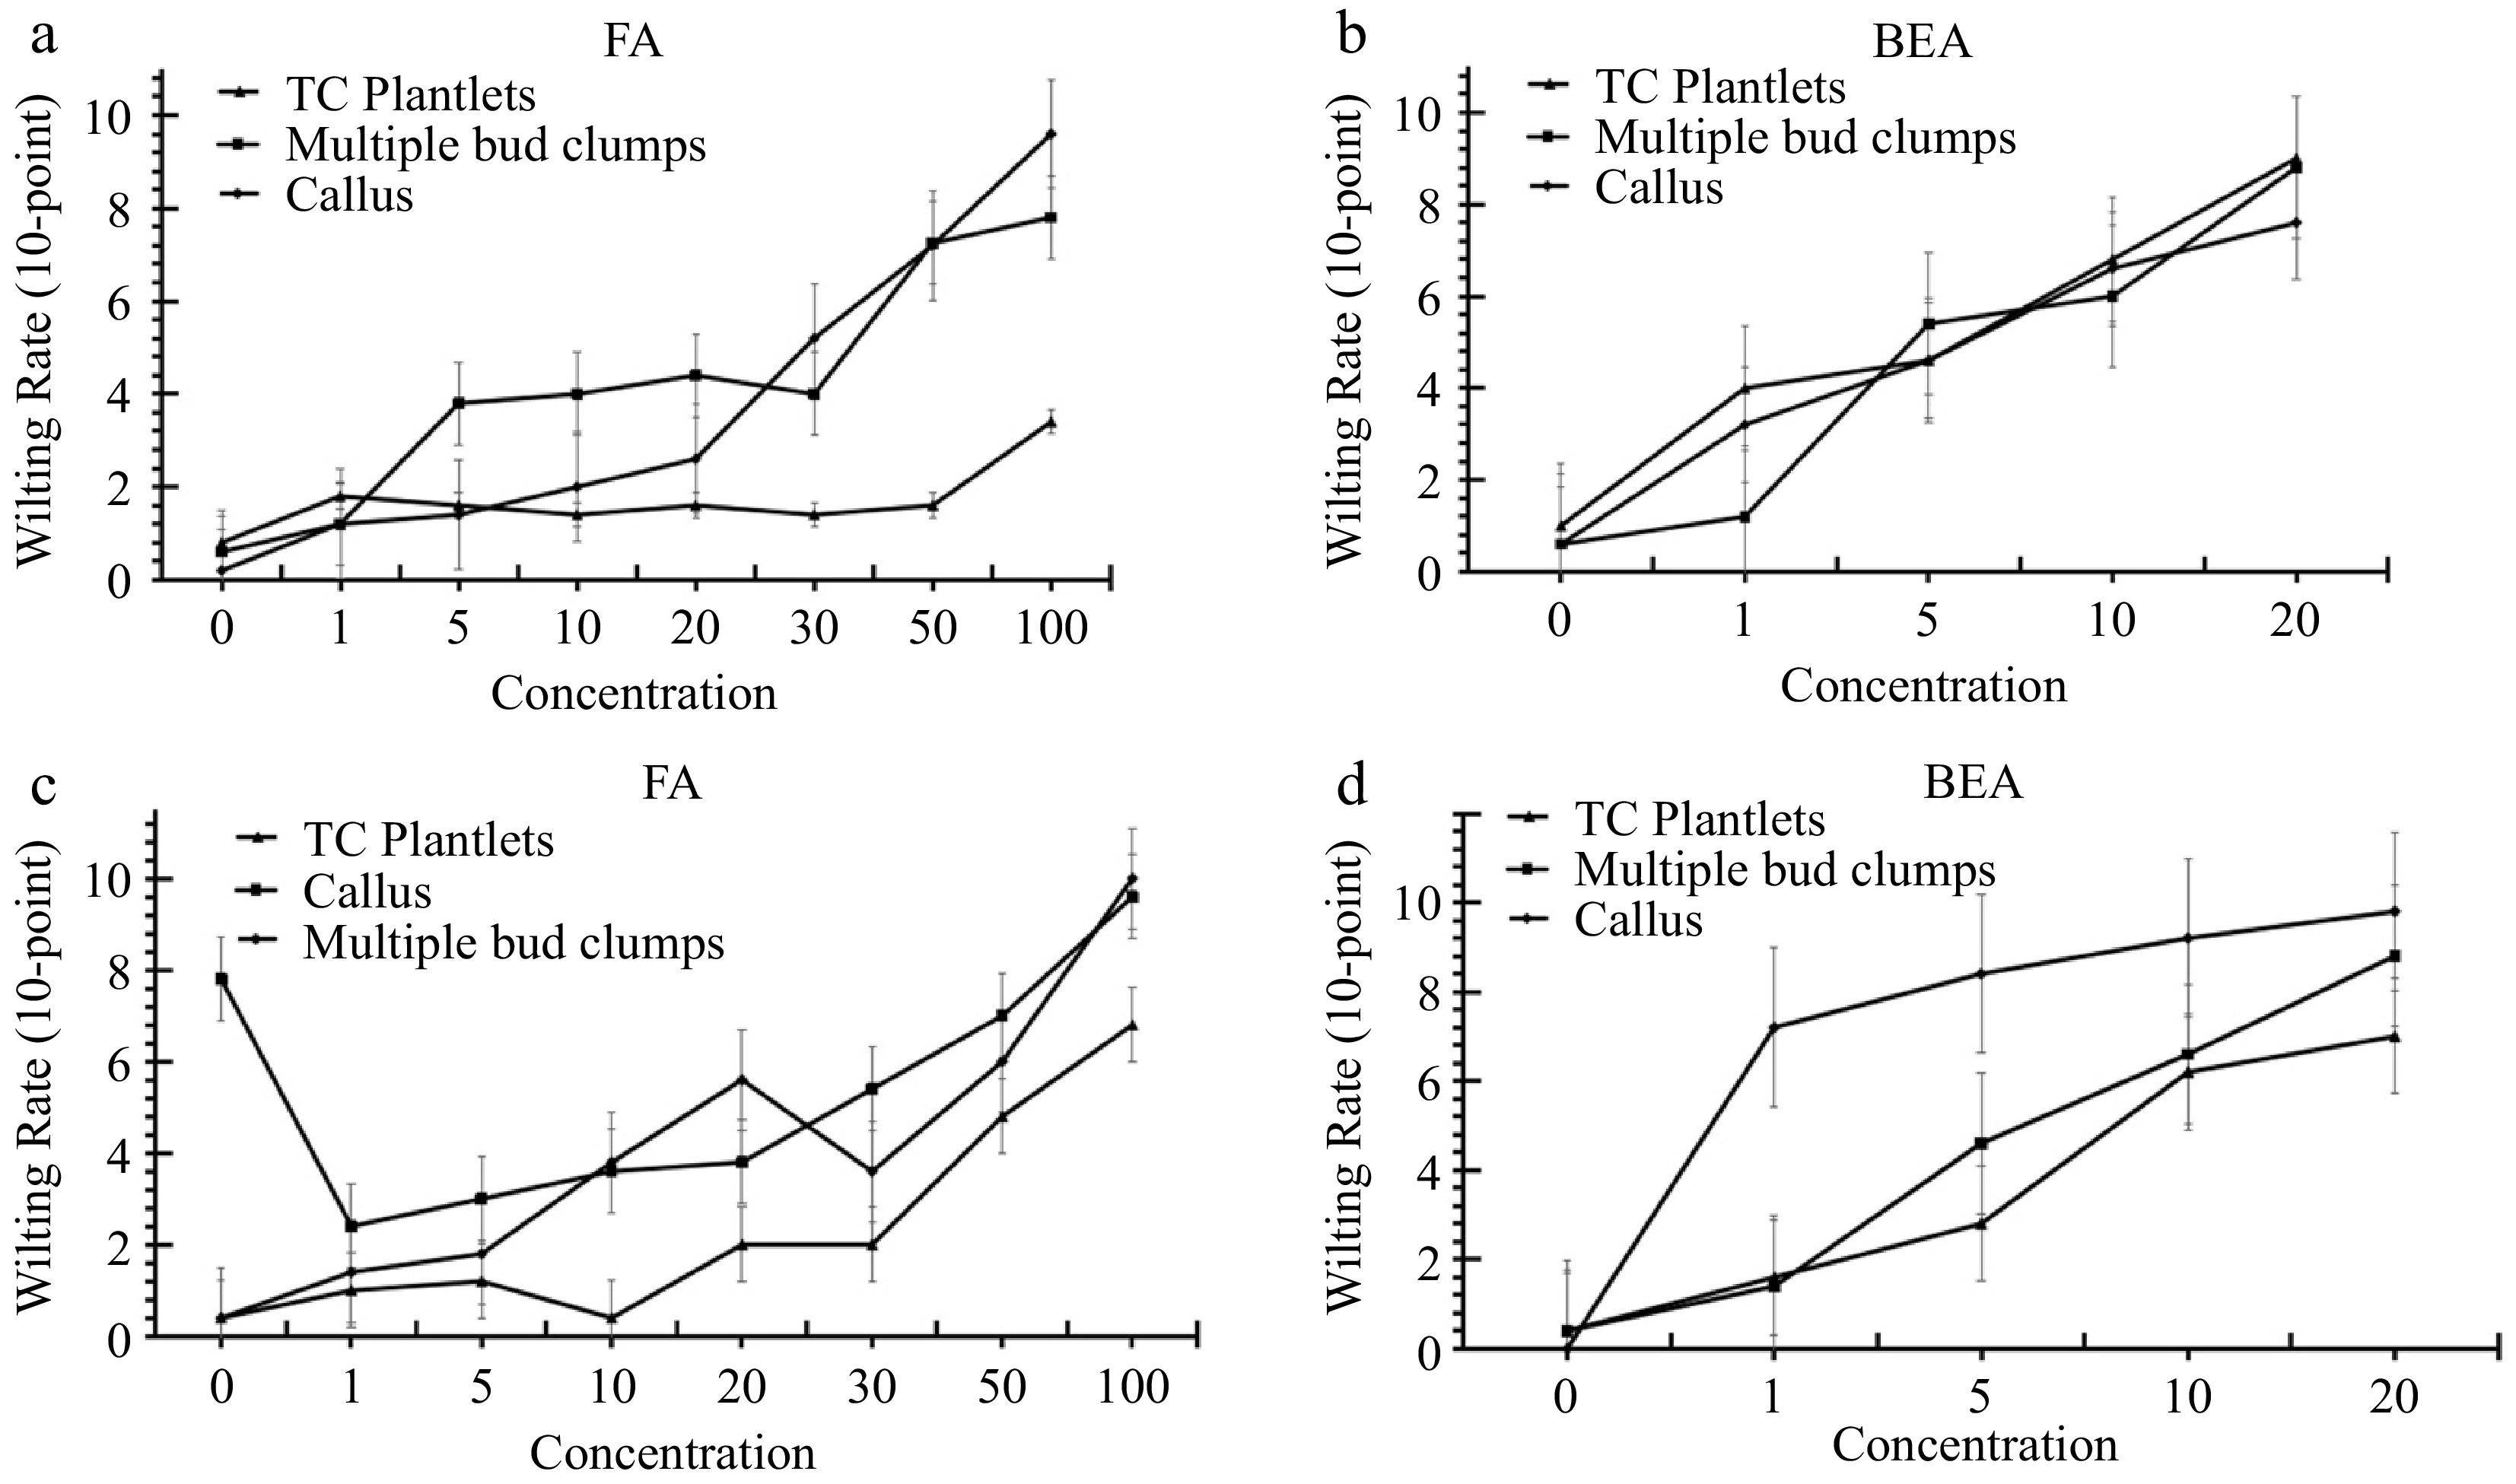
Figure 2.
Browning rates of tissue-cultured plantlets, calli, and multiple bud clumps of banana cvs. (a), (b) ‘Grand Nain’ and (c), (d) ‘Lakatan' treated with varying concentrations of FA and BEA at 10 d post-incubation.
-

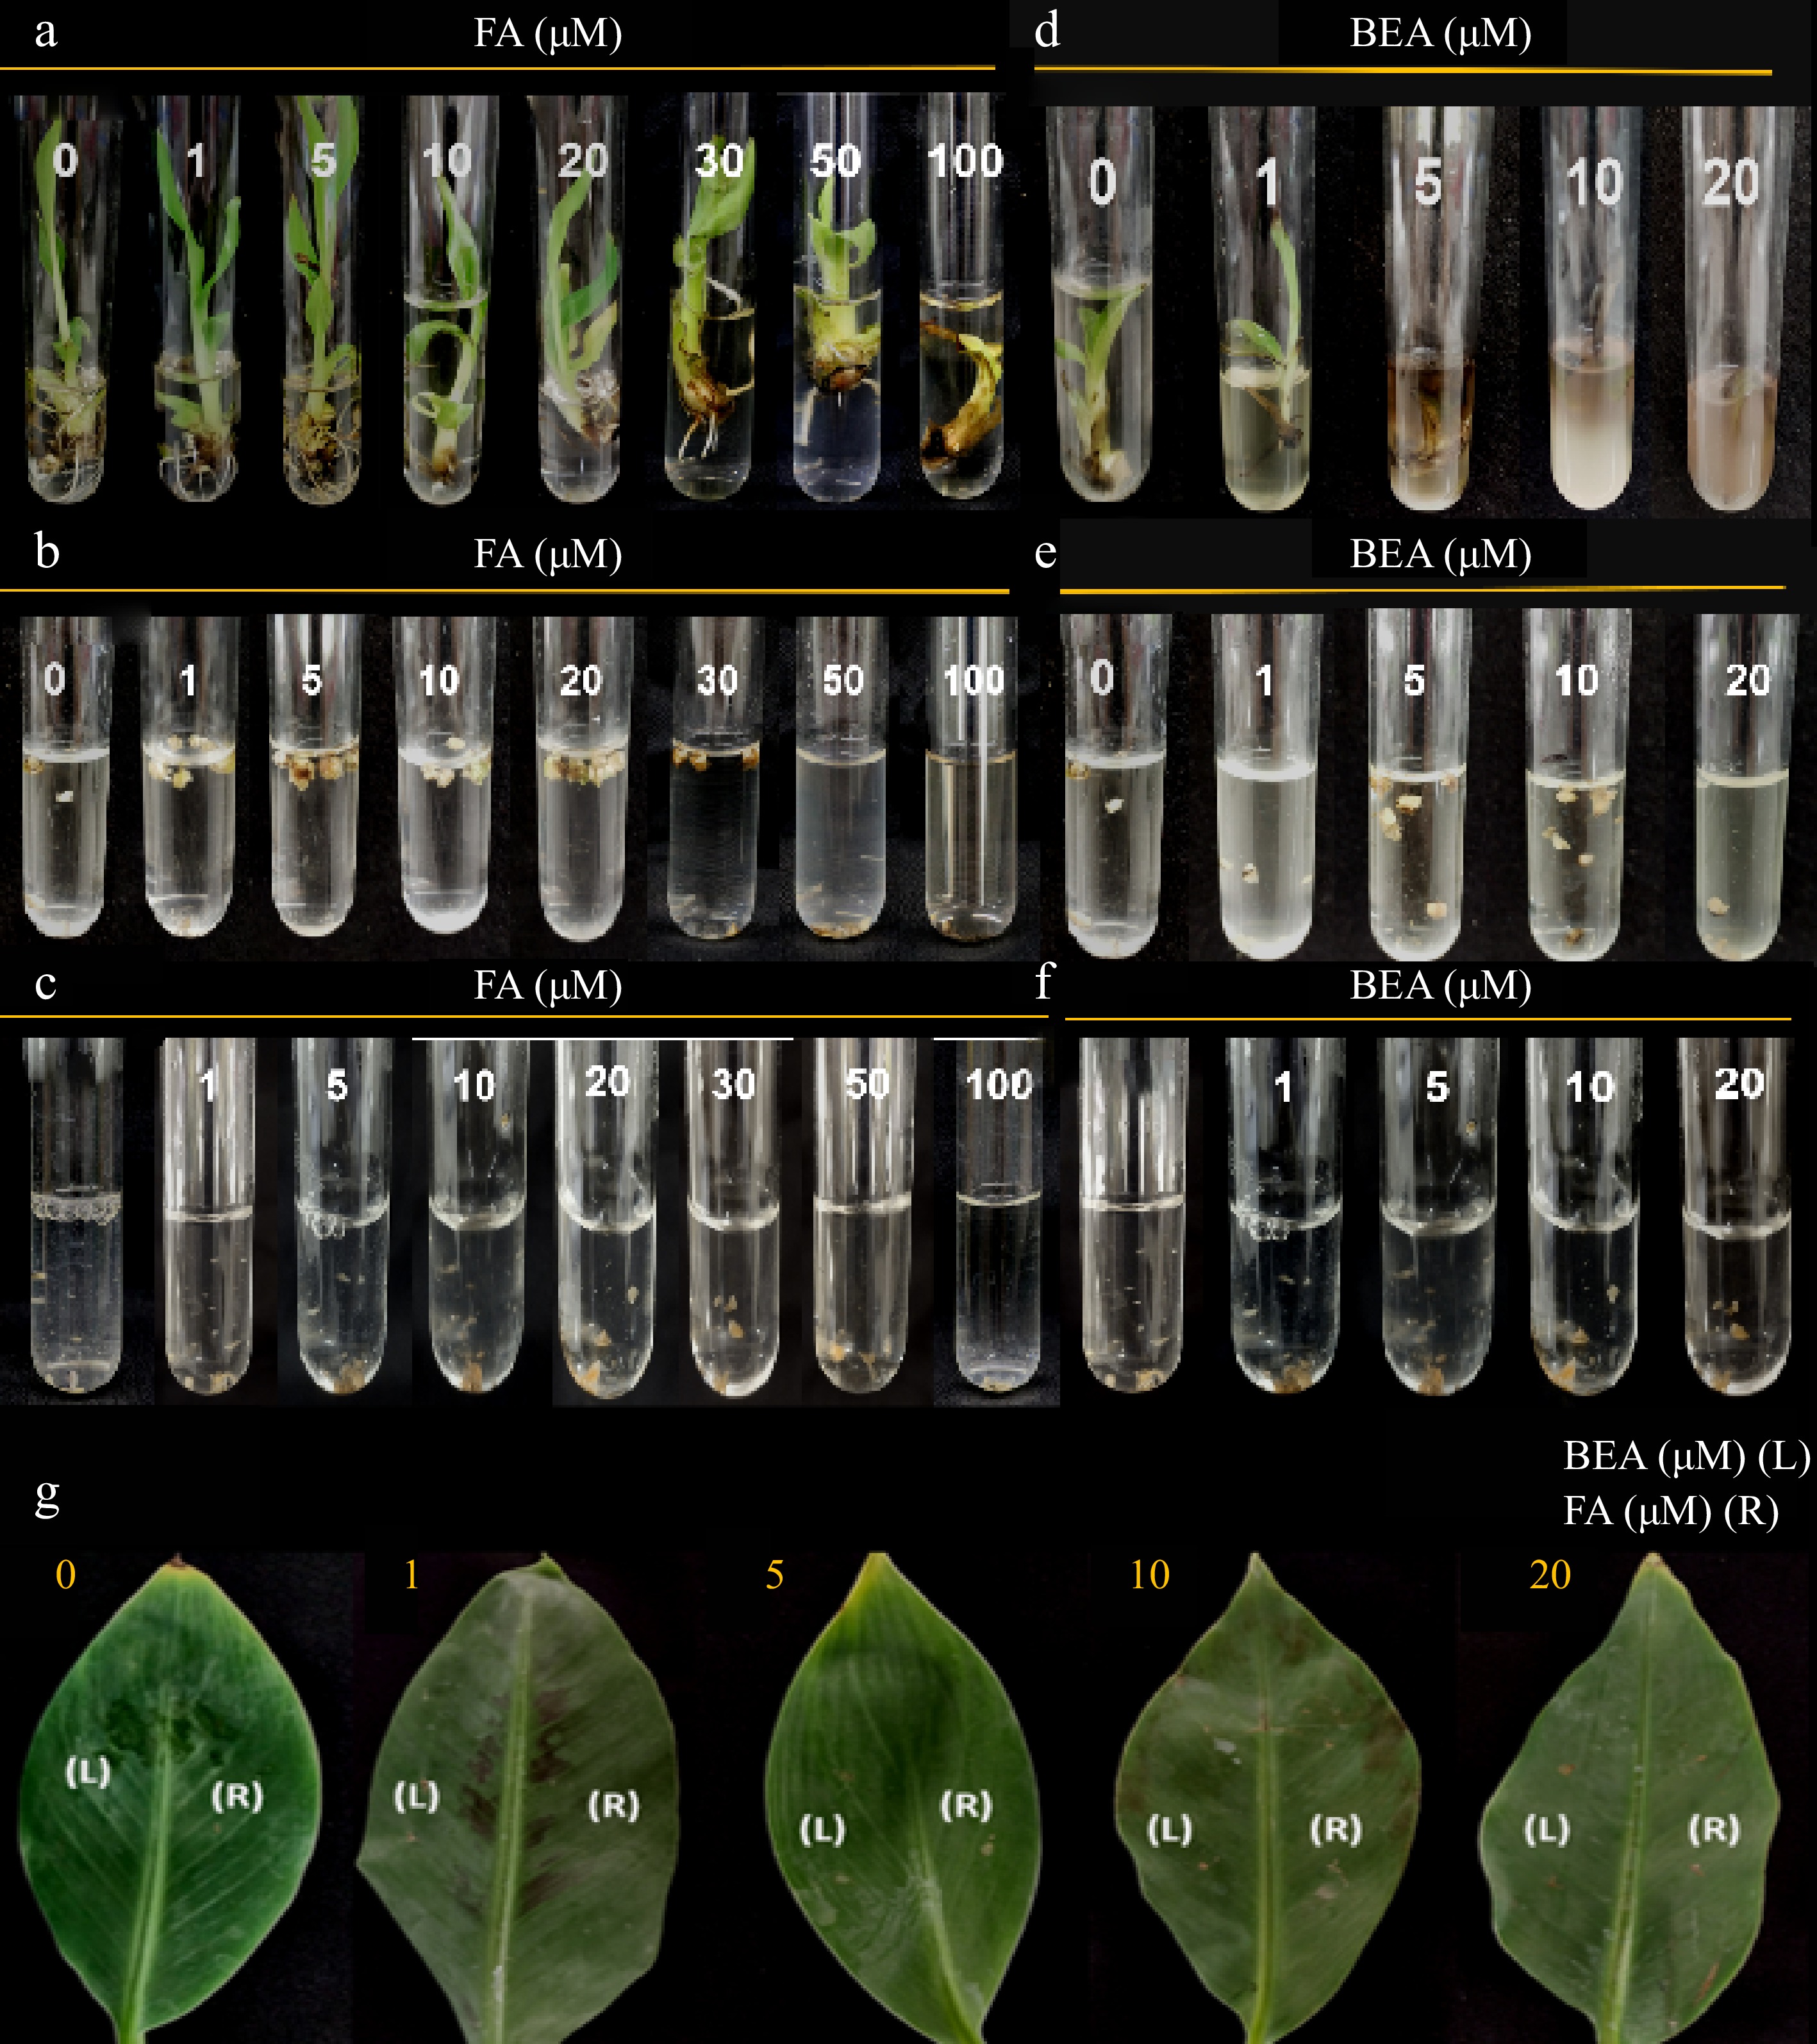
Figure 3.
Toxic effect of FA and BEA in different tissues of banana cv. 'Grand Nain'. Varying concentrations were tested in (a), (d) one-month old tissue-cultured plantlets, (b), (e) multiple buds clumps, (c), (f) callus and (g) attached leaf tissues of two-month old greenhouse plantlets were used. Symptoms were assessed at 10 d post-inoculation.
-

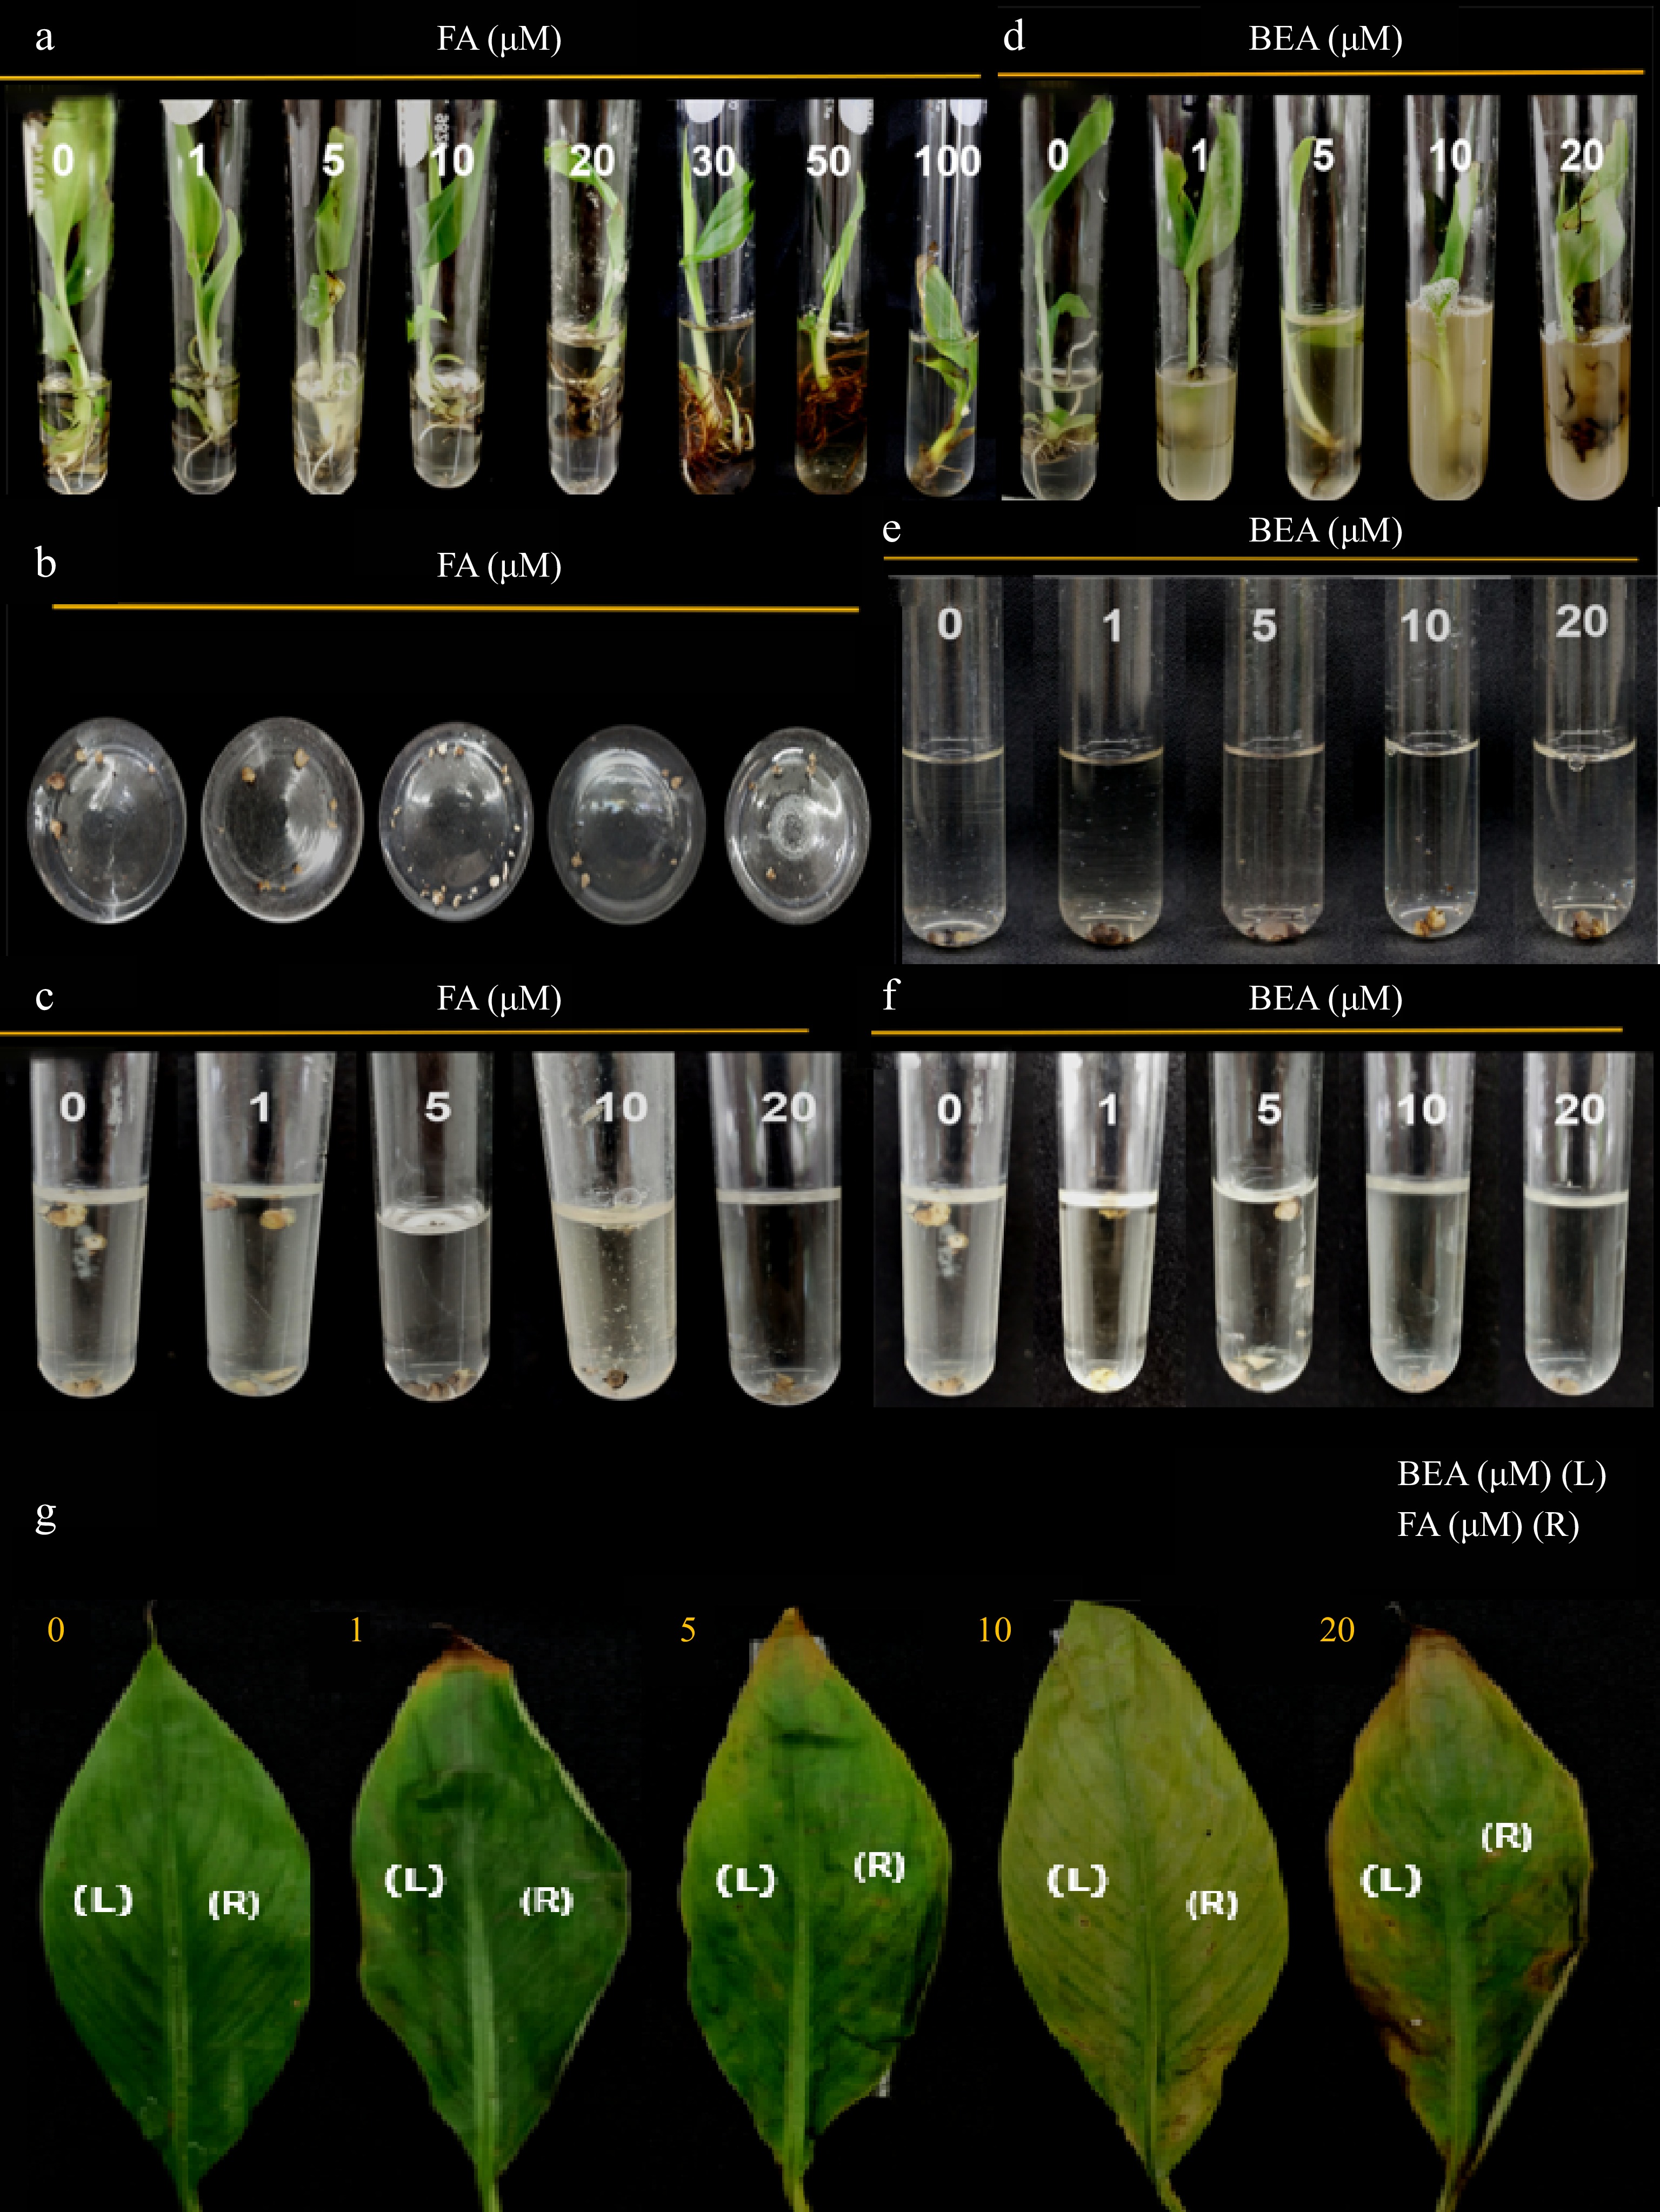
Figure 4.
Toxic effect of FA and BEA in different tissues of banana cv. 'Lakatan'. (a), (d) Varying concentrations were tested in one-month old tissue-cultured plantlets, (b), (e) multiple bud clumps, (c), (f) callus and (g) attached leaf tissues of two-month old greenhouse plantlets were used. Symptoms were assessed at 10 d post-inoculation.
-
FA (µm) 'Grand Nain' 'Lakatan' TC plantlet MBC Callus TC plantlet MBC Callus Control 0.8 ± 0.37b 0.6 ± 0.24c 0.2 ± 0.20d 0.4 ± 0.24c 0.4 ± 0.24e 7.8 ± 0.37ab 1 1.8 ± 0.49ab 1.2 ± 0.20c 1.2 ± 0.20cd 1.0 ± 0.55c 1.4 ± 0.24e 2.4 ± 0.68e 5 1.6 ± 0.60ab 3.8 ± 0.86bc 1.4 ± 0.24cd 1.2 ± 0.20c 1.8 ± 0.37de 3.0 ± 0.45e 10 1.4 ± 0.24b 4.0 ± 1.48bc 2.0 ± 0.00cd 0.4 ± 0.24c 3.8 ± 0.58cd 3.6 ± 0.51de 20 1.6 ± 0.40ab 4.4 ± 1.50abc 2.6 ± 0.24c 2.0 ± 0.32c 5.6 ± 0.24bc 3.8 ± 0.58de 30 1.4 ± 0.40b 4.0 ± 0.00bc 5.2 ± 1.24b 2.0 ± 0.00c 3.6 ± 0.75cd 5.4 ± 0.68cd 50 1.6 ± 0.24ab 7.3 ± 0.56ab 7.2 ± 0.49b 4.8 ± 0.49b 6.0 ± 0.63b 7.0 ± 0.00bc 100 3.4 ± 0.24a 7.8 ± 0.92a 9.6 ± 0.24a 6.8 ± 0.80a 10.0 ± 0.00a 9.6 ± 0.24a Values represent the mean ± SE of five replicates Means in a column with the same letter are not significantly different (p > 0.05). Table 1.
Wilting rates of different tissues of banana 10 d after fusaric acid treatment.
-
BEA
(µm)'Grand Nain' 'Lakatan' TC plantlet MBC Callus TC plantlet MBC Callus Control 1.0 ± 0.32d 0.6 ± 0.40c 0.6 ± 0.24d 0.4 ± 0.24d 0.0 ± 0.55e 0.4 ± 0.00d 1 4.0 ± 0.63c 1.2 ± 0.20c 3.2 ± 0.37c 1.6 ± 0.24c 7.2 ± 0.55d 1.4 ± 0.84c 5 4.6 ± 0.75c 5.4 ± 0.40b 4.6 ± 0.51b 2.8 ± 0.20b 8.4 ± 0.55c 4.6 ± 0.55b 10 6.8 ± 0.37b 6.0 ± 0.32b 6.6 ± 0.24a 6.2 ± 0.37a 9.2 ± 0.55b 6.6 ± 0.45a 20 9.0 ± 0.45a 8.8 ± 0.37a 7.6 ± 0.24a 7.0 ± 0.45a 9.8 ± 0.84a 8.8 ± 0.45a Values represent the mean ± SE of five replicates Means in a column with the same letter are not significantly different (p > 0.05). Table 2.
Wilting rates of different tissues of banana 10 d after beauvericin treatment.
Figures
(4)
Tables
(2)