-
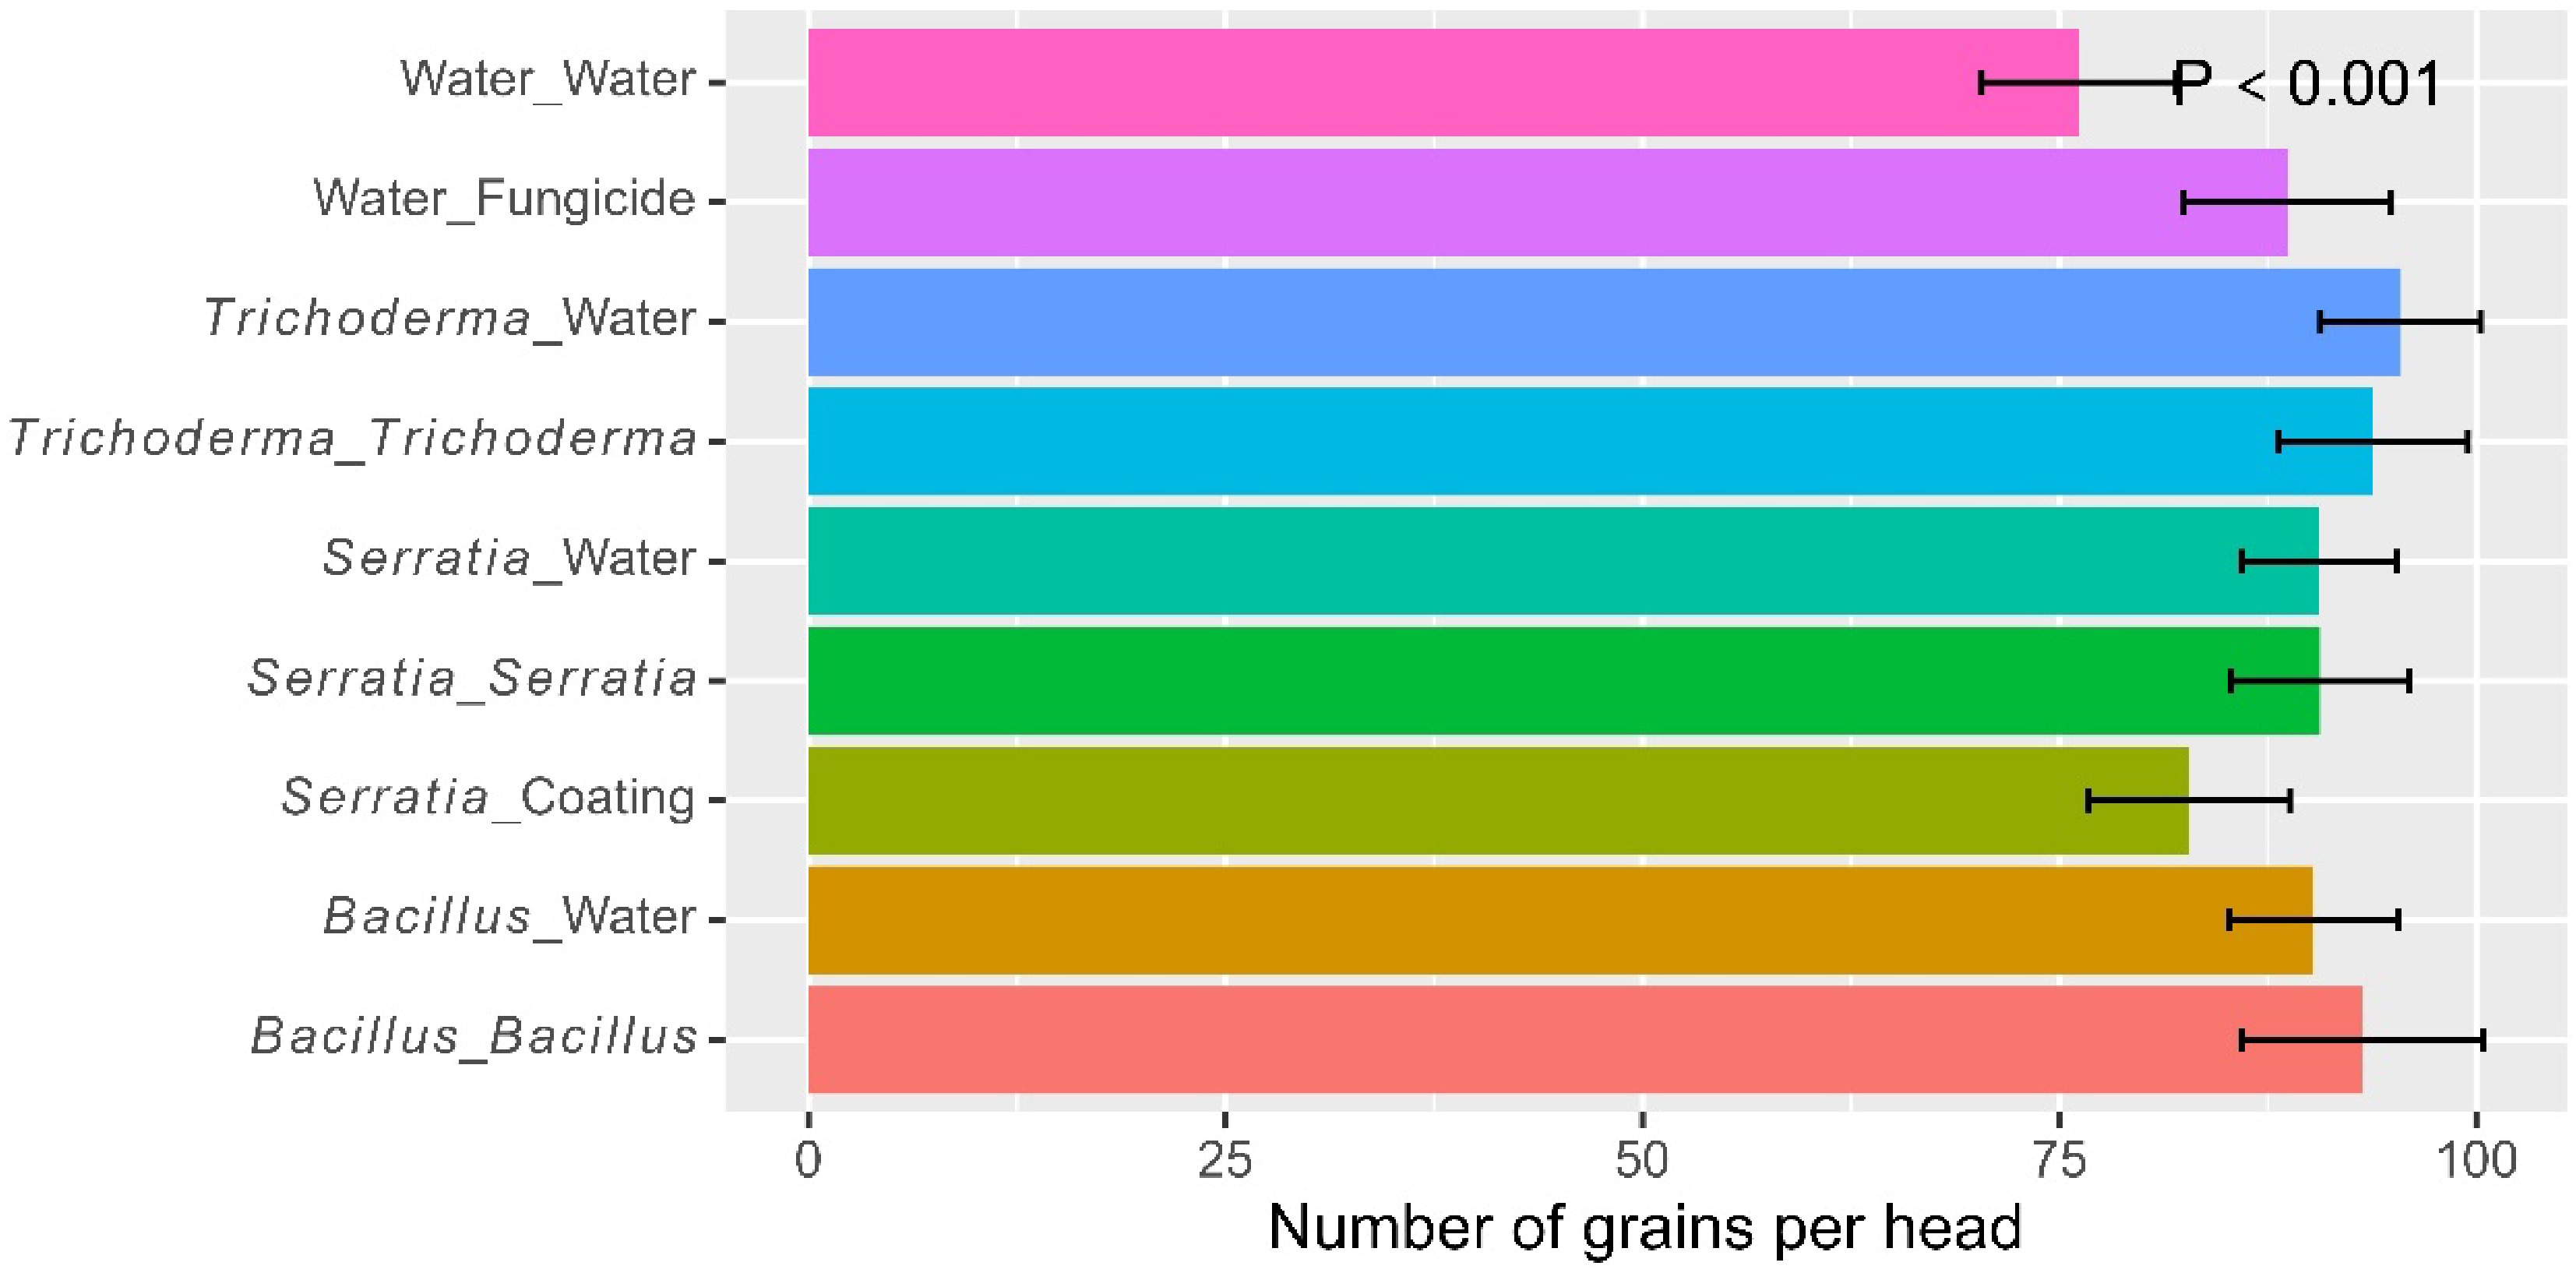
Figure 1.
Number of grains per head of rice plants, treated by one of the four biopesticides at different times (seed coating, dipping at transplanting, post-transplanting foliar spray, or both dipping and spray) at one site in Kenya over two cropping seasons in 2022. Two controls (water as negative, and fungicide foliar spray as positive) were included for comparison. The bar represents one standard error, and P value is associated with the F-test in ANOVA, indicating the overall differences among the nine treatments.
-
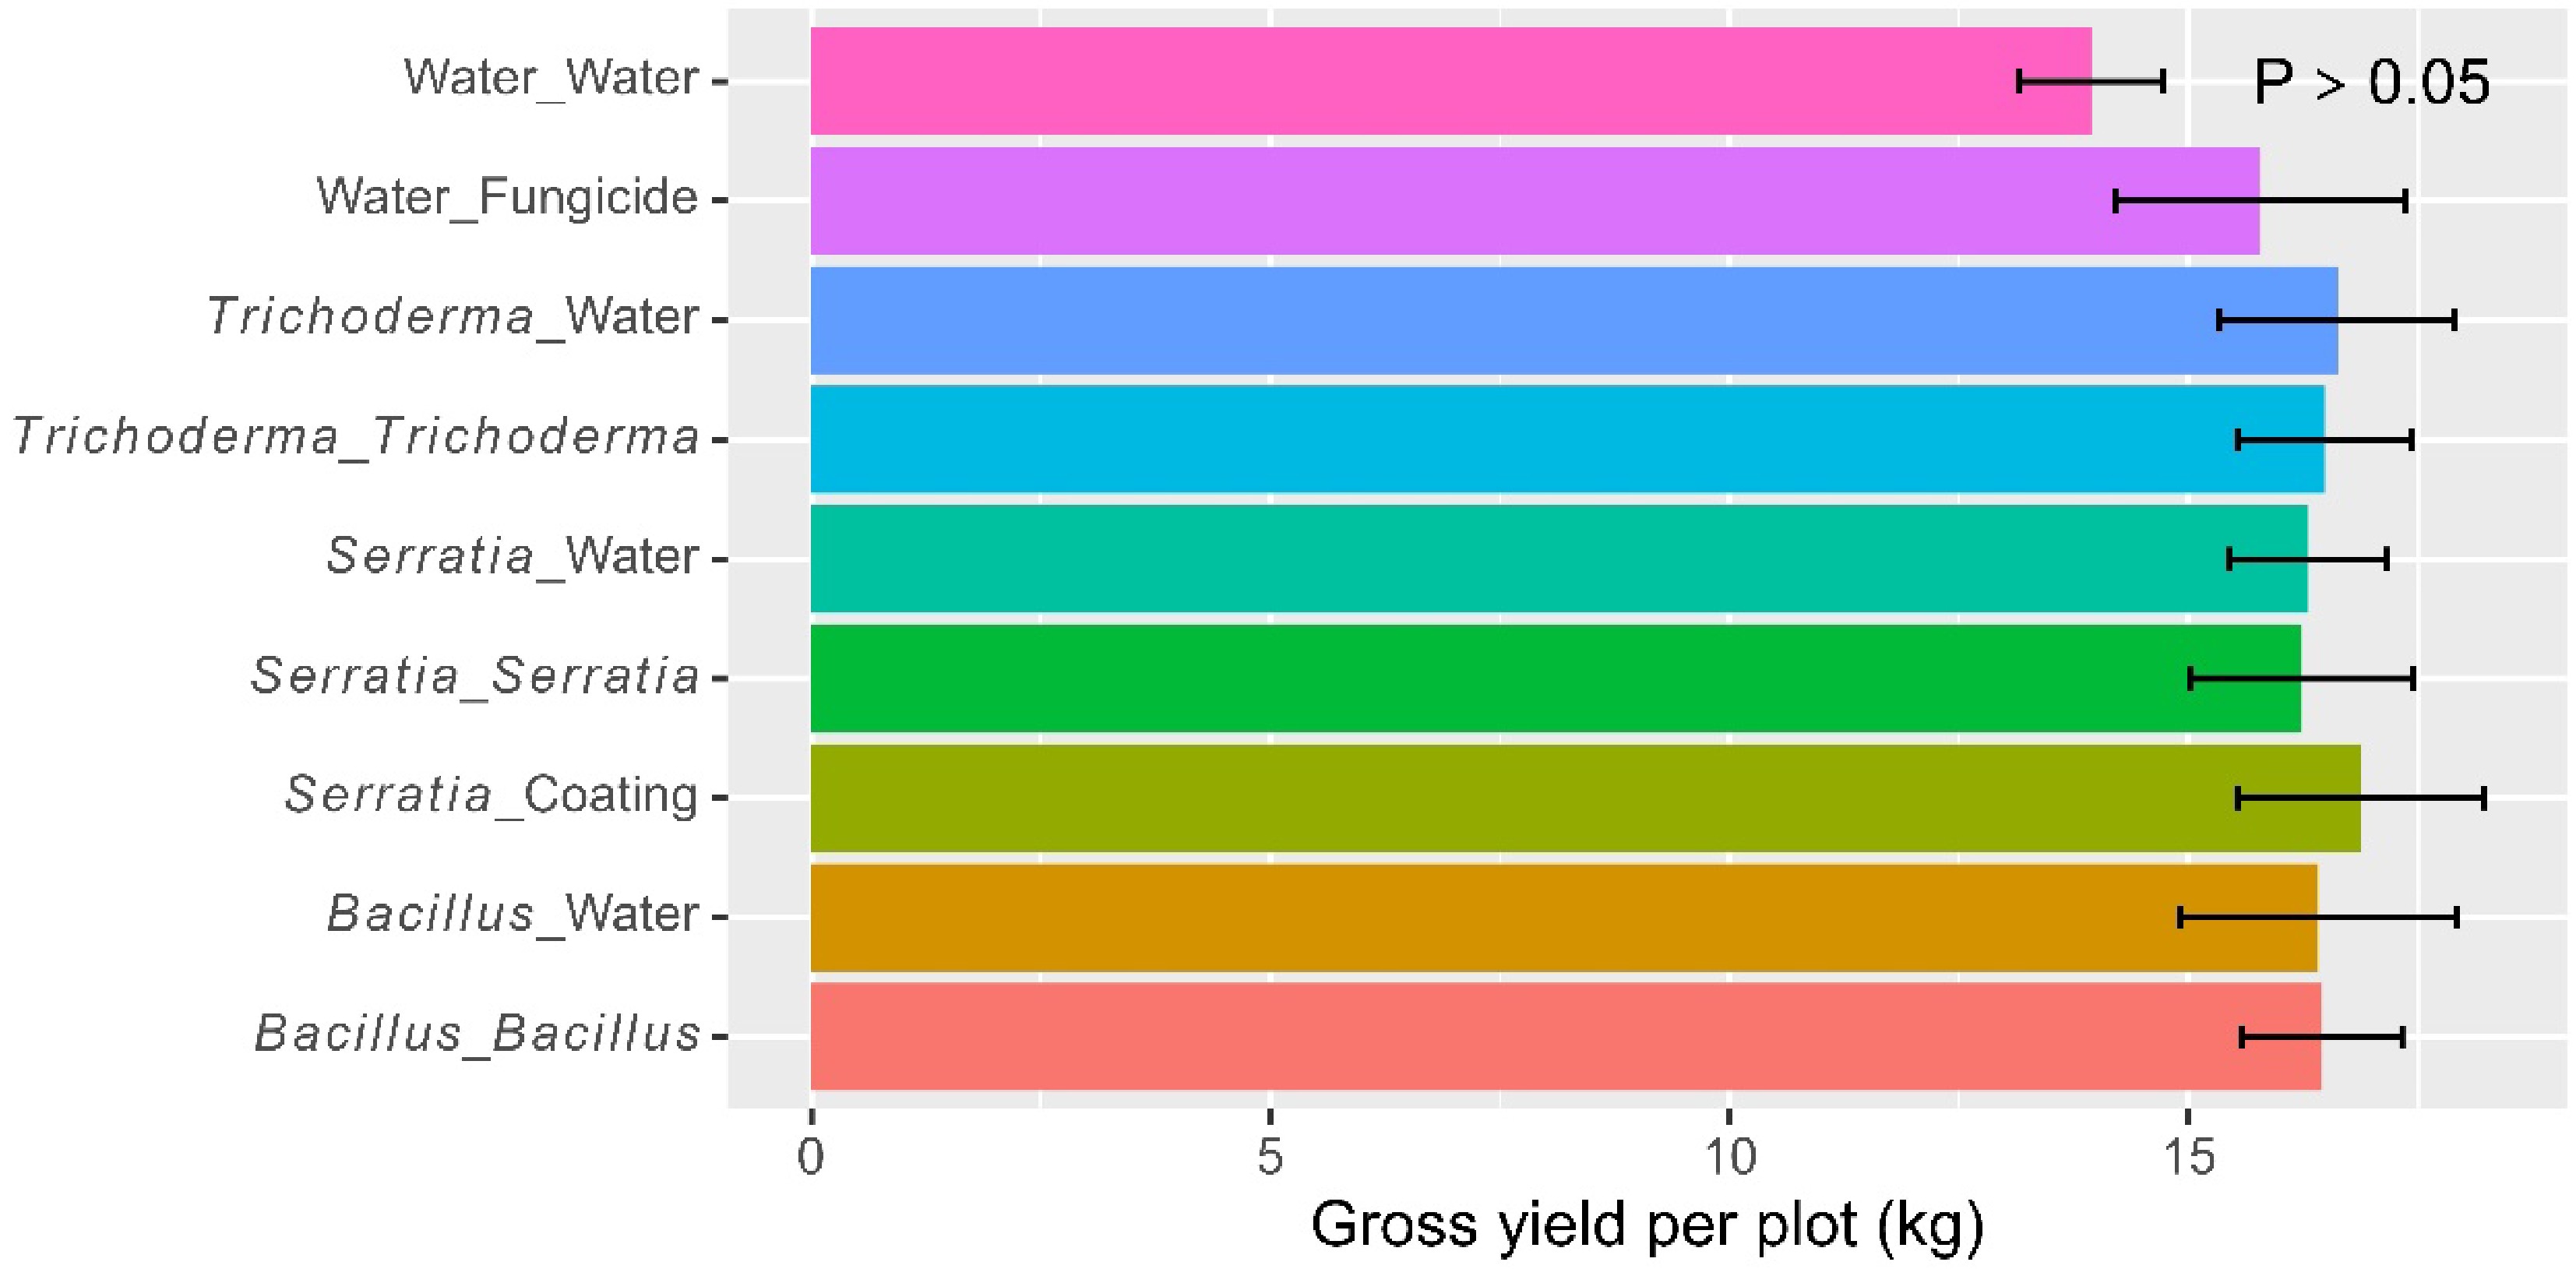
Figure 2.
Gross yield (kg per plot) of rice plants, receiving one of the four biopesticides applied at different times (seed coating, dipping at transplanting, post-transplanting foliar spray, or both dipping and spray) at one site in Kenya over two cropping seasons in 2022. Two controls (water as negative, and fungicide as positive) were included for comparison. The bar represents one standard error and P value is associated with the F-test in ANOVA, indicating the overall differences among the nine treatments.
-
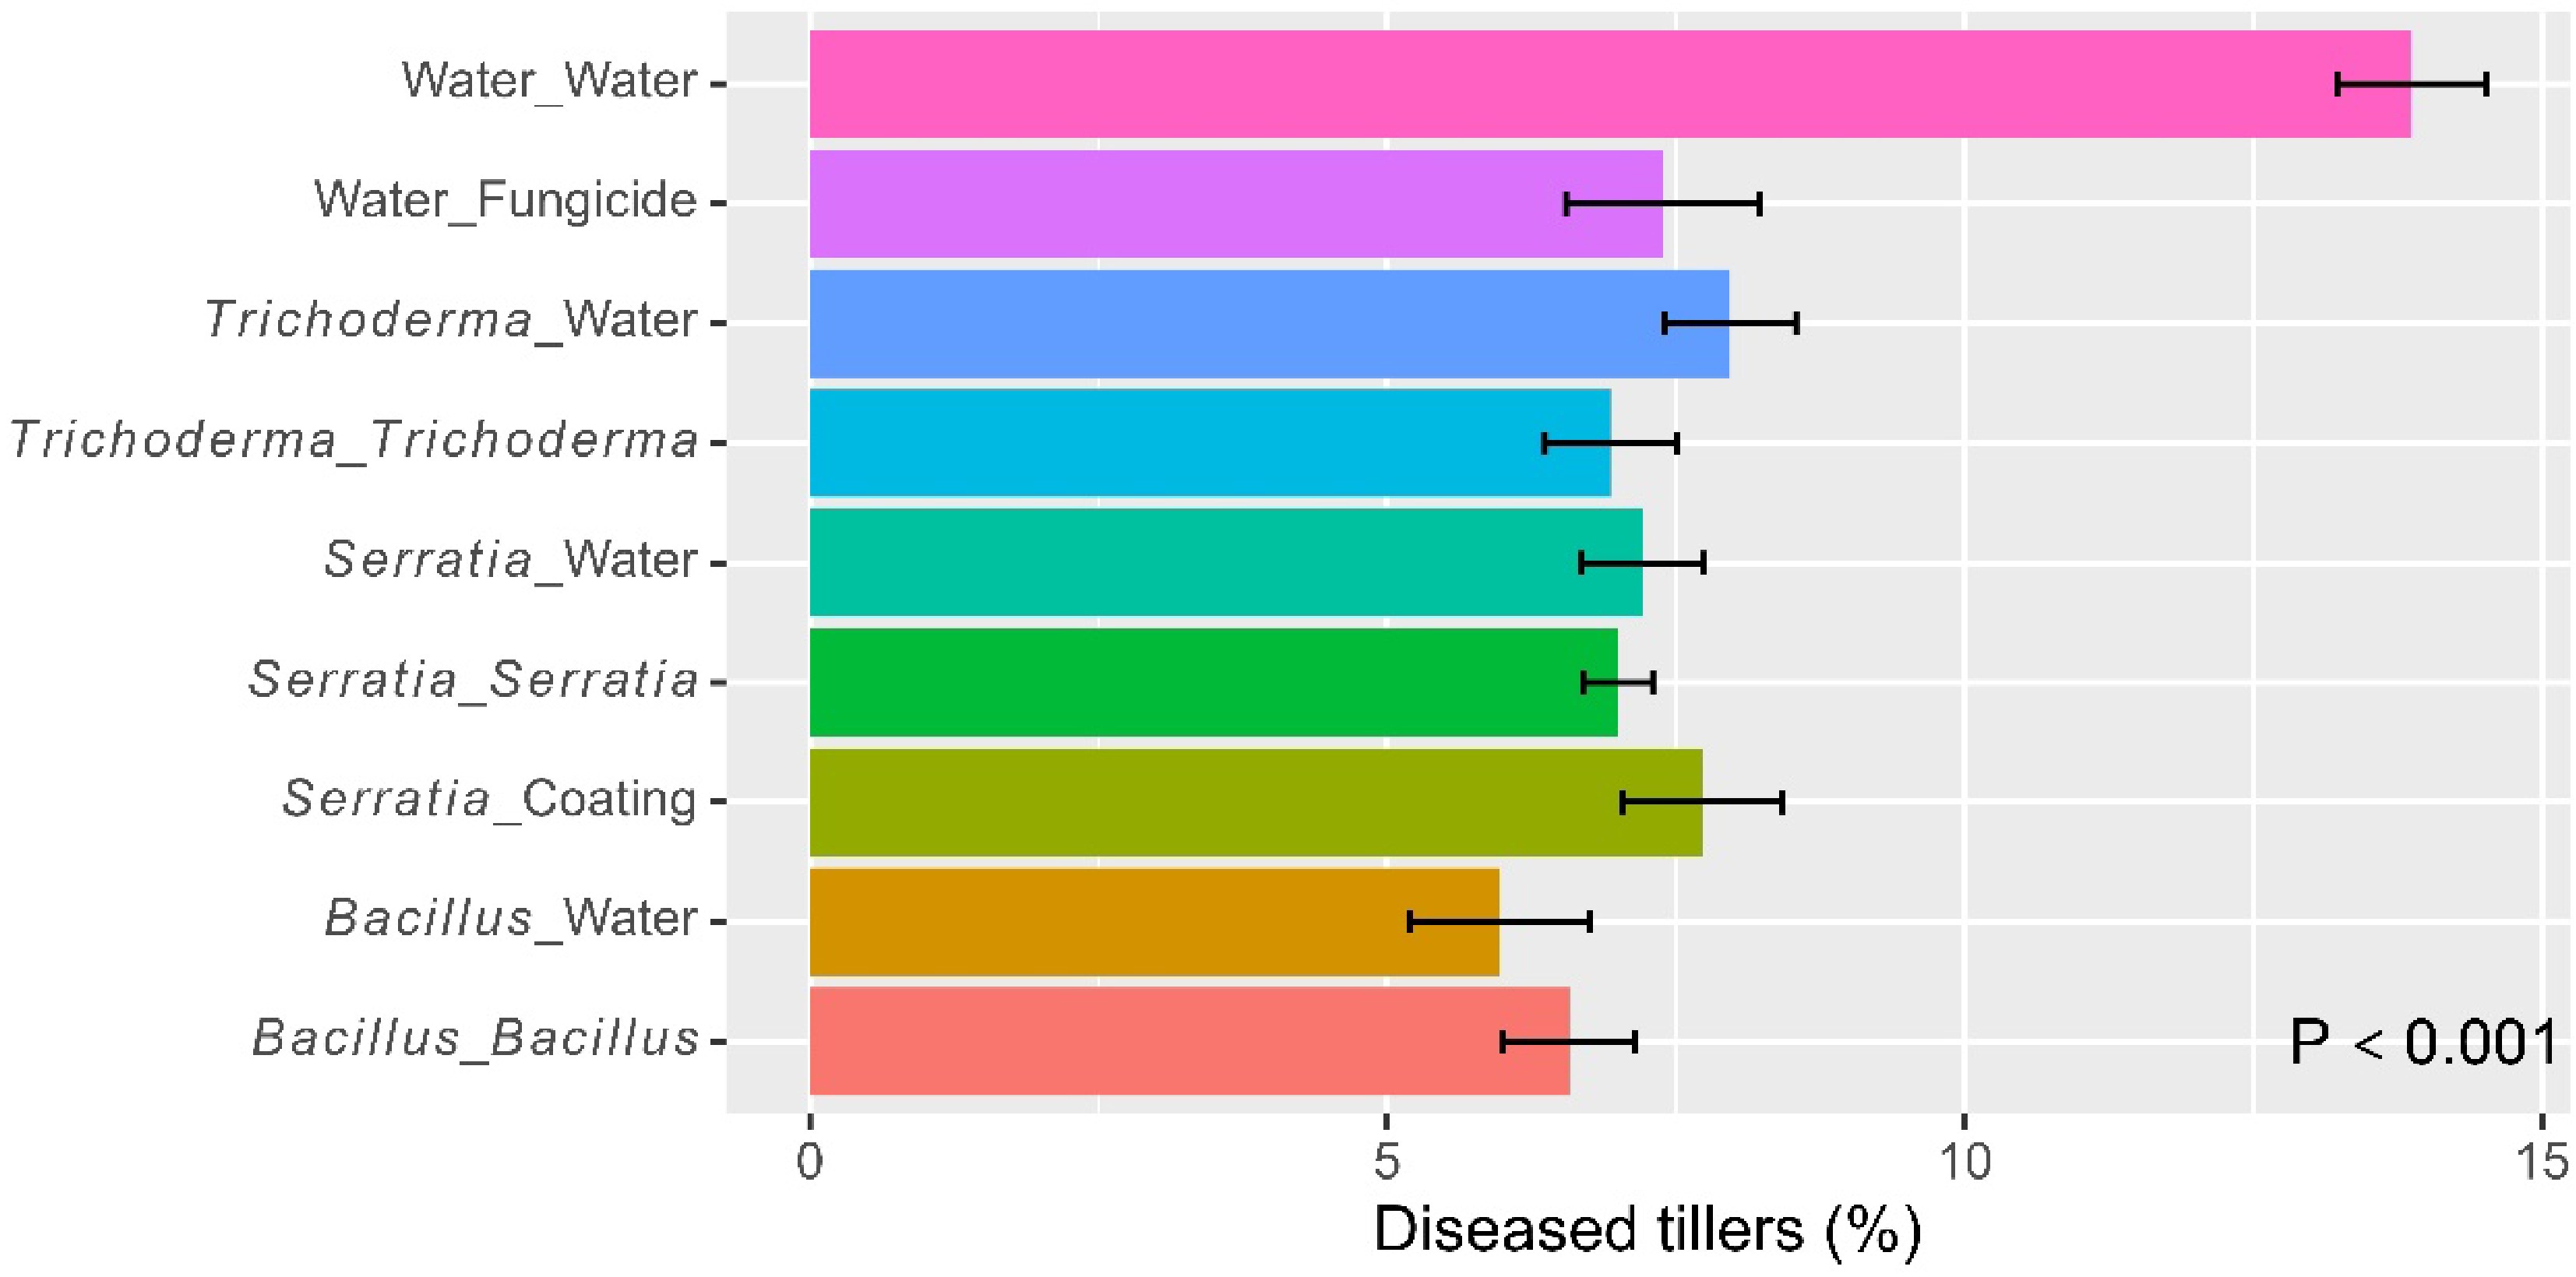
Figure 3.
Percentage of tillers with blast symptoms for those rice plants receiving one of the four biopesticides applied at different times (seed coating, dipping at transplanting, post-transplanting foliar spray, or both dipping and spray) at one site in Kenya over two cropping seasons in 2022. Two controls (water as negative, and fungicide as positive) were included for comparison. The bar represents one standard error, and P value is associated with the F-test in ANOVA, indicating the overall differences among the nine treatments.
-
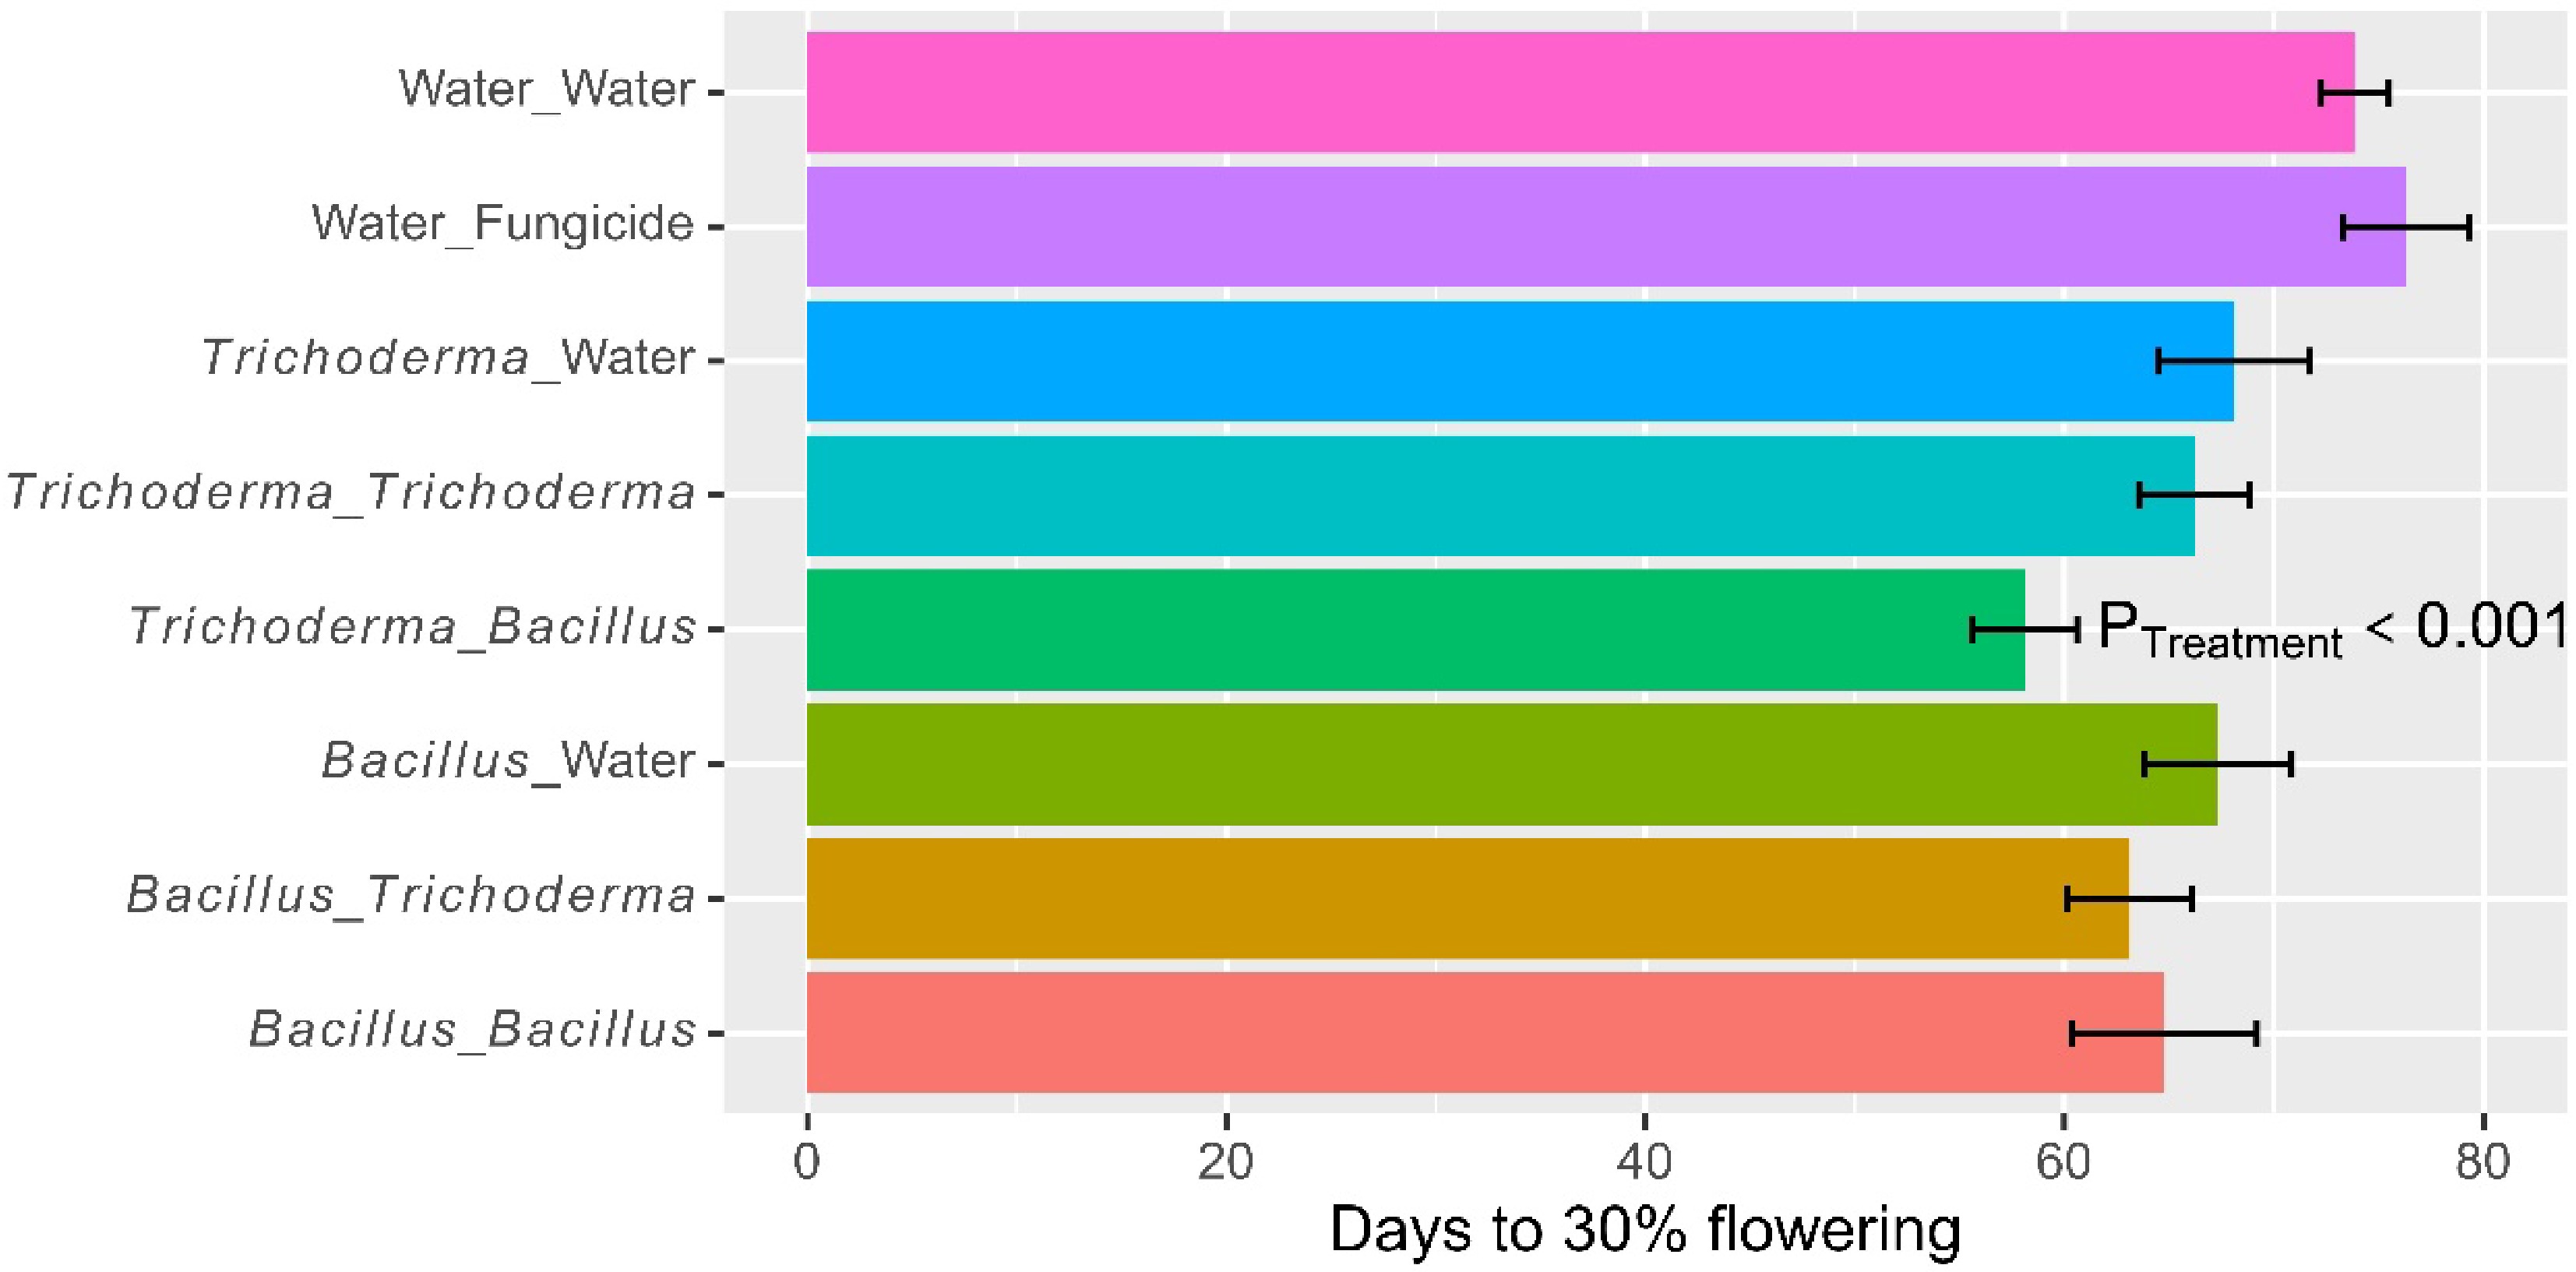
Figure 4.
Number of days to 30% flowering of rice plants that had received water/fungicide or one of the two biopesticides as dipping at transplanting only, or both as dipping and as foliar spray at three sites in 2022 in Tanzania. The bar represents one standard error, and P value is associated with the F-test in ANOVA, indicating the overall differences among the nine treatments.
-
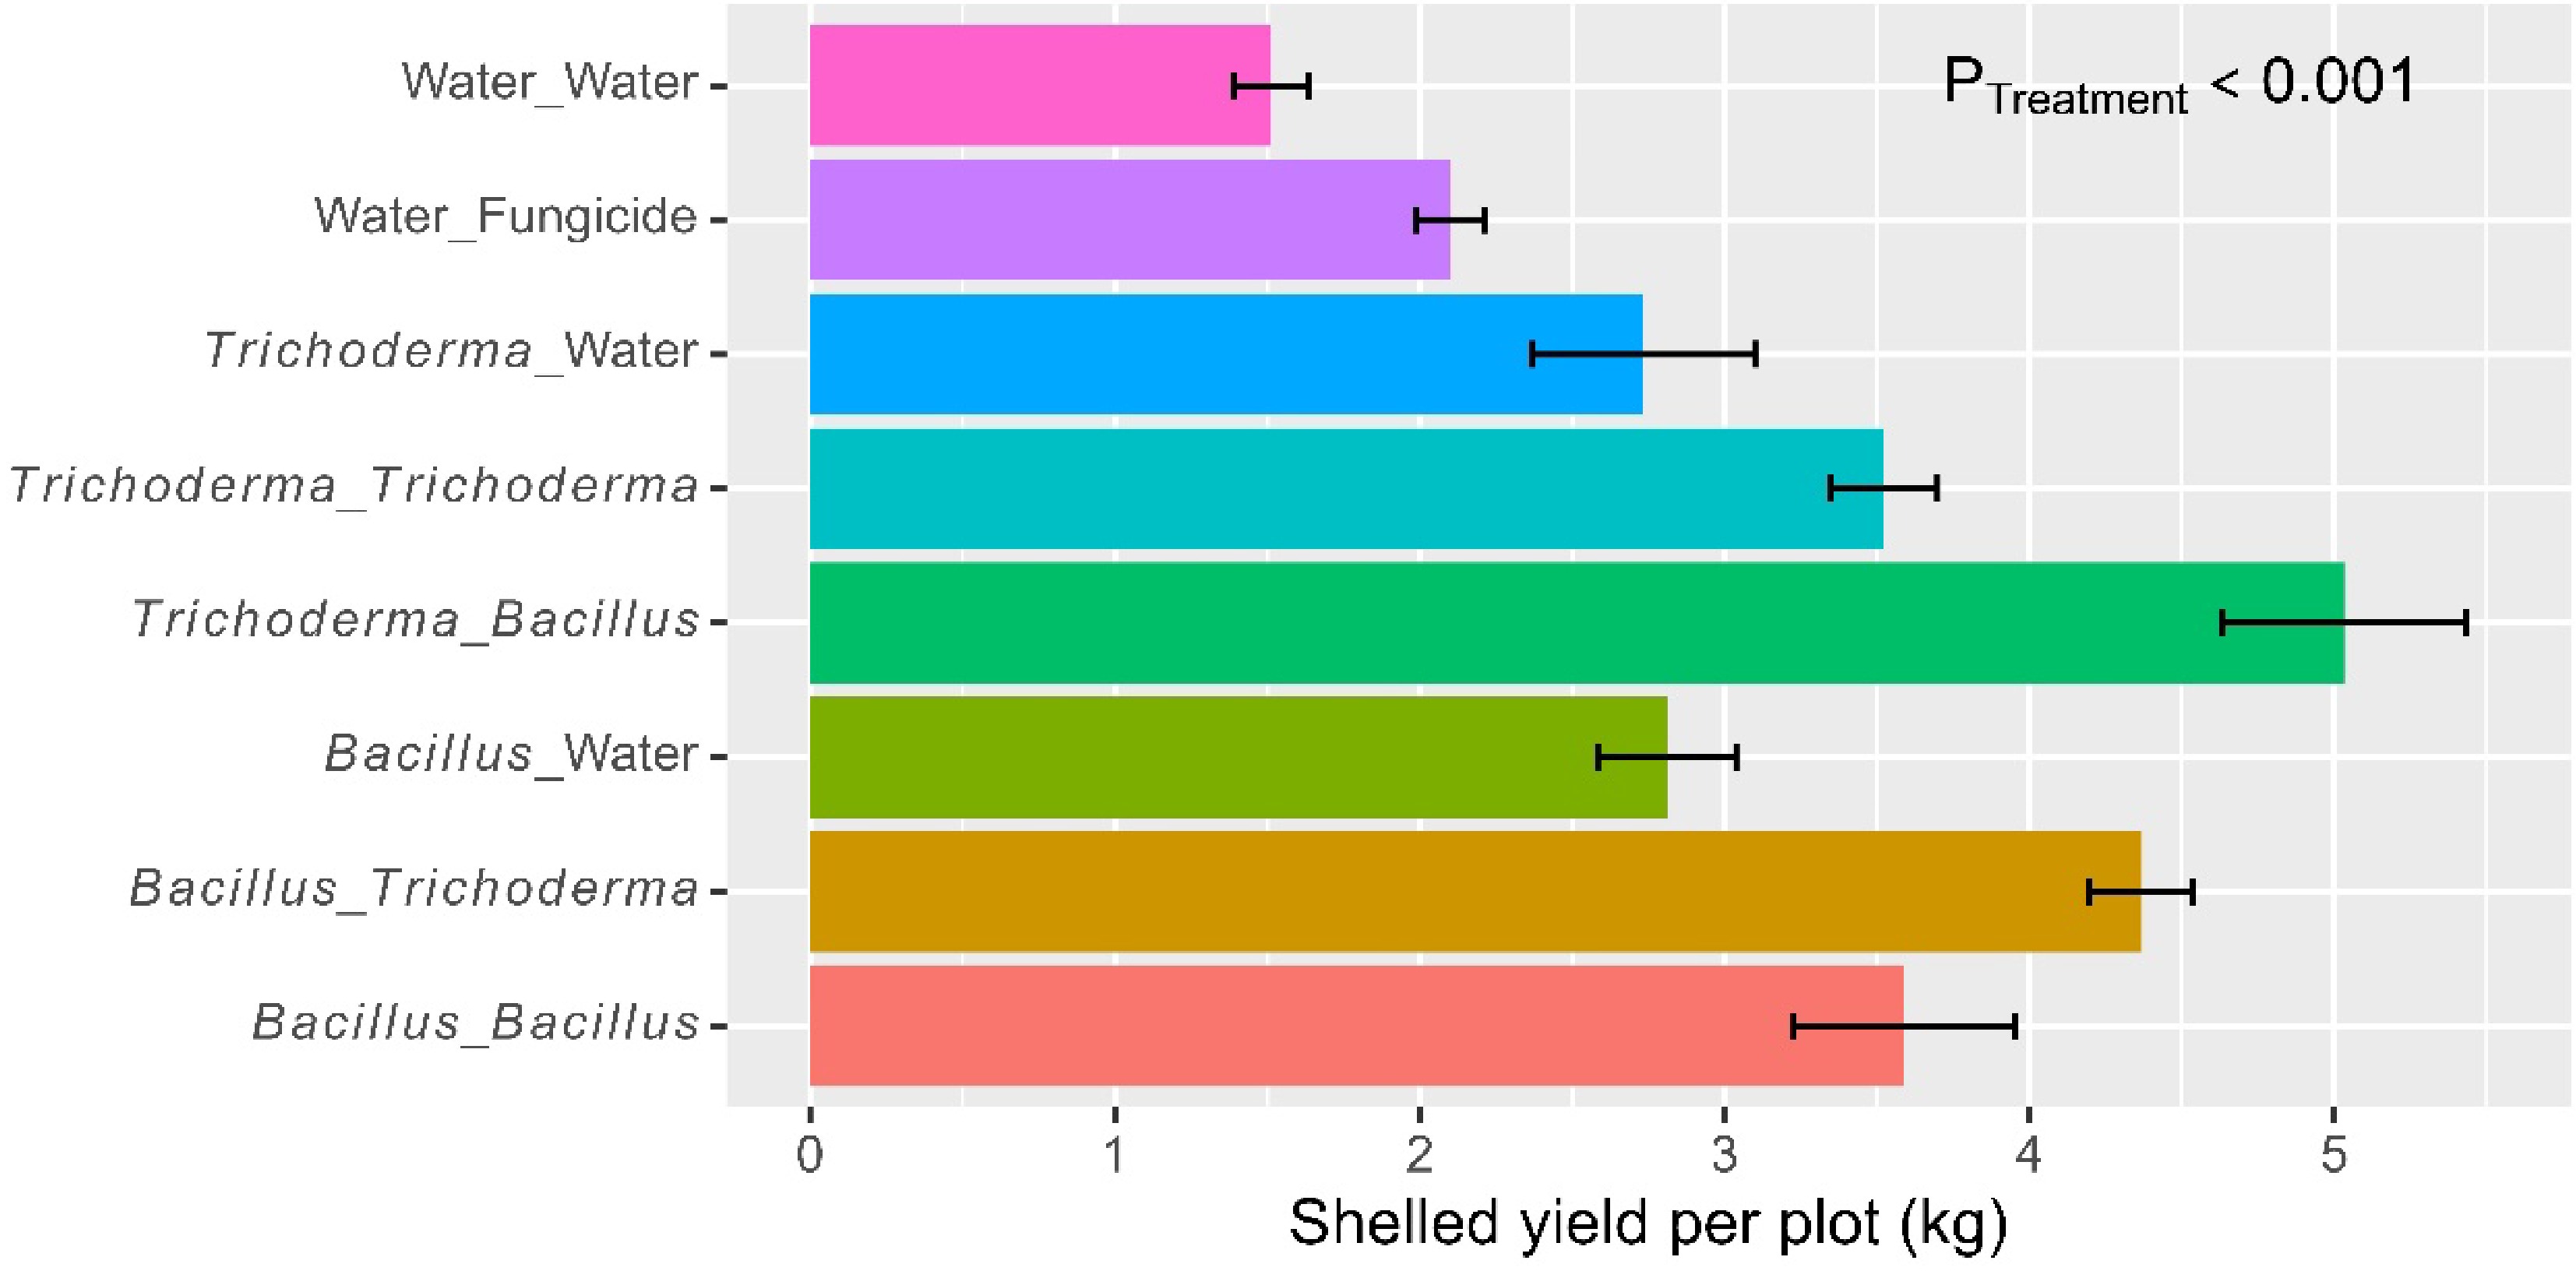
Figure 5.
Net grain yield (kg) per plot (size 5 m × 5 m) of rice plants that had received water/fungicide or one of the two biopesticides as dipping at transplanting only, or both as dipping and as foliar spray at three sites in Tanzania in 2022. The bar represents one standard error, and P value is associated with the F-test in ANOVA, indicating the overall differences among the nine treatments.
-
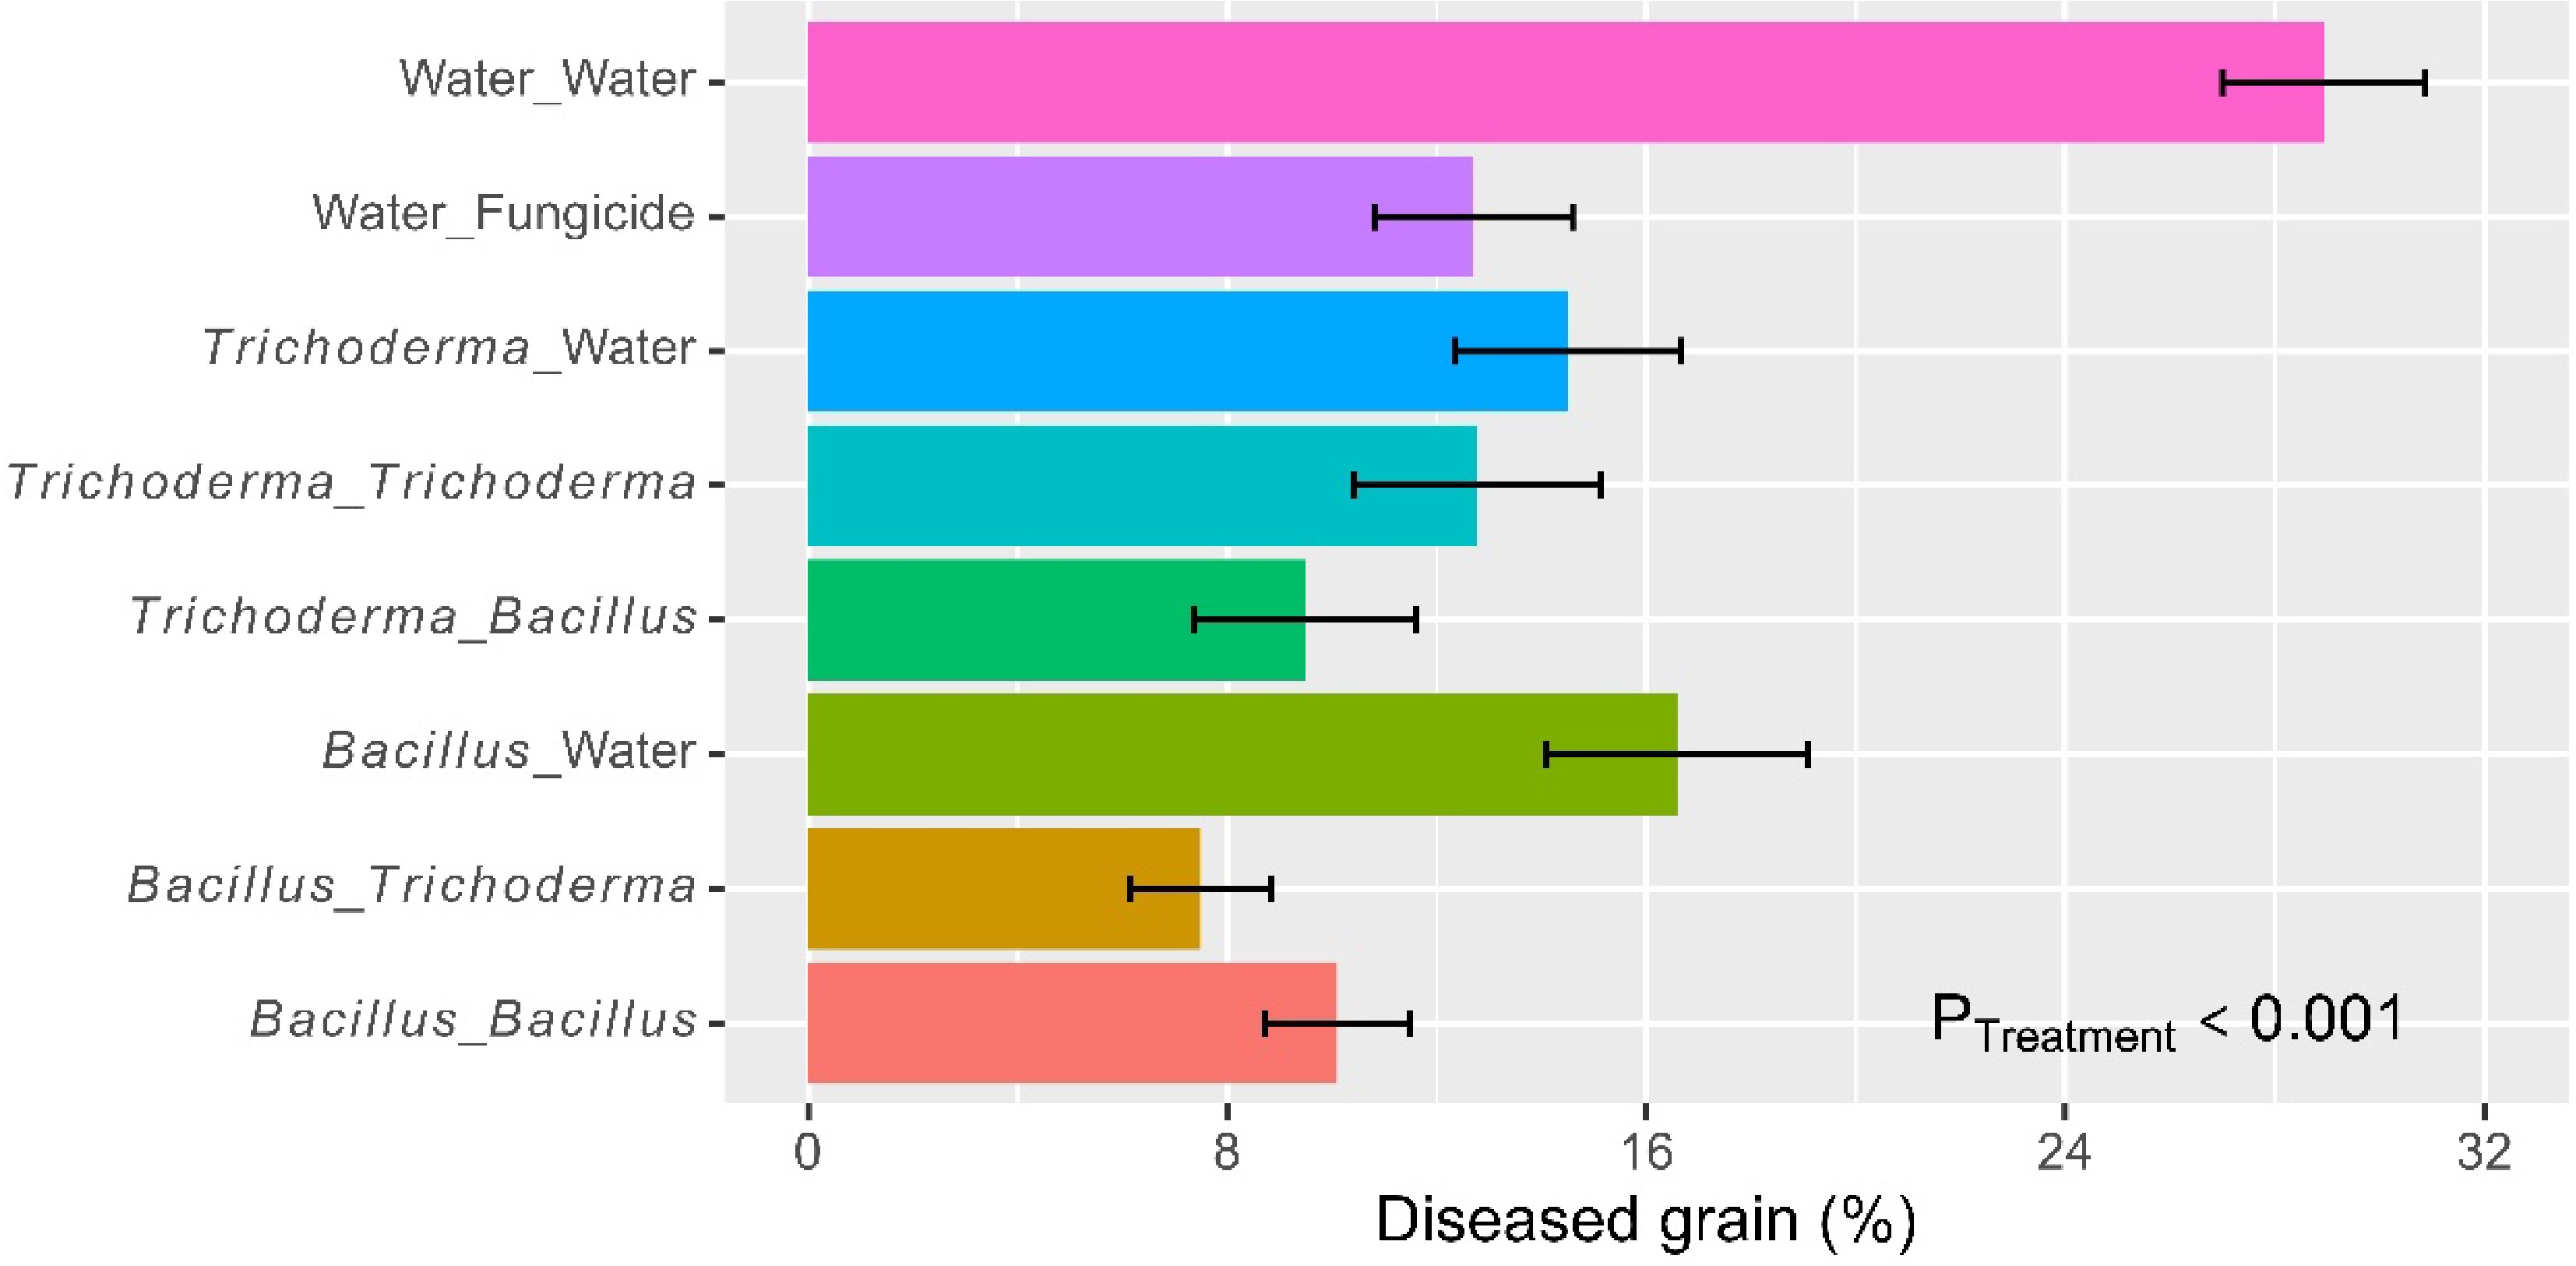
Figure 6.
Percent grain with blast symptom in each plot of rice plants that had received water/fungicide or one of the two biopesticides as dipping at transplanting only, or both as dipping and as foliar spray at three sites in Tanzania in 2022. The bar represents one standard error, and P value is associated with the F-test in ANOVA, indicating the overall differences among the nine treatments.
-
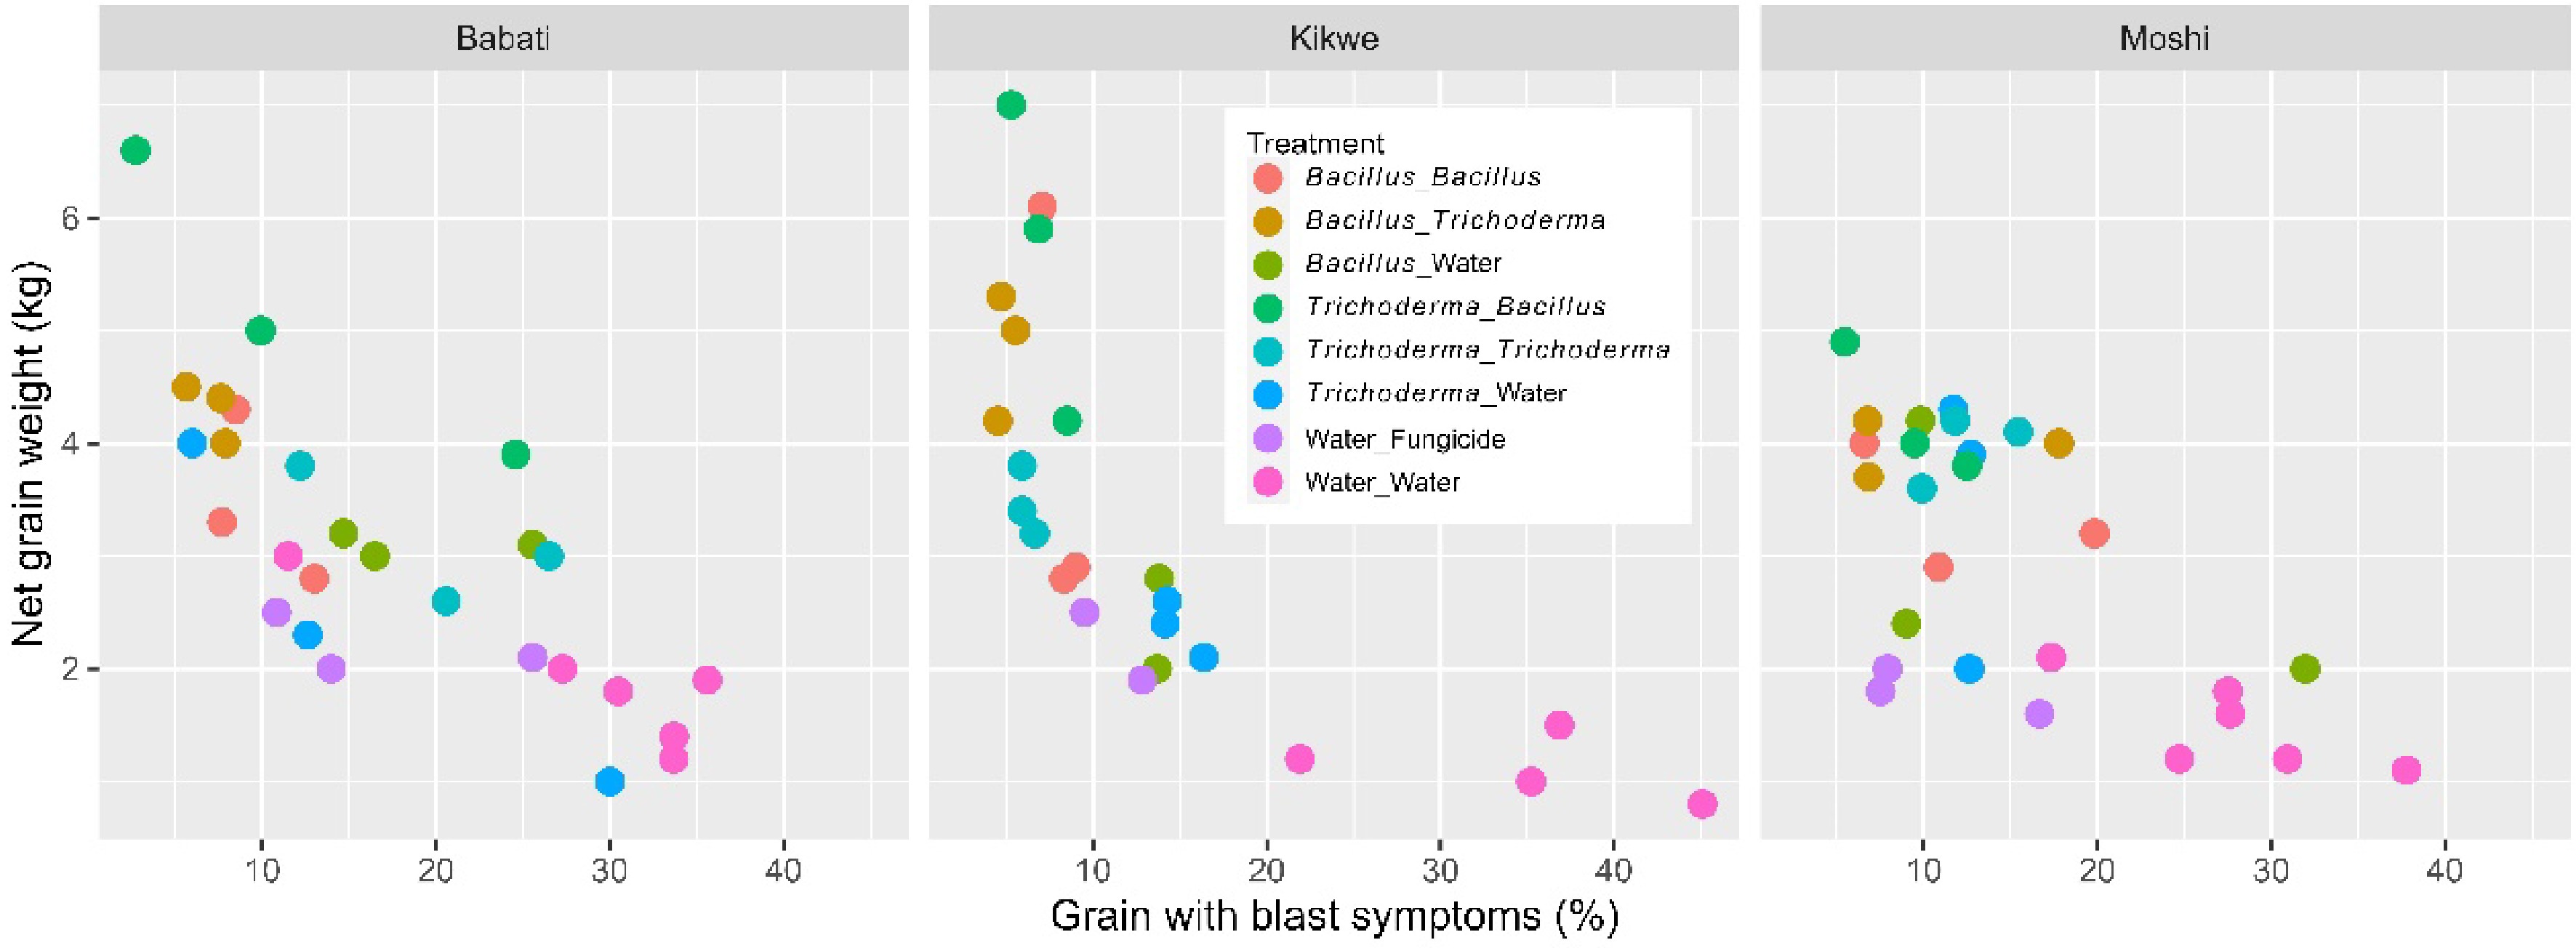
Figure 7.
Rice grain yield against the % grain with blast symptom in each plot of rice plants that had received water/fungicide or one of the two biopesticides as dipping at transplanting only, or both as dipping and as foliar spray at three sites in Tanzania in 2022.
-
Treatment 1
(dipping : spraying)Treatment 2
(dipping : spraying)Differences p value Tiller number on the final assessment date Water control Bacillus : Bacillus −0.104 0.0247 Water control Bacillus : Water −0.111 0.0124 Water control Serratia : Serratia −0.099 0.0383 Water control Serratia : Water −0.114 0.0094 Water control Trichoderma : Trichoderma −0.107 0.0189 Water control Trichoderma : Water −0.109 0.0146 Number of seeds per panicle (on the natural logarithm scale) Trichoderma : Water Serratia : Water 0.156 0.0320 Water control Bacillus : Bacillus −0.200 0.0015 Water control Bacillus : Water −0.181 0.0062 Water control Serratia : Serratia −0.184 0.0049 Water control Serratia : Water −0.188 0.0036 Water control Trichoderma : Trichoderma −0.217 0.0004 Water control Trichoderma : Water −0.241 0.0001 Water control Fungicide −0.155 0.0331 Incidence of tillers with blast symptoms (on the logit scale) Water control Bacillus : Bacillus 0.685 0.0000 Water control Bacillus : Trichoderma 0.785 0.0000 Water control Serratia coating 0.554 0.0000 Water control Serratia : Serratia 0.618 0.0000 Water control Serratia : Water 0.608 0.0000 Water control Trichoderma : Trichoderma 0.639 0.0000 Water control Trichoderma : Water 0.532 0.0000 Water control Fungicide 0.597 0.0000 Table 1.
Significant pairwise comparisons among the nine treatments applied to rice plants at one site in Kenya across two cropping seasons in 2022, based on the Tukey HSD test. The nine treatments included three biopesticides (Bacillus subtilis, Trichoderma asperellum and Serratia nematodiphila), each applied as dipping at transplanting, and post-transplanting foliar spray as well as dipping, and two controls (water and foliar fungicide spray). The final treatment was seed coating with S. nematodiphila.
-
Treatment 1
(dipping : spraying)Treatment 2
(dipping : spraying)Differences p value Number of tillers (on a log scale) Bacillus : Bacillus Water control 0.307 0.0108 Bacillus : Trichoderma Water control 0.328 0.0050 Trichoderma : Bacillus Water control 0.403 0.0002 Trichoderma : Trichoderma Water control 0.284 0.0239 Tiller height (cm – on a log scale) Bacillus : Bacillus Water control 0.222 0.0002 Bacillus : Trichoderma Water control 0.193 0.0016 Bacillus : Water Water control 0.181 0.0038 Trichoderma : Bacillus Water control 0.269 0.0000 Trichoderma : Trichoderma Water control 0.183 0.0032 Trichoderma : Water Water control 0.179 0.0045 Days to 30% flowering (on a log scale) Bacillus : Water Trichoderma : Bacillus 0.144 0.0098 Trichoderma : Trichoderma Trichoderma : Bacillus 0.131 0.0256 Trichoderma : Water Trichoderma : Bacillus 0.155 0.0039 Fungicide Bacillus : Bacillus 0.179 0.0005 Fungicide Bacillus : Trichoderma 0.193 0.0001 Fungicide Bacillus : Water 0.130 0.0285 Fungicide Trichoderma : Bacillus 0.274 0.0000 Fungicide Trichoderma : Trichoderma 0.142 0.0110 Fungicide Trichoderma : Water 0.119 0.0614 Water control Bacillus : Bacillus 0.148 0.0010 Water control Bacillus : Trichoderma 0.163 0.0002 Water control Trichoderma : Bacillus 0.243 0.0000 Water control Trichoderma : Trichoderma 0.112 0.0296 Number of seeds per pedicle (on a log scale) Bacillus : Trichoderma Fungicide 0.200 0.0022 Trichoderma : Bacillus Fungicide 0.209 0.0011 Bacillus : Bacillus Water control 0.248 0.0000 Bacillus : Trichoderma Water control 0.324 0.0000 Bacillus : Water Water control 0.200 0.0002 Trichoderma : Bacillus Water control 0.333 0.0000 Trichoderma : Trichoderma Water control 0.203 0.0002 Trichoderma : Water Water control 0.206 0.0001 Shelled yield (kg per plot on a log scale) Bacillus : Trichoderma Bacillus : Water 0.460 0.0086 Trichoderma : Bacillus Bacillus : Water 0.583 0.0003 Bacillus : Trichoderma Trichoderma : Water 0.545 0.0009 Trichoderma : Bacillus Trichoderma : Water 0.669 0.0000 Bacillus : Bacillus Fungicide 0.514 0.0021 Bacillus : Trichoderma Fungicide 0.737 0.0000 Trichoderma : Bacillus Fungicide 0.861 0.0000 Trichoderma : Trichoderma Fungicide 0.518 0.0019 Bacillus : Bacillus Water control 0.882 0.0000 Bacillus : Trichoderma Water control 1.105 0.0000 Bacillus : Water Water control 0.646 0.0000 Trichoderma : Bacillus Water control 1.229 0.0000 Trichoderma : Trichoderma Water control 0.886 0.0000 Trichoderma : Water Water control 0.560 0.0000 Fungicide Water control 0.368 0.0202 Incidence of grains with blast symptoms (on the logit scale) Bacillus : Water Bacillus : Trichoderma 0.854 0.0030 Bacillus : Water Trichoderma : Bacillus 0.683 0.0350 Trichoderma : Water Bacillus : Trichoderma 0.703 0.0266 Water control Bacillus : Bacillus 1.250 0.0000 Water control Bacillus : Trichoderma 1.580 0.0000 Water control Bacillus : Water 0.726 0.0037 Water control Trichoderma : Bacillus 1.409 0.0000 Water control Trichoderma : Trichoderma 1.061 0.0000 Water control Trichoderma : Water 0.877 0.0002 Water control Fungicide 1.012 0.0000 Table 2.
Significant pairwise comparisons for all eight treatments applied to rice plants at three trial sites in Tanzania in 2022, based on the Tukey HSD test. The eight treatments included six microbial treatments and two controls (water and fungicide foliar spray).
Figures
(7)
Tables
(2)