-
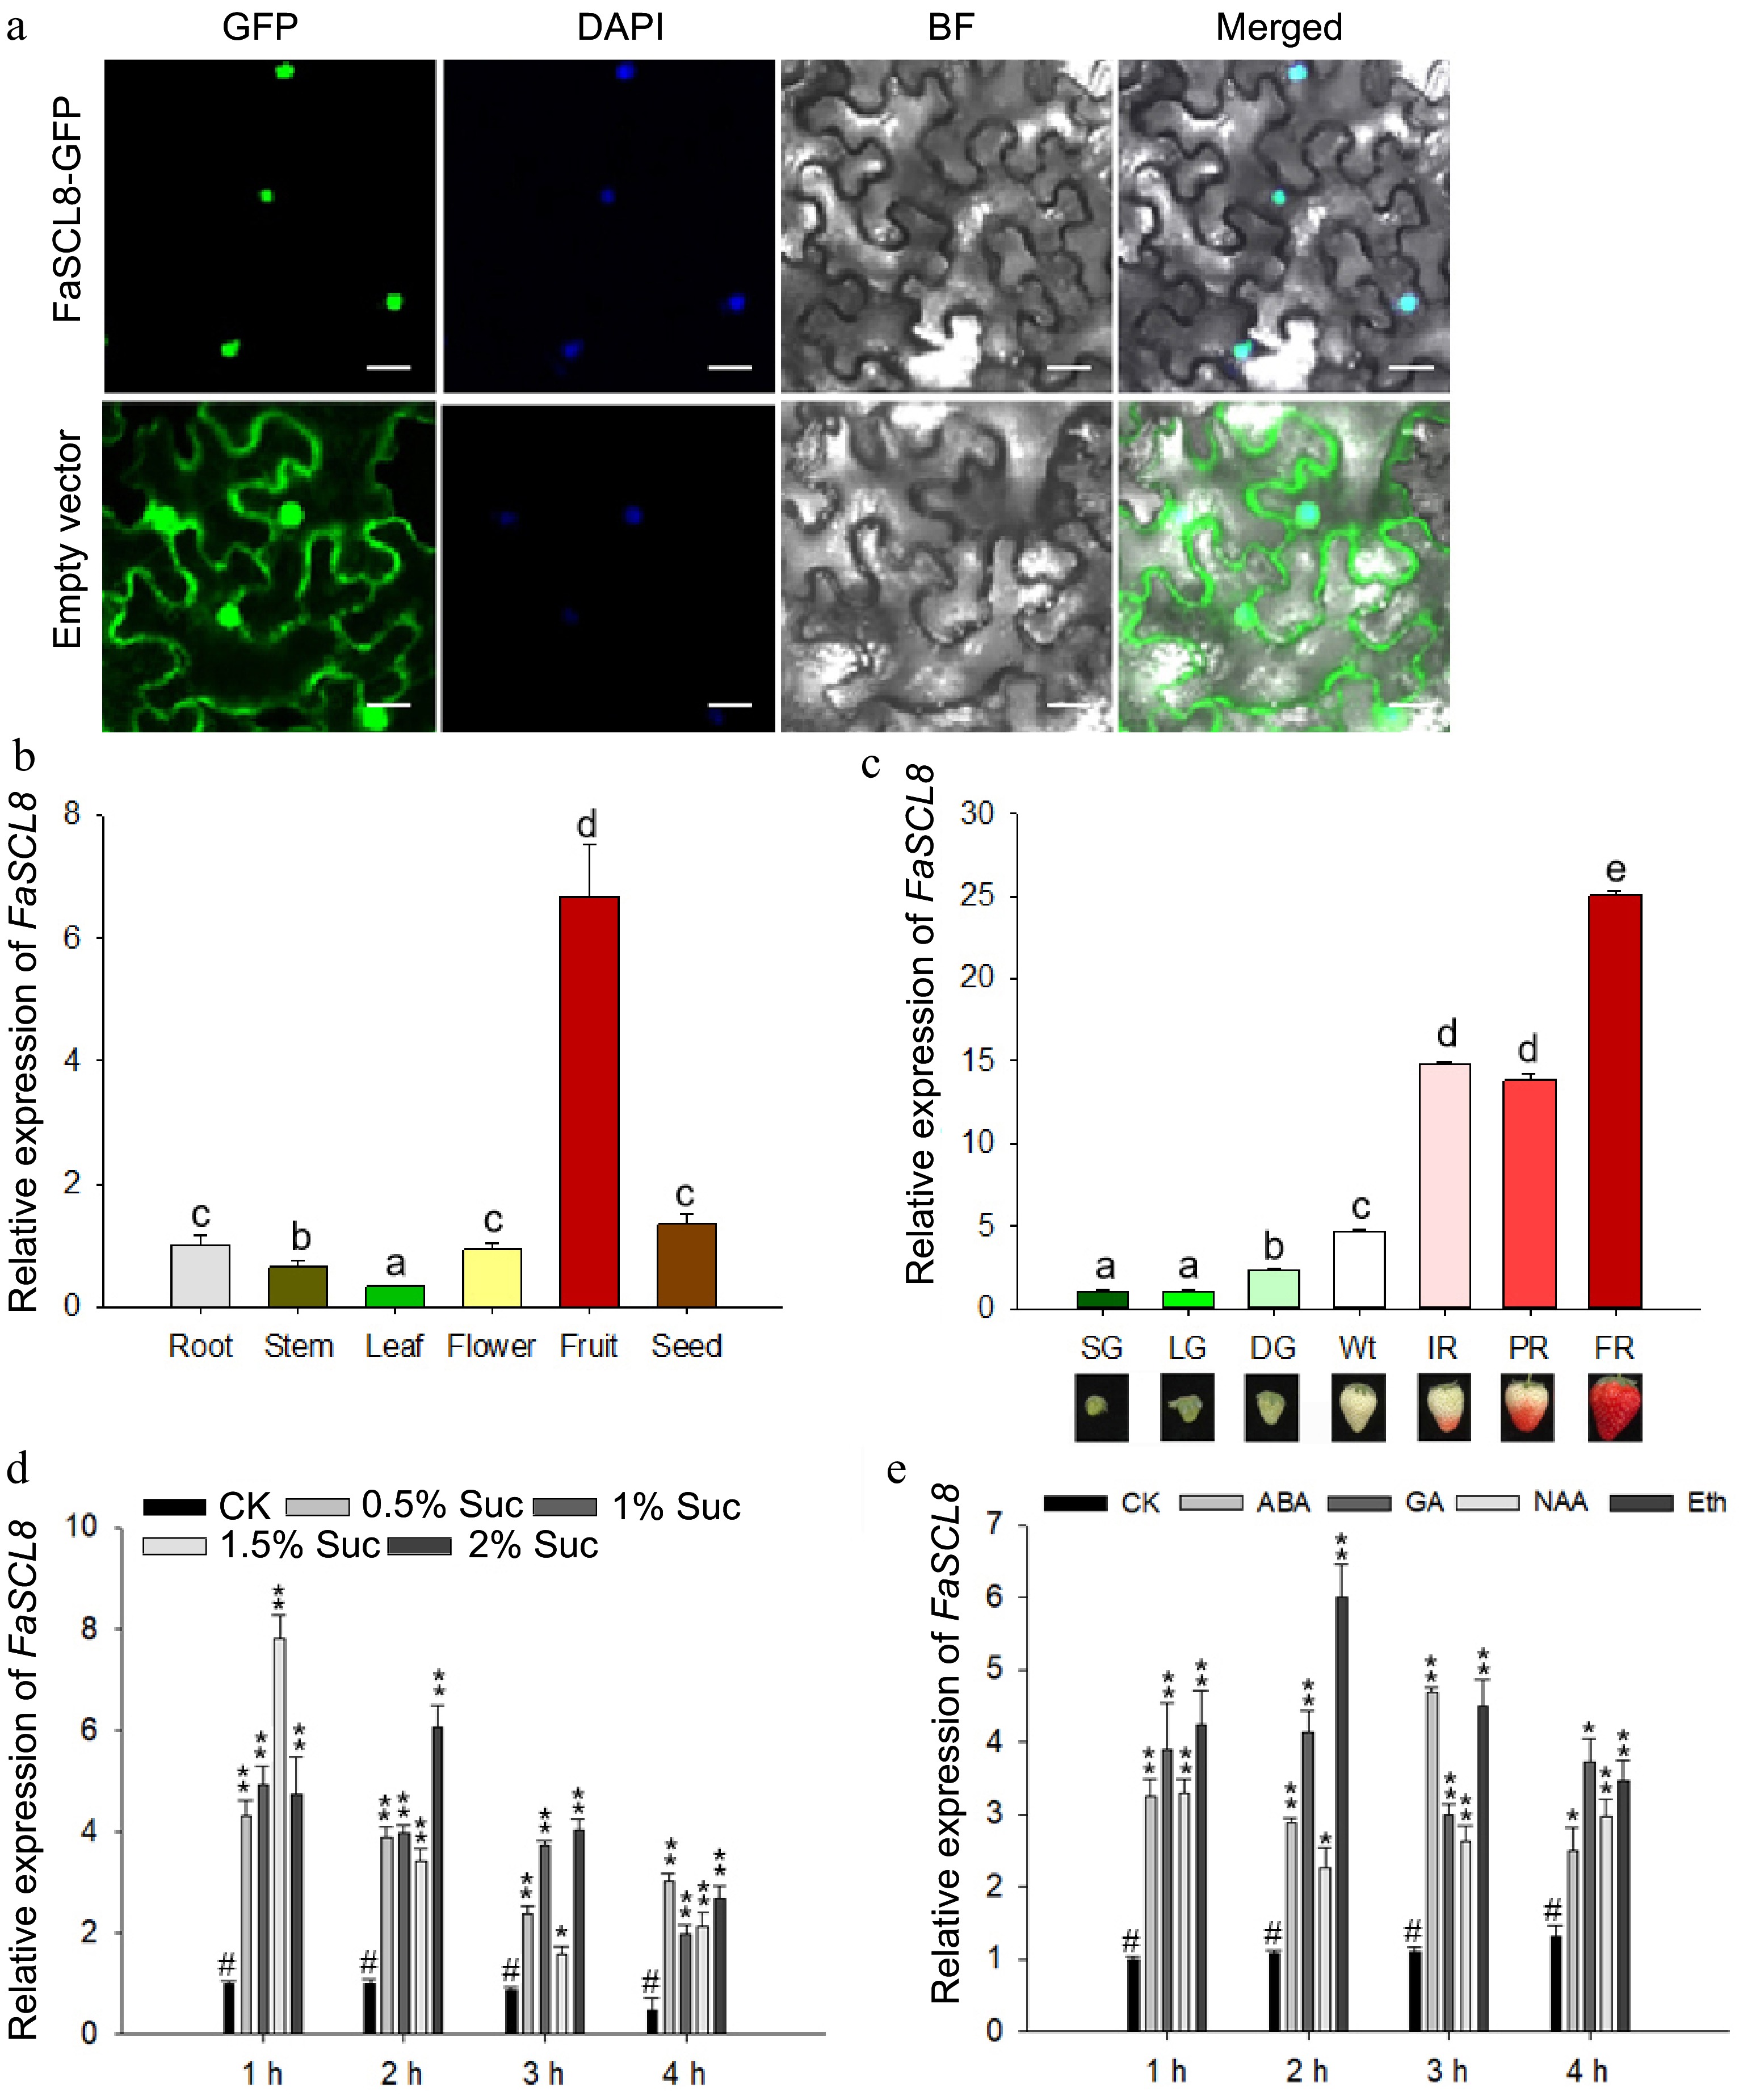
Figure 1.
FaCL8 localization and expression pattern at different stages and under different treatments. (a) Subcellular localization of FaSCL8-GFP fusions in transiently transformed N. benthamiana leaves. All experiments were assayed 48 h after infiltration. The same N. benthamiana leaves were stained with DAPI to show the locations of the nuclei. Bars = 20 um. (b) The transcript level of FaSCL8 in different tissues of strawberry. (c) FaSCL8 transcript levels in fruit receptacles at different developmental stages of Fragaria × ananassa cv. 'Benihoppe'. SG, small green fruit stage; LG, large green fruit stage; DG, green-white fruit stage; Wt, white fruit stage; IR, initial red fruit stage; PR, partial red fruit stage; FR, full ripening fruit stage. Relative expression values were relative to receptacles at the SG stage in all cases, which was assigned an arbitrary value equal to one. (d) The transcription level of FaSCL8 treated with different concentrations of sucrose. (e) The transcription level of FaSCL8 in fruit discs after exogenous plant hormones incubation. Bars are means SEs of three independent experiments (Student's t-test; * p < 0.05; ** p < 0.01).
-
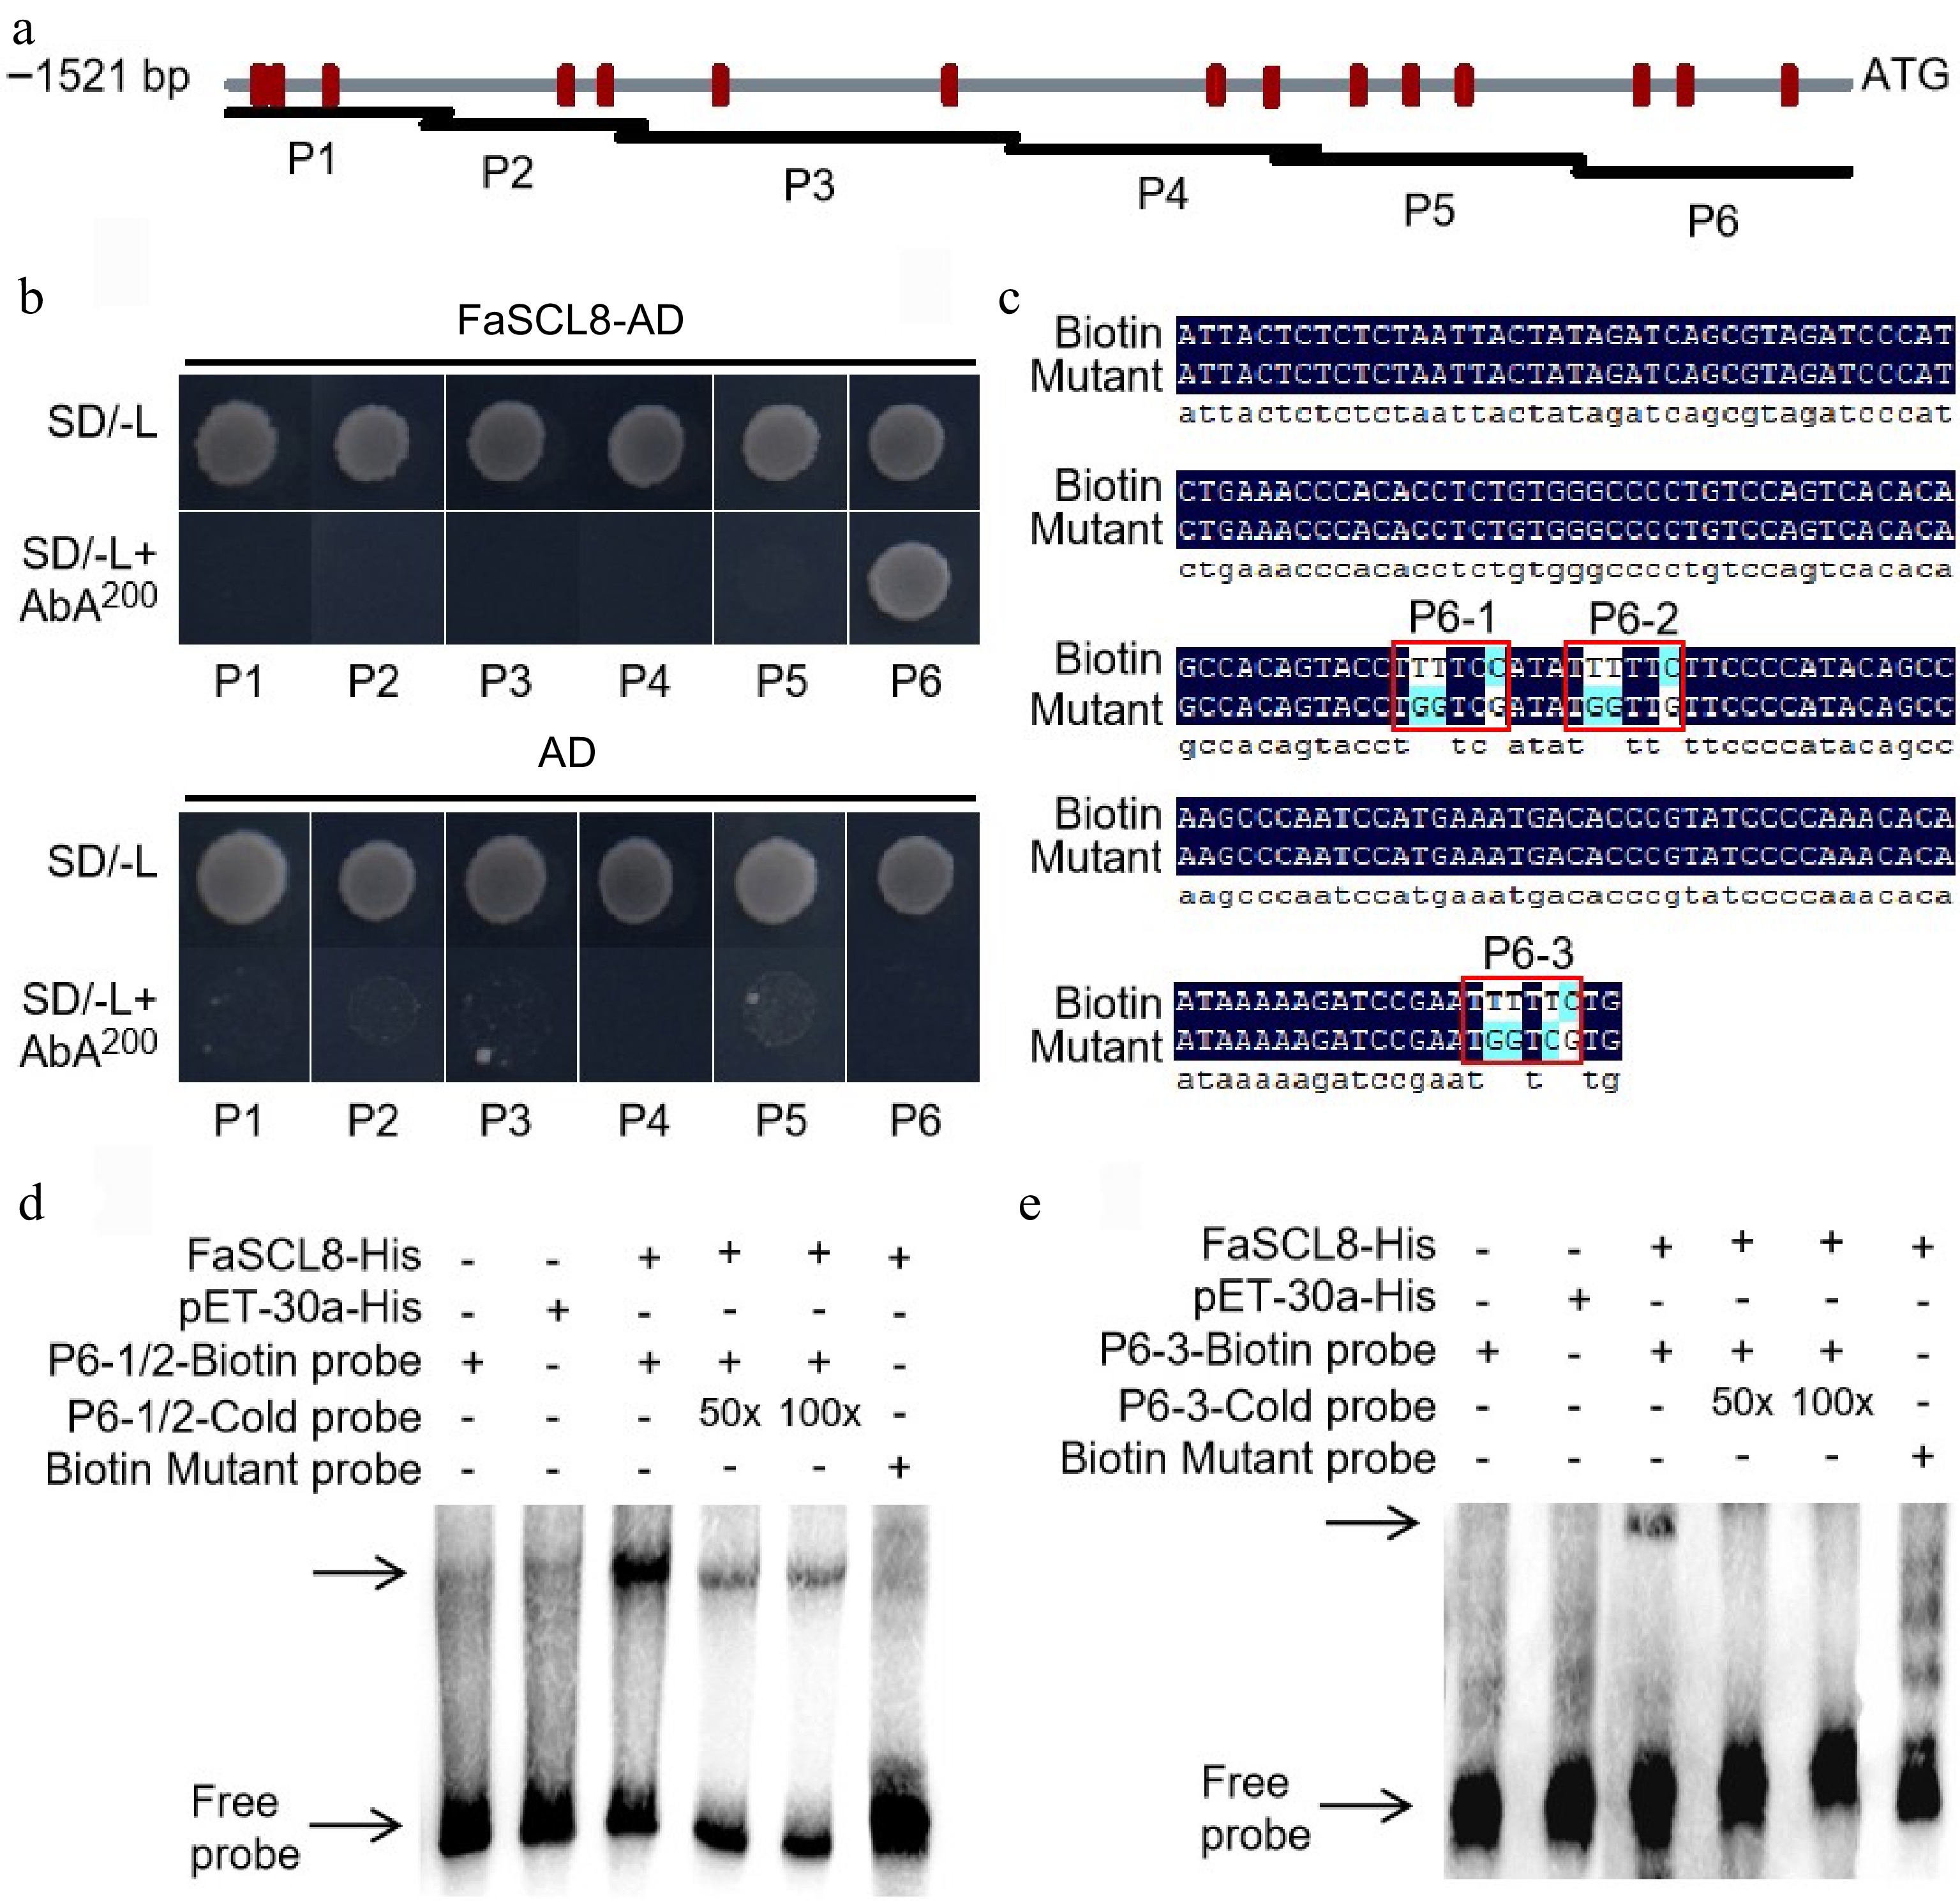
Figure 2.
FaSCL8 binds to FaVPT1 promoter. (a) Schematic diagram of FaVPT1 and its promoter, promoter area (gray line), GT element (red vertical line). (b) Yeast one-hybrid experiment verified that FaSCL8 combined with P6 promoter of FaVPT1 could grow on SD/-Leu medium with 200 ng/mL AbA. (c) P6-1/2 and P6-3 were shown in the figure, where P6-1/2 was −118 to −183 bp, and P6-3 was −36 to −105 bp, the binding of biotin labeled probe to its protein was a negative control, and the position of free probe band was shown by the arrow. EMSA between FaSCL8 and the promoters of (d) FaVPT1-P6-1/2 and (e) P6-3.
-
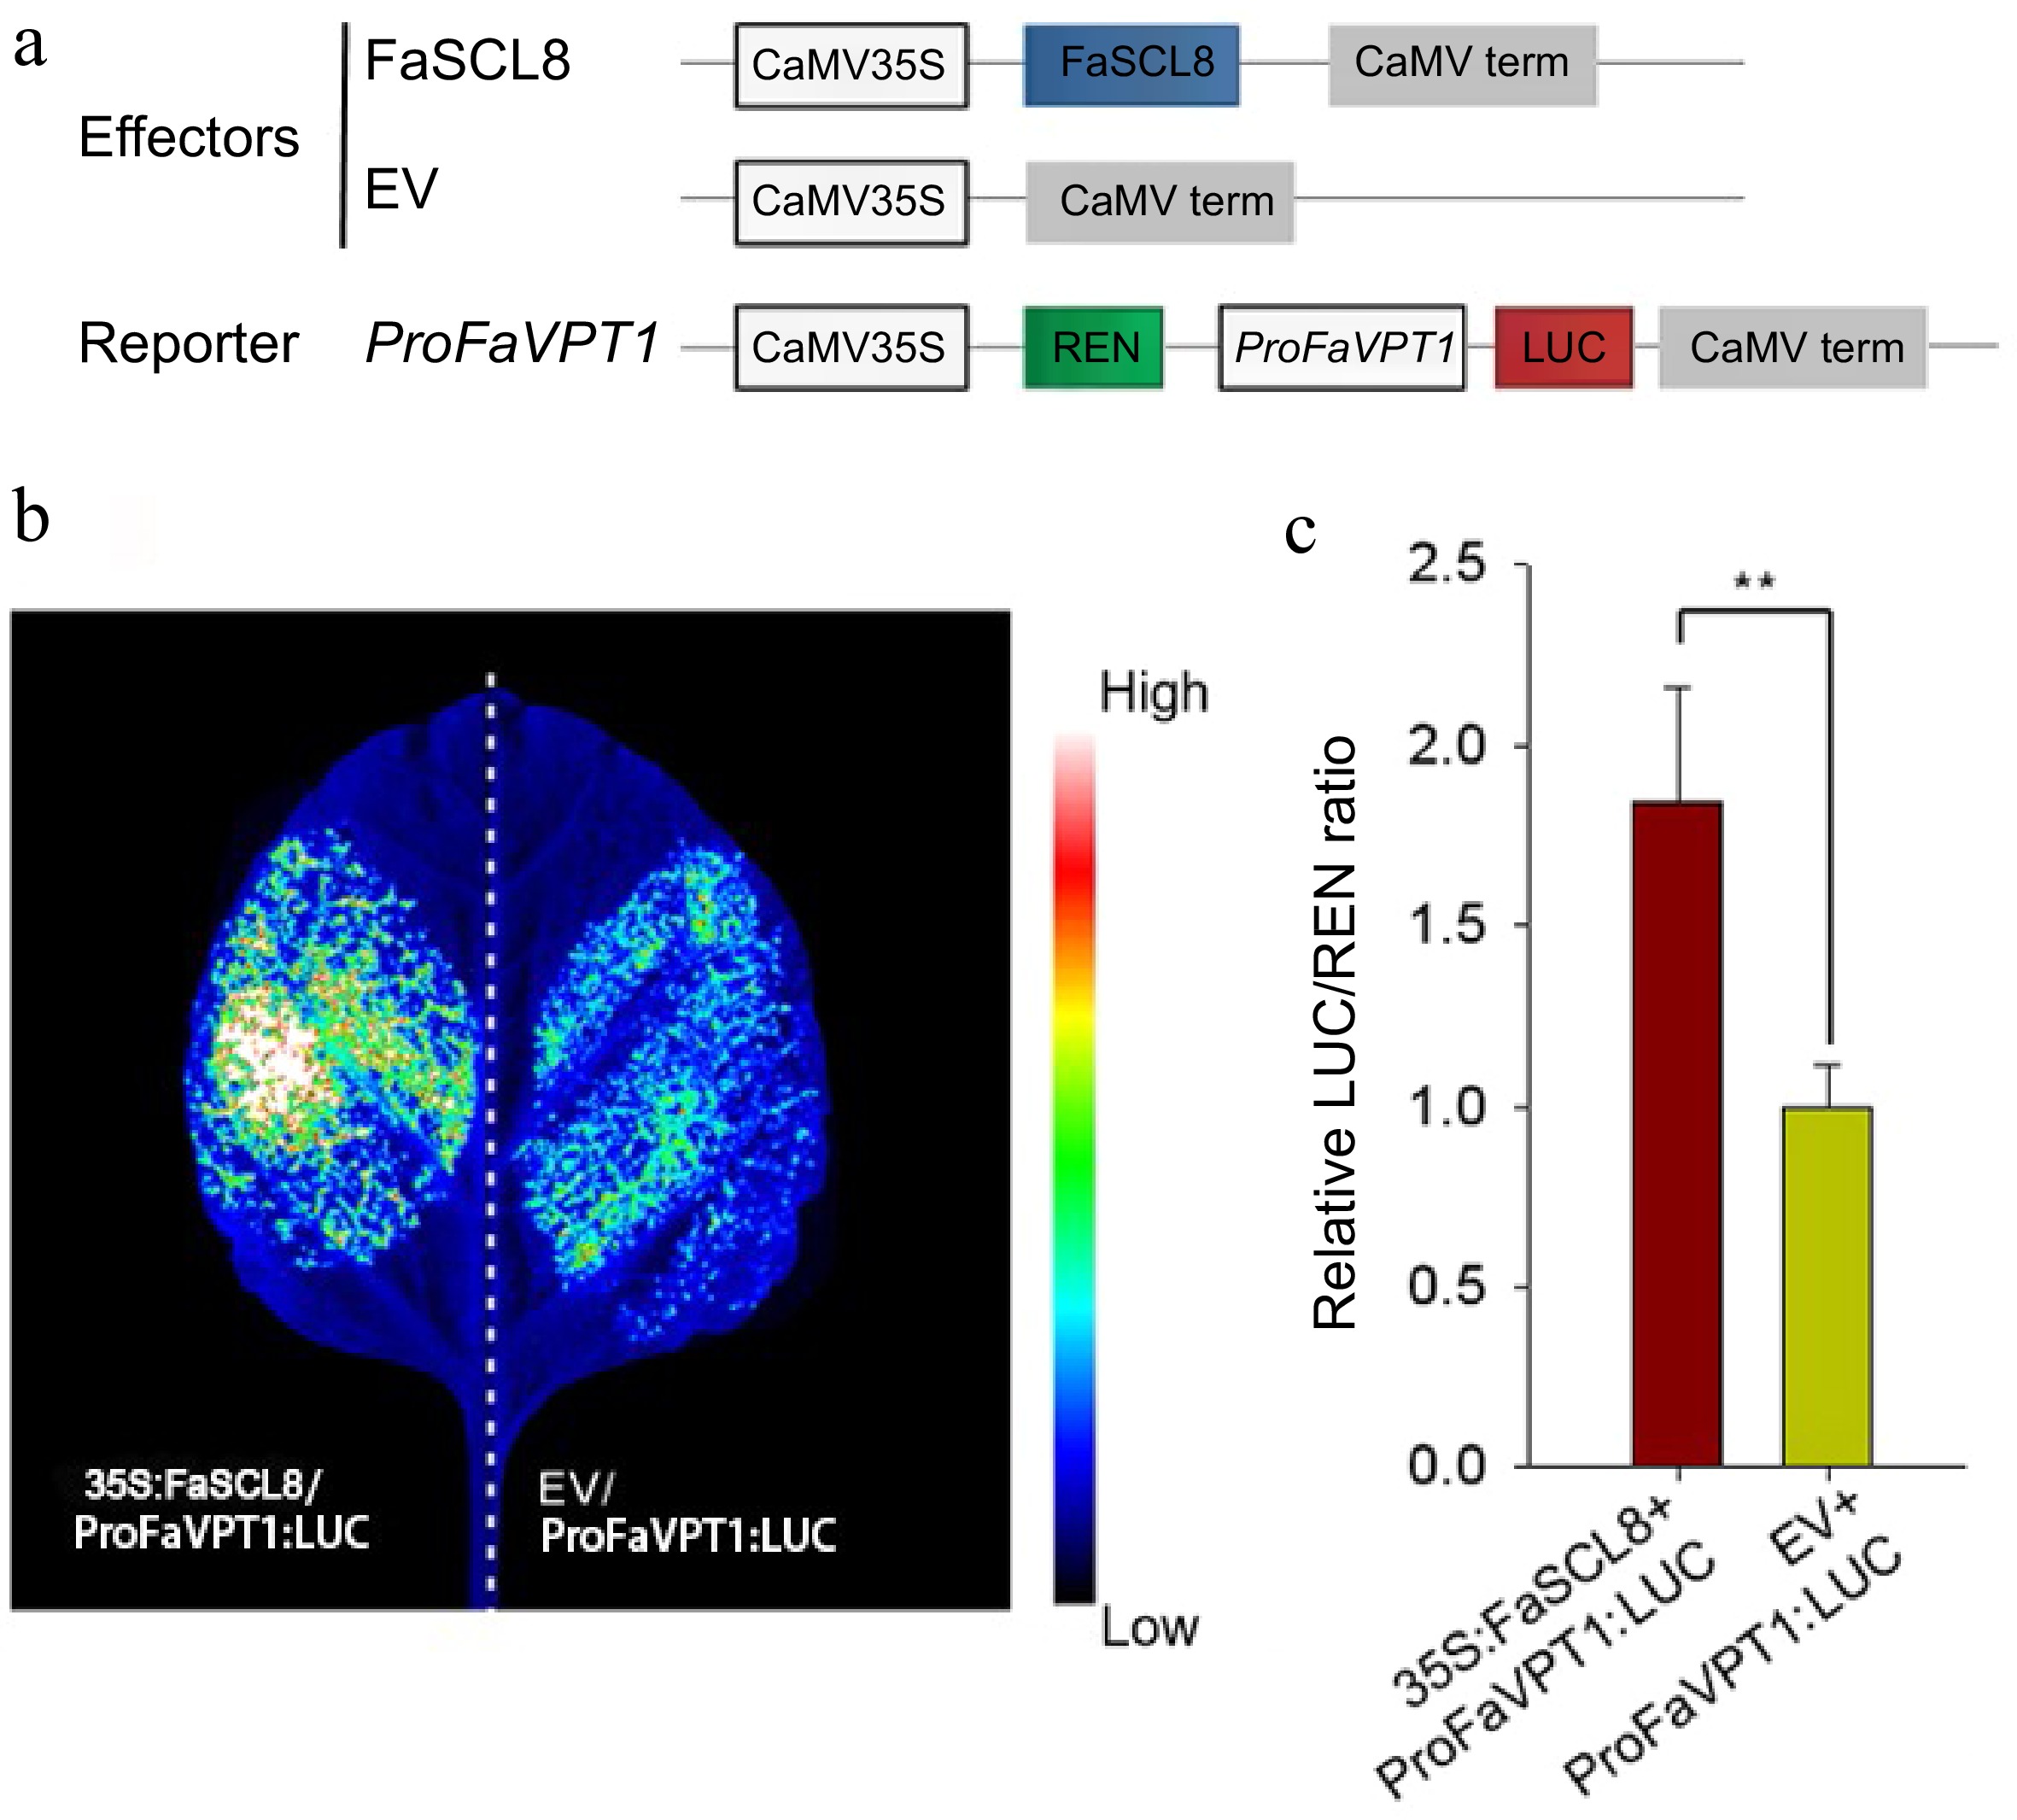
Figure 3.
FaSCL8 regulates the transcription of FaVPT1 in tobacco. (a) Schematic diagrams of the effector (35S:FaSCL8) and reporter vectors (ProFaVPT1:LUC) that were used in the dual-LUC assay. (b) Transactivation of the FaVPT1 promoter by FaSCL8. A representative image of an N. benthamiana leaf 48 h after infiltration is shown. Empty vectors: EV. (c) Promoter activities of FaVPT1 activated by FaSCL8 in dual-LUC assays were expressed as the ratio of LUC to REN in N. benthamiana leaves co-transformed with the effector and the reporter combinations. Data are means ± SE of five biological replicates. Statistical significance was determined using Student’s t test: ** p < 0.01.
-
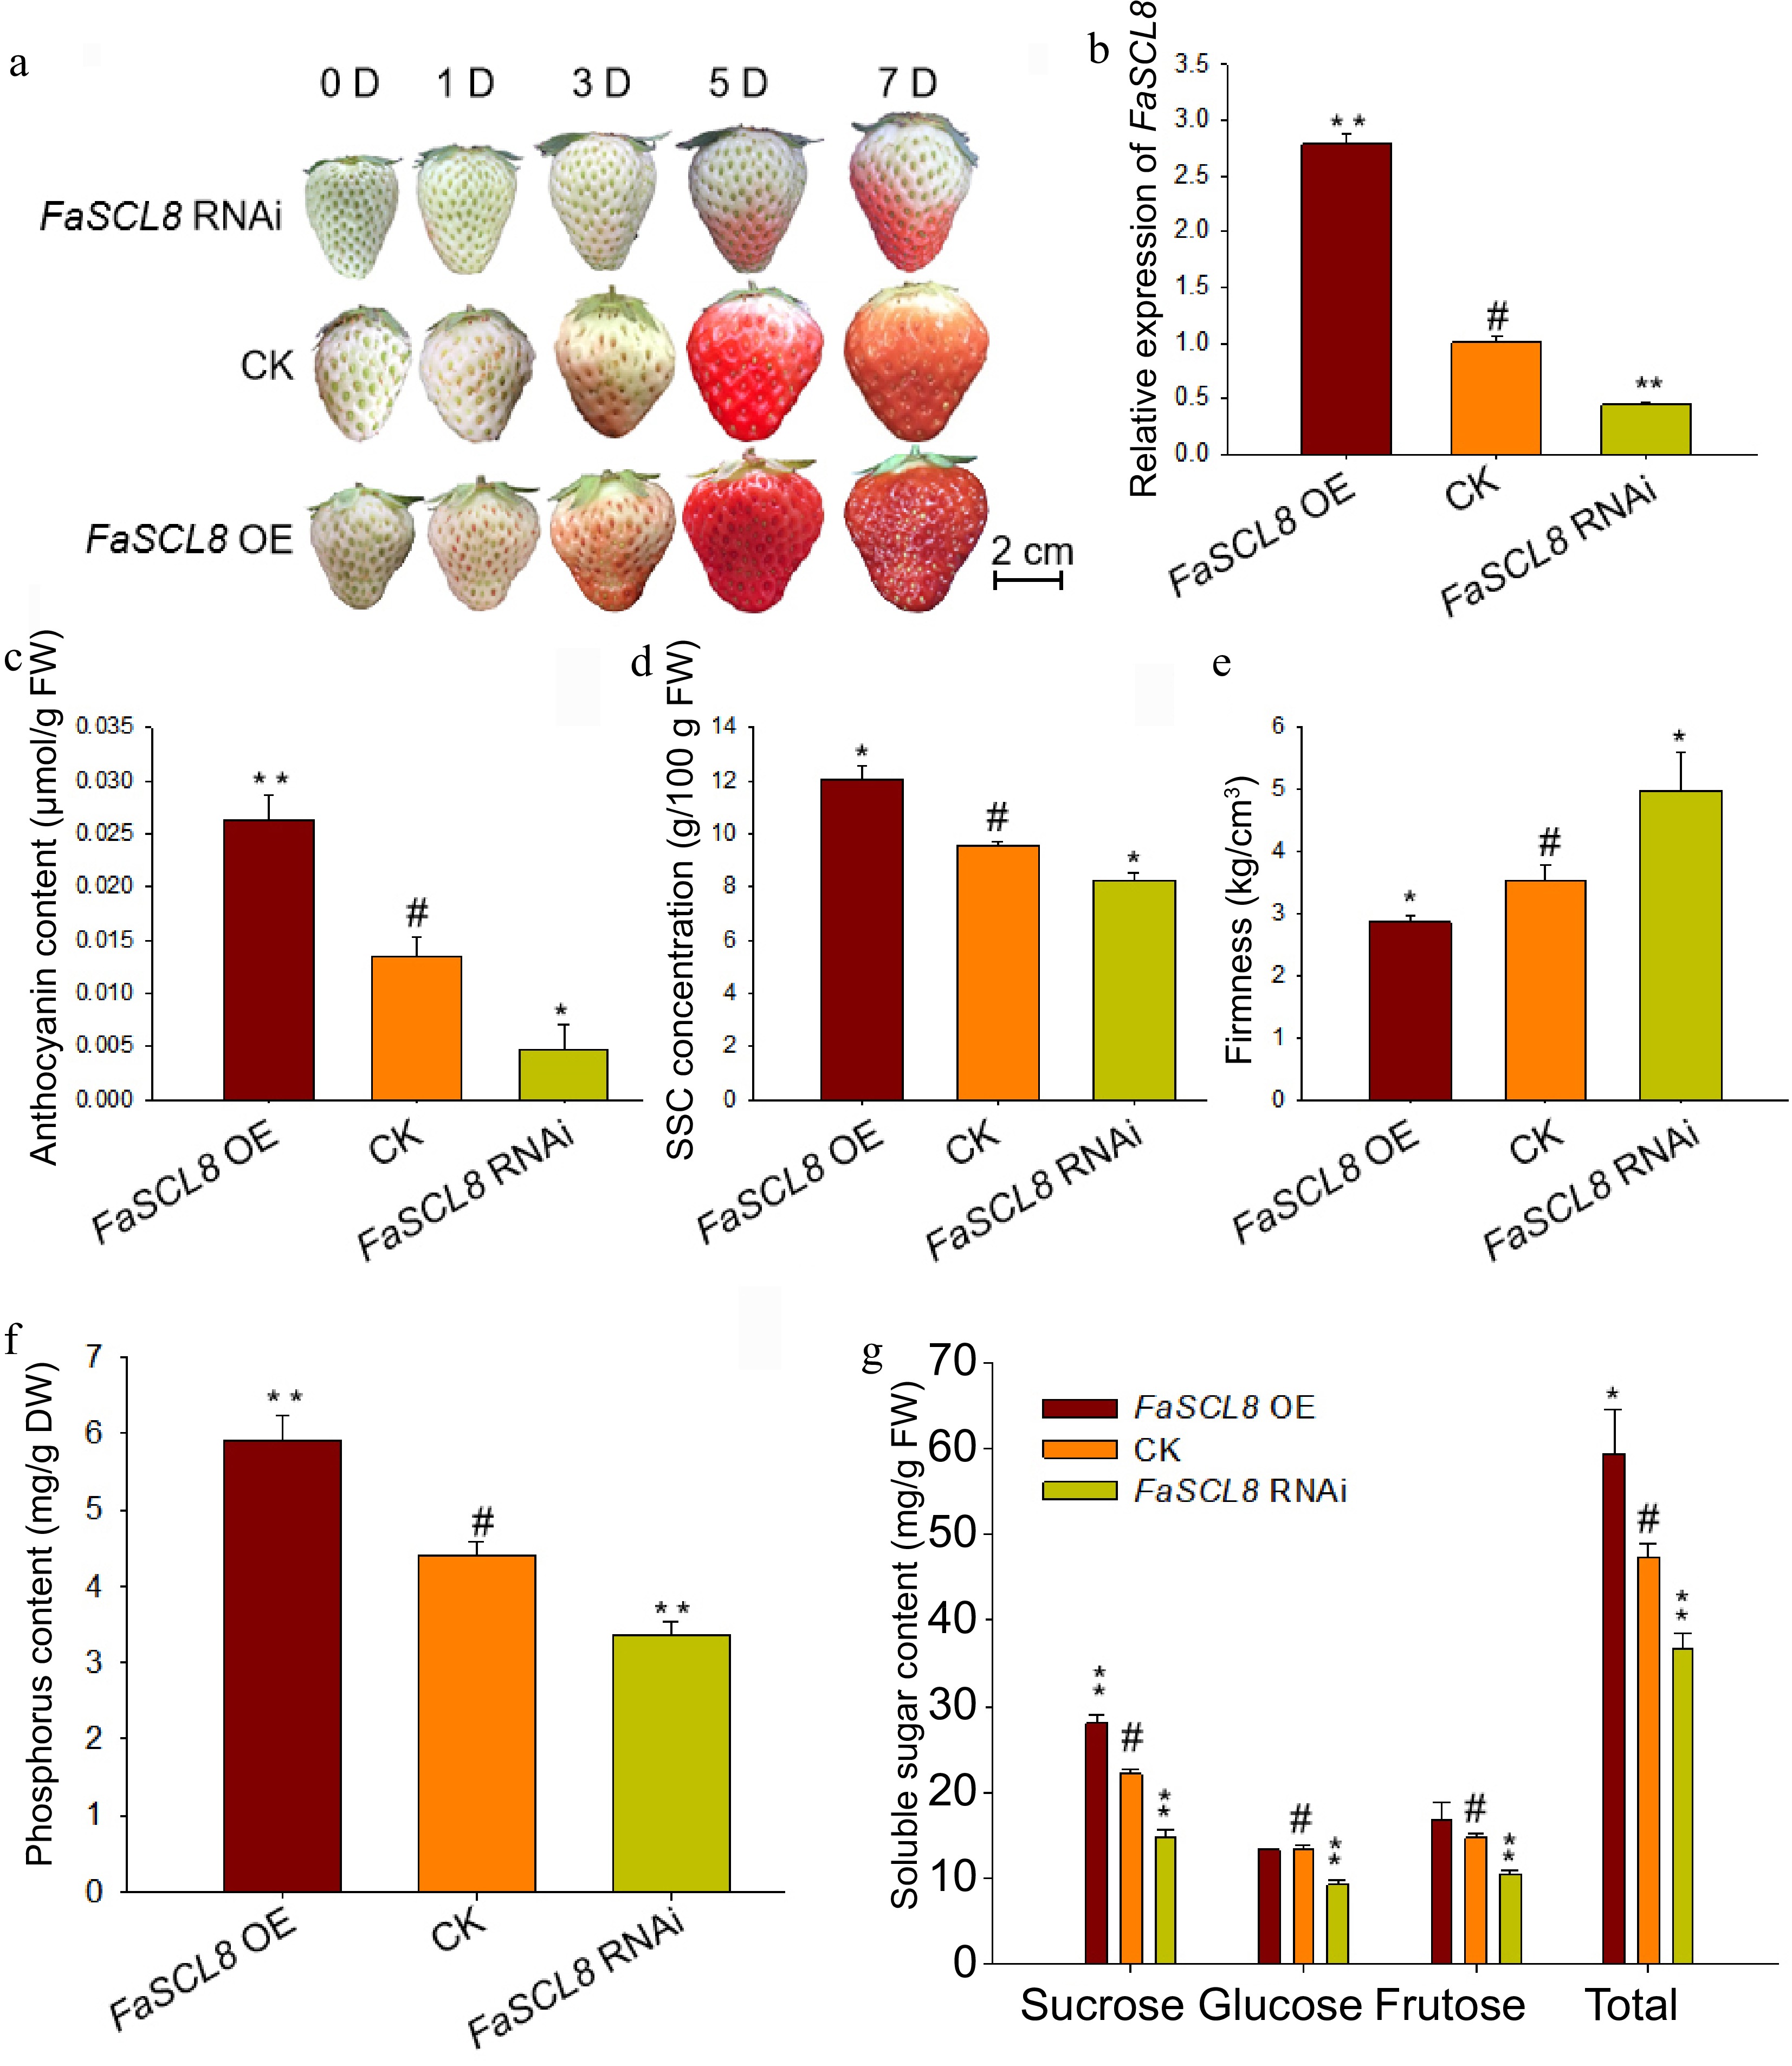
Figure 4.
Phenotype and physiological changes of FaSCL8 transgenic fruits. (a) Agrobacterium tumefaciens containing empty vectors, Super1300-FaSCL82028 or pk7GWIWG2(II)RR-FaSCL8226 constructs were injected into strawberry fruits at the de-green stage. After injection, photos were taken at 0, 1, 3, 5, and 7 d respectively to record the phenotype. (b) RT-qPCR was used to analyze the expression of FaSCL8 in OE, control and RNAi fruits, and three biological replicates were tested for all samples using the Actin gene from strawberry as an internal control. The relative expression levels were calculated using the 2−ΔΔCᴛ method. (c) Anthocyanin content, (d) SSC content, (e) firmness, (f) phosphorus, and (g) soluble sugar content of FaSCL8 transgenic and WT fruits. Bars are means SEs of three independent experiments (Student's t-test; * p < 0.05; ** p < 0.01).
-
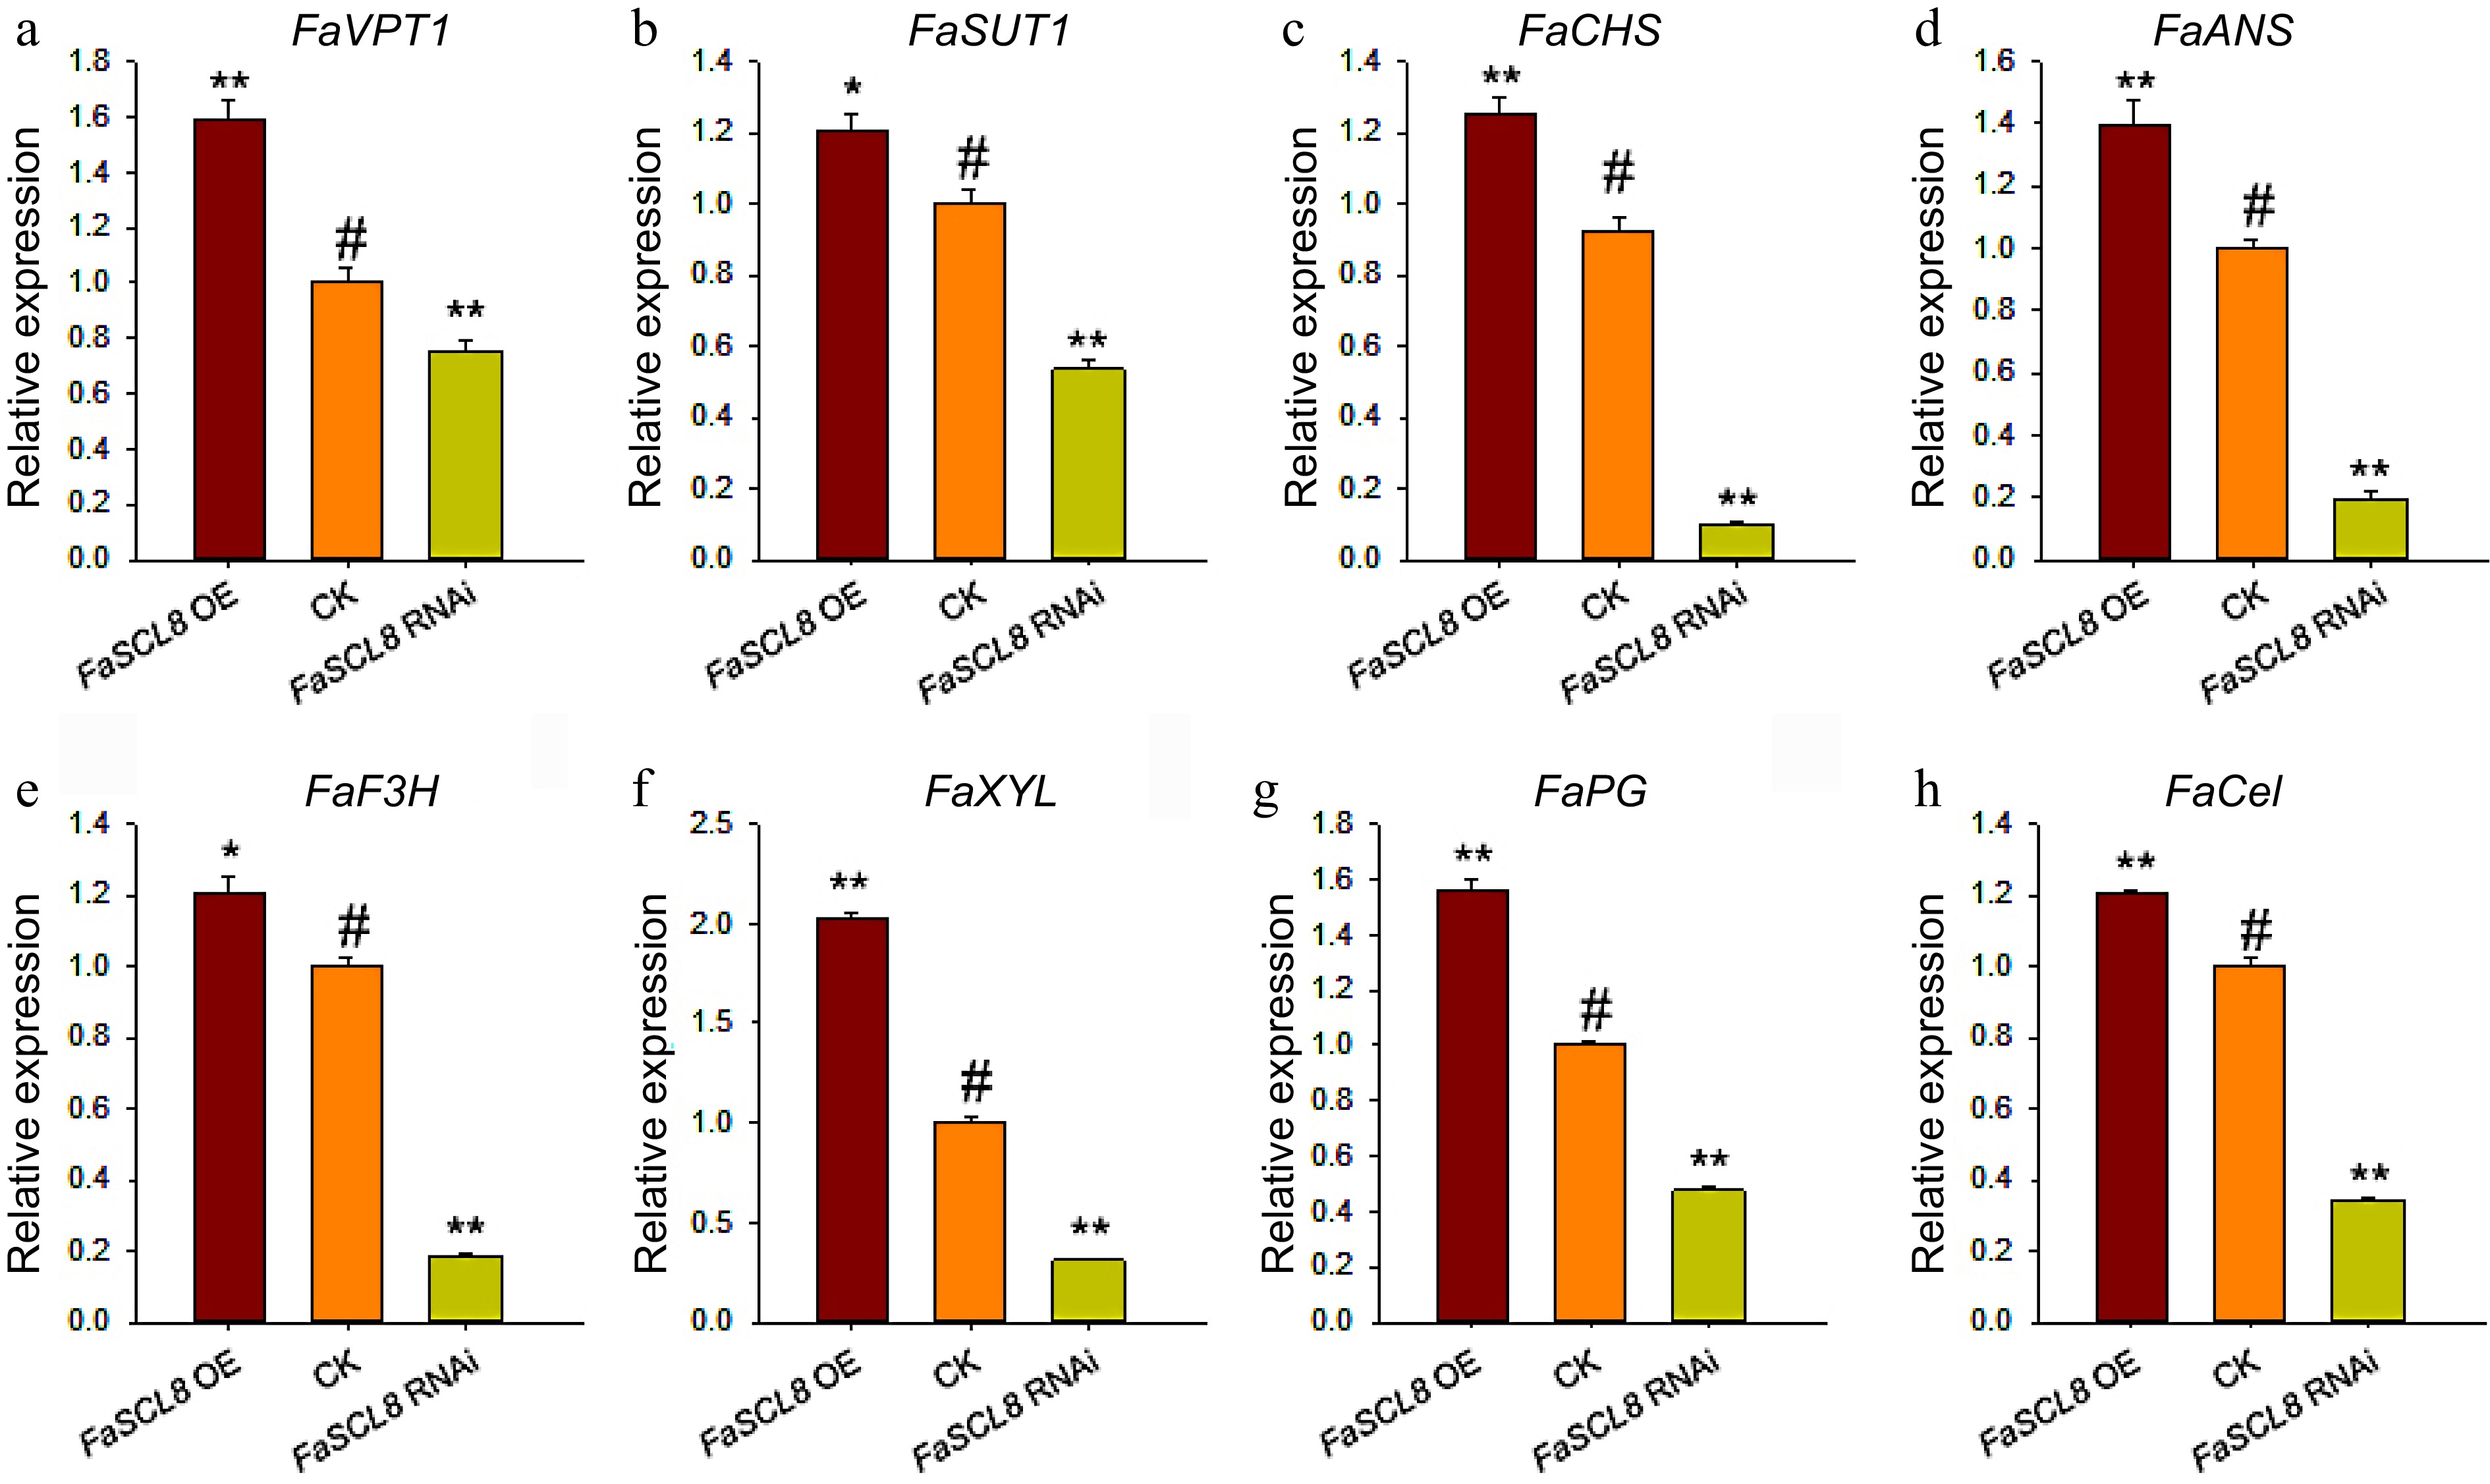
Figure 5.
Genes expression in FaSCL8 transgenic fruit. (a) Relative expression of FaVPT1 in the FaSCL8 transgenic and control lines. (b) Relative expression of FaSUT1 in the FaSCL8 transgenic and control lines. (c)−(e) Relative expression of anthocyanin biosynthesis genes in the FaSCL8 transgenic and control lines. (f)−(h) Relative expression of several genes associated with firmness in the FaSCL8 transgenic and control lines. All gene expression data were verified by RT-qPCR. The gene IDs of all verified genes are listed in Supplemental Table S1. Bars are means SEs of three independent experiments (Student's t-test; * p < 0.05; ** p < 0.01).
Figures
(5)
Tables
(0)