-
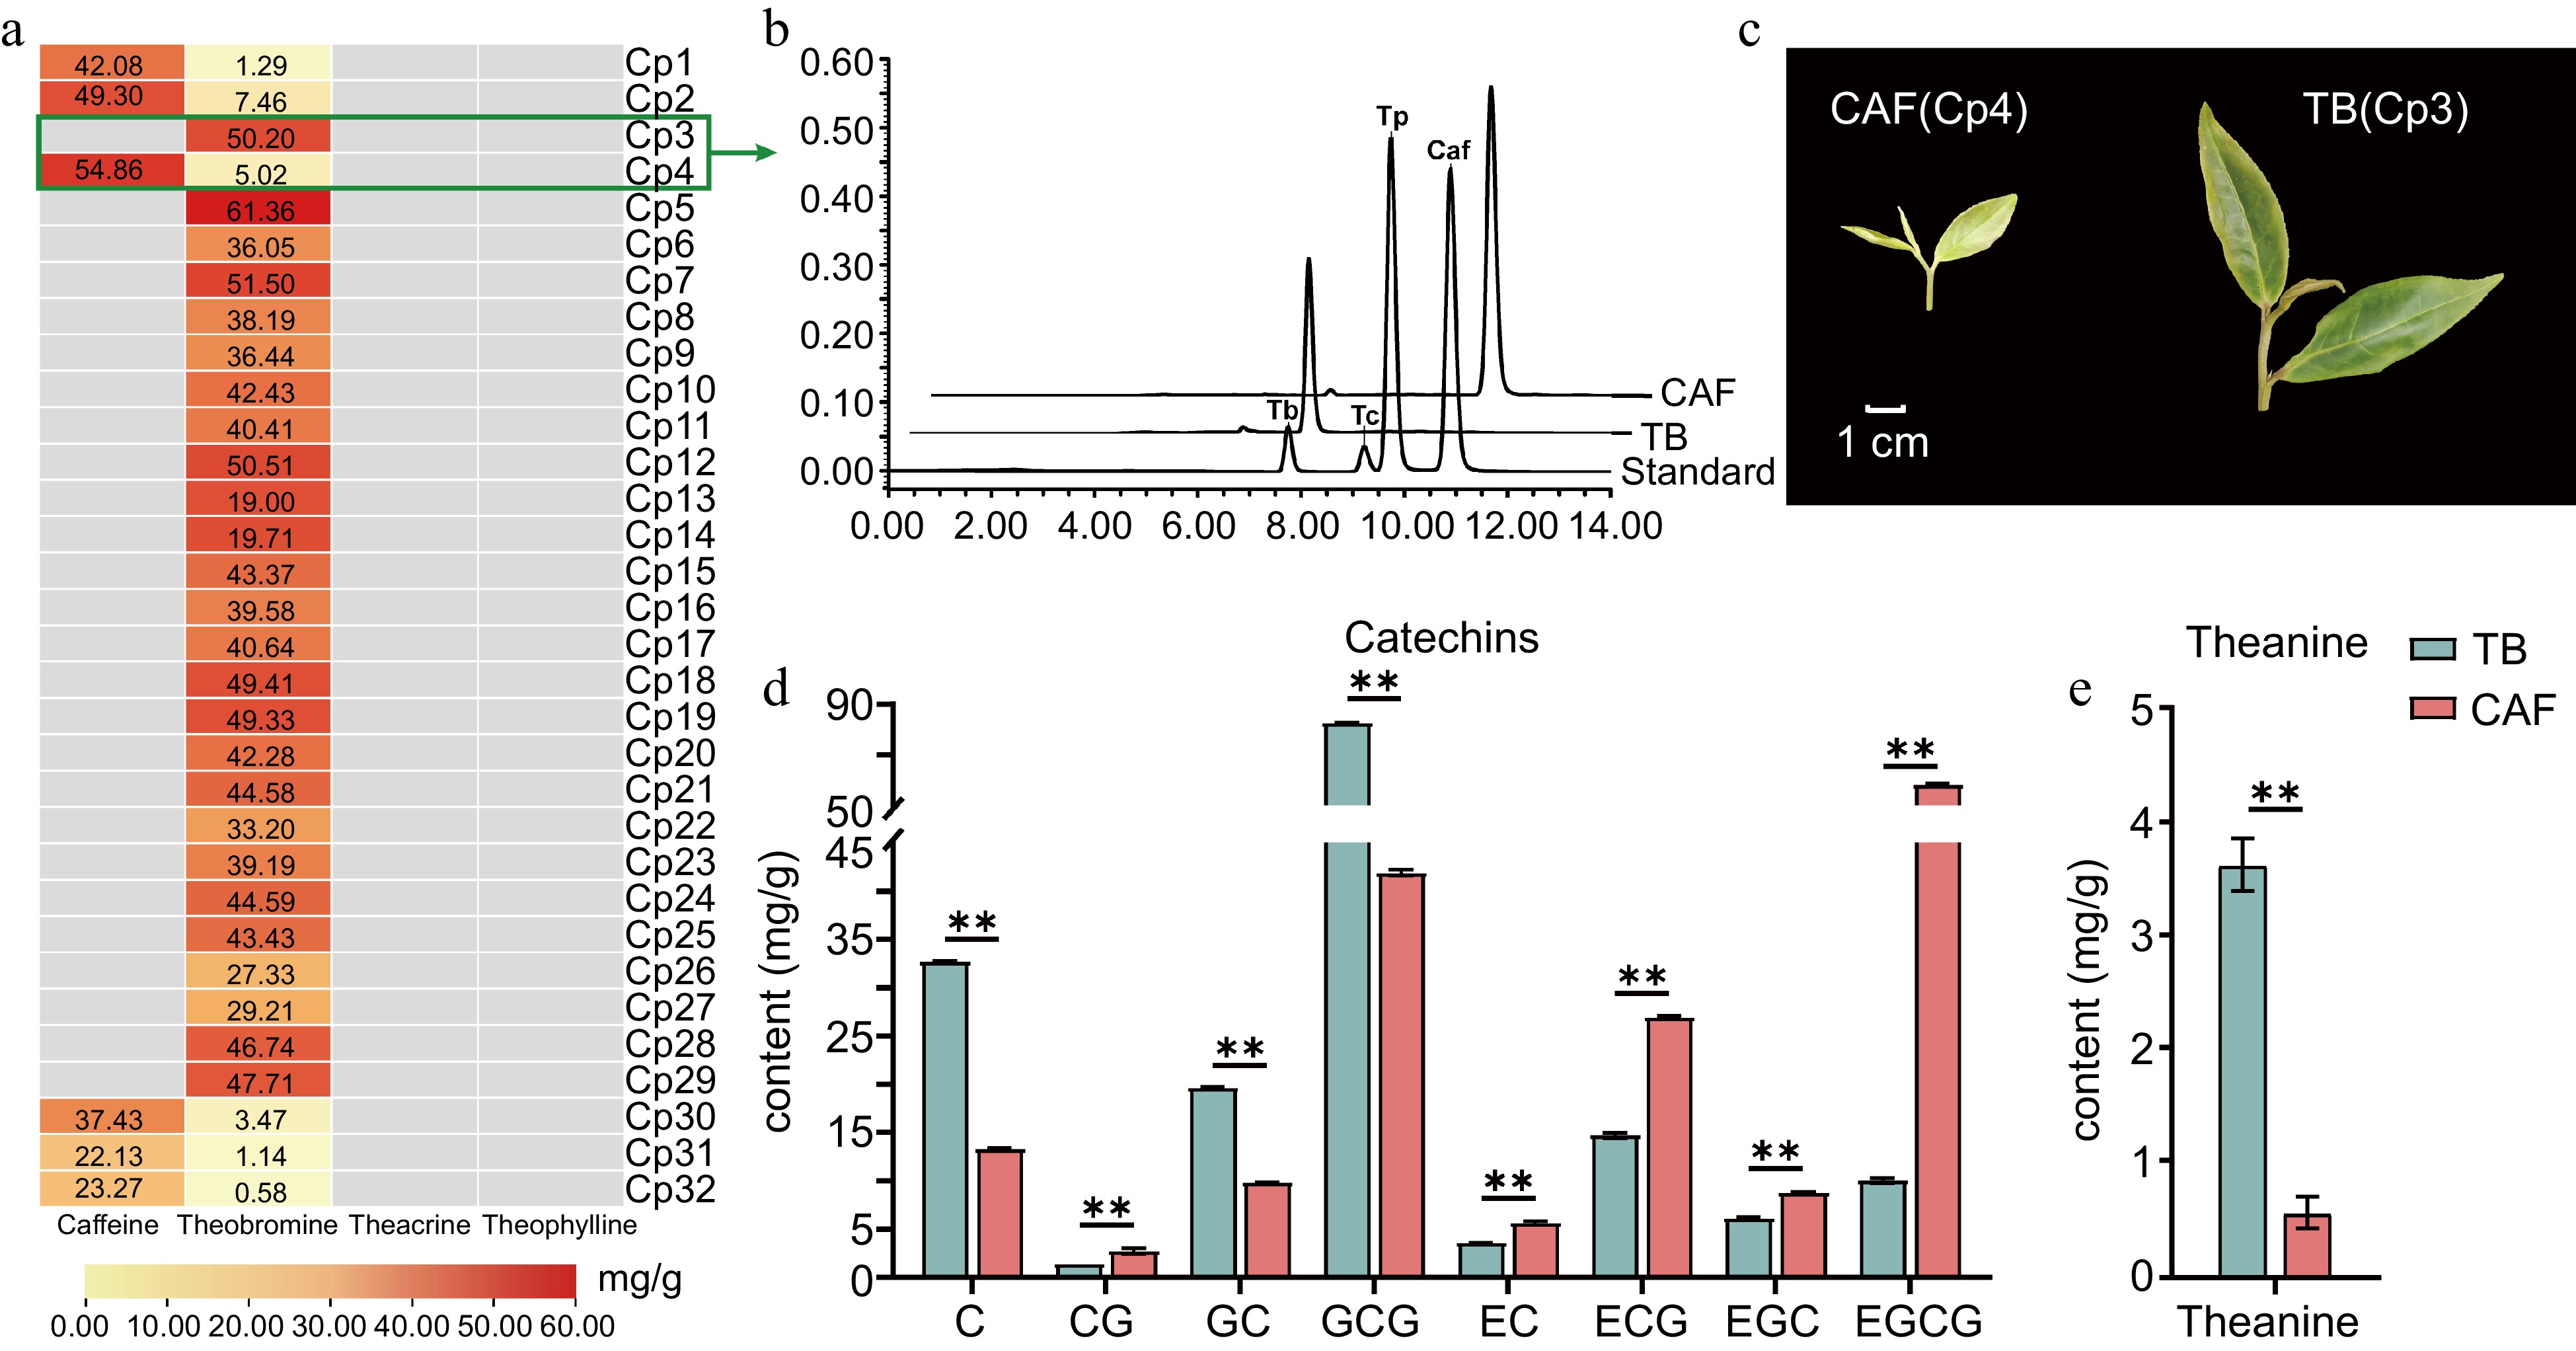
Figure 1.
The main secondary metabolites of Camellia ptilophylla. (a) Content of purine alkaloids in the tender leaves of 32 C. ptilophylla, where gray rectangles indicate the compound was not detected; (b) tender leaves of CAF and TB; (c) HPLC chromatogram of purine alkaloids (caffeine, theobromine, theacrine and theophylline) in TB and CAF; concentrations of (d) catechins and (e) theanine in TB and CAF. Catechin (C), gallocatechin (GC), epicatechin (EC), epigallocatechin (EGC), catechin gallate (CG), epicatechin gallate (ECG), gallocatechin gallate (GCG), and epigallocatechin gallate (EGCG). ** Significant difference between samples at the 0.01 level (P < 0.01) as determined by Student's t-test.
-
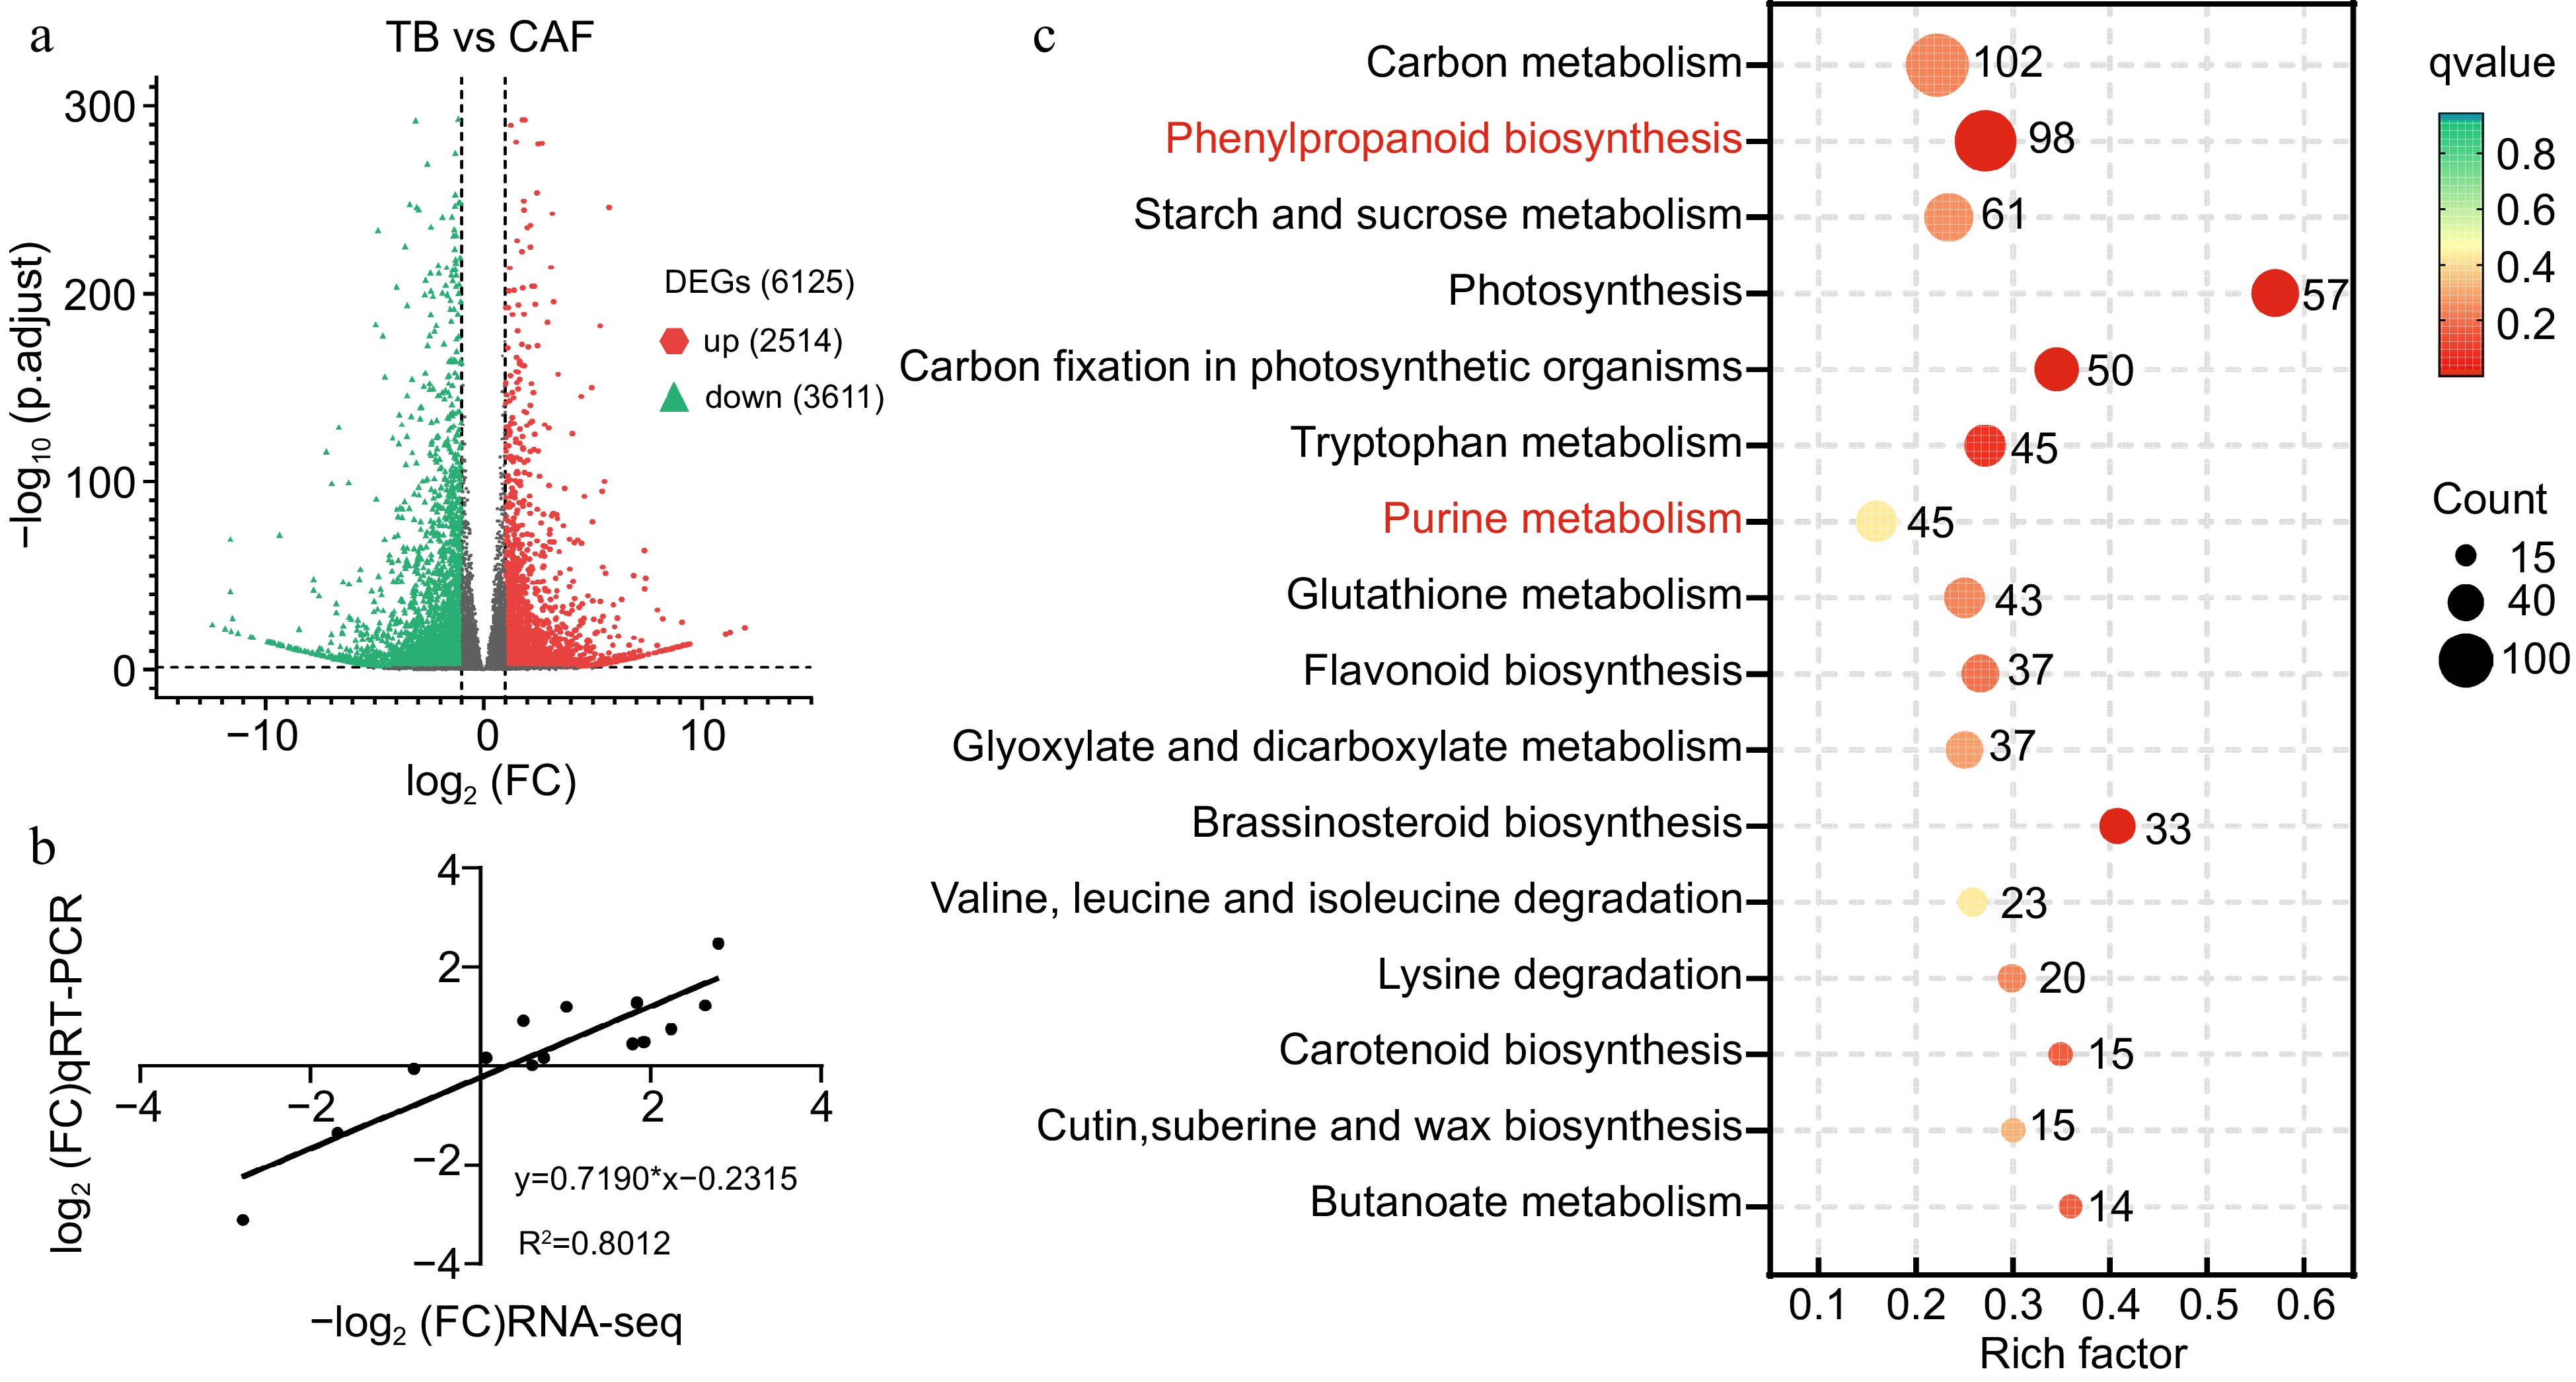
Figure 2.
(a) Volcano map showing differentially expressed genes (DEGs) between TB and CAF plants; (b) scatterplot of RNA-seq transcript abundance fold change values RNA-Seq (on the x-axis) plotted against RT-PCR expression values (on the y-axis). Actin (TEA019484) was used as the internal reference gene; and (c) KEGG pathways for the DEGs between TB and CAF. Red indicates the two pathways that were subsequently analyzed.
-
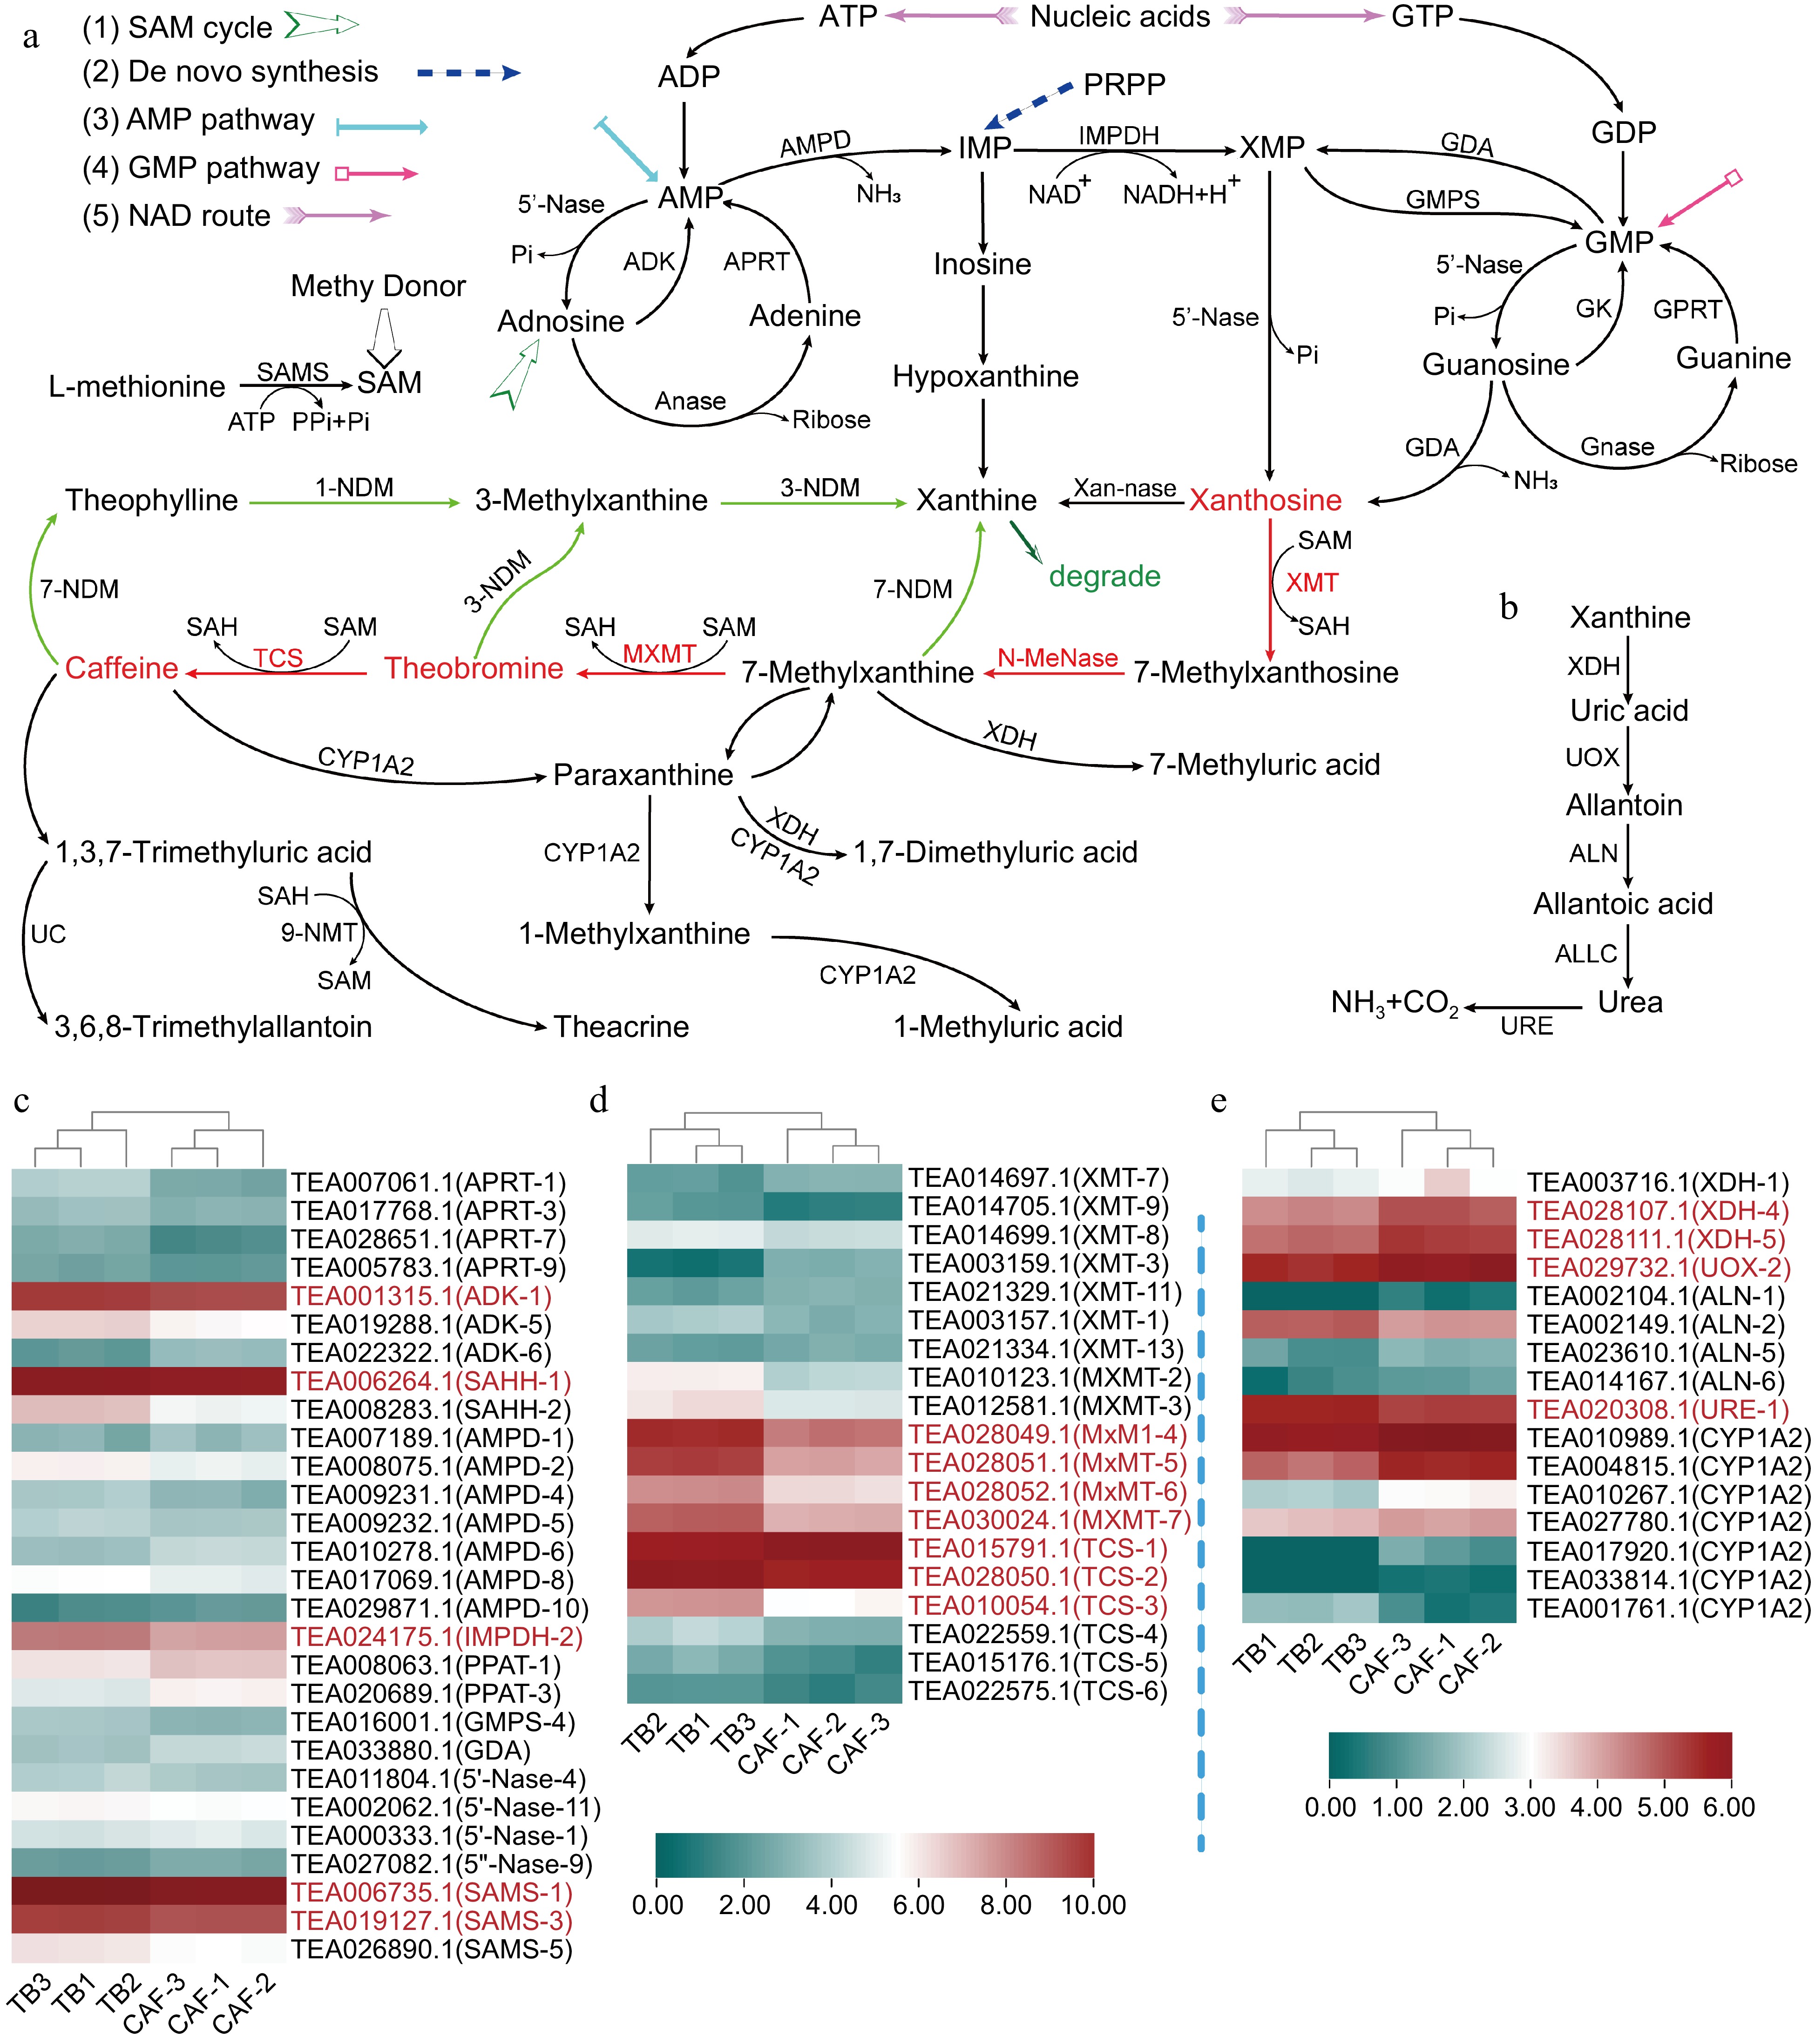
Figure 3.
Differential expression of genes involved in purine alkaloid biosynthesis and degradation; (a) xanthosine synthesis pathways: 1) SAM cycle, 2) de novo synthesis, 3) AMP pathway, 4) GMP pathway, and 5) the nucleic acid degradation (NAD) pathway, where red lines represent the main caffeine synthesis pathway, starting from xanthosine, and green lines represent the main pathway for caffeine degradation; (b) the xanthine degradation pathway; and heatmaps of the (c) genes in xanthosine biosynthesis; (d) methyltransferase genes involved in transforming xanthosine to caffeine; and (e) genes involved in xanthine degradation. Abbreviations: AMP deaminase (AMPD), 5′-nucleotidase (5′-Nase), IMP dehydrogenase (IMPDH), S-adenosyl-L-methionine synthase (SAMS), S-adenosyl-L-homocysteine hydrolase (SAHH), adenosine kinase (ADK), adenosine nucleosidase (Anase), adenine phosphoribosyl transferase (APRT), GMP synthase (GMPS); guanosine deaminase (GDA), xanthosine methyltransferase/7-methylxanthosine synthase (XMT), N-methyl nucleosidase (N-MeNase), methylxanthine methyltransferase/theobromine synthase (MXMT), 1,3-dimethylxanthine methyltransferase/tea caffeine synthase (TCS), 5-phosphoribosyl-1-pyrophosphate (PRPP), N-demethylase (NDM), cytochrome P450 family 1 subfamily A polypeptide 2 (CYP1A2), xanthine dehydrogenase (XDH), urate oxidase (UOX), allantoinase (ALN), allantoicase (ALLC), urease (URE), and 5-phosphoribosyl-1-pyrophosphate (PRPP) amidotransferase (PPAT). Genes written in red had significant differences in gene expression.
-
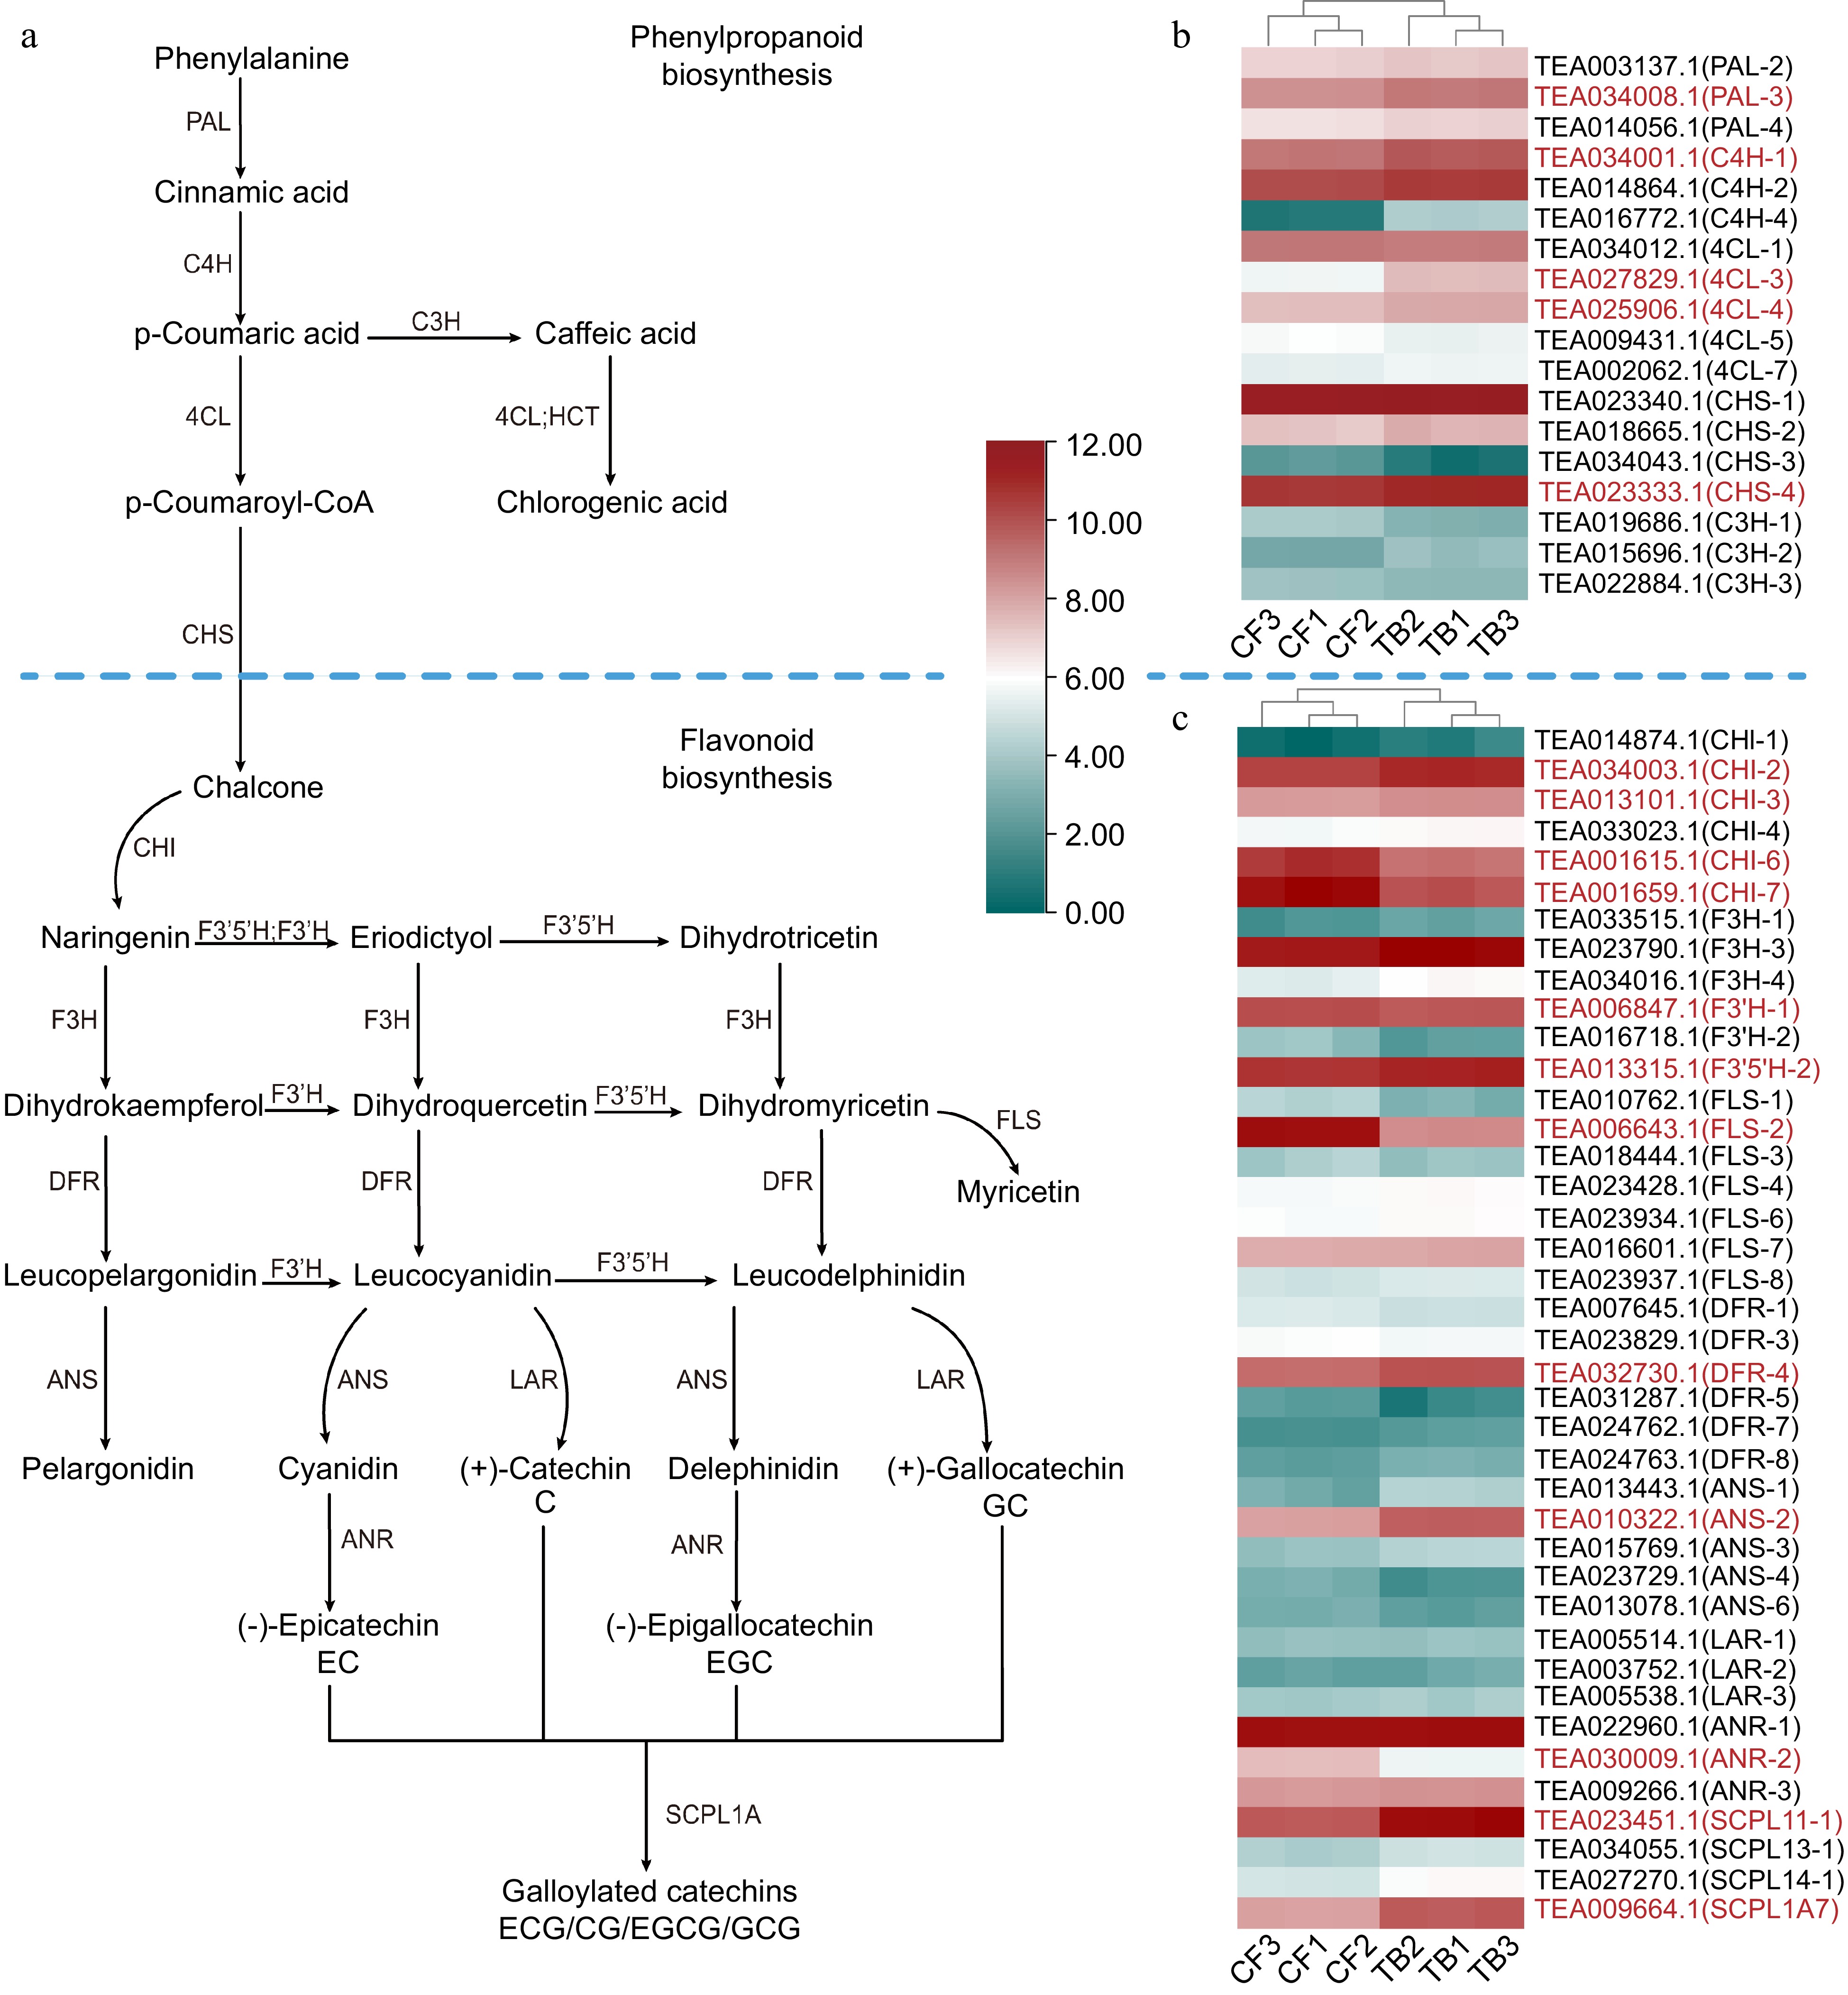
Figure 4.
(a) Phenylpropanoid, flavonoid, and catechin biosynthesis pathways and heatmaps of the expression level of (b) phenylpropanoid biosynthesis genes and (c) flavonoid biosynthesis genes. Phenylalanine ammonia-lyase (PAL), 4-coumarate-CoA ligase (4CL), cinnamate 4-hydroxylase (C4H), chalcone synthase (CHS), cinnamate 3-hydroxylase (C3H), chalcone isomerase (CHI), flavanone 3′-hydroxylase (F3′H), flavanone 3-hydroxylase (F3H), flavonoid 3′5′-hydroxylase (F3′5′H), flavonol synthase (FLS), dihydroflavonol reductase (DFR), leucoanthocyanidin reductase (LAR), anthocyanidin synthase (ANS), and serine carboxypeptidase-like acyltransferases (SCPL). Red represents a significant difference in gene expression.
-
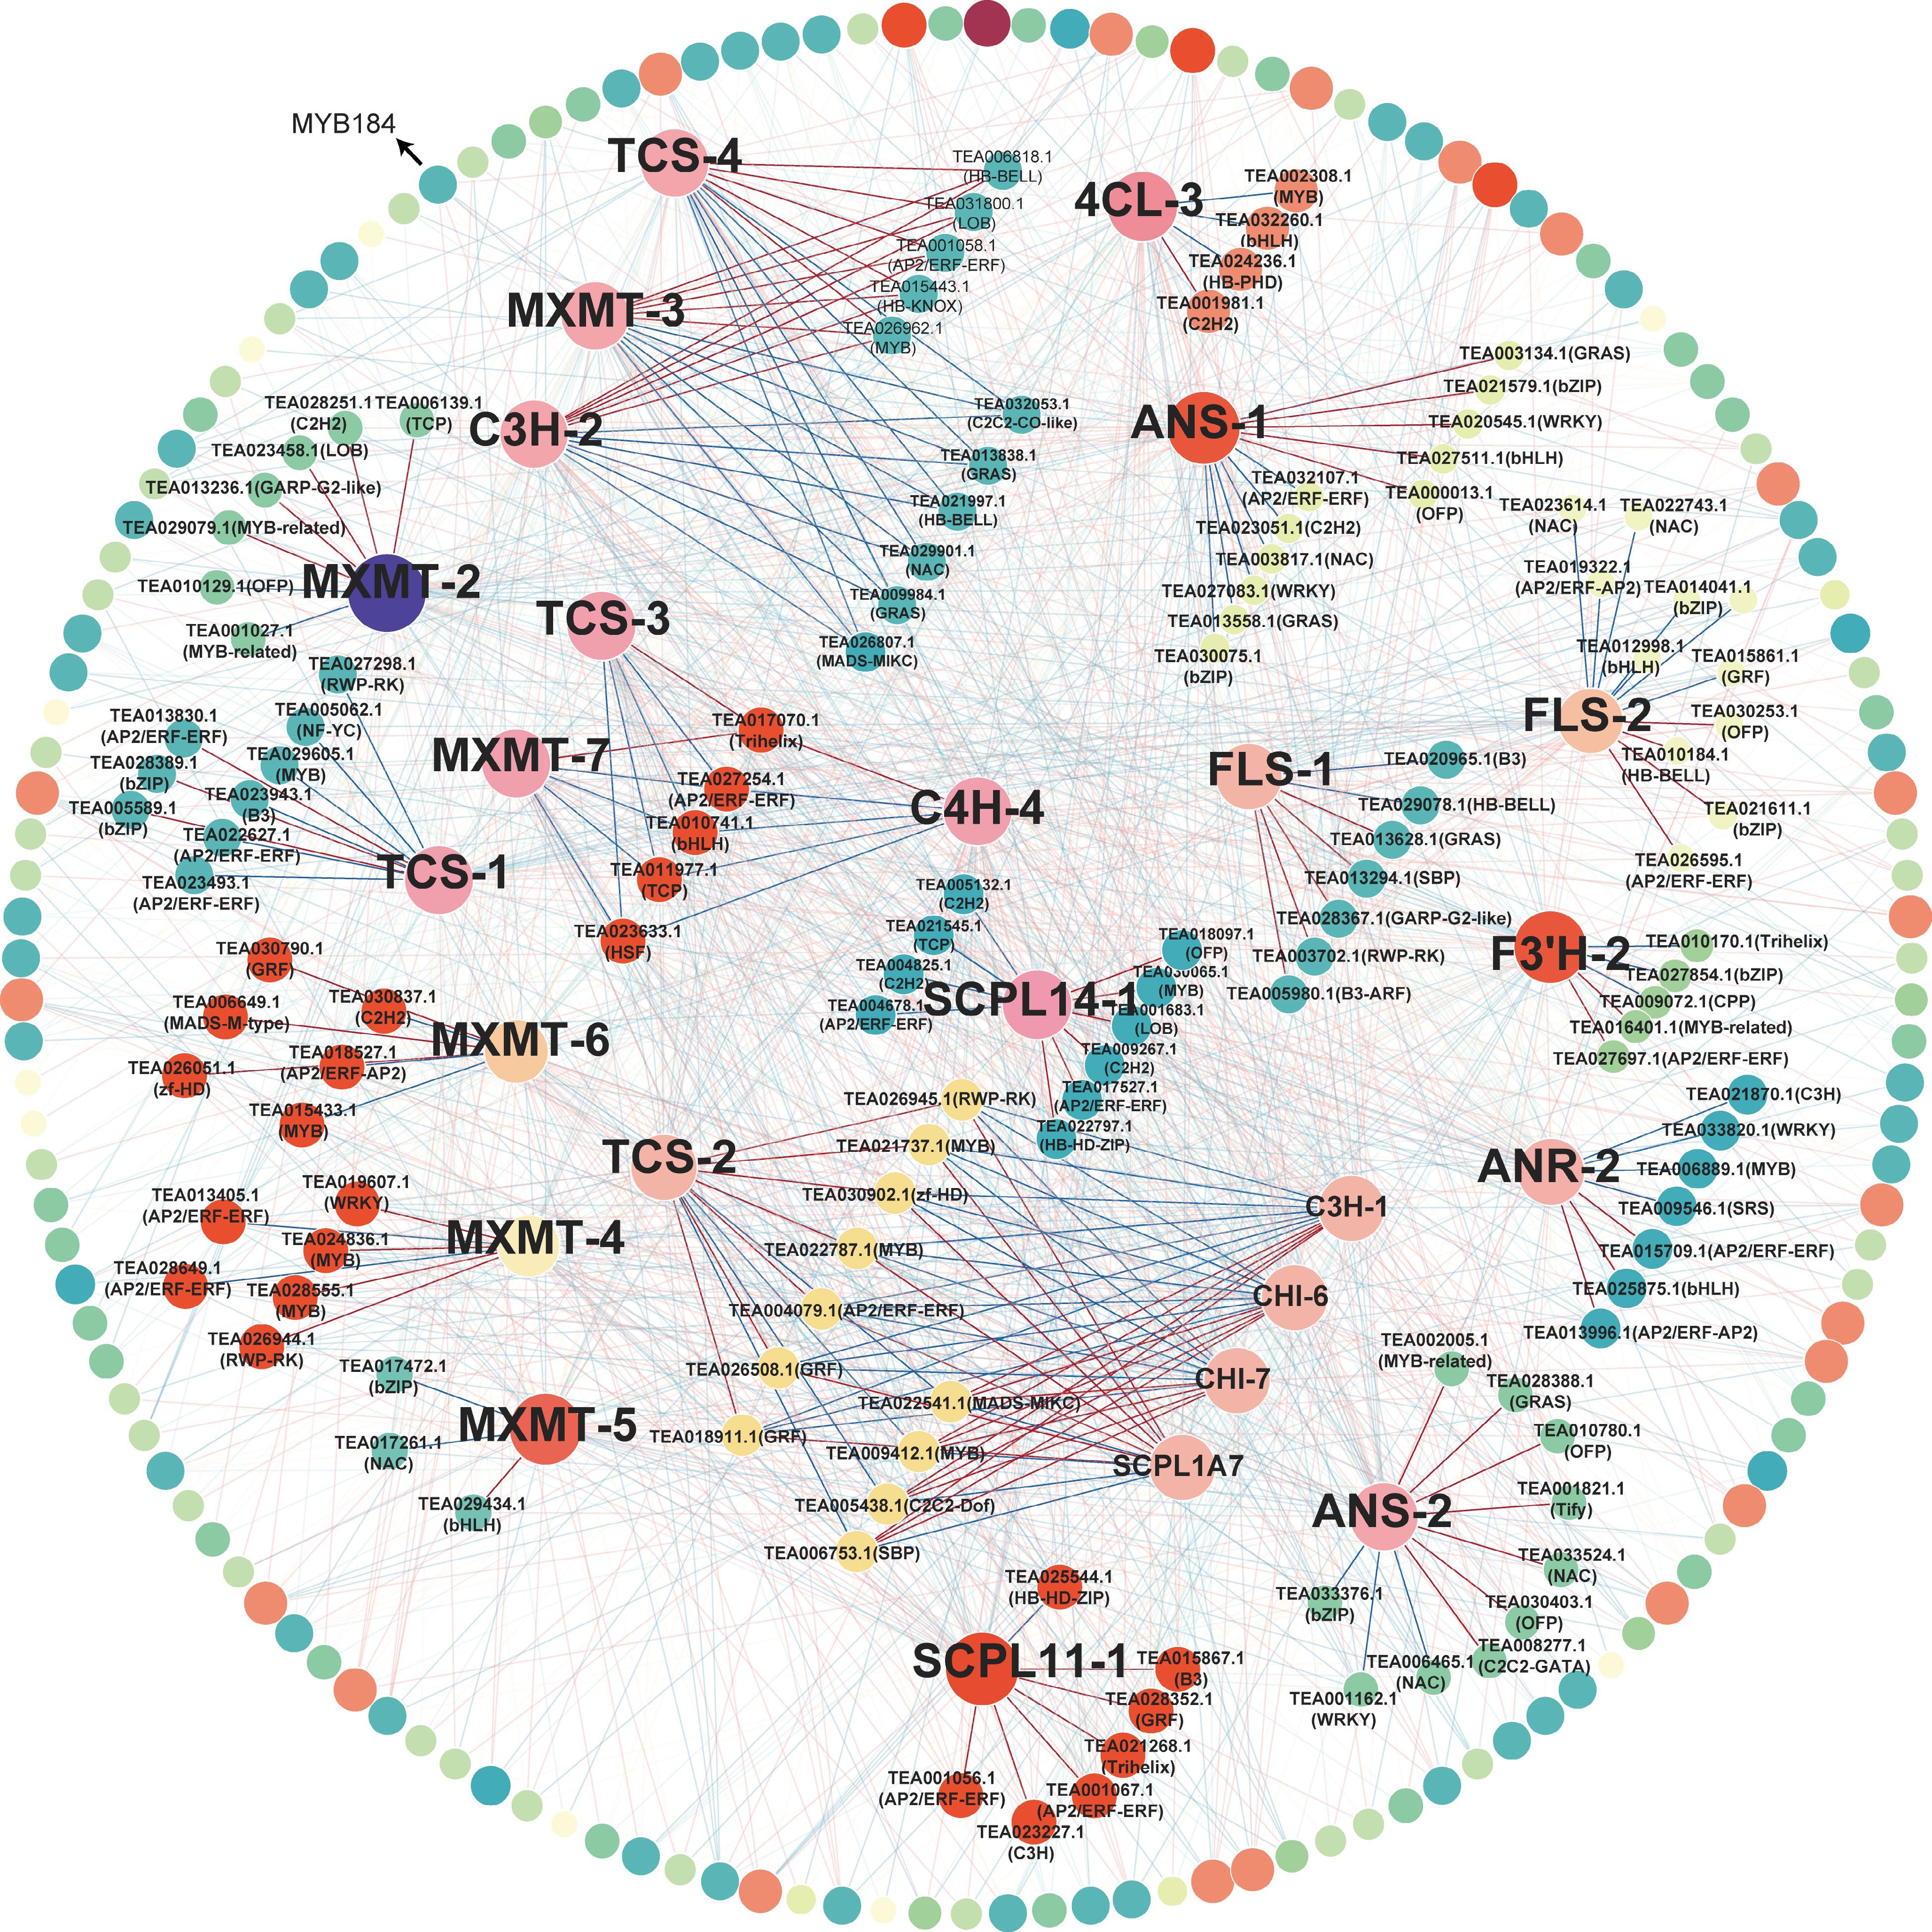
Figure 5.
Coexpression network between TFs and purine alkaloid and catechin biosynthesis genes. Pairs with P < 0.05 and | Spearman's rank correlation coefficient | > 0.8 were included in the analysis. Red lines and blue lines represent positive and negative correlations, respectively. The names of TFs with a high degree of co-expression are given. The size and color of nodes depend on the degree of co-expression. The outer ring with grey lines represents TFs with low correlation.
Figures
(5)
Tables
(0)