-
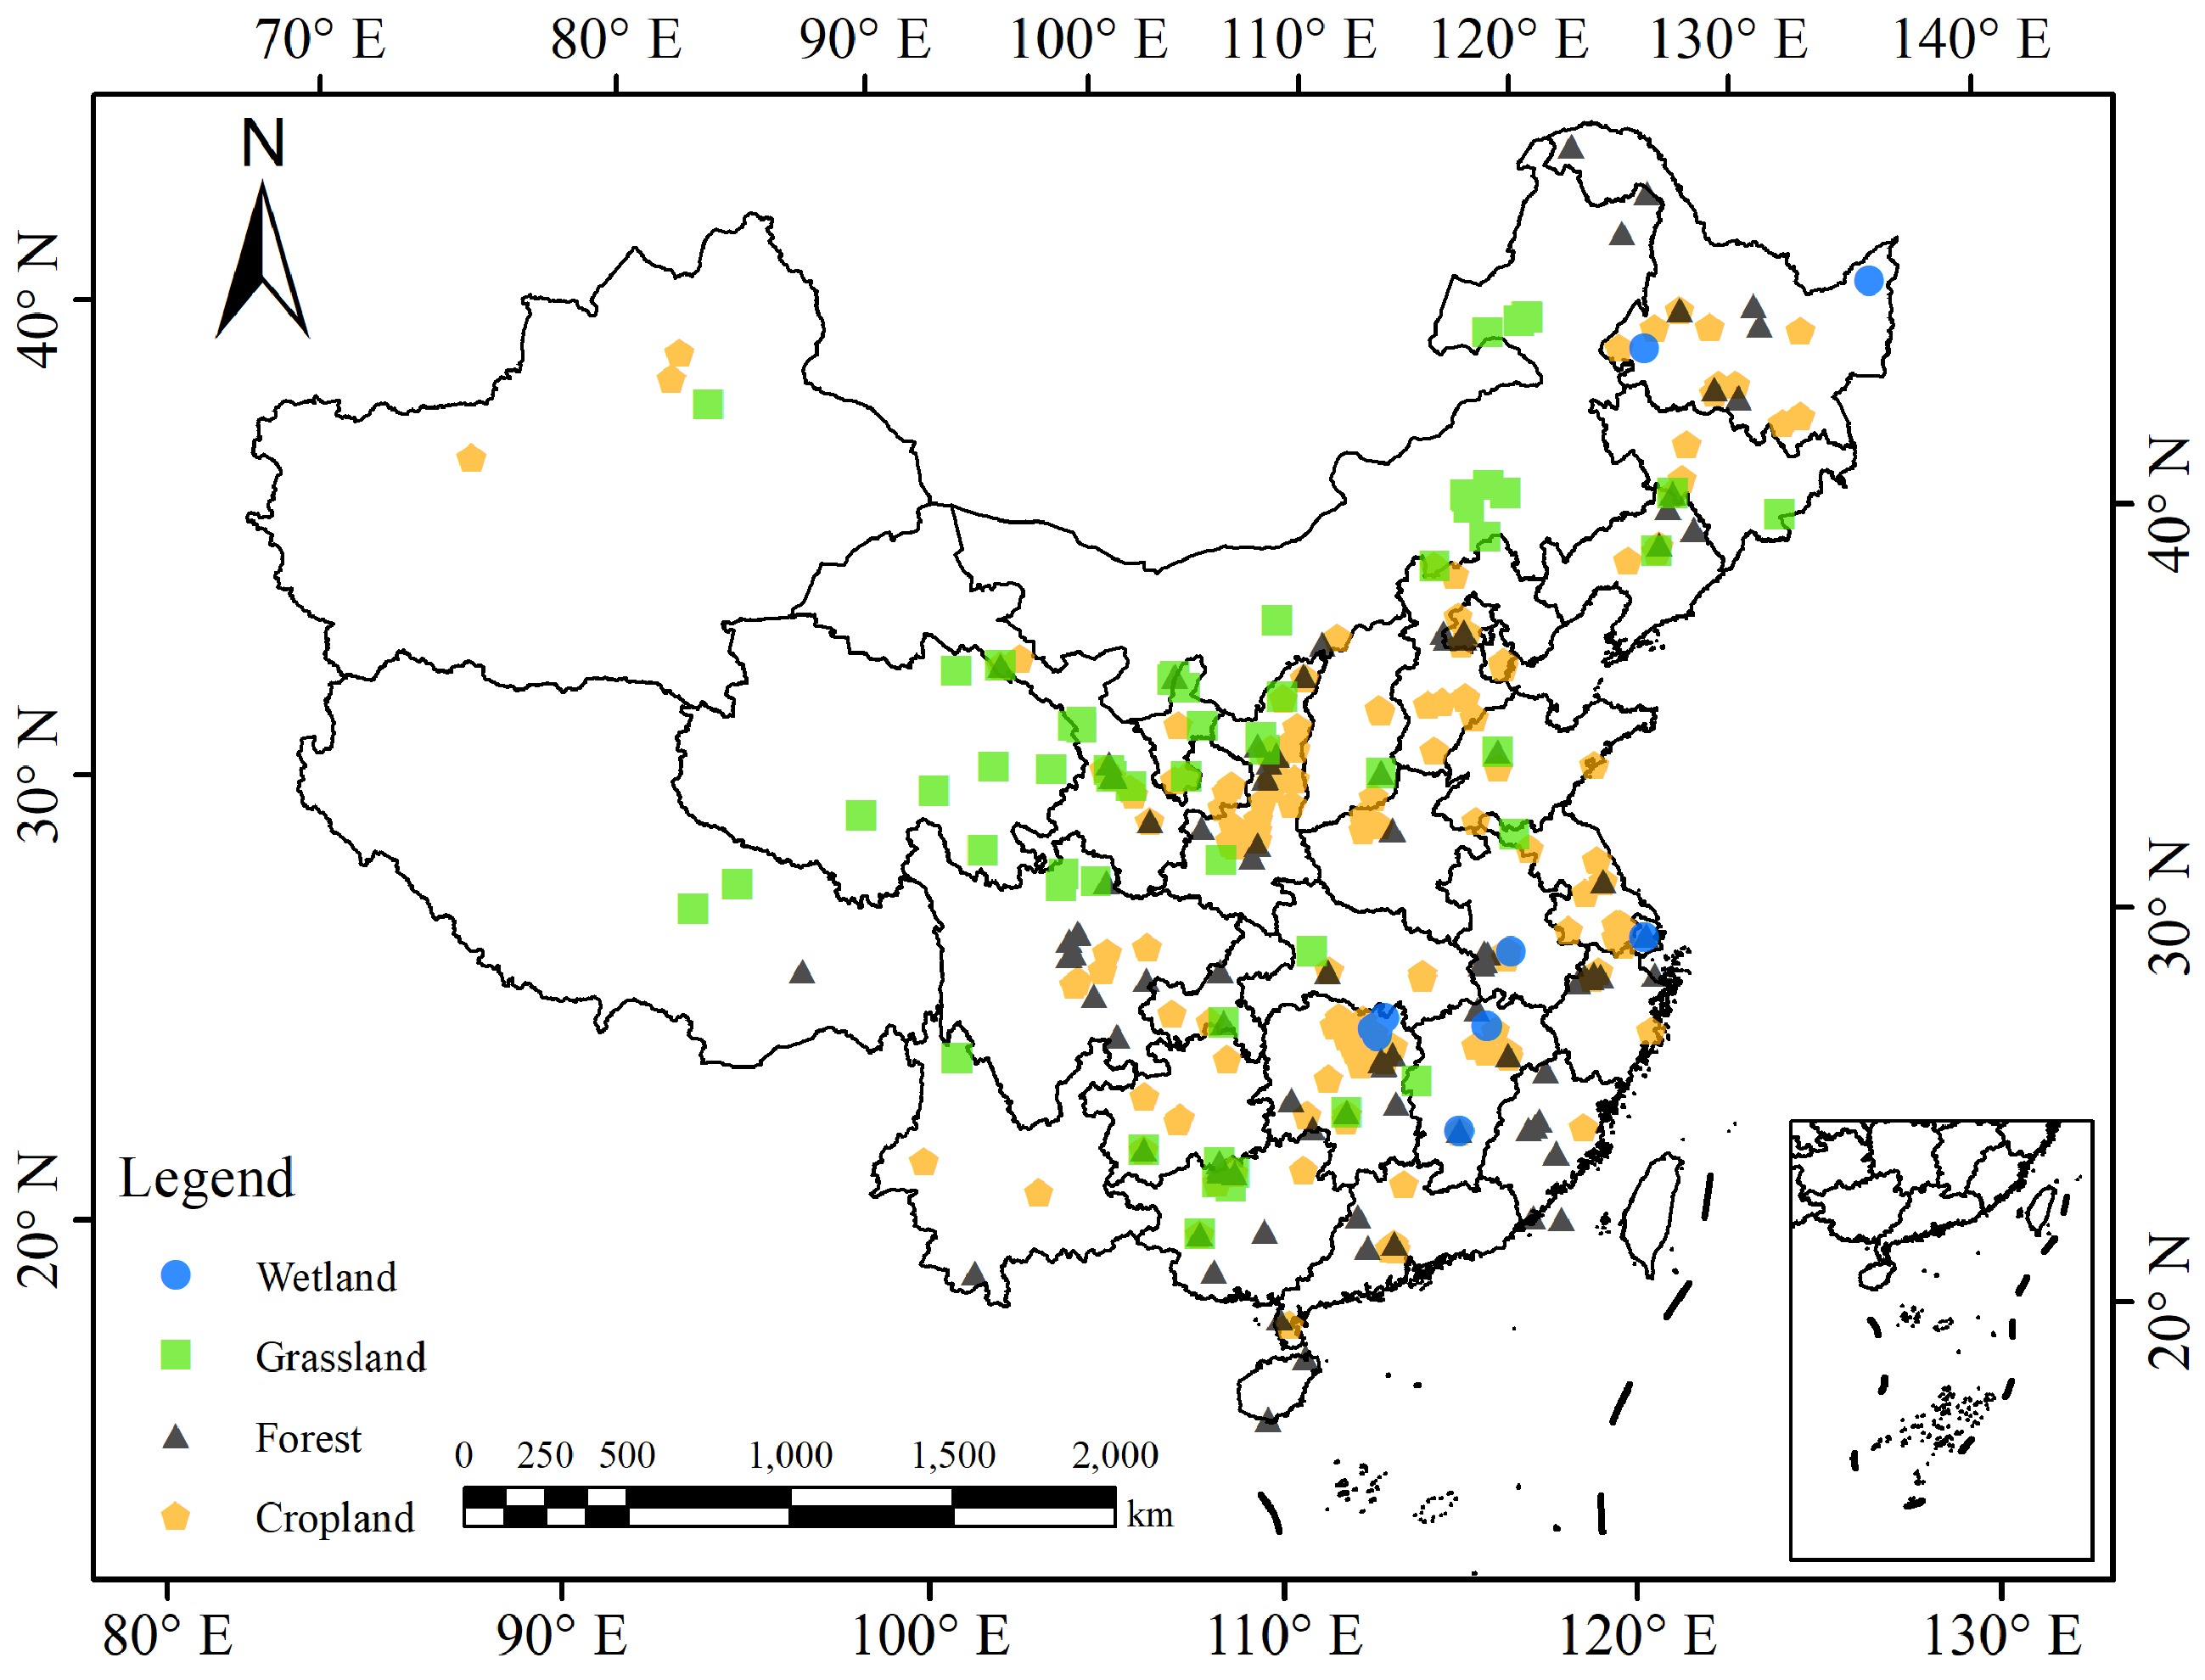
Figure 1.
Geographical distribution of observations in China that were used in this study.
-
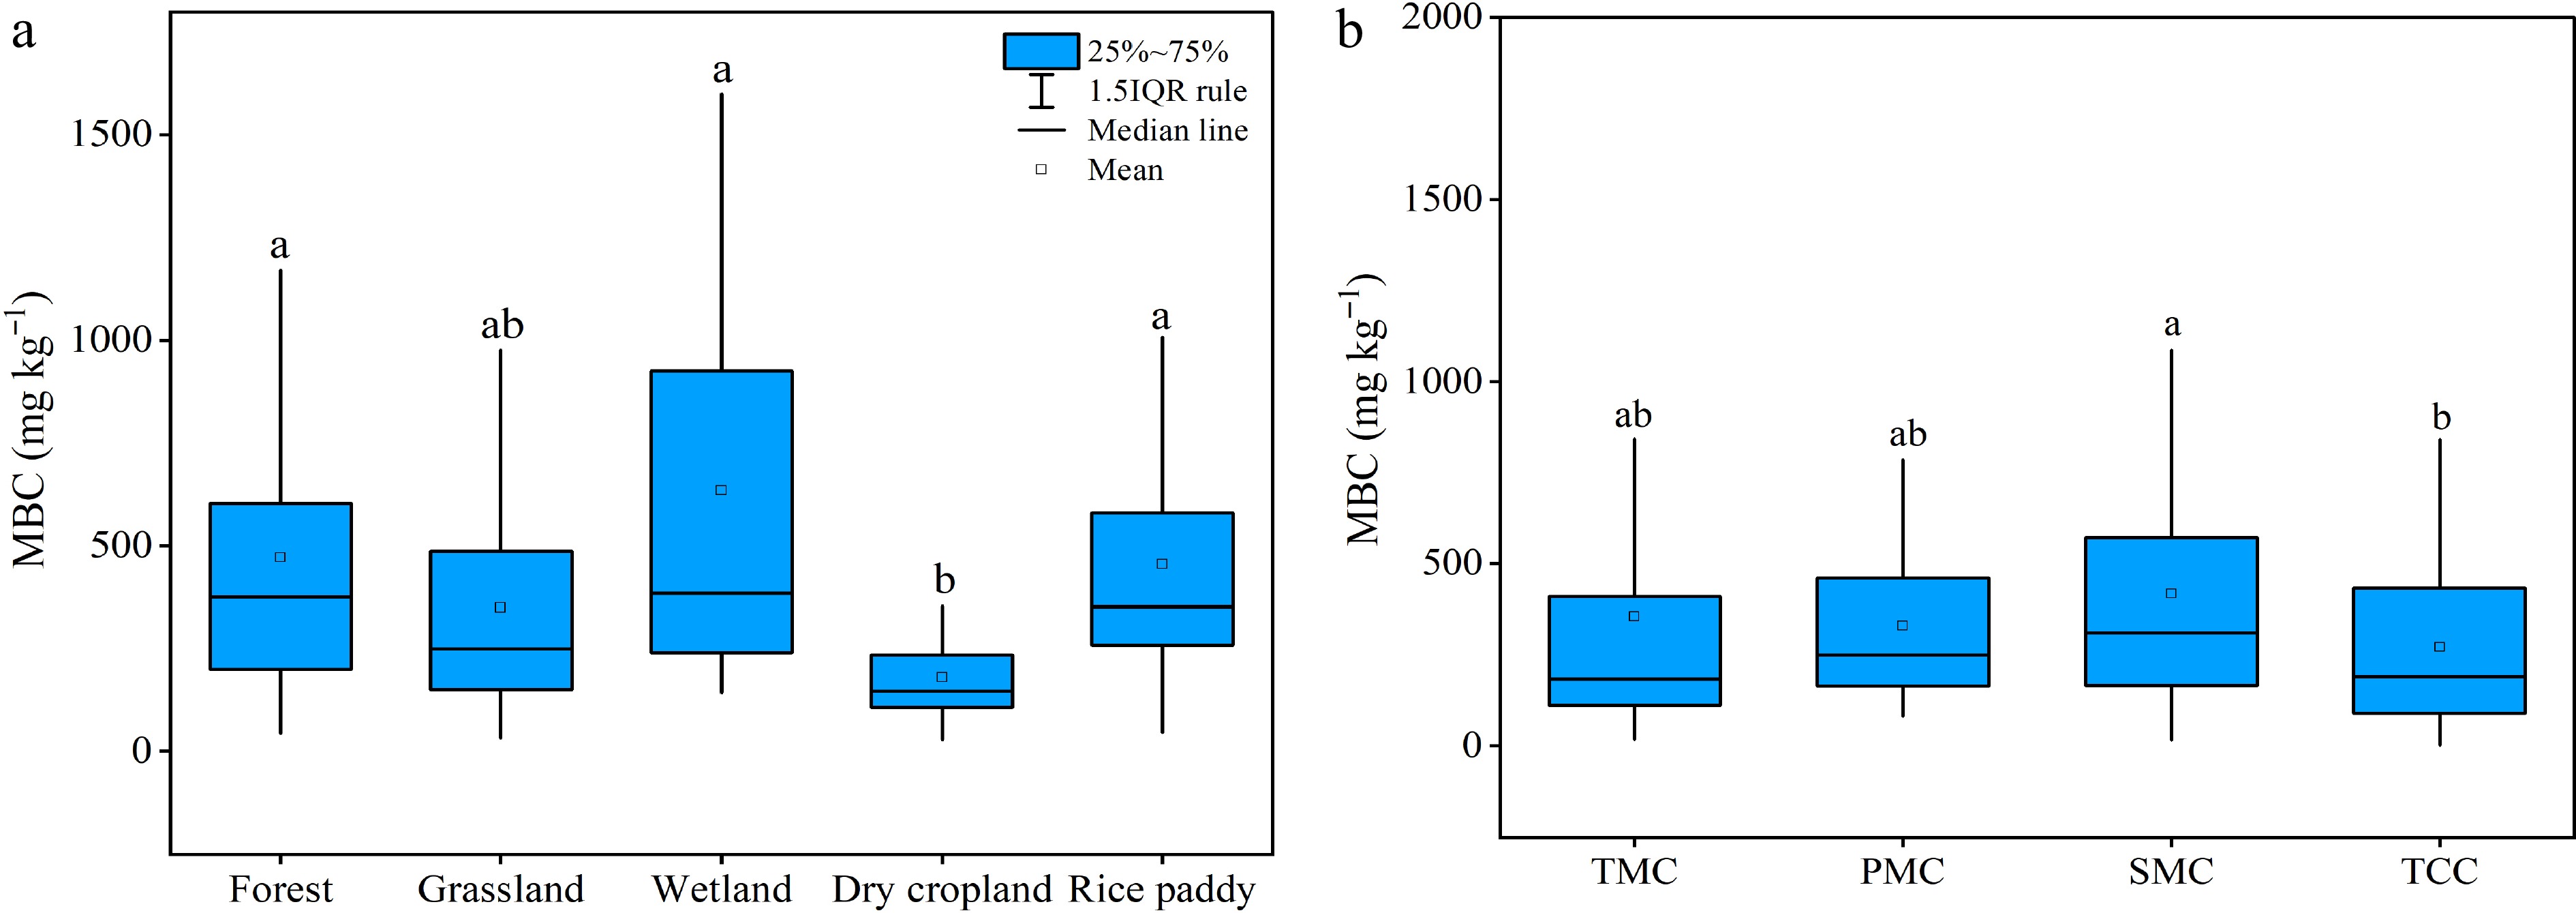
Figure 2.
Differences in soil microbial biomass carbon concentrations (a) among land use types and (b) in different climatic regions. Different letters indicate significant differences of soil microbial biomass carbon concentrations and microbial quotients between land use types at p < 0.05.
-
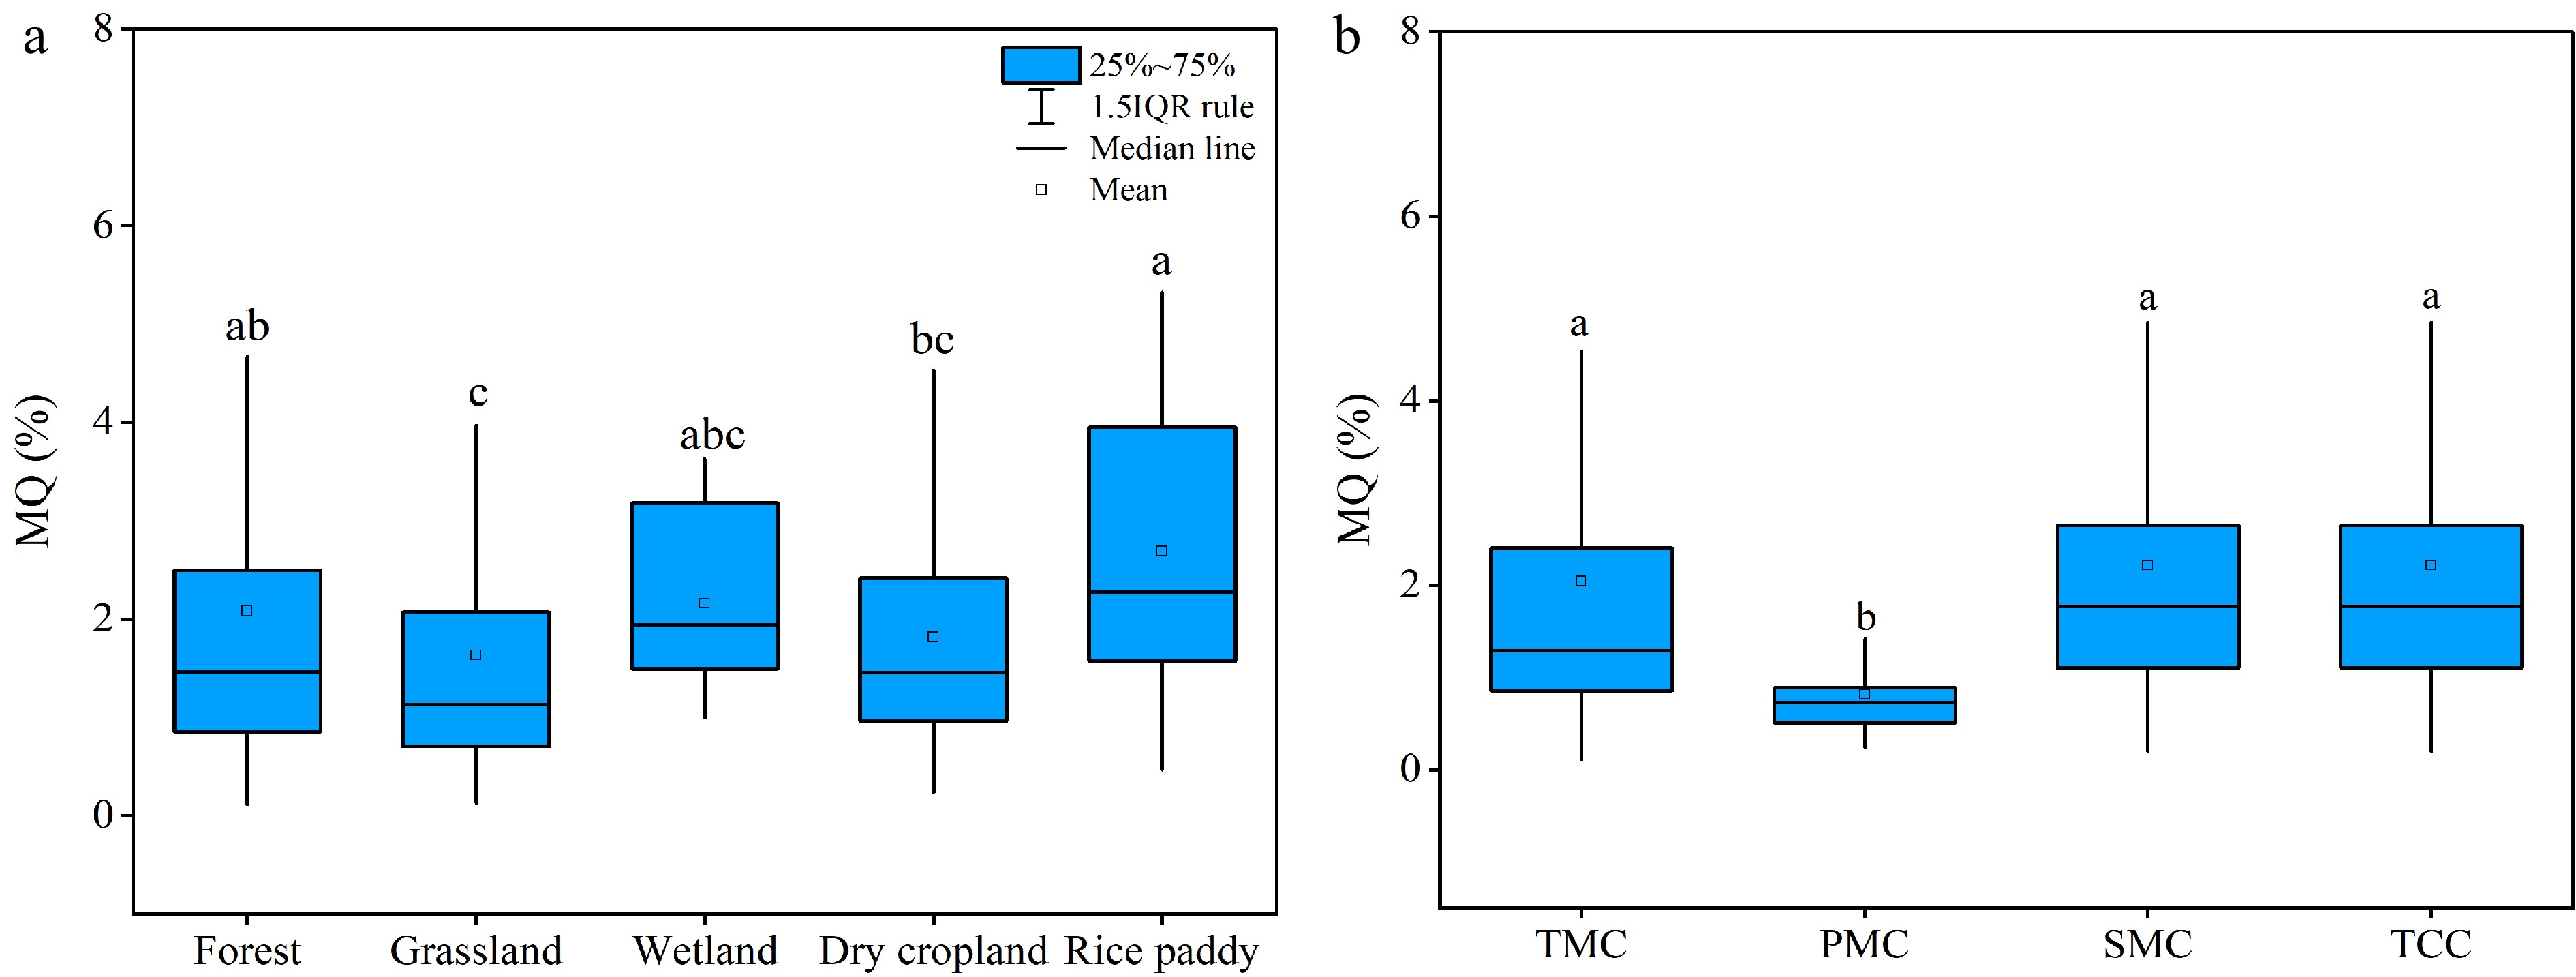
Figure 3.
(a) Soil microbial quotient among land use types and (b) microbial quotient in different climatic regions. TMC, temperate monsoon climate; PMC, plateau/mountain climate; SMC, subtropical monsoon climate and TCC, temperate continental climate. Different letters after mean values indicate significant differences of soil microbial biomass carbon concentrations and microbial quotients between climatic regions at p < 0.05.
-
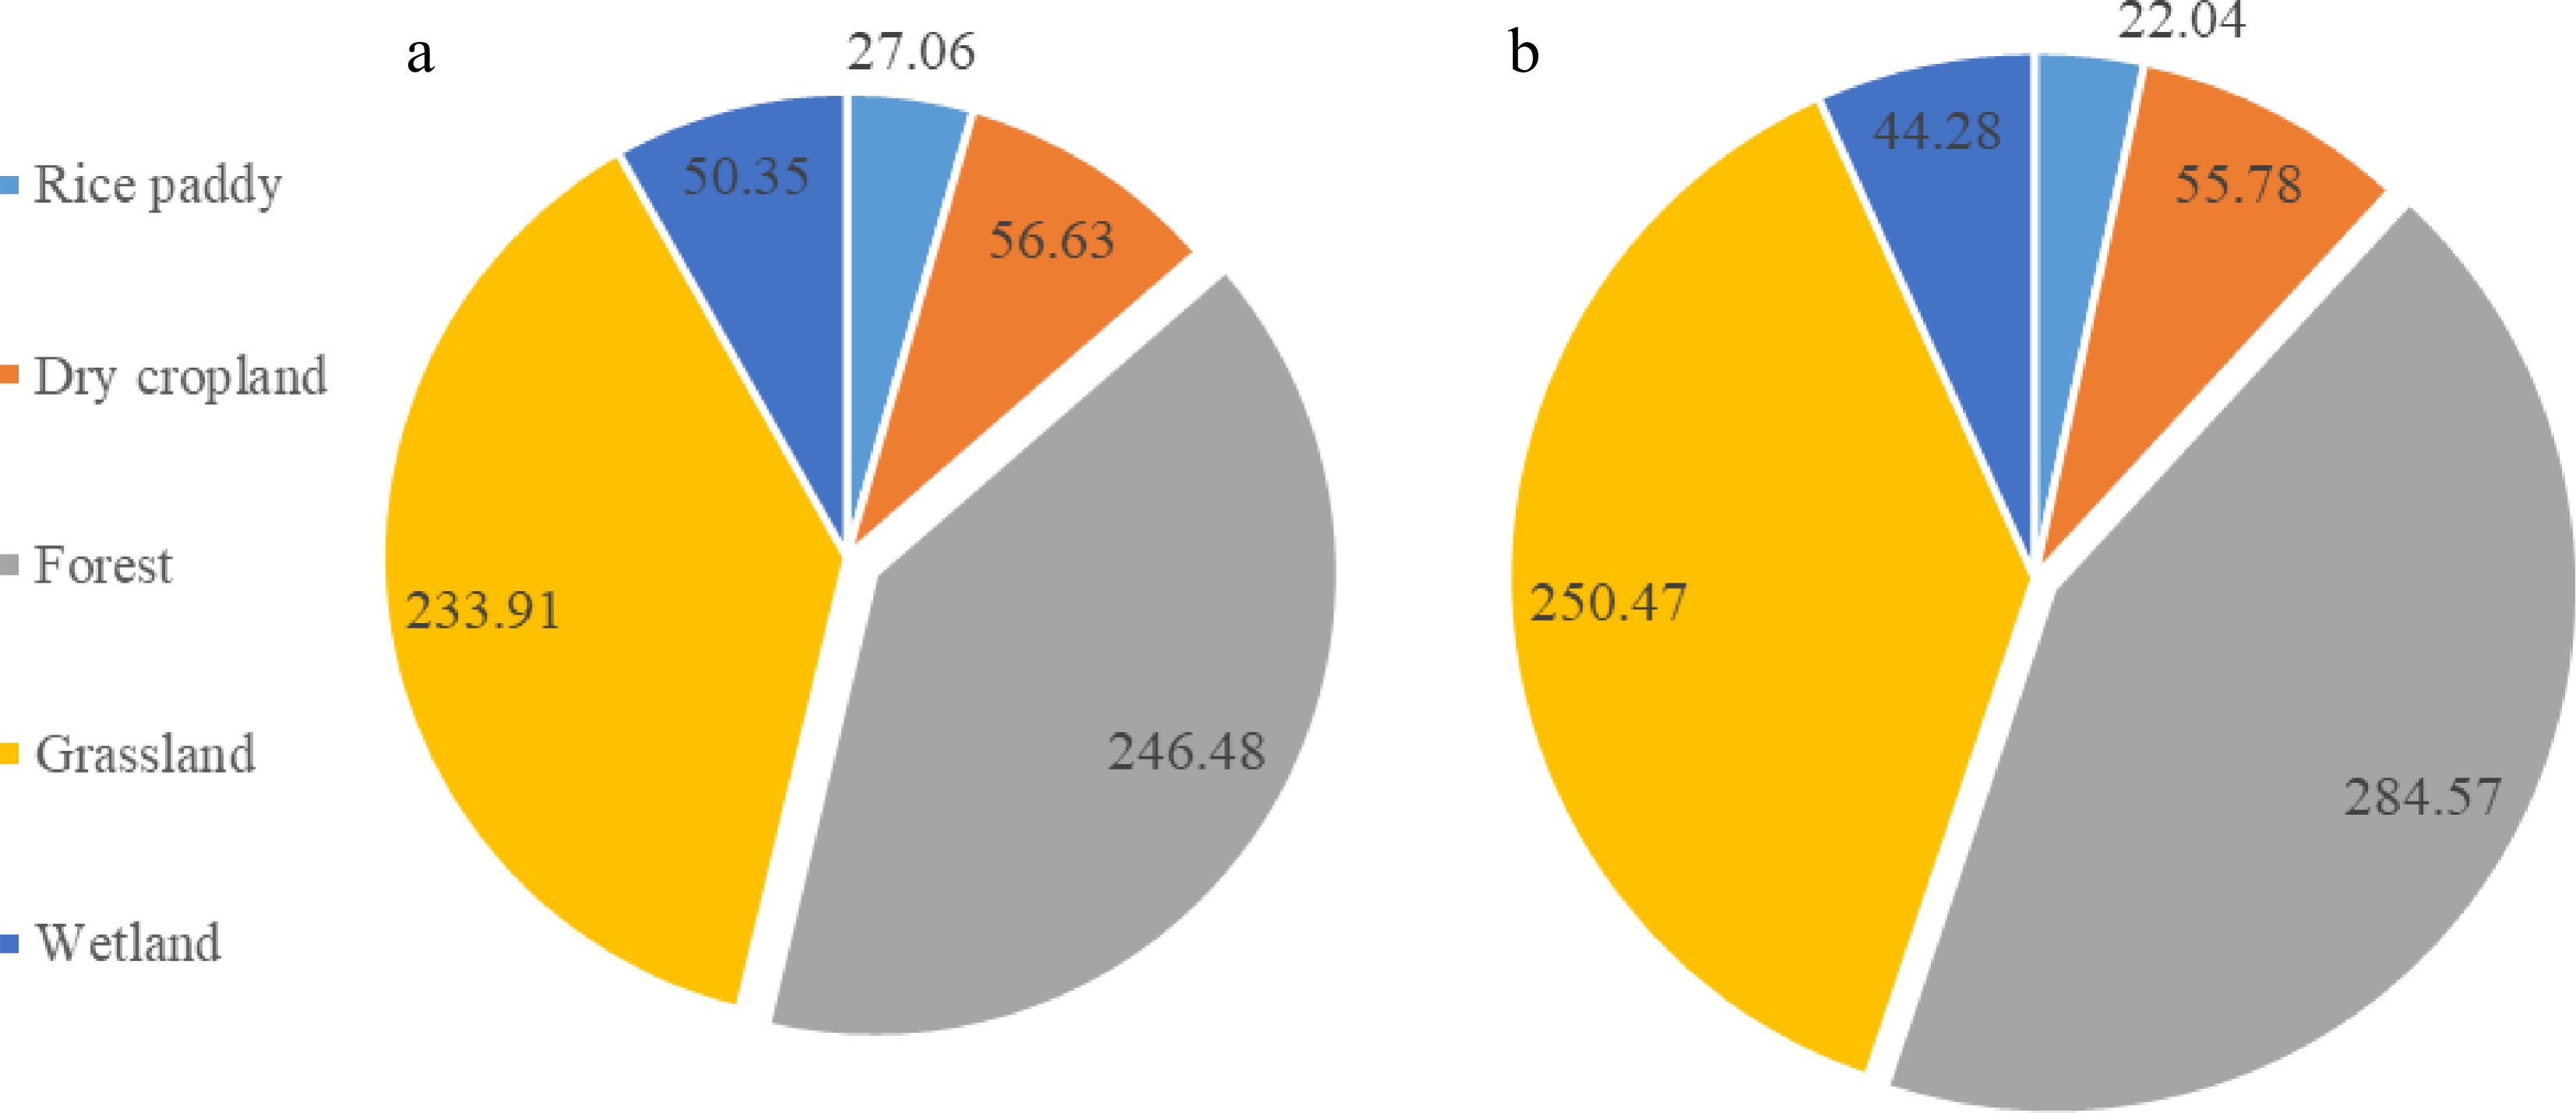
Figure 4.
Topsoil microbial biomass carbon pool (Tg C) of different land uses of China, estimated as per averaged MBC ((a), approach I)) and averaged MQ combined with SOC stock ((b), approach II)). The size of the set is comparable to the total pool size for the whole stock.
-
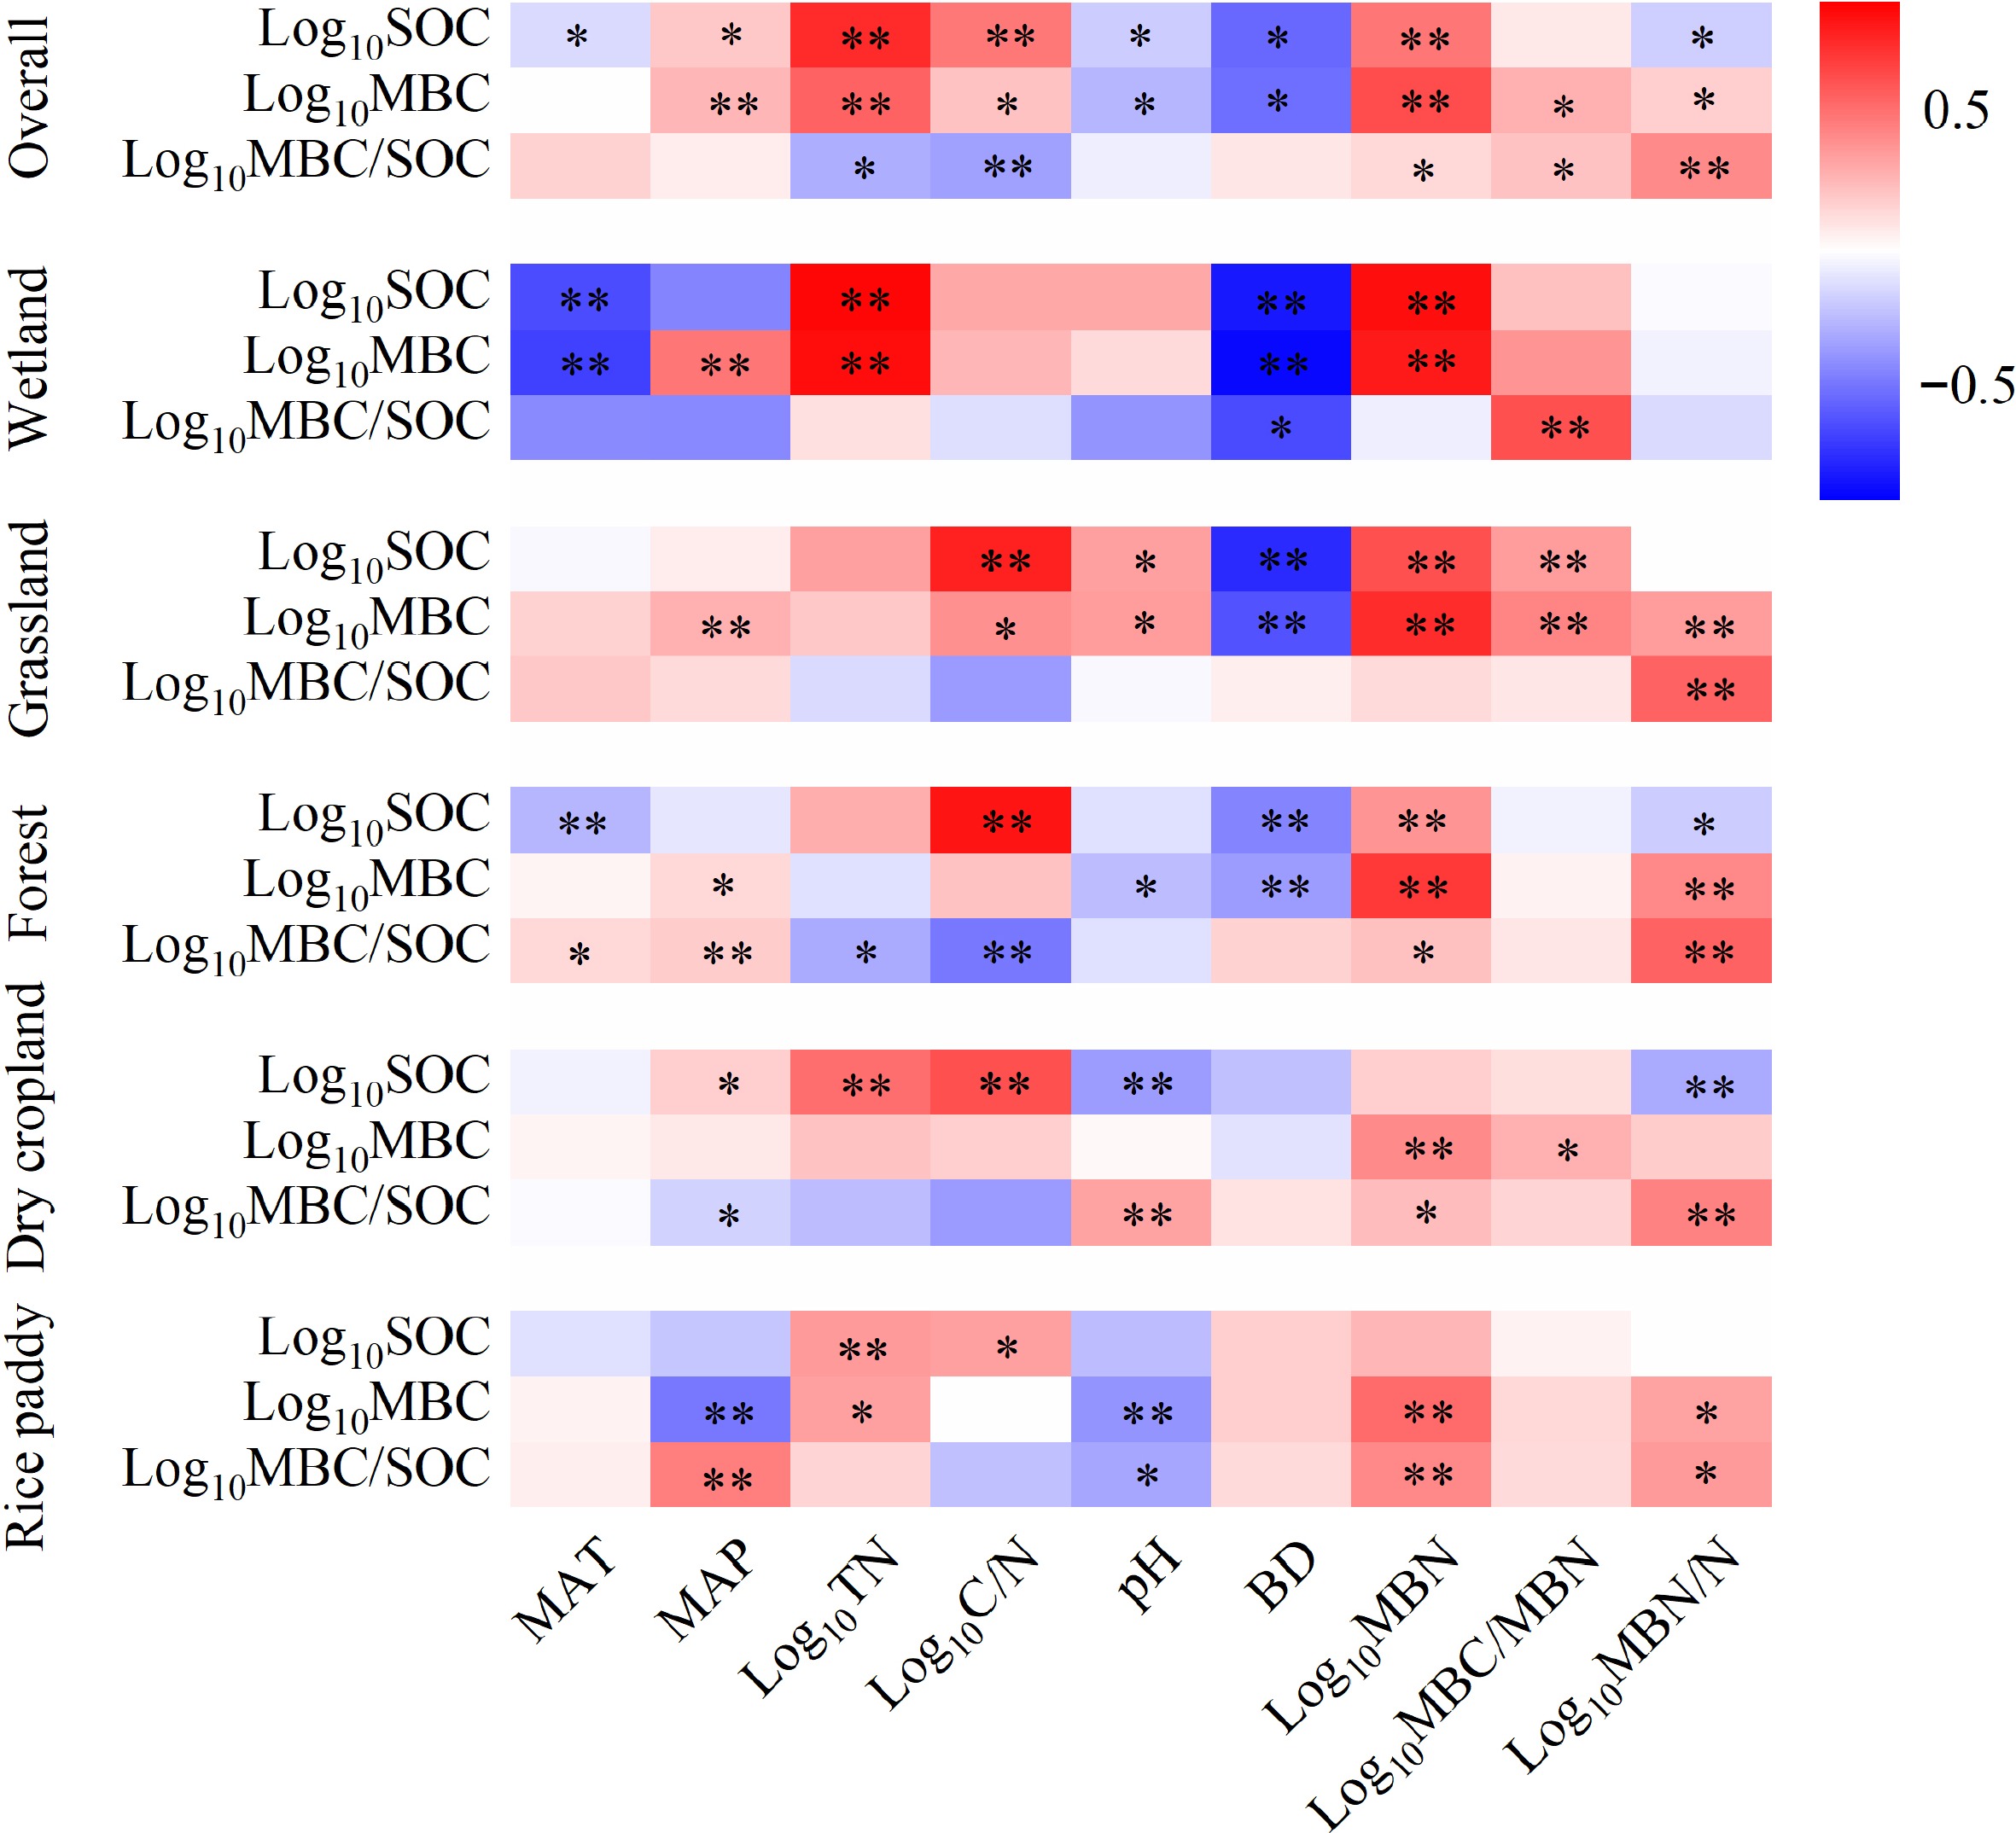
Figure 5.
Environmental drivers of soil microbial biomass carbon (* p < 0.05; ** p <0.01).
Figures
(5)
Tables
(0)