


-
Soil and life have been a central theme for soil system science for soil protection physical habitats enabling biodiversity of the underground biota (Shen & Pan, 2022). The capacity of soil to protect biodiversity has been concerned with the critical but unique natural contribution of global soil and the driver for soil health and more for One Health (Banerjee & van der Heijden, 2022; Lehmann et al., 2020). As a vital part of the earths surface, topsoil plays a critical role in manipulating plant growth and sustaining biodiversity to allow ecosystem function and service (Janzen et al., 2021) and in renewable utilization of natural resources for sustainable land use (Shen & Pan, 2022). The abundant microbial communities in topsoil has been well known to be a pivotal player in biogeochemical cycling (Bahram et al., 2018) through mediating storage and turnover of organic matter and the associated nutrients (Schmidt et al., 2011), a key to drive ecosystem services and biodiversity provided by global soils (Smith et al., 2015). Maintaining richness and diversity of soil microbial communities has been widely concidered in addressing soil quality and ecosystem health at a regional or global level (Guerra et al., 2021; Coban et al., 2022).
Soil microbial biomass was subject to change with the organic inputs due to crop production on a farm scale (Anderson & Domsch, 1989; Powlson, 1994) or to plant litter from aboveground biomass with vegetation on a regional scale (Zak et al., 1994). In other words, the size of soil microbial biomass could represent soil carbon substrate availability in soil, under interaction of carbon source incorporated into soil and the allocation and protection for microbial access in soil (Sollins et al., 1996). By operation definition, microbial biomass itself was considered as an indispensable part of soil organic matter stabilized through biological decay under certain ecosystem conditions (Zhu et al., 2020). Therefore, the biomass of soil microbes and their abundance could indicate the contribution by soil microbes to SOM build-up and the ecosystem function and health.
The microbial biomass of soil, routinely measured with a fumigation protocol, has been adopted as an integrative measure of the overall size of all microbial communities in soil (Anderson & Domsch, 1989; Jenkinson & Ladd, 1981). This was, of course, included in the total pool of soil organic matter measured routinely with wet digestion or combustion (Black et al., 1965; Matejovic, 1997). Soil organic matter has been increasingly considered a complex of a wide range of organic compounds varying in microbiological decay and in mineral association and aggregate-allocation within a soil (Lehmann & Kleber, 2015; Kallenbach et al., 2016; Pan et al., 2019). In turn, the portion of microbial biomass carbon to total organic carbon of soil could represent the size of live soil microbial communities existing in the soil organic matter developed (Miltner et al., 2012; Cotrufo et al., 2013) and even the potential sequestration of soil organic carbon (SOC) in the medium-term (Lehmann & Kleber, 2015; Matejovic, 1997; Six & Paustian, 2014). As a soil health indicator widely accepted (Anderson & Domsch, 1989; Powlson, 1994; Sparling, 1992), microbial quotient (MQ), the fraction of microbial biomass carbon to SOC or of microbial biomass N to soil total N, could represent the biological active fraction of SOM (Bachar, 2010; Zhou et al., 2017). Thus, MQ could be further linked to organic carbon/nitrogen turnover mediated either by carbon inputs or the quality of carbon substrate or both (Coban et al., 2022; Paul, 2016). With the great variability with various ecosystems (Bachar et al., 2010; Paul, 2016; Martiny et al., 2006), quantitative comparison among land use types on a regional scale has not yet widely reported.
Changes in topsoil MBC pool and the MQ, could be driven either by climate condition affecting plant/crop biomass production on a regional scale or by edaphic factors such as mineralogy, soil texture and structure on a site scale. There were wide variations of microbial abundance and diversity index with diverse biotic (plant and soil biota, for example) and abiotic (soil nutrients and texture, for example) as well as other environmental attributes (Martiny et al., 2006). Abiotic variables such as soil temperature and moisture, in particular, have been increasingly known to drive the spatial variation of carbon inputs and turnover as well as soil formation (Conant et al., 2011; Seneviratne et al., 2010). For the growing demand of climate change mitigation and of soil protection and food health, it became urgent to quantify the pool size of microbial biomass carbon and the microbial portion to SOM at regional and global scale (Wieder et al., 2013). Serna-Chavez et al. (2013) and Xu et al. (2013) reported the first quantitative estimates of global topsoil MBC and MQ, using global scale high resolution geographical data. Addressing microbial manipulation of soil organic matter stabilization under various ecosystem conditions (Leifeld & Kögel-Knabner, 2005), quantification of topsoil MBC pool and the MQ should be developed further on a regional scale with land use changes.
As a large country with diverse soil cover and ecosystems, China had been threatened with fast shifting land use patterns and in turn, land degradation (Pan et al., 2015; Song & Deng, 2017). Total SOC stock of China in 1m depth was estimated at a small level of 90 Gt, of which 15 Gt C was allocated to topsoil SOM (Pan, 2009). While SOC storage varied greatly with vegetation biomass across terrestrial ecosystem in China (Fang et al., 2001), size and variability of MBC pool and the MQ values were shown impacted profoundly with land use changes (Mao et al., 1992) and with soil contamination (Bian et al., 2015). Particularly, long term rice cultivation promoted SOC accumulation while increased microbial abundance (elevated MQ) (Liu et al., 2016). In contrast, shift of natural grasslands to croplands could lead to a reduction of MBC and thus to a decrease in MQ in the semiarid Loess plateau of Northwest China (Wang et al., 2009). Ma et al. (2015) reported significant lower topsoil MBC values in soils stressed by water-logging or drought than those without water stresses, from northeastern China. Using national forest inventory data, Zhou & Wang (2015) quantified a mean topsoil MBC pool of 390.2 mg·kg−1 and a MQ of 1.92% for China's forest ecosystems. In concern of land use patterns, data of the size and variation of soil microbial biomass and the MQ of China have not yet been reported.
In this study, we firstly hypothesize that the topsoil microbial biomass pool could show greater variation than microbial quotient, with land use types. We further hypothesize that soil factors could have strong impact on the MBC pool while climate factor on MQ. With the variation quantitatively with land use types addressed, a topsoil MBC pool could be estimated for China as a whole through spatial extrapolation. To address these, we conducted a literature survey to form a database of topsoil MBC pool with varying ecosystem conditions. Both MBC and MQ were compared among land use patterns and climatic patterns across mainland China. The variations were explored to identify the major drivers for the changes across sites. By data synthesis, the total topsoil MBC pool was predicted using the established MBC and MQ values. Finally, a statistical model was tested for predicting topsoil MBC pool for China's soils under different land uses.
-
We searched the literature published from January 2000 − December 2022 via the bibliographic databases available in China. A basic literature archive of 1700 papers were first created by searching with the key words 'soil organic carbon' and 'microbial biomass carbon'. The literature archive was further filtered for field studies reporting measurement data both of SOC and MBC (and MBN) measured with the chloroform fumigation-extraction (CFE) (Vance et al., 1987), of topsoil in untreated conditions. Data of MBC (or MBN) measured not with the fumigation method and/or under any experimental treatments (with land management, farming practices, vegetation restoration and pollution remediation, etc.) were not included. In order to avoid potentially abnormal values, retrieved dataset of SOC and MBC were filtered using the 95% confidence principle. Resultantly, the established database consisted of 454 observations covering a wide range of climate and soil conditions across mainland China. The land use types analyzed included forest land (117 sites), grassland (67 sites), wetland (12 sites) and cropland (164 sites including 125 sites for dry cropland and 39 sites for rice paddy). All the soil and geographical information of the observations are provided in Supplemental Table S1 while the site distribution is graphed in Fig. 1.
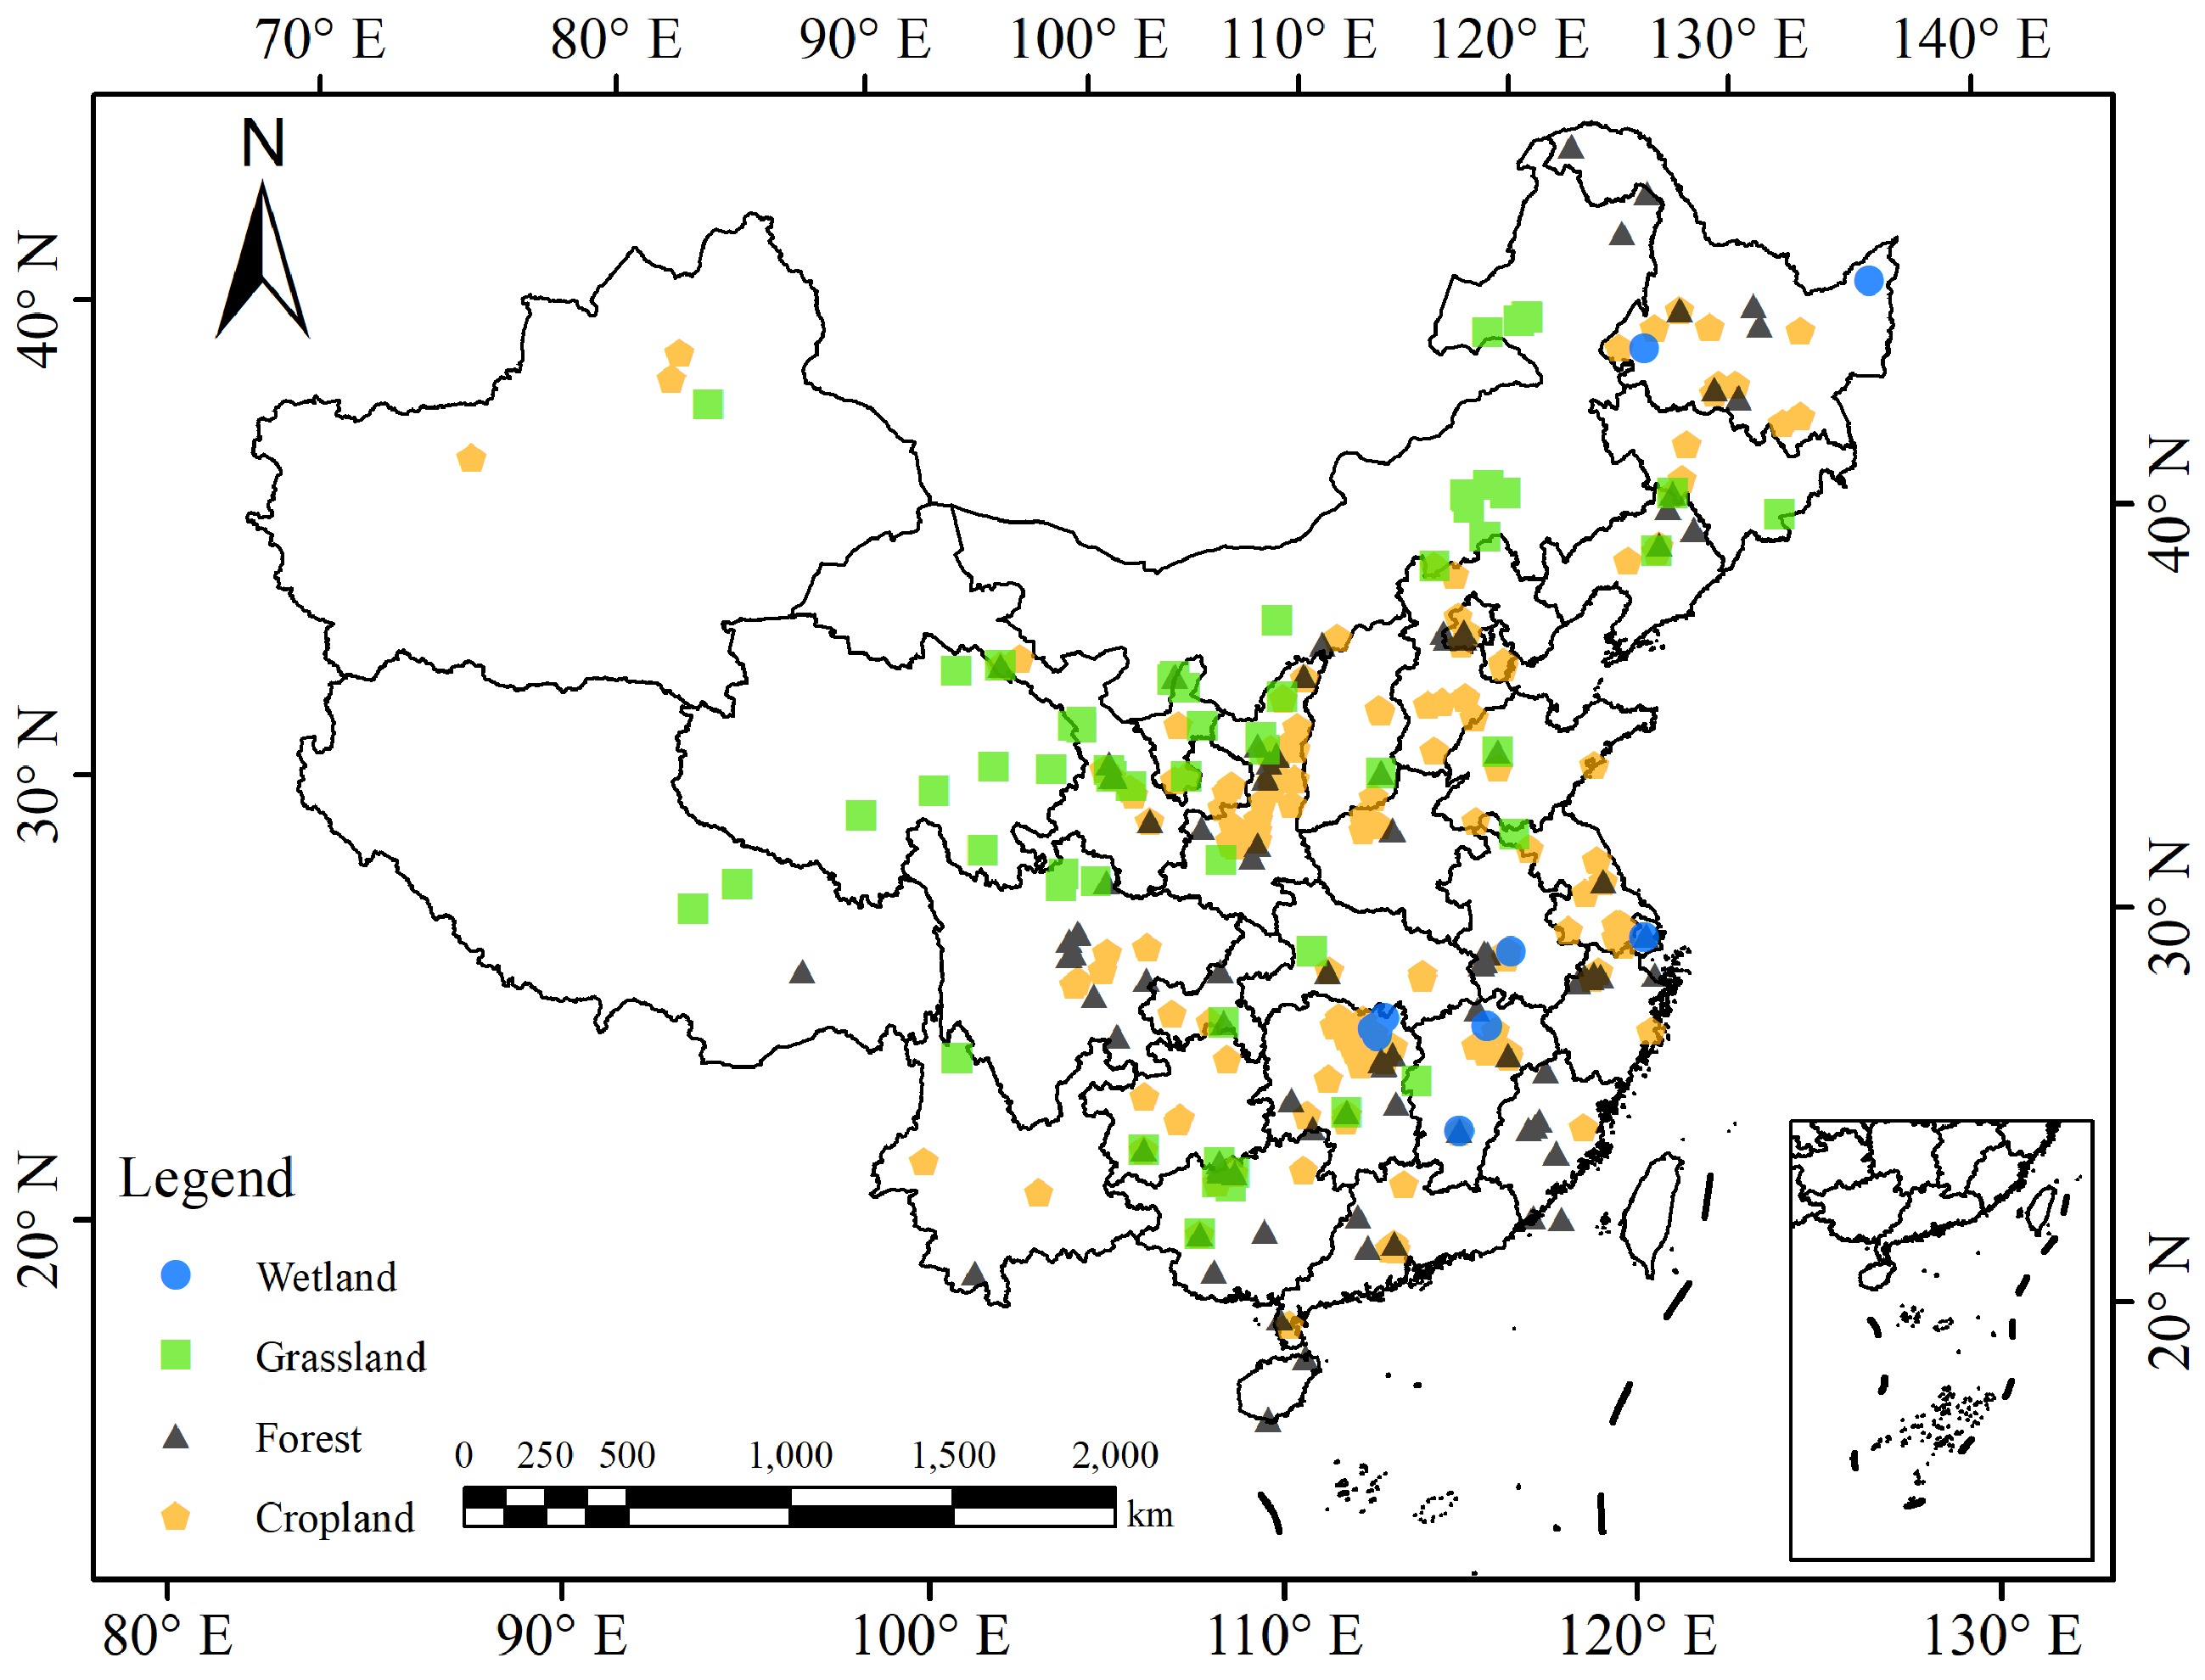
Figure 1.
Geographical distribution of observations in China that were used in this study.
Climatic conditions were categorized of plateau/mountain climate (PMC), temperate continental climate (TCC), temperate monsoon climate (TMC) and subtropical monsoon climate (SMC) (
http://geodata.pku.edu.cn ). Site data of mean annual air temperature (MAT) and precipitation (MAP) were collected either from the reported studies or, when not provided, extracted from the China Meteorological Data Network (http://data.cma.cn/ ) for the station nearest to the reported site. Meanwhile, topsoil data of SOC, total N contents (TN) and microbial biomass carbon (MBC) and nitrogen (MBN), pH, bulk density (BD) were also retrieved from the published studies and archived in the database.Calculation and quantification
-
The microbial quotient (MQ, %), defined as a portion of MBC content in percentage to SOC content of the topsoil, was calculated with Eqn (1): $ MQ=\frac{{C}_{MB}}{{C}_{org}\times 1000}\times 100{\text%} $ (1) where, CMB and Corg represents the topsoil content of MBC in mg kg−1 and of SOC in g kg−1, respectively.
As a direct approach, the mean values of MBC obtained were then used in alignment with the data of bulk density and of soil area (Xie et al., 2007; Zheng et al., 2013) to directly estimate a pool size of topsoil microbial biomass carbon (Mp, Tg C) under a certain land use. Subsequently, the whole of China's topsoil MBC pool could be predicted by integrating the individual pool occupation by the land use types, using the equation as follows:
$ Mp=\sum {MBC}_{i}\times {BD}_{i}\times D\times {A}_{i}/10000 $ (2) where, MBCi and BDi is the topsoil MBC (mg·kg−1) and bulk density (g·cm−3) averaged for a land use type i, and Ai is the total area (M·ha) of land use type i, respectively. D is the topsoil depth (cm), which was set default as 15 cm for rice paddies and 20 cm for other non-paddy land uses (18−21 cm reported by Xie et al (2007)). The soil area of the different land use types were also retrieved from the report by Xie et al. (2007). The number of 10,000 is a conversion factor.
Alternatively for an indirect approach, the data of MQ derived in this study was combined with the total topsoil SOC pool to estimate an individual MBC pool for a given land use type. Finally, a potential pool of microbial biomass carbon of China's topsoil was predicted by integrating the values for individual land use type, using the following equation:
$ Mp=\sum {MQ}_{i}\times {SOCp}_{i} $ (3) where, MQi is the mean topsoil microbial quotient (%) obtained herein; SOCpi is the SOC pool (Tg C) of topsoil under a land use type i, respectively. The values of topsoil SOC pool for a given land use type were cited from the data reported by Xie et al. (2007). However, the topsoil SOC pool of wetlands was estimated using the data in this study with the number of wetlands area of China cited from Zhang et al. (2008).
Data treatment and statistical analysis
-
In this study, all measurement data of soil organic carbon, microbial biomass carbon/nitrogen, soil nitrogen, and the related rations were all log-transformed prior to statistics (Supplemental Figs S1−S8). An analysis of variance (ANOVA) was then performed using a least significant difference test (LSD) to evaluate the differences among land use types and climatic categories. Multivariate correlation analysis was conducted to explore the environmental influences on MBC pool. Stepwise multivariate regression analysis was further performed to characterize the environmental drivers and to simulate MBC as a linear function of multiple explanatory variables. The forward method was used in this study, which involved starting with no variables in the model, testing the addition of each variable according to Akaike's Information Criteria (AIC), adding the variable that improved the model the most, and repeating this process until the best multivariate model was selected. The level of significance of a difference or a correlation was defined at p < 0.05. All statistical analyses were carried out using JMP software (version 11, SAS Institute Inc., Cary, NC, USA).
-
The mean values of topsoil MBC across land use types and climate regions in our database are plotted in Fig. 2. Following a log-normal distribution, MBC content ranged from 28.7−1608.2 mg·kg−1 across the soils studied, with an average of 353.7 mg·kg−1 and a 95% confidence interval of 323.2~384.3 mg·kg−1 (Supplemental Fig. S4). Topsoil MBC content was highly variable across sites within a land use group but the means of MBC content were found different among land use groups (Fig. 2a). Mean topsoil MBC content was significantly higher under forest (470.8 mg·kg−1), rice paddy (454.9 mg·kg−1) and wetland (634.8 mg·kg−1) than under dry croplands (179.9 mg·kg−1). Owing to their high site variability, mean MBC contents under grasslands (349.9 mg·kg−1) was found not significantly different either from forest and rice paddy or from dry croplands.
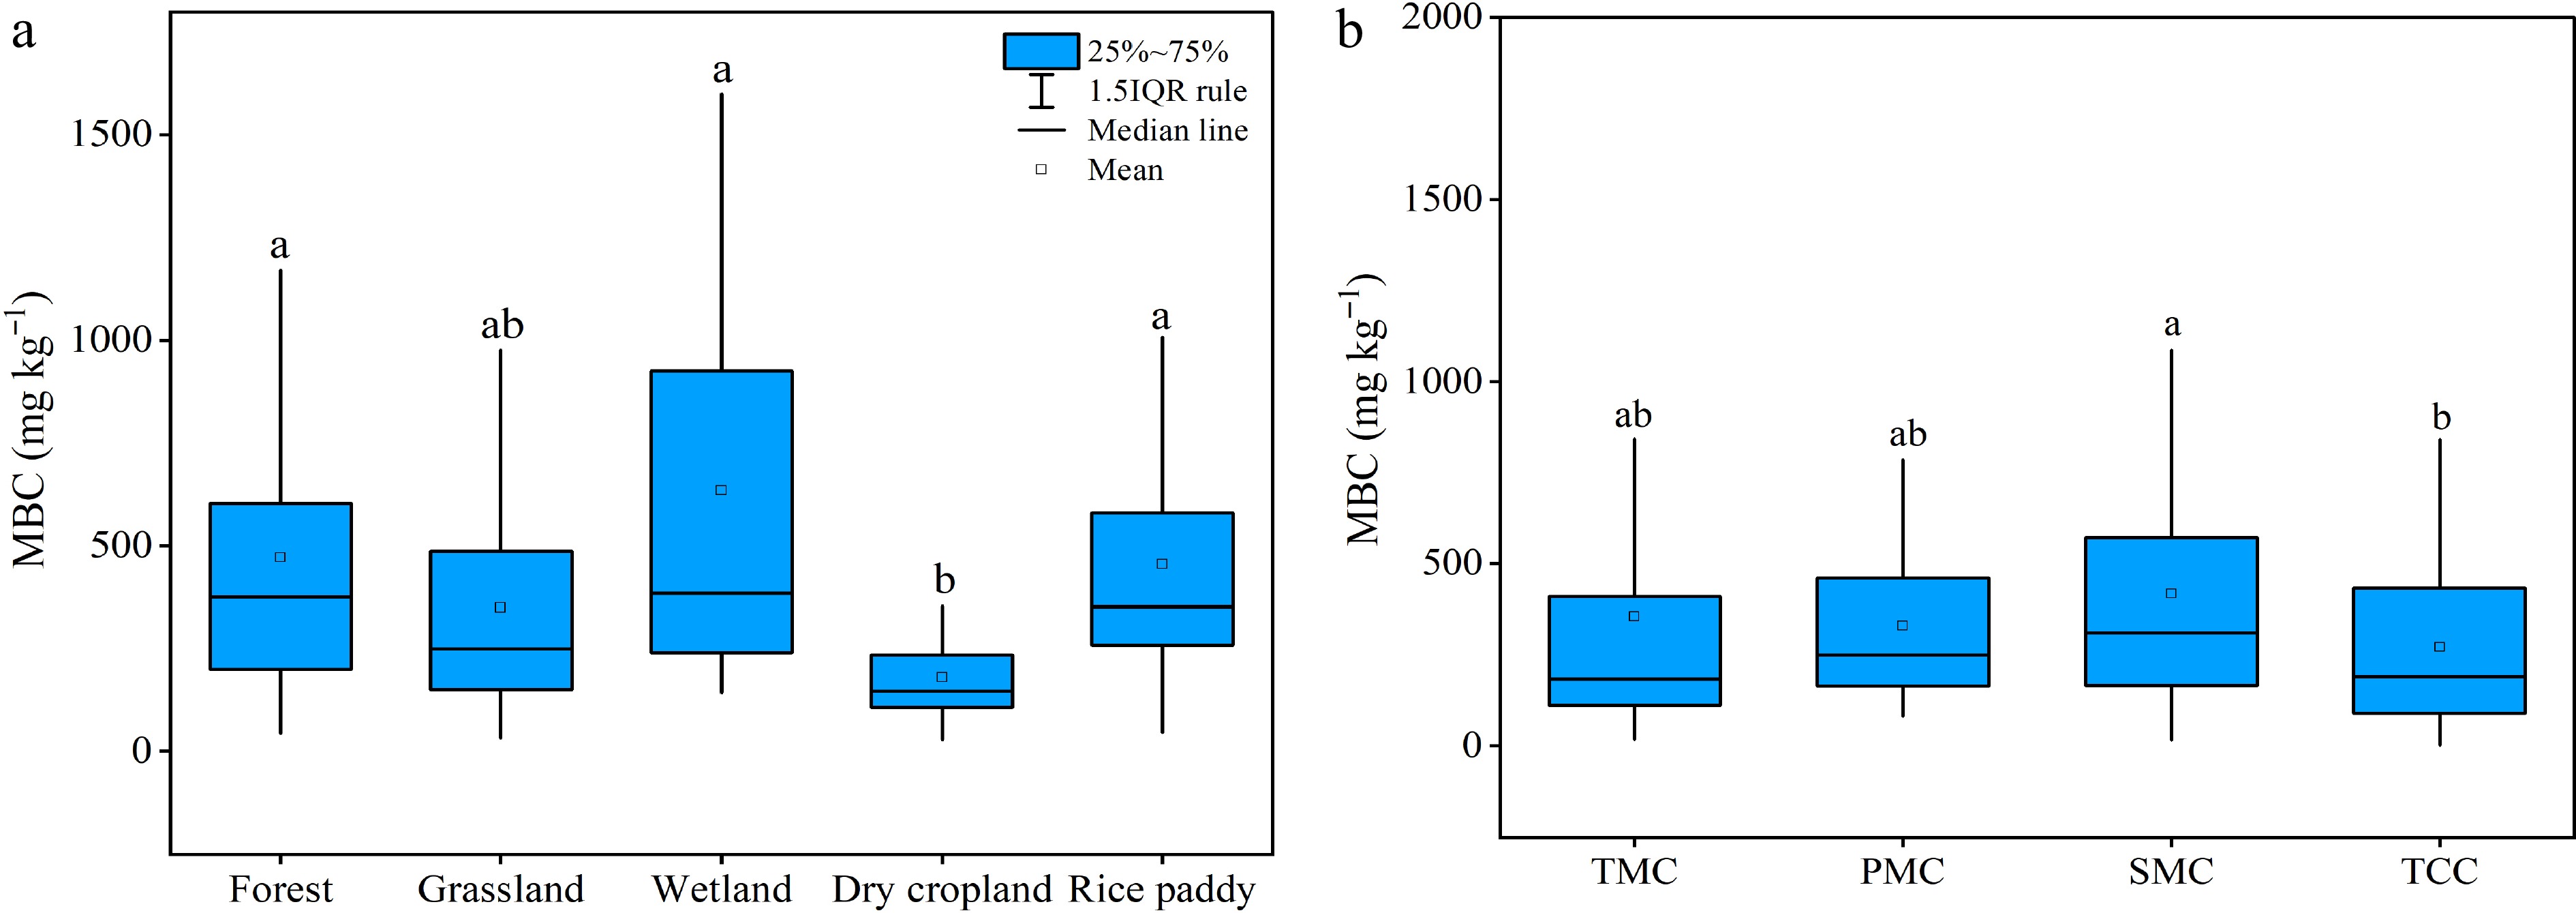
Figure 2.
Differences in soil microbial biomass carbon concentrations (a) among land use types and (b) in different climatic regions. Different letters indicate significant differences of soil microbial biomass carbon concentrations and microbial quotients between land use types at p < 0.05.
The mean topsoil MBC contents ranged from 280.9 mg·kg−1 to 400.8 mg·kg−1 across the climatic regions (Fig. 2b), with a much narrower variation than across land use types. As shown also with ANOVA, the mean topsoil MBC was higher by almost 25% under subtropical monsoon climate (SMC) than under temperate continental climate (TCC), which was not significantly different from the plateau/mountain climate (PMC) region and the temperate monsoon climate (TMC) region.
Variation of topsoil microbial quotient (MQ)
-
Like soil MBC, microbial quotient estimated as MBC in percentage to SOC, fitted well a log-normal distribution and ranged from 0.2% to 12.8% (Supplemental Fig. S5). The MQ of all observations across the land use types was averaged as 2.05% to their SOC content, with a 95% confidence interval of 1.87%−2.22%. As indicated in Fig. 3a, the mean MQ was lowest in grassland (1.63%) and highest in rice paddy (2.69%). The mean MQ value was moderate in wetland (2.16%), which was not significantly different from forest (2.08%) and dry cropland (1.82%). Compared to MBC, MQ showed a relatively stronger variation among the land use types.
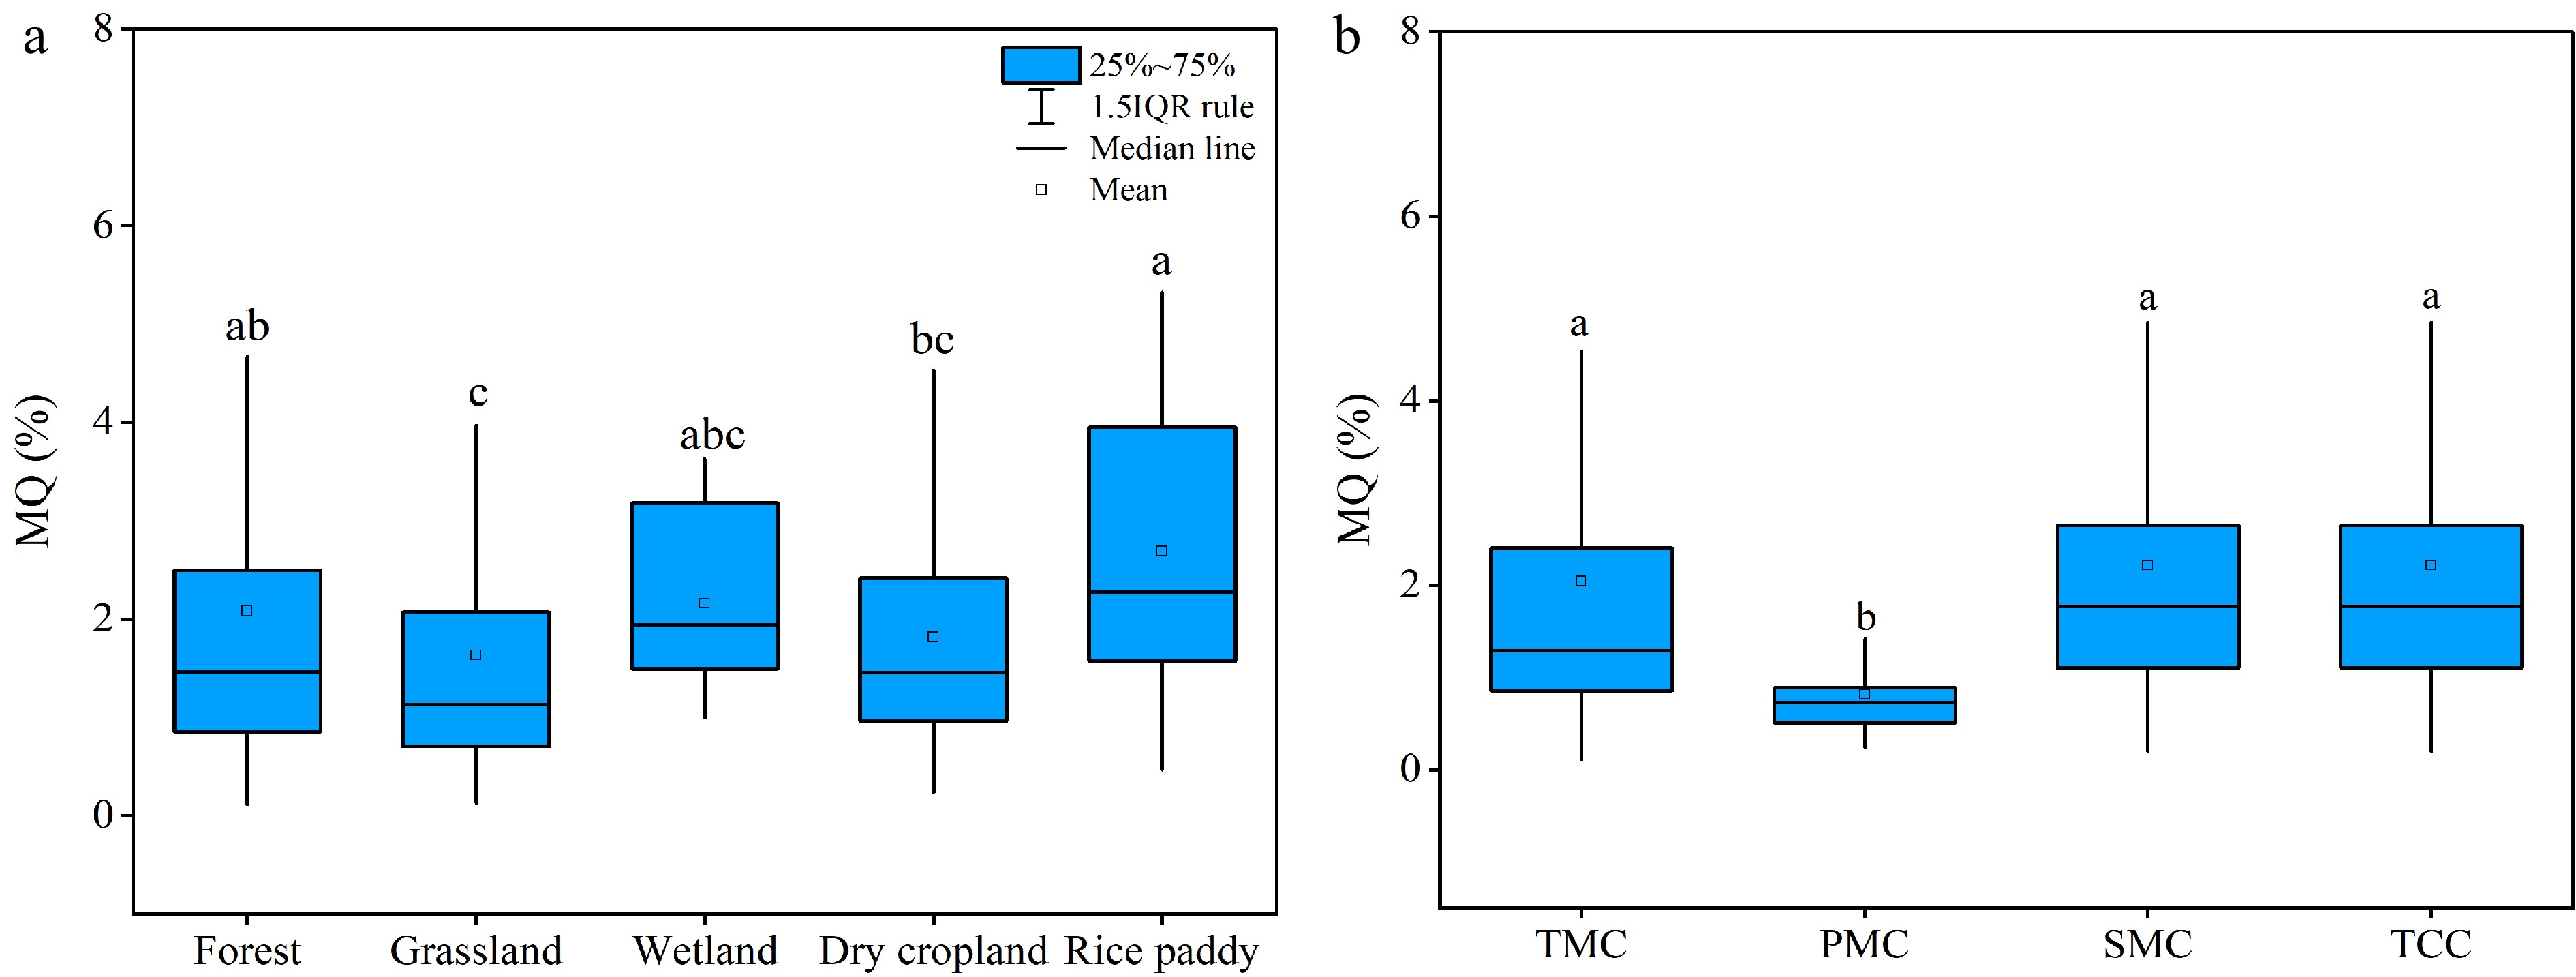
Figure 3.
(a) Soil microbial quotient among land use types and (b) microbial quotient in different climatic regions. TMC, temperate monsoon climate; PMC, plateau/mountain climate; SMC, subtropical monsoon climate and TCC, temperate continental climate. Different letters after mean values indicate significant differences of soil microbial biomass carbon concentrations and microbial quotients between climatic regions at p < 0.05.
Moreover, the variation of mean topsoil MQ values among the climatic regions was not following that of MBC (Fig. 3b). The mean MQ values were more or less similar among the TMC (2.04%), SMC (2.21%) and TCC (2.31%) regions. Being significantly lower, the mean MQ was as low as 0.73% in the PMC region. Evidently, variation with land uses and climate regions seemed relatively smaller than the site variability.
Topsoil MBC pool distribution with land use types
-
Topsoil MBC pools estimated for different land use types using direct (Approach I) and indirect (Approach II) approaches were graphed in Fig. 4a & b respectively. Herein, under a certain land use type, the MBC-based direct estimation of topsoil microbial biomass carbon pool was very close to MQ-based indirect estimation. Predicted with Approach I and II, the topsoil MBC pool was 246.5 (213.0−279.9, 95% CI) Tg C and 284.6 (238.1−331.0, 95% CI) Tg C for forest land, 233.9 (192.3−275.5, 95% CI) Tg C and 250.5 (203.4−297.6, 95% CI) Tg C for grassland, 56.6 (50.3 − 62.9, 95% CI) Tg C and 55.8 (49.7−61.9, 95% CI) Tg C for dry cropland, 50.3 (25.3−75.4, 95% CI) Tg C and 44.3 (32.7−55.8, 95% CI) Tg C for wetland, and 27.1 (21.2−32.9, 95% CI) Tg C and 22.0 (18.3−25.8, 95% CI) Tg C for rice paddy, respectively.
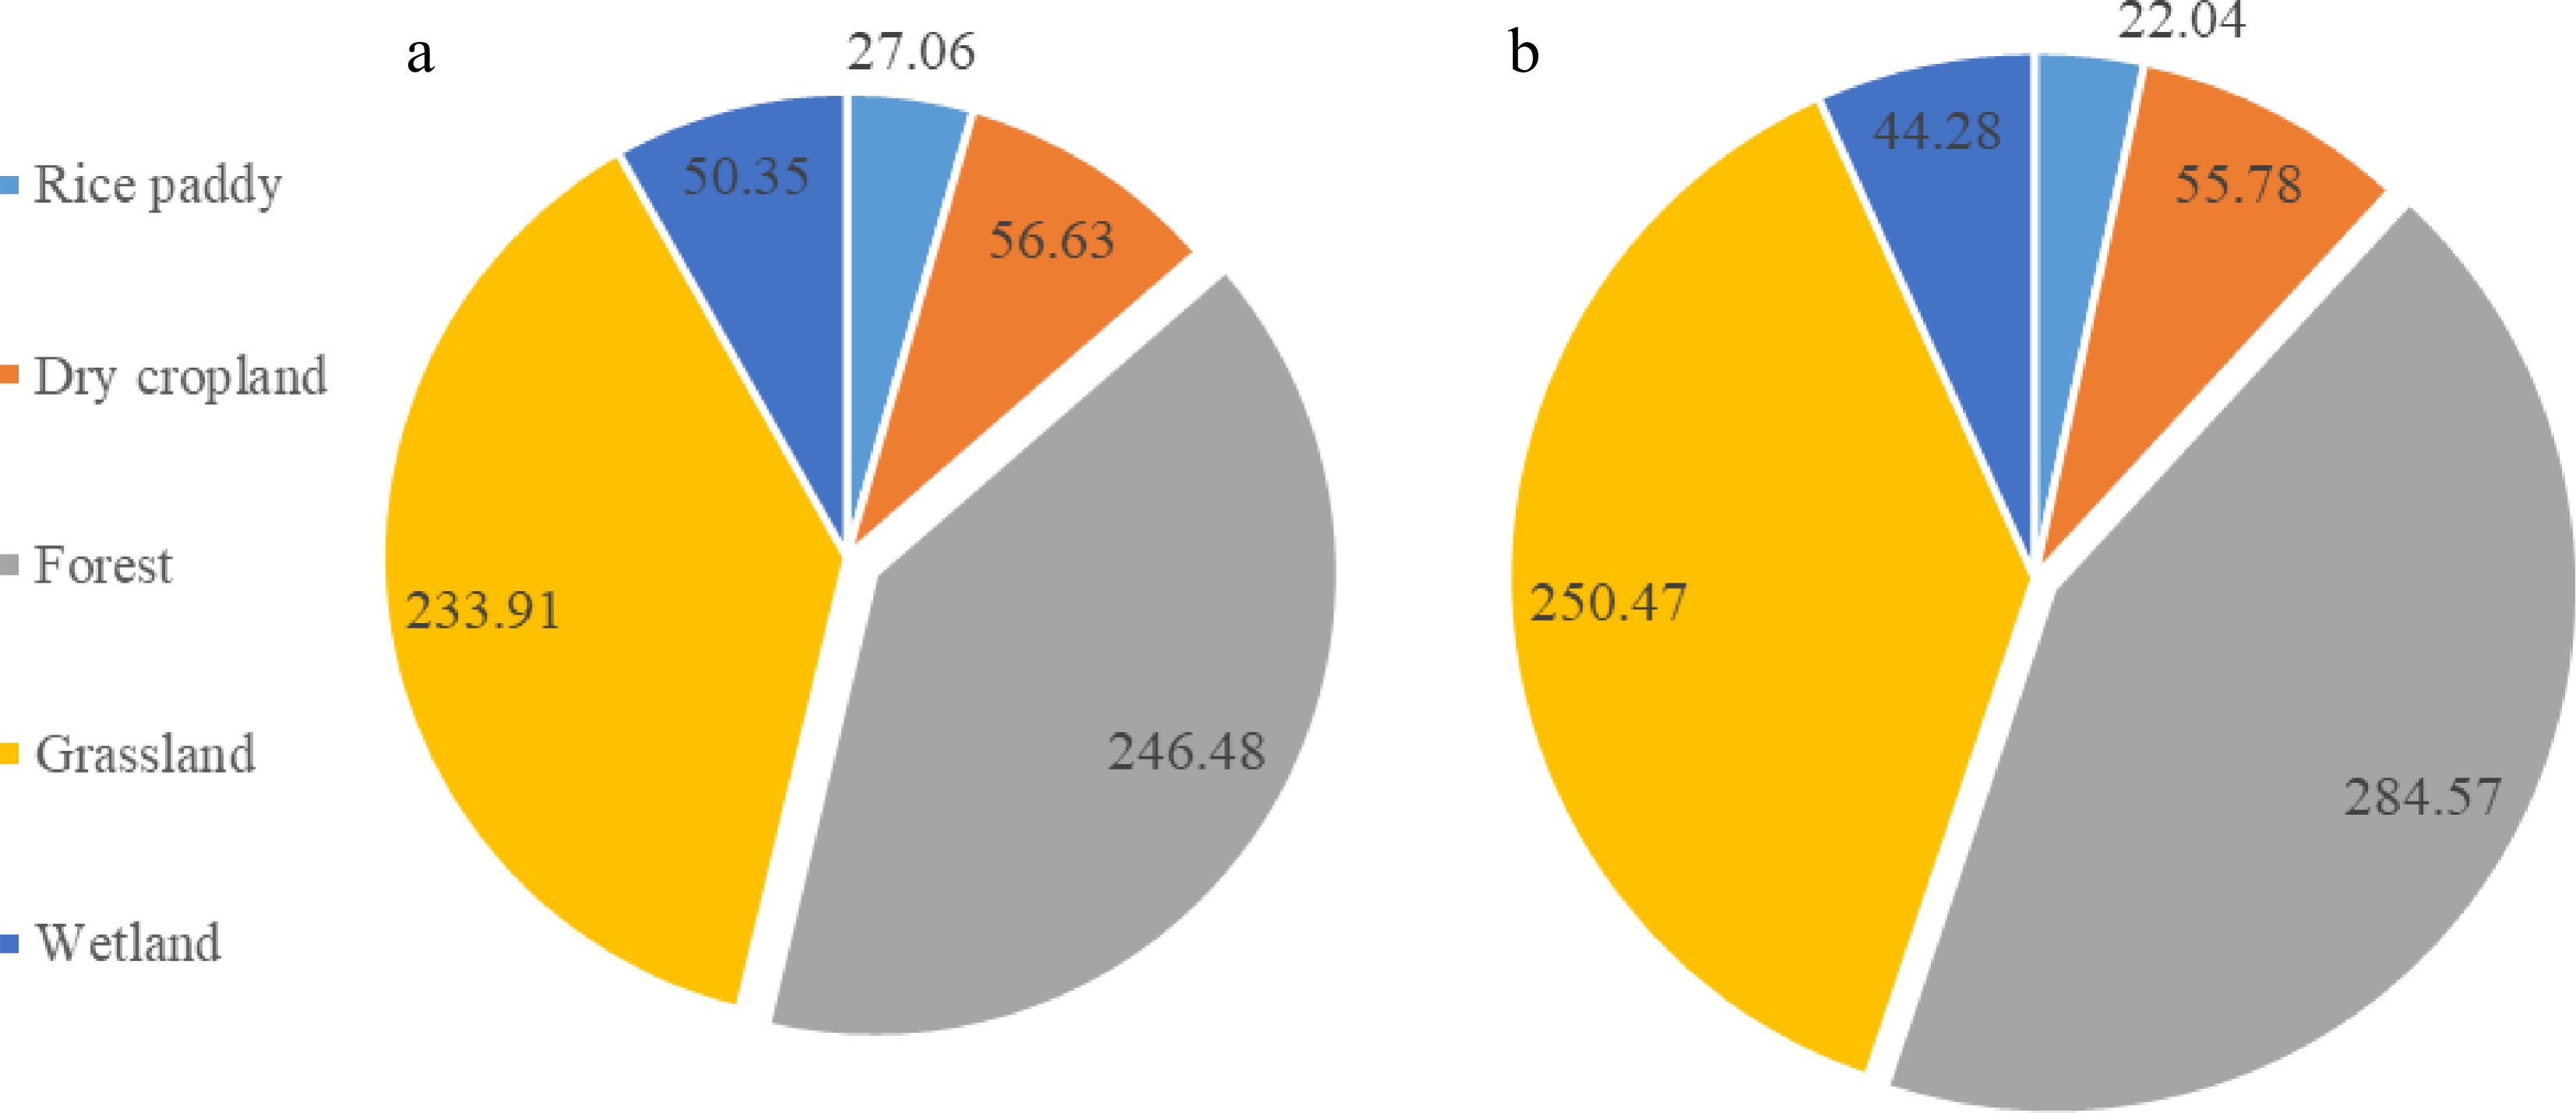
Figure 4.
Topsoil microbial biomass carbon pool (Tg C) of different land uses of China, estimated as per averaged MBC ((a), approach I)) and averaged MQ combined with SOC stock ((b), approach II)). The size of the set is comparable to the total pool size for the whole stock.
Integrating these MBC pools of the individual land use types, we reached an estimation of the whole China's topsoil being 614.4 Tg C (502.2−726.7 Tg C, 95% CI) using the area-averaged MBC values and 657.1 Tg C (542.1−772.1 Tg C, 95% CI) using the mean MQ values. Using the area-weighted mean MQ and the whole topsoil SOC stock (Xie et al., 2007), a potential topsoil microbial biomass C pool could be 614.4 Tg C for the whole mainland China. Confidently, a topsoil MBC pool size could reach 0.6 Pg C for the whole of China. This pool was allocated to forest by ca 40%, to grassland by 38%, to dry cropland by ca 9% and to wetland by 7%−8% while to rice paddy by 3%−4%.
Correlations of MBC or MQ to soil and climate variables
-
Results of multivariate correlation analysis to explore the environmental drivers for topsoil MBC are presented in Fig. 5. Overall, MBC was correlated positively and strongly to total N and MBN (r > 0.60, p < 0.0001) but slightly (r < 0.30, p < 0.05) to MAP, soil C/N ratio and MBC/MBN ratio. However, negative correlation of MBC was found strong to bulk density (r = −0.57, p < 0.0001), slight to soil pH (r = 0.30, p < 0.01 when pH > 7.5). MBC correlation to environmental attributes varied with land use types. A negative correlation of MBC to bulk density was found very significant and strong for natural soils (forest, grassland and wetlands). Whereas, the MBC correlation to bulk density was not significant for croplands (both dry cropland and rice paddy). Differently, MBC was correlated to soil pH positively under grassland but negatively under rice paddy and forest. Again, MBC was correlated positively and moderately to strongly to MAP under wetland and grassland/forest while negatively in rice paddy. In contrast, MBC was observed very significantly and strongly to MAT in wetland though insignificant under other land use types. In addition, only for wetland and rice paddy, soil N level was significantly and positively correlated to MBC (r > 0.5, p < 0.05).
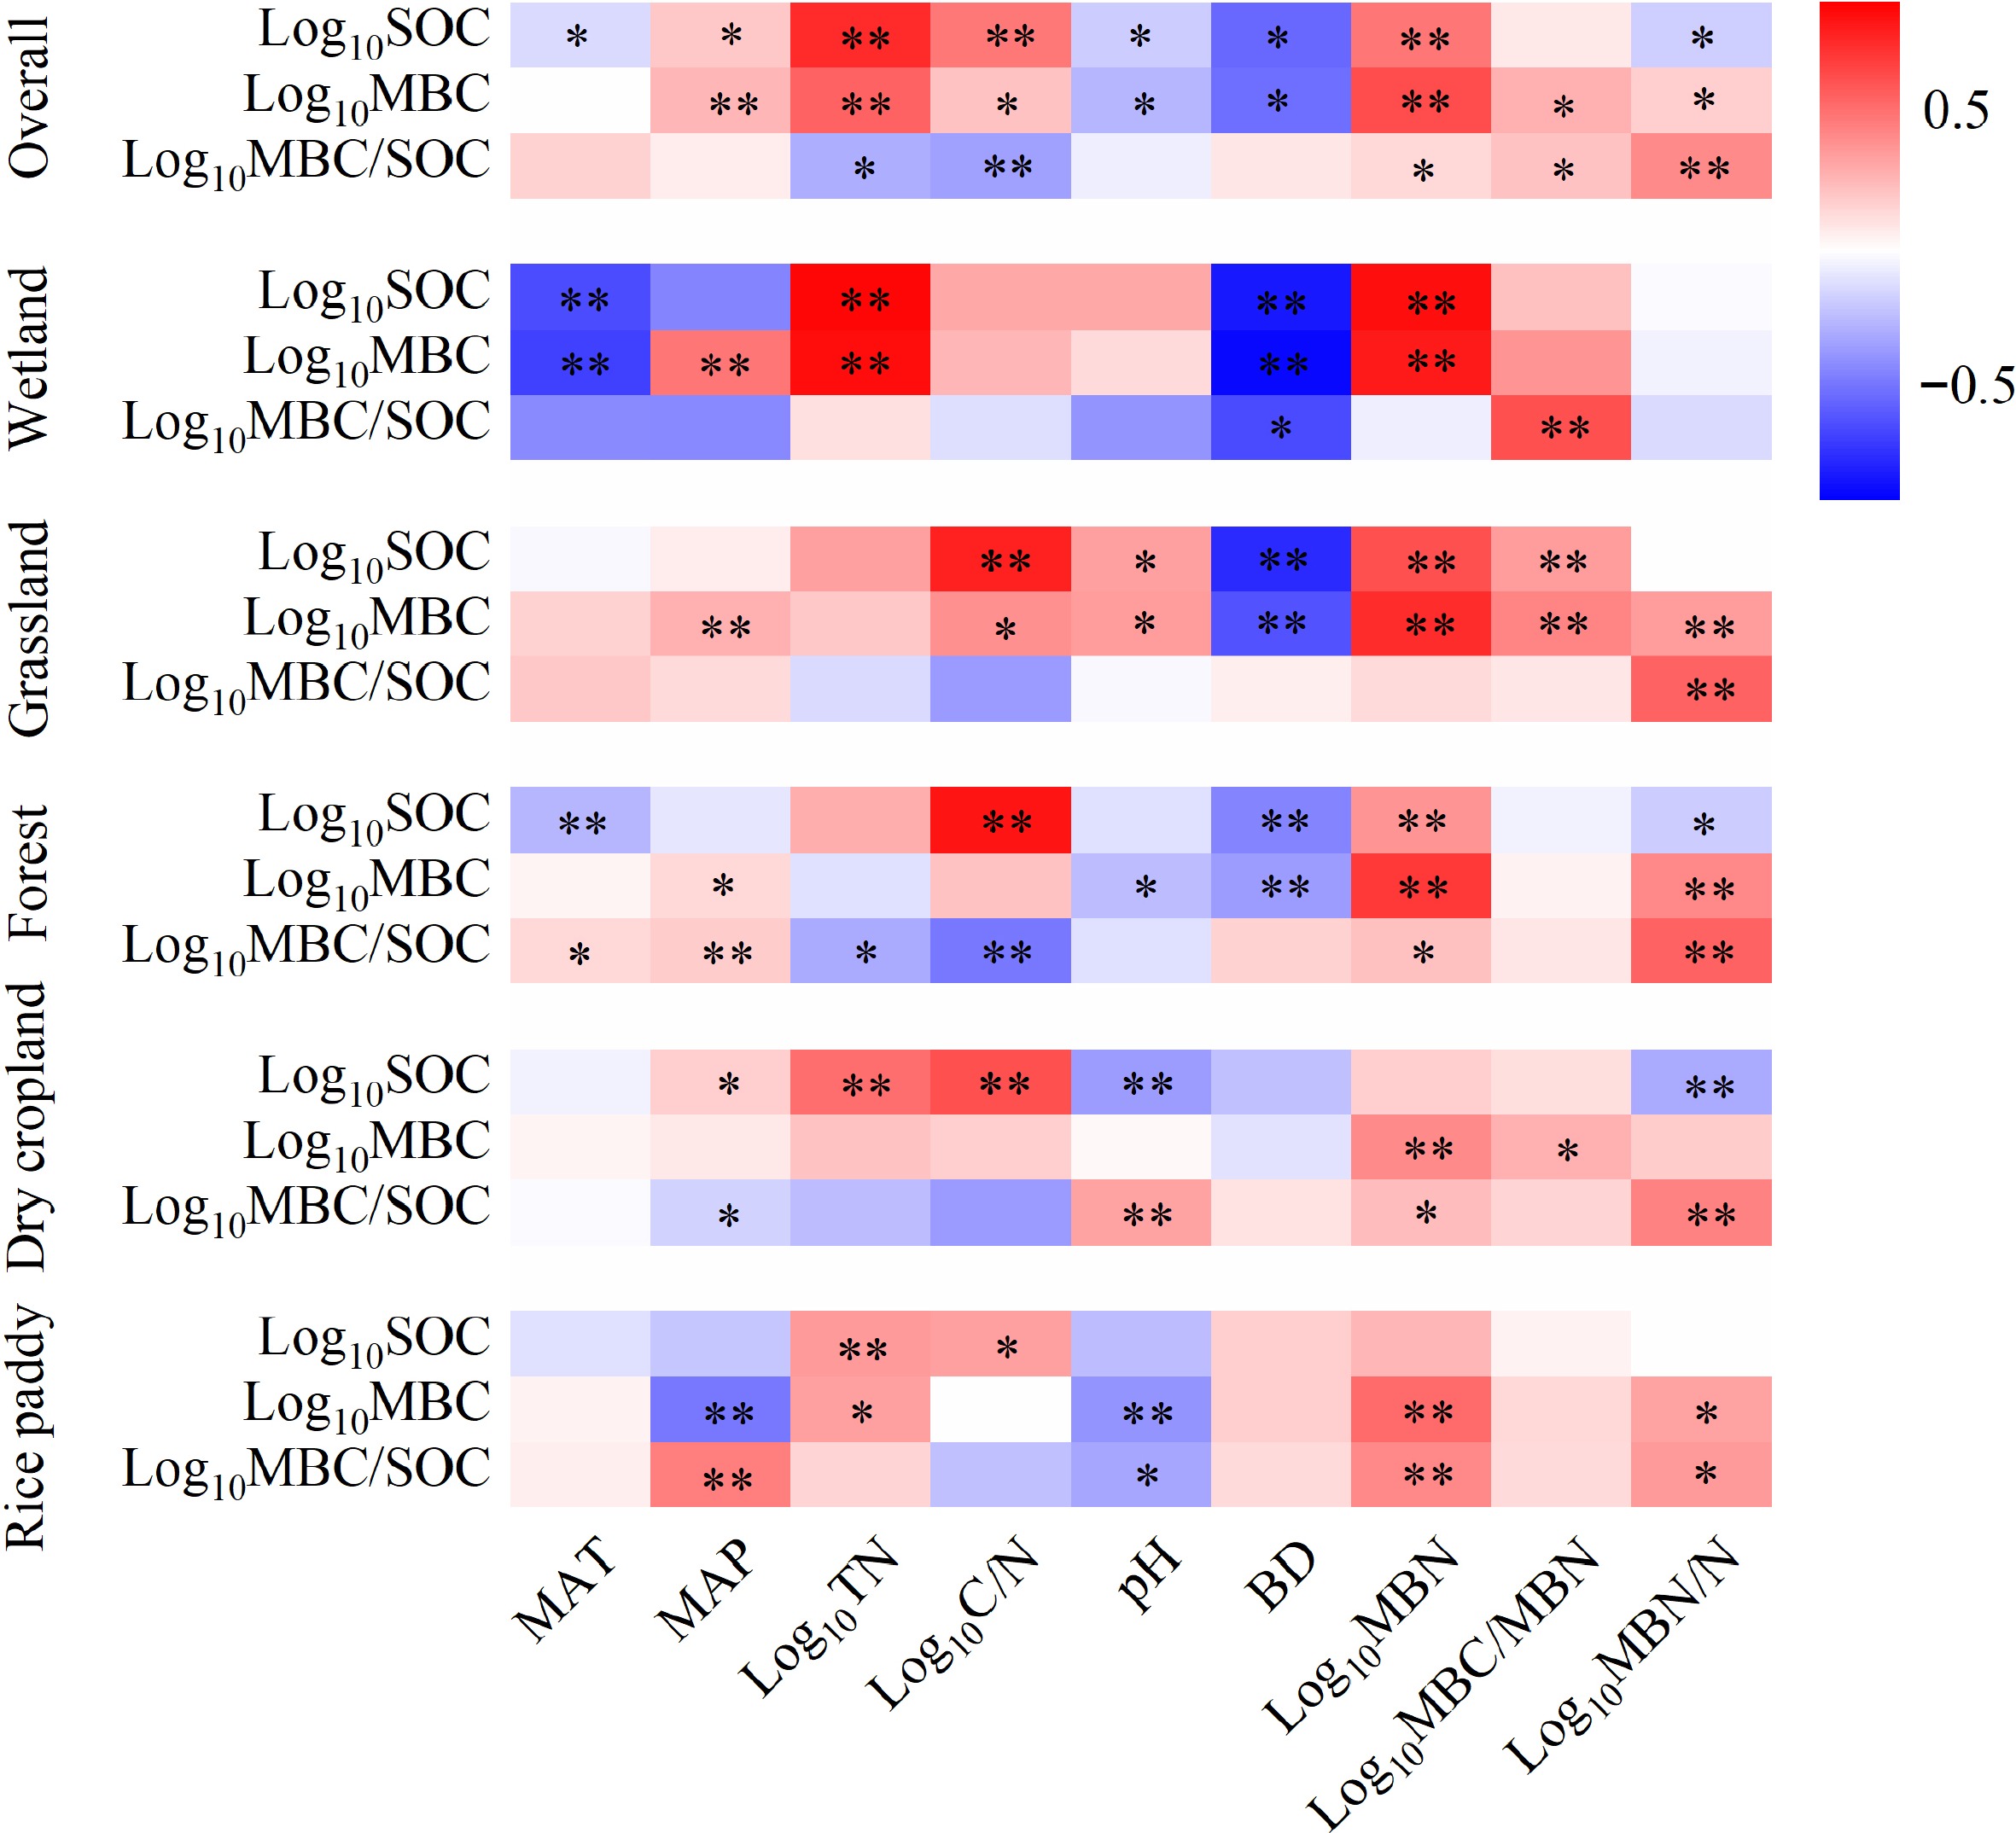
Figure 5.
Environmental drivers of soil microbial biomass carbon (* p < 0.05; ** p <0.01).
Unlike MBC, a very significant (p < 0.0001) negative but moderate correlation was found for topsoil MQ to SOC (r = −0.48), total N (r = −0.32), and soil C/N ratio (r = −0.37) while no correlations to soil pH or to bulk density, for overall observations (Fig. 5). However, the correlation of MQ to soil and environmental attributes varied also greatly with land use types. For example, MQ was correlated positively and moderately to MAP under forest and rice paddy but negatively in dry croplands. However, no correlation was visible to MAT despite a weak positive correlation under forest. In addition, MQ was significantly correlated to soil pH negatively under rice paddy but positively under grassland.
Through an approach of stepwise multivariate regression analysis with forward method, an optimum multivariate model was developed to predict a topsoil MBC content. With a total adjusted explanatory power of 48%, the model was expressed as the following equation:
$\begin{split} {\mathrm{log}}_{10}MBC=&2.41-0.60\times BD+0.46\times {\mathrm{log}}_{10}SOC-\\&0.27\times {\mathrm{log}}_{10}TN +0.0002\times MAP \end{split}$ (4) where, MBC is the microbial biomass carbon content (mg·kg−1), BD represents the bulk density (g·cm−3), SOC is the organic carbon content (g·kg−1), TN is the total N content (g·kg−1), of topsoil. MAP is the mean annual air temperature (°Ϲ) over the soil area.
-
In this study, there were greater difference in both mean topsoil MBC and MQ among land use types than among the climate zones (Figs 2 & 3) despite large heterogeneity across sites (28.7−1608.2 mg·kg−1). As shown in Figs 2a & 3a, both MBC and MQ on average were relatively high under wetland (635 mg·kg−1 and 2.2%), rice paddy (454 mg·kg−1 and 2.7% ) and forest (471 mg·kg−1 and 2.1%) while low under cropland (180 mg·kg−1 and 1.8%) and grassland (350 mg·kg−1 and 1.6%). Compared to the estimation on a global scale by Xu et al. (2013), the estimated topsoil MBC pool in this study was similar for forest and croplands (area weighted of dry croplands and rice paddy) but significantly lower for wetland and grassland, being respectively 1336.8 mg·kg−1 and 520.8 mg·kg−1 reported (Xu et al., 2013). With soil survey and monitoring data synthesis, Xie et al. (2007) reported a significant soil carbon accumulation for forest and cropland but decline for grass land since the 1980's. Also, soil organic carbon loss was seen to be extensive for wetlands across China (Zhang et al., 2008). For forest soil, in particular, the estimate of topsoil MBC in this study (470.8 mg·kg−1 on average) was higher than that of 390.2 mg·kg−1 reported in a specific study of MBC of forest soils from China by Zhou & Wang (2015). In this study, data of forest soil MBC were largely from the measurements conducted after 2015 following the national ecological civilization strategy (Supplemental Table S1). Following ecological restoration of vegetation in China, soil microbial necromass increment was observed much higher than SOC increase reported by Li et al. (2023). The relatively higher MBC in forest and cropland could point to potential soil microbial community enhancement through increased carbon substrate supply with improved managements and restoration (Zhang et al., 2022). Singh & Gupta (2018) argued that ecological restoration could reduce the unpredictability and turnover rates of soil microbial biomass through alleviating soil stresses on microbial communities.
Our study demonstrated a larger variation of MBC than MQ among the land use types. For climate zones also, MBC was almost similar though lower in TCC zone while MQ exerted a larger variation than MBC with PMC (0.81%) greatly lower (Fig. 2b & 3b). Serna-Chavez et al. (2013) demonstrated a very large difference of both soil MBC and topsoil MQ across global biomes, whereby under forest MQ rather than MBC displayed a wider variation with climate conditions. MQ represented microbial assimilation of soil organic carbon (Serna-Chavez et al., 2013) and of microbial activity in relation to environmental stresses (Zhou & Wang, 2015). In this study, mean MQ values (1.6%−2.2%) across the land use types were generally higher, except for grassland, than those (1.0%−2.1%) across global biomes quantified by Xu et al. (2013). In a quantification by Serna-Chavez et al. (2013) using their MBC estimate database in geo-reference to grid SOC, MQ of grasslands was over 3.0% compared to temperate broadleaf forest (2.0%), temperate coniferous forest (3.0%) and tropical forest (3.6%). In particular, our estimate of mean MQ in forest (2.1%) was close to that (1.92%) reported by Zhou & Wang (2015) with experimental data under intended treatments. For cropland, the mean MQ of 2.0% in this study was comparable to those in a range of 2.3%−2.9% under long-term experiments from Central Europe (Coban et al., 2022). But, the mean MQ of 2.2% for wetland, though much fewer cases, turned markedly higher than that of 1.20% for global mean of natural wetlands (Serna-Chavez et al., 2013). Furthermore, an area-weighted mean MQ was estimated as 1.89% (1.7%−2.3% for 95% confidence interval) in comparison to 1.20% by both Serna-Chavez et al. (2013) and by Xu et al. (2013). Although topsoil samples were taken for a 0−20 cm depth (except for 15 cm for rice paddy) in Chinese soil sampling protocol (Song & Deng, 2017) while the 0−30 cm depth was default for sampling in the works (Serna-Chavez et al., 2013; Xu et al., 2013), the above mentioned discrepancy could be explained with difference in soil resource and environmental conditions (Zhou & Wang, 2015) to be explored below.
The data obtained here could allow an estimation of total MBC pool of China's topsoil cover. Both in terms of land use types, a total topsoil MBC pool was yielded of 614.4 Tg C and 657.1 Tg C respectively with Approach I using mean measurement data of MBC concentration and bulk density in the database and Approach II using the individual values both of mean MQ obtained and the topsoil SOC stock retrieved from Xie et al. (2007). Using the area weighted mean MQ value and the total topsoil SOC stock of 32.94 Pg (Xie et al., 2007) integrating all the land use types, a total topsoil MBC pool of 622.7 Tg C was obtained for the whole of mainland China. Thus, a total topsoil microbial biomass carbon pool could be established, being very likely of ca 657.1 Tg C for the whole of China. Evidently, this pool contributed 4.4% and 3.8% to the global pool respectively of 14.6 Pg C (Serna-Chavez et al., 2013) and 16.7 Pg C (Xu et al., 2013). Comparably, China's share of the global SOC stock could be known of 6% and 4.8% respectively for whole soil and for topsoil (Pan et al., 2015; Xie et al., 2007). The relatively lower share of topsoil microbial biomass could be indicative of intensive impact by land use activities and environmental changes (Zhou & Wang, 2015) on soil microbial community preservation.
Drivers of topsoil MBC and microbial abundance variation: edaphic versus climatic
-
The key player in regulating their level could differ between MBC and MQ for China's soils though both were subject to changes in edaphic and biogeographic factors (Paul, 2016). Clearly, there was a high site variability both of MBC (CV of 95%) and MQ (CV of 98%). Xu et al. (2013) reported a wide variation by three orders of topsoil MBC but by only one order for topsoil MQ using global data. Moreover, the variation of MBC was stronger (CV of 40%) than MQ (CV of 19%) across the land use types while that of MQ was stronger (CV of over 40%) than MBC (CV of 14%) when assessed with climate regimes (Figs 2 & 3). This pattern of stronger driver by vegetation zone on SMBC but less by climate on MQ was also reported at global scale (Serna-Chavez et al., 2013). Seemingly, land use change impacted more on topsoil MBC while climate (mainly MAP) more on the MQ (Fig. 5). As shown in recent studies (Serna-Chavez et al., 2013; Xu et al., 2013), MQ could be linked to soil stress such as moisture, organic carbon loss and N limitation. The variation of MQ with land use could represent the extent by which the ecosystems altered with human disturbance (Zhou & Wang, 2015). As such, the estimated mean MQ values were generally almost 2-fold the global mean of 1.2%, reflecting soil stresses of Chinese soils under long human utilization and climate change (Pan, 2009; Song et al., 2005).
It was recommended that soil microbial biomass was not driven by temperature but by factors affecting soil moisture availability and soil nutrients such as N status (Serna-Chavez et al., 2013). Specifically for forest biomes across China, Zou & Wang (2015) noted that both MBC and MQ were controlled by soil condition rather than by climate condition, with up to 40% of the total variation explained by soil factors of SOC, total N and their interaction but less than 10% by climate conditions. At the regional scale, therefore, land use as a major driver impacted soil microbial biomass pool plus modification by climate condition through changes in soil resource conditions such as soil moisture availability, carbon input through vegetation shift, N level through human activities.
For the edaphic factors, SOC, total N, bulk density and pH are the important factors for soil MBC across the land use types (Fig. 5; Supplemental Fig. S9). SOC had been well known to be controlled by ecosystem productivity, spatial variability with soil attributes, on a regional scale (Fierer et al., 2009). This further affected the size and community structure of soil microbes with variations in SOC quality, plant C inputs and rates of C turnover (Wardle, 1992). Serna-Chavez et al. (2013) addressed a strong impact by SOC and total N on MBC pool of a wide range of soils across the globe. To note, there was a significant, but very slight (r2 <0.1), negative correlation of MBC to soil pH across China (Supplemental Fig. S10) despite a strong negative correlation both under forest and rice paddy (Fig. 5). Differently, soil pH was either significantly but slightly (Serna-Chavez et al., 2013) or not significantly (Xu et al., 2013) correlated to microbial biomass carbon on a global scale. Interestingly, we found a significant and very strong negative correlation (r = −0.57, p < 0.0001) of MBC to soil bulk density for all soils other than croplands across China. Though bulk density data was not included (Xu et al., 2013) or not correlated in the existing global synthesis, our finding highlighted the prominent effect of soil structure on preservation of microbial communities and their ecosystem services (Gupta & Germida, 2015).
The narrower range of MQ variation suggested weaker impact by soil factors on the microbial carbon assimilation intensity in topsoil. Linking to N limitation effects (Xu et al., 2013), microbial assimilation could be stimulated in N-limited conditions while microbial growth, and thus microbial abundance, could be stressed in high C:N ratio soil (Paul, 2016; Wang et al., 2009; Dequiedt et al., 2011). As such, MQ was negatively correlated strongly to total N and less strongly to C/N ratio across global biomes (Xu et al., 2013). Unlike the finding for the forest lands across China (Zhou & Wang, 2015) and for the global biomes (Xu et al., 2013), MQ was negatively correlated to soil C/N ratio and, to lesser extent, to total N for overall observations in this study (Fig. 5). Again, MQ was found very significantly and strongly positively correlated with microbial nitrogen (MBN) across all the land use types. This showed variation of MQ could be partly attributed to variation of N assimilation by microbes, in responding to soil nutrient status (Dequiedt et al., 2011). It was already shown that low N availability could spike microbial N assimilation and thus increase MQ through enhanced organic matter decomposition in disturbed topsoil (Lejon et al., 2007).
For all the observations across China, MBC was positively and strongly correlated to MAP but not to MAT, supporting the major factor of moisture rather than temperature on soil microbial biomass (Xu et al., 2013). Whereas, MQ was correlated neither to MAP nor to MAT for the whole observations (Fig. 5). In terms of climate zones, MBC was higher in SMC region than in the TCC regions in this study (Fig. 3), depicting a critical role of soil moisture on soil microbial growth (Wieder et al., 2013; Ma et al., 2015). Although microbial growth was well known to be strongly temperature- dependent (Grisi et al., 1998), MQ but not MBC was lower in the PMC than in the TCC, SMC and TMC regions (Fig. 3). This is inconsistent with the finding that MQ values were higher in tropical and subtropical climate zones than in boreal and tundra regions (Xu et al., 2013). This could be attributed to the difference in microbial carbon decomposition and nutrient assimilation between these climate zones. Likewise, Franzluebbers et al. (2001) argued that topsoil MBC, but not SOC, was controlled by macro-climate condition across continental USA overall in this study, soil MBC was strongly controlled by soil factors but less strongly by climate variables though the variation of MQ was rather narrow and less respondent to soil and climate changes.
For predicting MBC of a given soil, a linear regression model (Eqn 4) was established following a stepwise regression analysis. This model was contributed by three edaphic attributes including bulk density, SOC and total N and one climate attribute of MAP. Xu et al. (2013) proposed a logarithmic model for predicting MBC mainly with climate variables (mean annual precipitation and temperature) plus SOC, with the fitted parameters inconsistent with climate zones of the globe. Differently, Serna-Chavez et al. (2013) developed a MBC model with six attributes both of climatic parameters and edaphic factors of pH and total nitrogen, and a MQ model with eight attributes of climate parameters and soil total nitrogen, pH, C:N ratio and CEC. Our MBC model had an adjusted explanatory of 48% of the total variance, in comparison to that of 39% of the MBC model by Serna-Chavez et al. (2013) with more attributes accounted. In previous work (Frey et al., 2013), macroclimate attributes had been considered for the predominant environmental driver for MBC pool of soils across major biomes on a global scale. In this study, however, edaphic parameters such as soil carbon, total N and climate parameter of mean annual precipitation were shown playing determinant roles on MBC pool of topsoil across land use types in China. The proposed model, with both key attributes of soil and climate and with a good explanatory power, could provide a simple tool to perform a essential estimation of MBC for robust soils at a random site from mainland China. The model could be used to guide the practices for enhancing soil microbial biomass and thus enhance soil microbial biodiversity of China' soils through manipulation of soil organic carbon and nitrogen. Indeed, nature-based solutions such as biochar for soil management could safeguard soil microbial biomass pool, and in turn, soil health for One Health of the Earth system (UNEP, 2022).
Uncertainty and perspectives
-
Uncertainty remains in the basic estimation via multivariate statistics of microbial biomass in soils of China. Firstly, the MBC data used in this study were measured using the chloroform fumigation-extraction method (Vance et al., 1987). The sampling at different seasons in individual studies could impact the MBC level determined. Secondly, the bias of number of observations among land use type could cause a main source of uncertainty. This was the case particularly for wetlands, which had only 11 observations in the dataset and showed high, but variable, MQ measurements, compared to the values reported by Serna-Chavez et al. (2013). Thirdly, lack of available soil data could impact the model efficiency as only 77 data sets were used to develop the multivariate model, compared to a total of 648 MBC measurements. We reached a consistent estimate of topsoil MBC pool of China's soils with different predicting approaches. However, the depth of topsoil was set to a default of 20 cm for soils other than rice paddy with a default value of 15 cm. This could, of course, lead to a lower pool size of topsoil MBC in China' soils compared to a default topsoil depth of 30 cm in the works for global estimations (Serna-Chavez et al., 2013; Xu et al., 2013). In addition, for non cropland soils, edaphic parameters such as bulk density, soil N and microbial biomass N as well as soil texture were not reported or often absent. Further work should be deserved to obtain a more robust and high resolution estimation of microbial biomass in topsoil in terms of soil types and soil regions (Gong, 1999) as well as for whole soil. For better understanding of the MQ status, the linkage of microbiome structure and activity to soil organic matter status should be explored with special reference to soil structure at an aggregate level in the future.
-
The effects of environmental variables on topsoil microbial biomass and the relation to SOC were quantified based on published database literature of field studies across mainland China. Wide MBC variation was mostly showed with land use changes while MQ was changed with climate conditions. For individual soils, SOC (and TN) exerted a strong positive impact on MBC and moderate negative impact on MQ. In contrast, precipitation had positive but moderate impact on MBC and temperature had positive but moderate impact on MQ. Among the land use types, rice paddy had the higher MQ despite lower SOC and soil C/N ratio, compared to forest and grassland soils, indicating a higher active biological carbon pool. A multi-variable model was developed to allow a general prediction of topsoil microbial biomass carbon for China soils. As a result, a topsoil MBC pool was estimated of 614.4~657.1 Tg for overall China soils. Topsoil MBC pool showed greater variation than microbial quotient with land use types; soil factors strongly impacted MBC pool while climate factors showed a great influence on microbial quotient.
This work was financially supported by China Natural Science Foundation under a grant number 41501569, 41371298 and U1612441. The international cooperation was funded by the Priority Academic Program Development of Jiangsu Higher Education Institutions (PAPD), and the double first rank discipline construction plan, the Ministry of Education, China. This work contributes to the N-Circle project, a China-UK Virtual Joint Centre on Nitrogen funded by the Newton Fund via the UK BBSRC (BB/N013484/1).
-
The authors declare that they have no conflict of interest. Pan Genxing is the Editorial Board member of Soil Science and Environment. He was blinded from reviewing or making decisions on the manuscript. The article was subject to the journal's standard procedures, with peer-review handled independently of this Editorial Board member and his research groups.
- Supplemental Fig. S1 Frequency distribution of soil organic carbon (SOC) before (left) and after (right) Log10 transformation.
- Supplemental Figs S1
- Supplemental Fig. S2 Frequency distribution of soil total nitrogen (TN) before (left) and after (right) Log10 transformation.
- Supplemental Fig. S3 Frequency distribution of soil carbon and nitrogen ratio (C/N) before (left) and after (right) Log10 transformation.
- Supplemental Fig. S4
- Supplemental Fig. S4 Frequency distribution of soil microbial biomass carbon (MBC) before (left) and after (right) Log10 transformation.
- Supplemental Fig. S5 Frequency distribution of soil microbial quotient (MBC/SOC) before (left) and after (right) Log10 transformation.
- Supplemental Fig. S6 Frequency distribution of soil microbial biomass nitrogen (MBN) before (left) and after (right) Log10 transformation.
- Supplemental Fig. S7 Frequency distribution of soil microbial biomass nitrogen and soil total nitrogen ratio (MBN/TN) before (left) and after (right) Log10 transformation.
- Supplemental Fig. S8 Frequency distribution of soil microbial biomass carbon and soil microbial biomass nitrogen ratio (MBC/MBN) before (left) and after (right) Log10 transformation.
- Supplemental Fig. S9 Differences in SOC concentration (a), soil total N concentration (b), soil C/N ratio (c) and MBC/MBN ratios (d) between land uses (Different letters indicate significant differences of various variables between land uses at p < 0.05).
- Supplemental Fig. S10 Correlation of soil microbial biomass carbon (logarithmic transformation) with soil pH.
- Supplemental Table S1 Information of the experimental sites of observation data used for quantification in this study.
- Copyright: © 2023 by the author(s). Published by Maximum Academic Press, Fayetteville, GA. This article is an open access article distributed under Creative Commons Attribution License (CC BY 4.0), visit https://creativecommons.org/licenses/by/4.0/.
-
About this article
Cite this article
Liu C, Tian J, Cheng K, Xu X, Wang Y, et al. 2023. Topsoil microbial biomass carbon pool and the microbial quotient under distinct land-use types across China: A data synthesis. Soil Science and Environment 2:5 doi: 10.48130/SSE-2023-0005 

Topsoil microbial biomass carbon pool and the microbial quotient under distinct land-use types across China: A data synthesis
- Received: 06 January 2023
- Accepted: 25 May 2023
- Published online: 21 June 2023
Abstract: The status of soil microbiome has become global concern for earth sustainability. The pool size of microbial biomass carbon (MBC) provides a basic tool to generally assess the soil microbes related to soil health in global terrestrial ecosystems. Albeit, the variation of topsoil MBC pool remains largely uncertain with land use patterns across China. In this study, data of topsoil (0−20 cm) MBC measurements were retrieved from 468 observations published in Chinese journals from 2000−2022. With linking to soil organic carbon, microbial quotient (MQ) was calculated as a portion of MBC content as a percentage of SOC content. Meta-analysis showed that, on average, topsoil MBC pool was the greatest (470.8 mg·kg−1) for forest land but the lowest (179.9 mg·kg−1) for dry croplands. MQ was higher (2.7%) for rice paddies with waterlogged conditions than for other land use types (2.0% on average). Integrating the values from all land use patterns, mean MBC pool of China’s topsoil was quantified as 323.2−384.3 mg·kg−1 while MQ as 1.7%−2.3%, at 95% confidence. Upscaling with the area data of the land use types allowed a prediction of an overall MBC pool of China’s topsoil of 635.8 Tg C (in a range of 614.4−657.1 Tg C). MQ was on average of 2.1% for whole China's topsoil, being prominently higher than the reported global mean of 1.2%. Furthermore, topsoil MBC contents exerted a wide variation (CV of 40%) while MQ showed a much narrow variation (CV of 19%) with land use types across mainland China. The MBC pool was affected significantly by edaphic factors related to organic matter status such as SOC, total N, C/N ratio and bulk density. For environmental drivers, however, MBC was significantly, but less strongly impacted with mean annual precipitation while MQ significantly but slightly influenced with mean annual temperature. The former could be generally ascribed to soil-resource dependent ecosystem productivity though the latter could be related to temperature-sensitive of organic carbon decomposition and microbial carbon assimilation through SOC turnover in soil. To predict a topsoil MBC pool, a statistical linear model was developed with three key edaphic attributes of bulk density, organic carbon and total nitrogen plus one climate attribute of mean annual precipitation, which had an explanatory of 48% of the total variance for soils with varying land conditions. Our study highlights the importance of integrating soil microbial biomass carbon pool into global biogeochemical models of carbon cycles with strong reference to microbial community structure and activity across hierarchical scales.
-
Key words:
- Microbial biomass pool /
- Topsoil /
- Organic carbon /
- Microbial quotient /
- Land use /
- Rice paddy