-
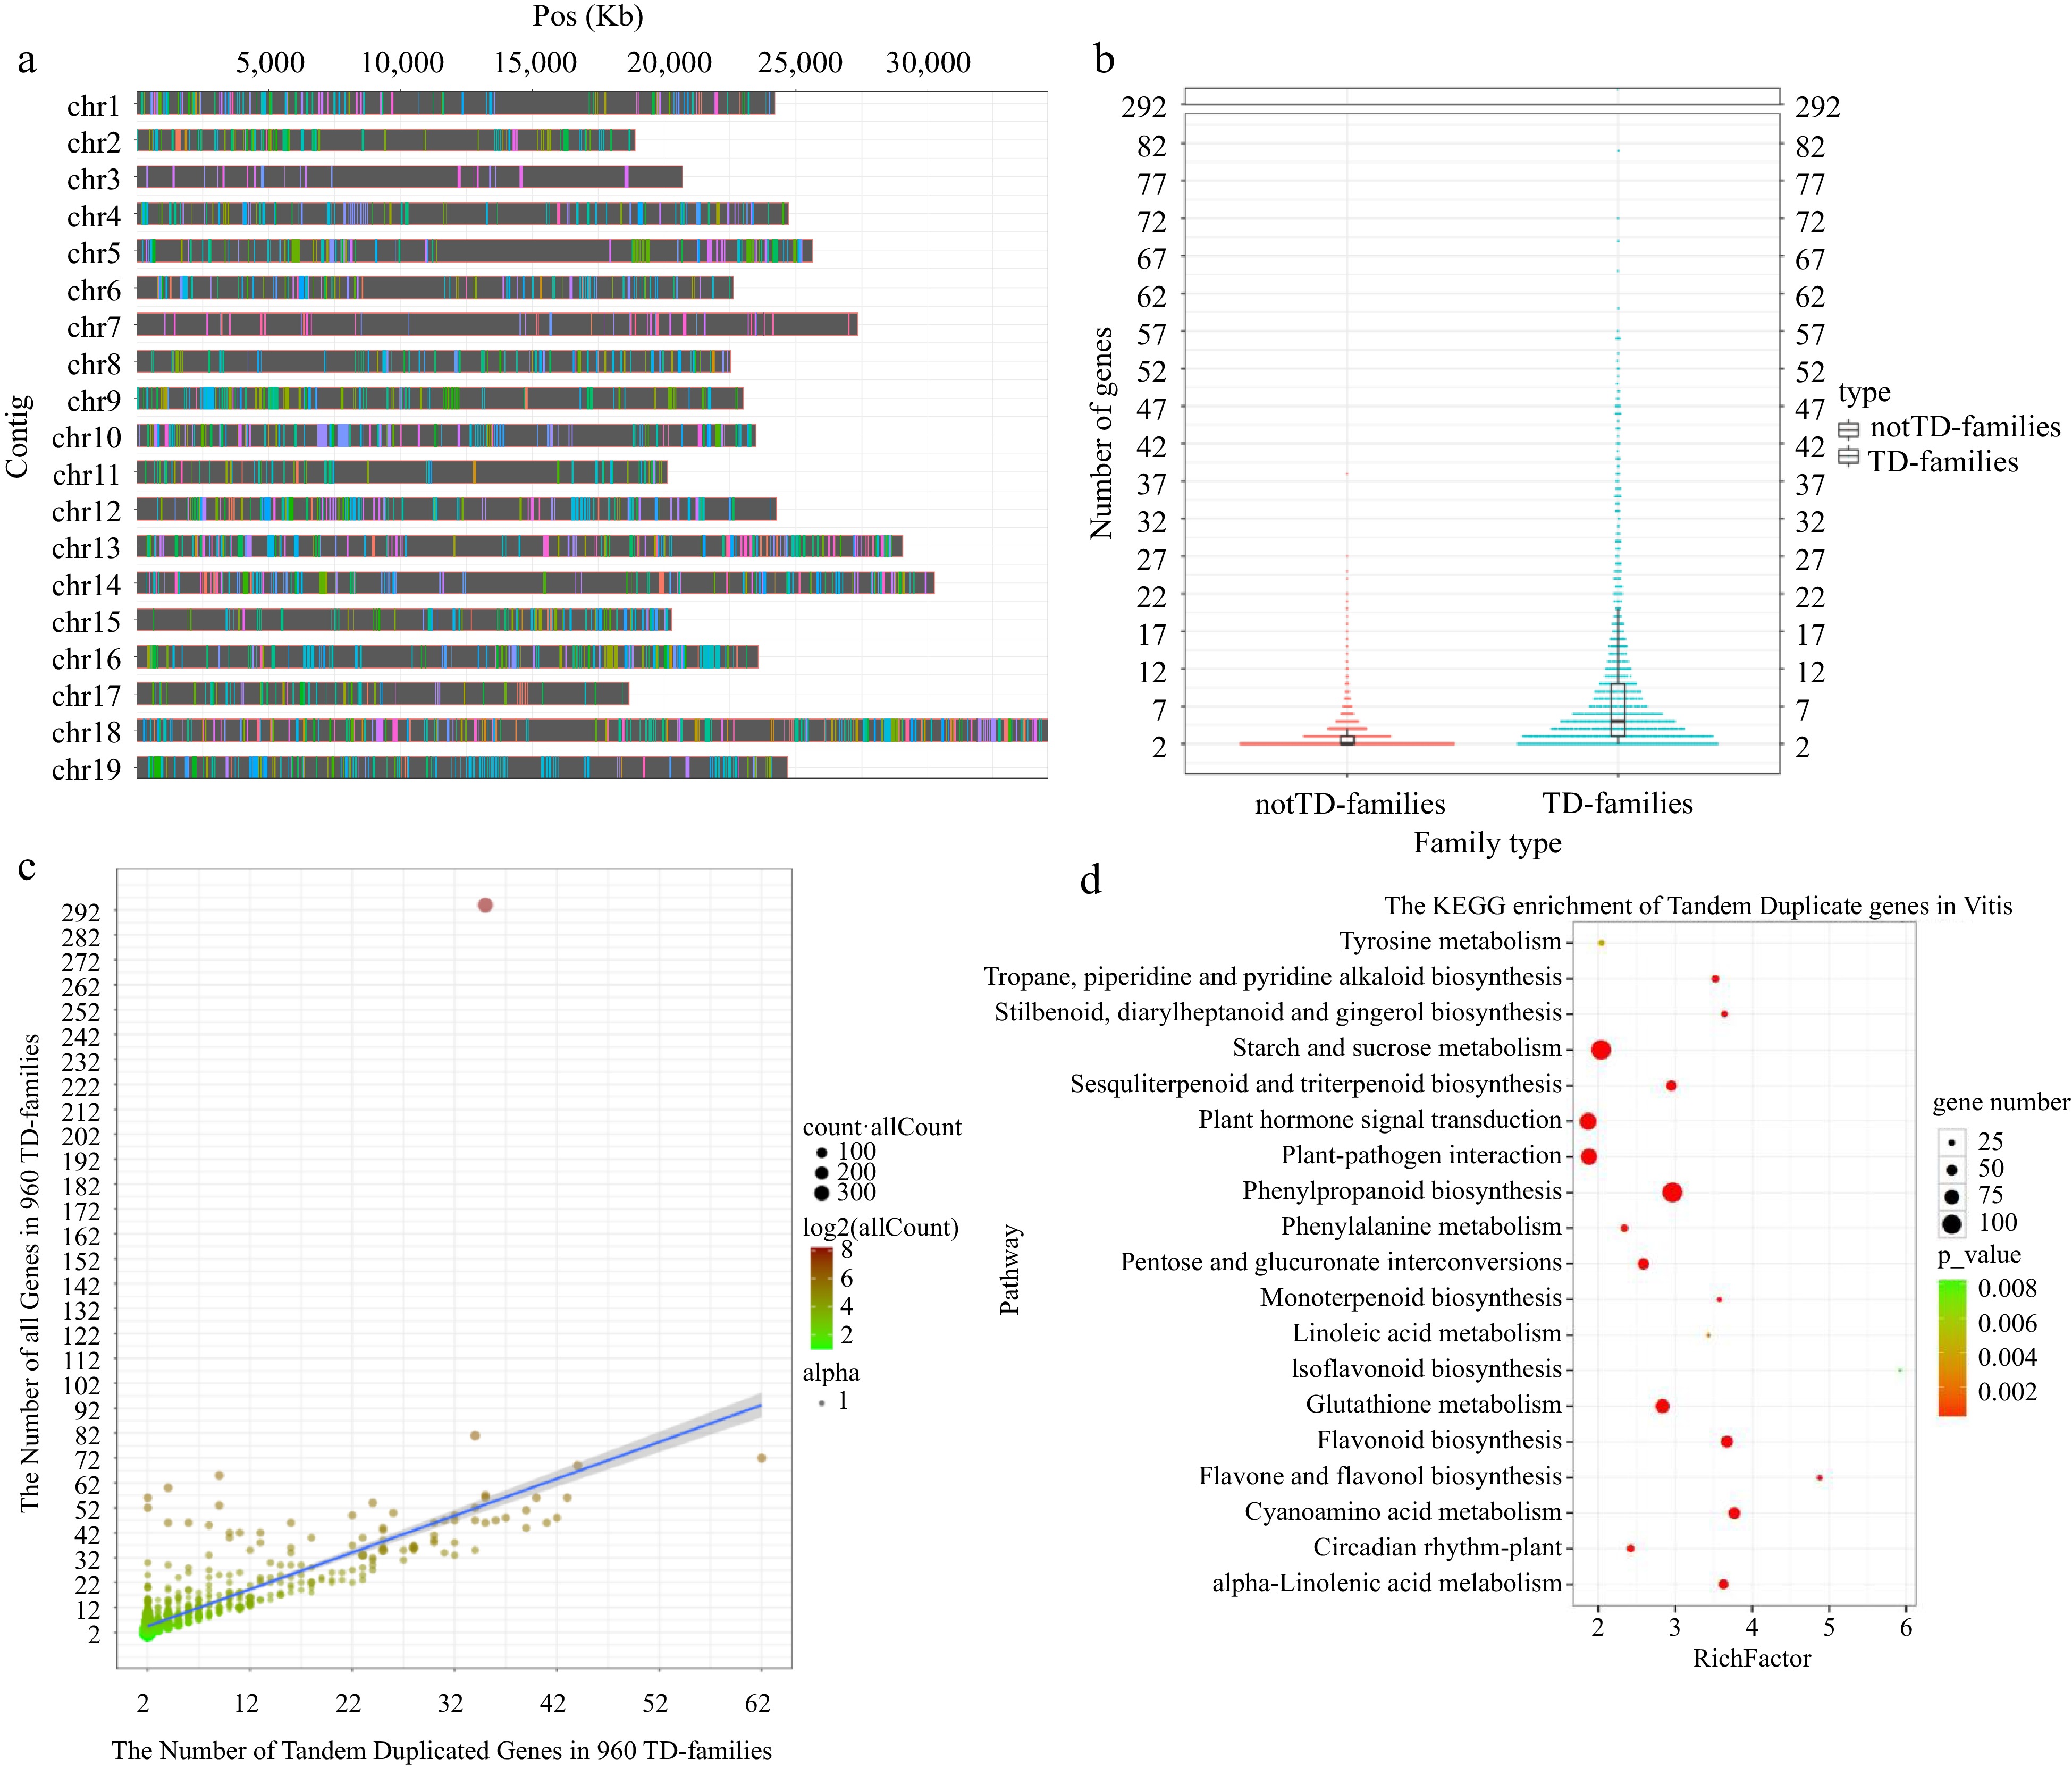
Figure 1.
Distribution of TD genes and their evolutionary impact on V. vinifera genome. (a) Distribution of TD genes on 19 chromosomes. The same color on the same chromosome represents TD genes from the same family. (b) Harp illustration of gene numbers between multi-copy notTD-families and TD-families. (c) The linear regression analysis between the total number of genes and the number of TD genes in 960 TD-families (y = 1.48018x + 1.50766, R2 = 0.5423, p = 5.75 × 10−165). The X-axes and Y-axes represent the number of tandem duplicated genes and all genes in 960 TD-families, respectively. The color depth of the circles is consistent with the total number of genes in the corresponding family. The size of the circle is consistent with the total number of genes in all corresponding families. (d) Scatterplot of KEGG enrichment for 5,341 TD genes (p < 0.01).
-
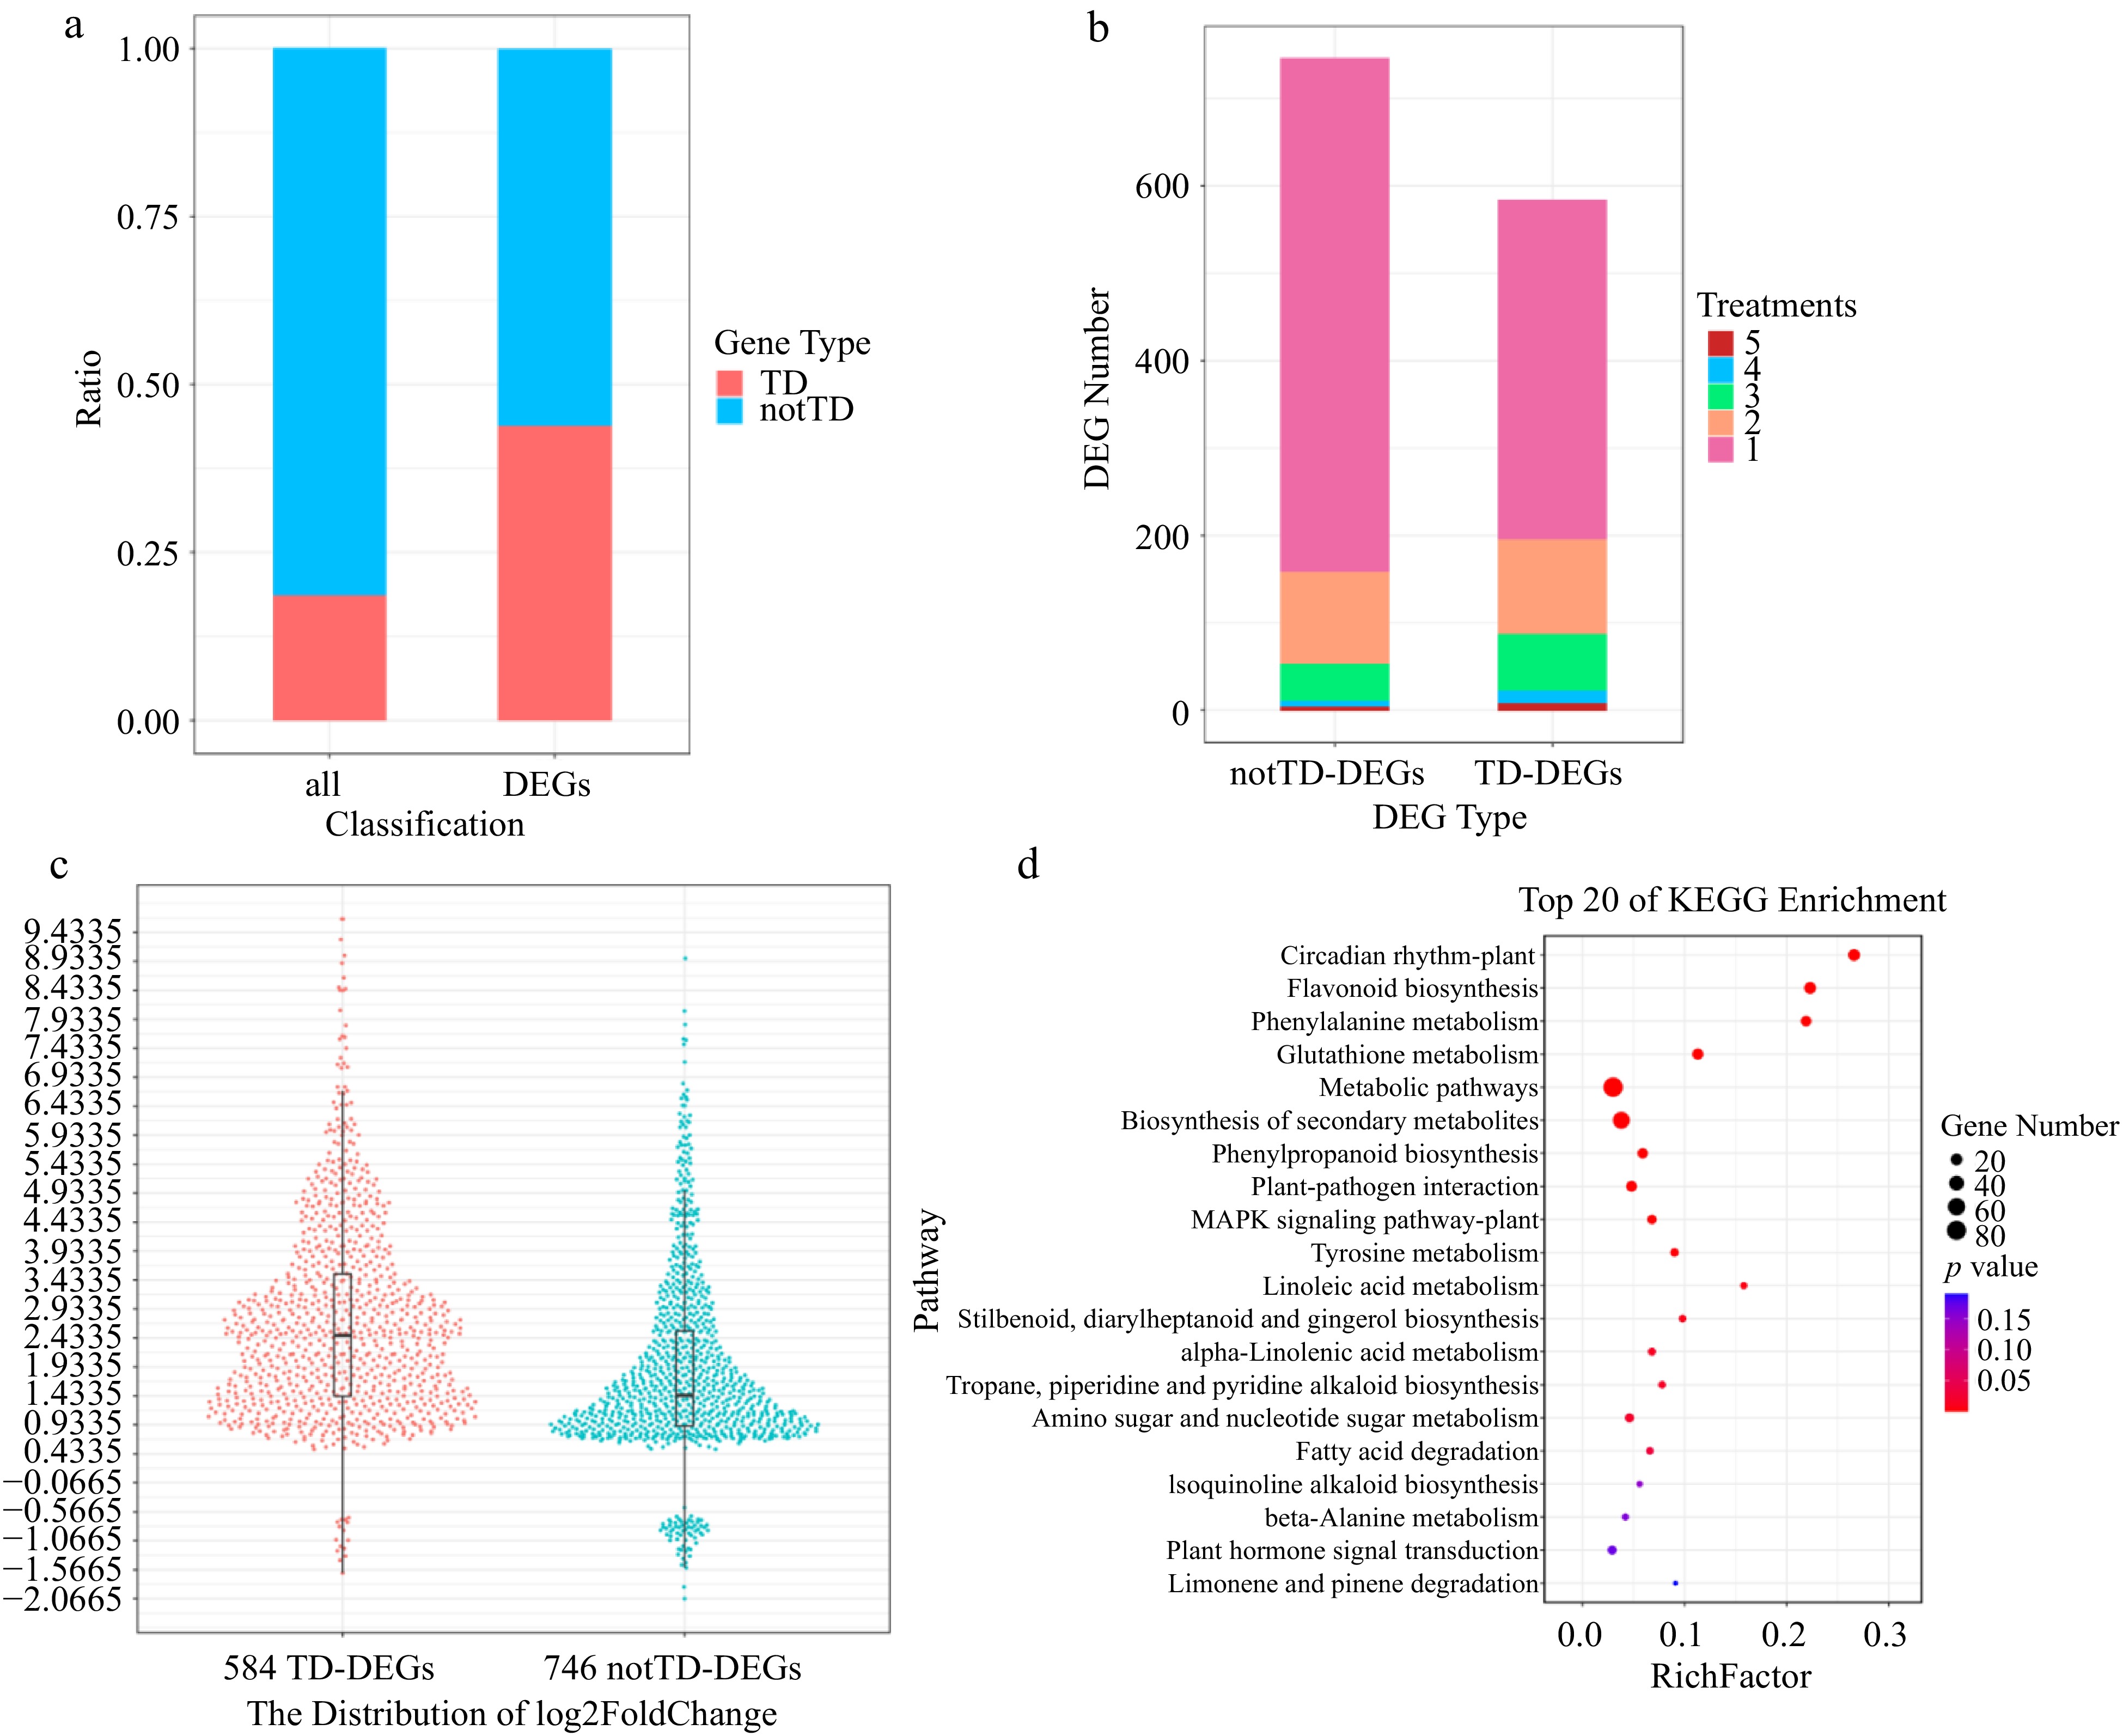
Figure 2.
Expression signature of TD genes. (a) Distribution of TD genes and notTD genes among all genes and DEGs, respectively by proportion. (b) Statistics on the number of notTD-DEGs and TD-DEGs distributed in different number of treatments by quantity. (c) Harp illustration of log2foldChange (DM vs Mock) for TD-DEGs and notTD-DEGs. (d) Scatterplot of KEGG enrichment for TD-DEGs.
-
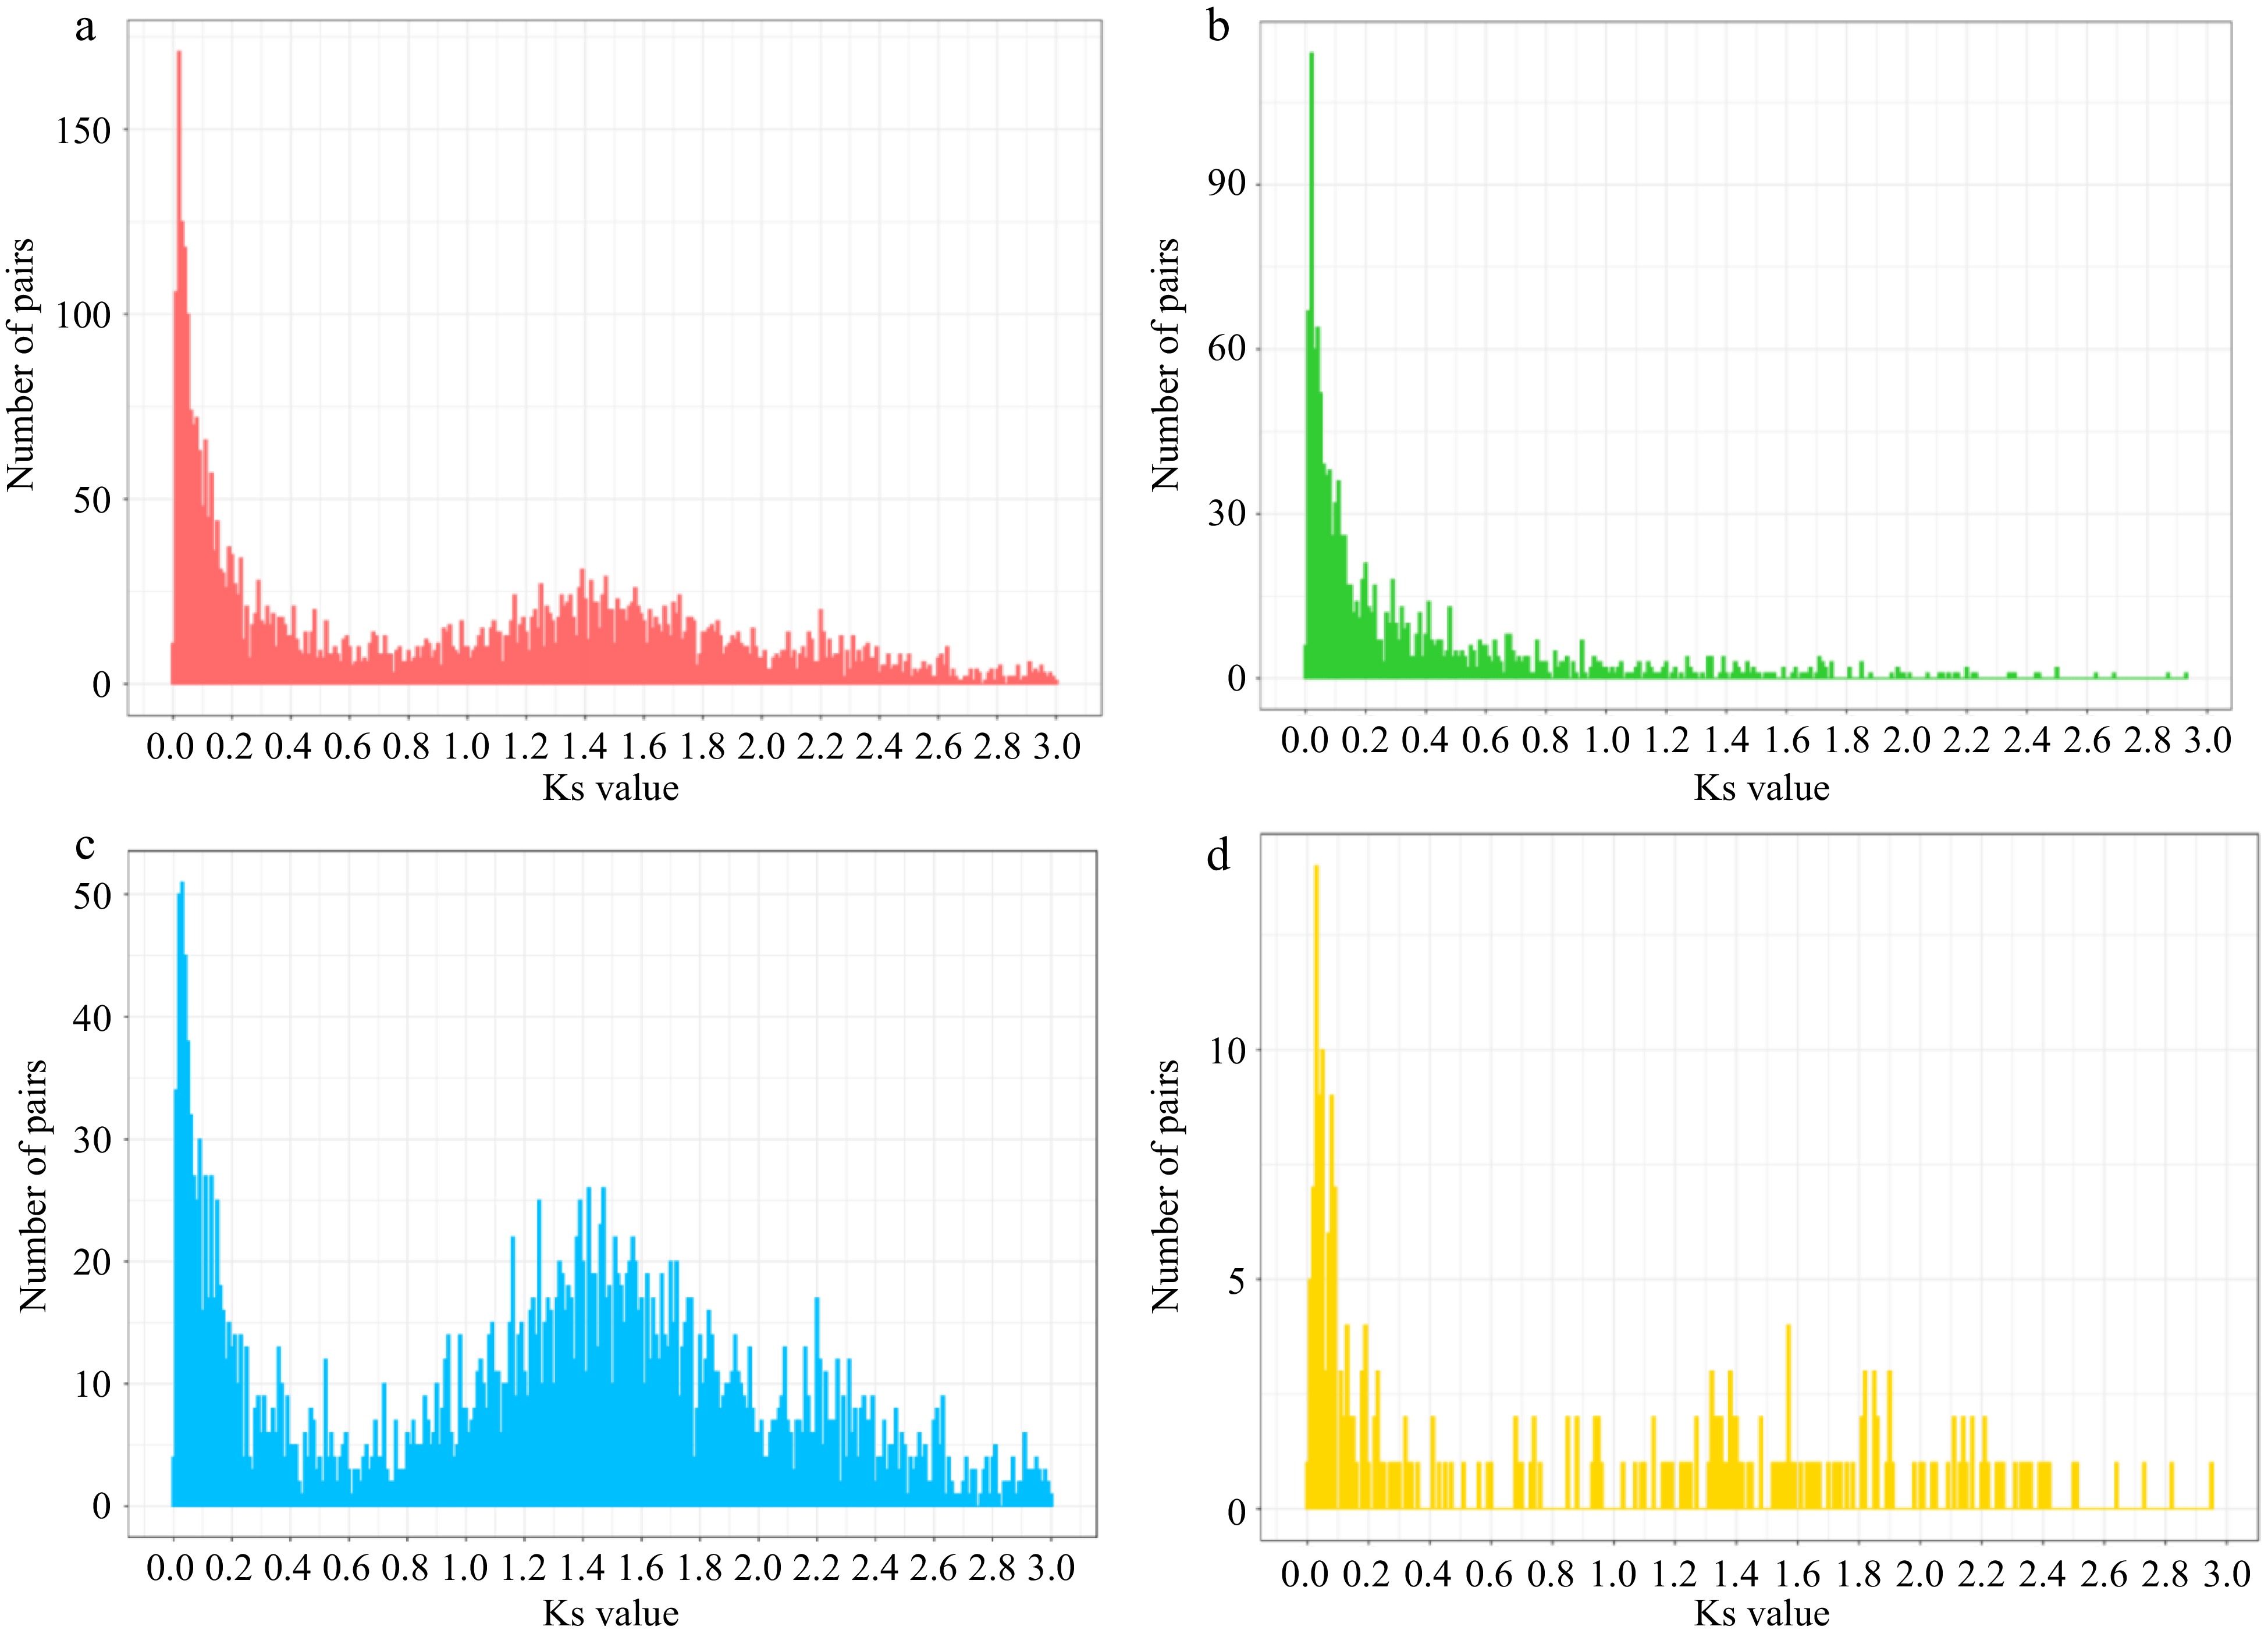
Figure 3.
The ks distribution of RBH pairs. (a) All pairs. (b) Both TD pairs. (c) BothNotTD pairs. (d) TD notTD pairs.
-
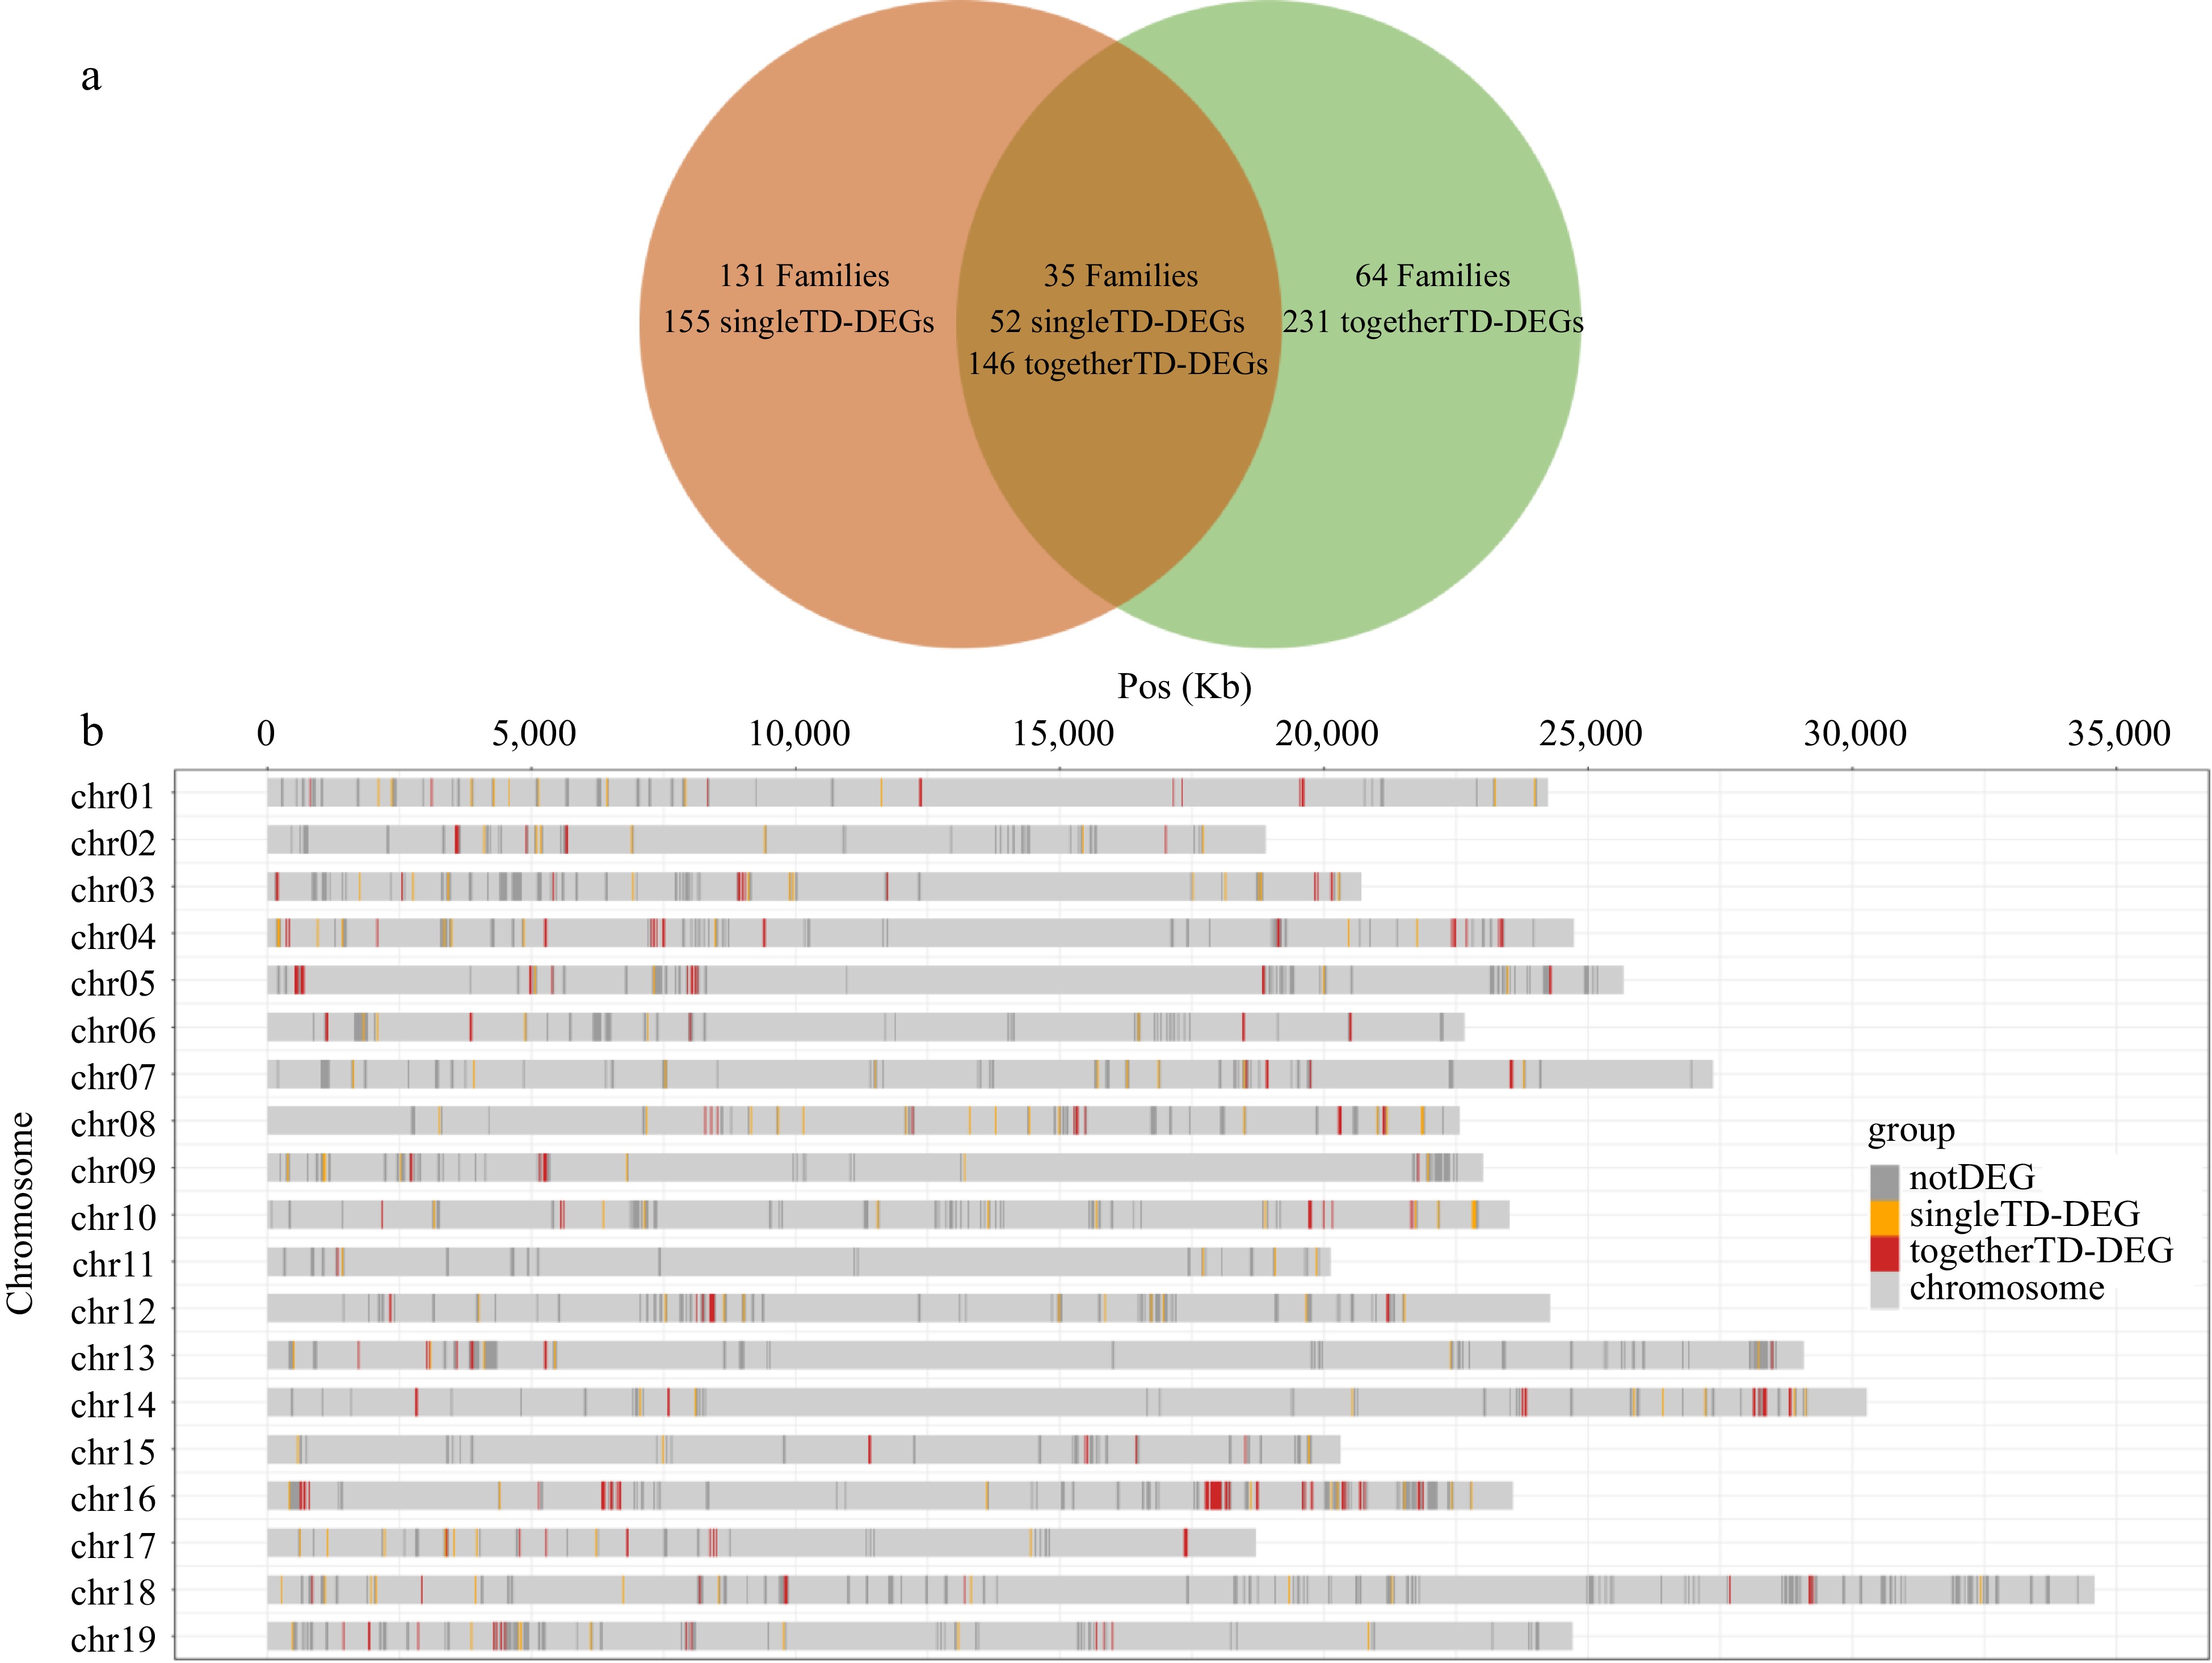
Figure 4.
The distribution of different type DEGs. (a) Venn diagram of family distribution of 377 togetherTD-DEGs and 207 singleTD-DEGs. Families are shown in bold font. The numbers of singleTD-DEGs and togetherTD-DEGs contained in the corresponding families are directly below. (b) The chromosomal distribution of 2,407 TD genes in 230 gene families containing TD-DEGs. notDEGs, singleTD-DEGs, togetherTD-DEGs are displayed separately.
-
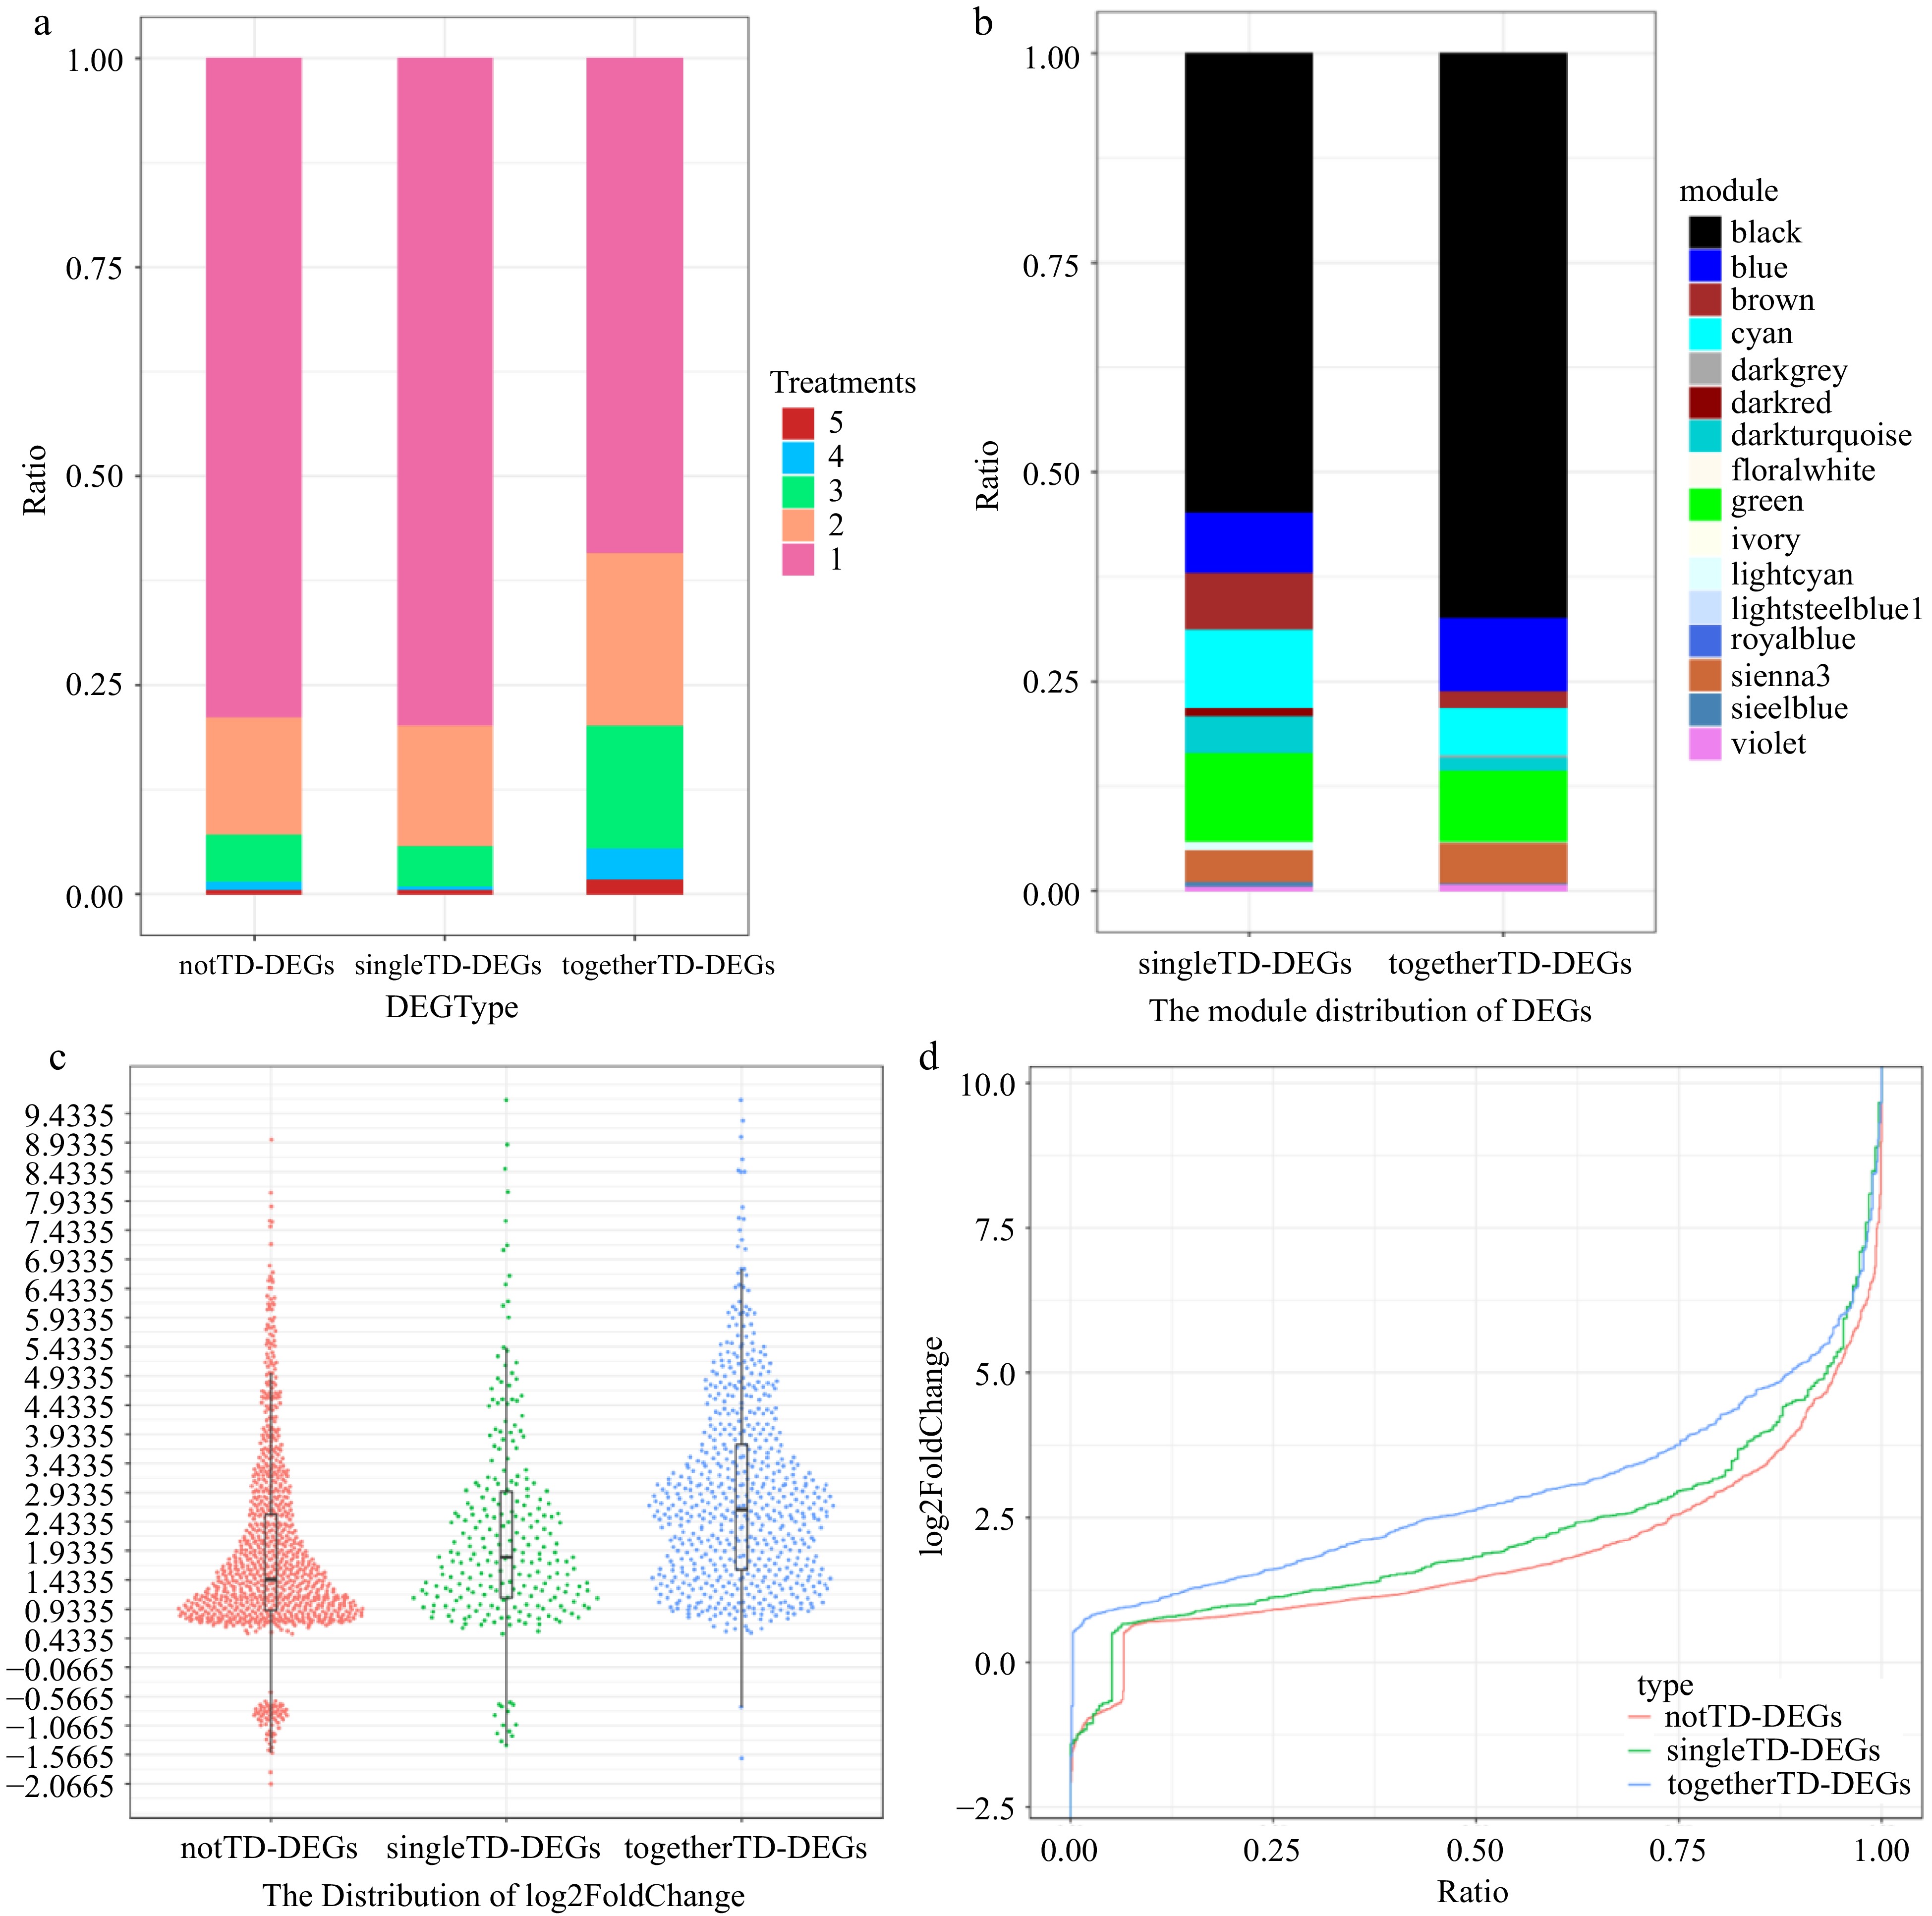
Figure 5.
Expression signature of togetherTD-DEGs. (a) Statistics on the number of notTD-DEGs, singleTD-DEGs and togetherTD-DEGs distributed in different number of treatments by proportion. (b) Modules distribution of singleTD-DEGs and togetherTD-DEGs of WGCNA analysis by proportion. (c) Harp illustration of log2foldChange for notTD-DEGs, singleTD-DEGs and togetherTD-DEGs. (d) Overall distributions of log2foldChange for notTD-DEGs, singleTD-DEGs and togetherTD-DEGs.
-
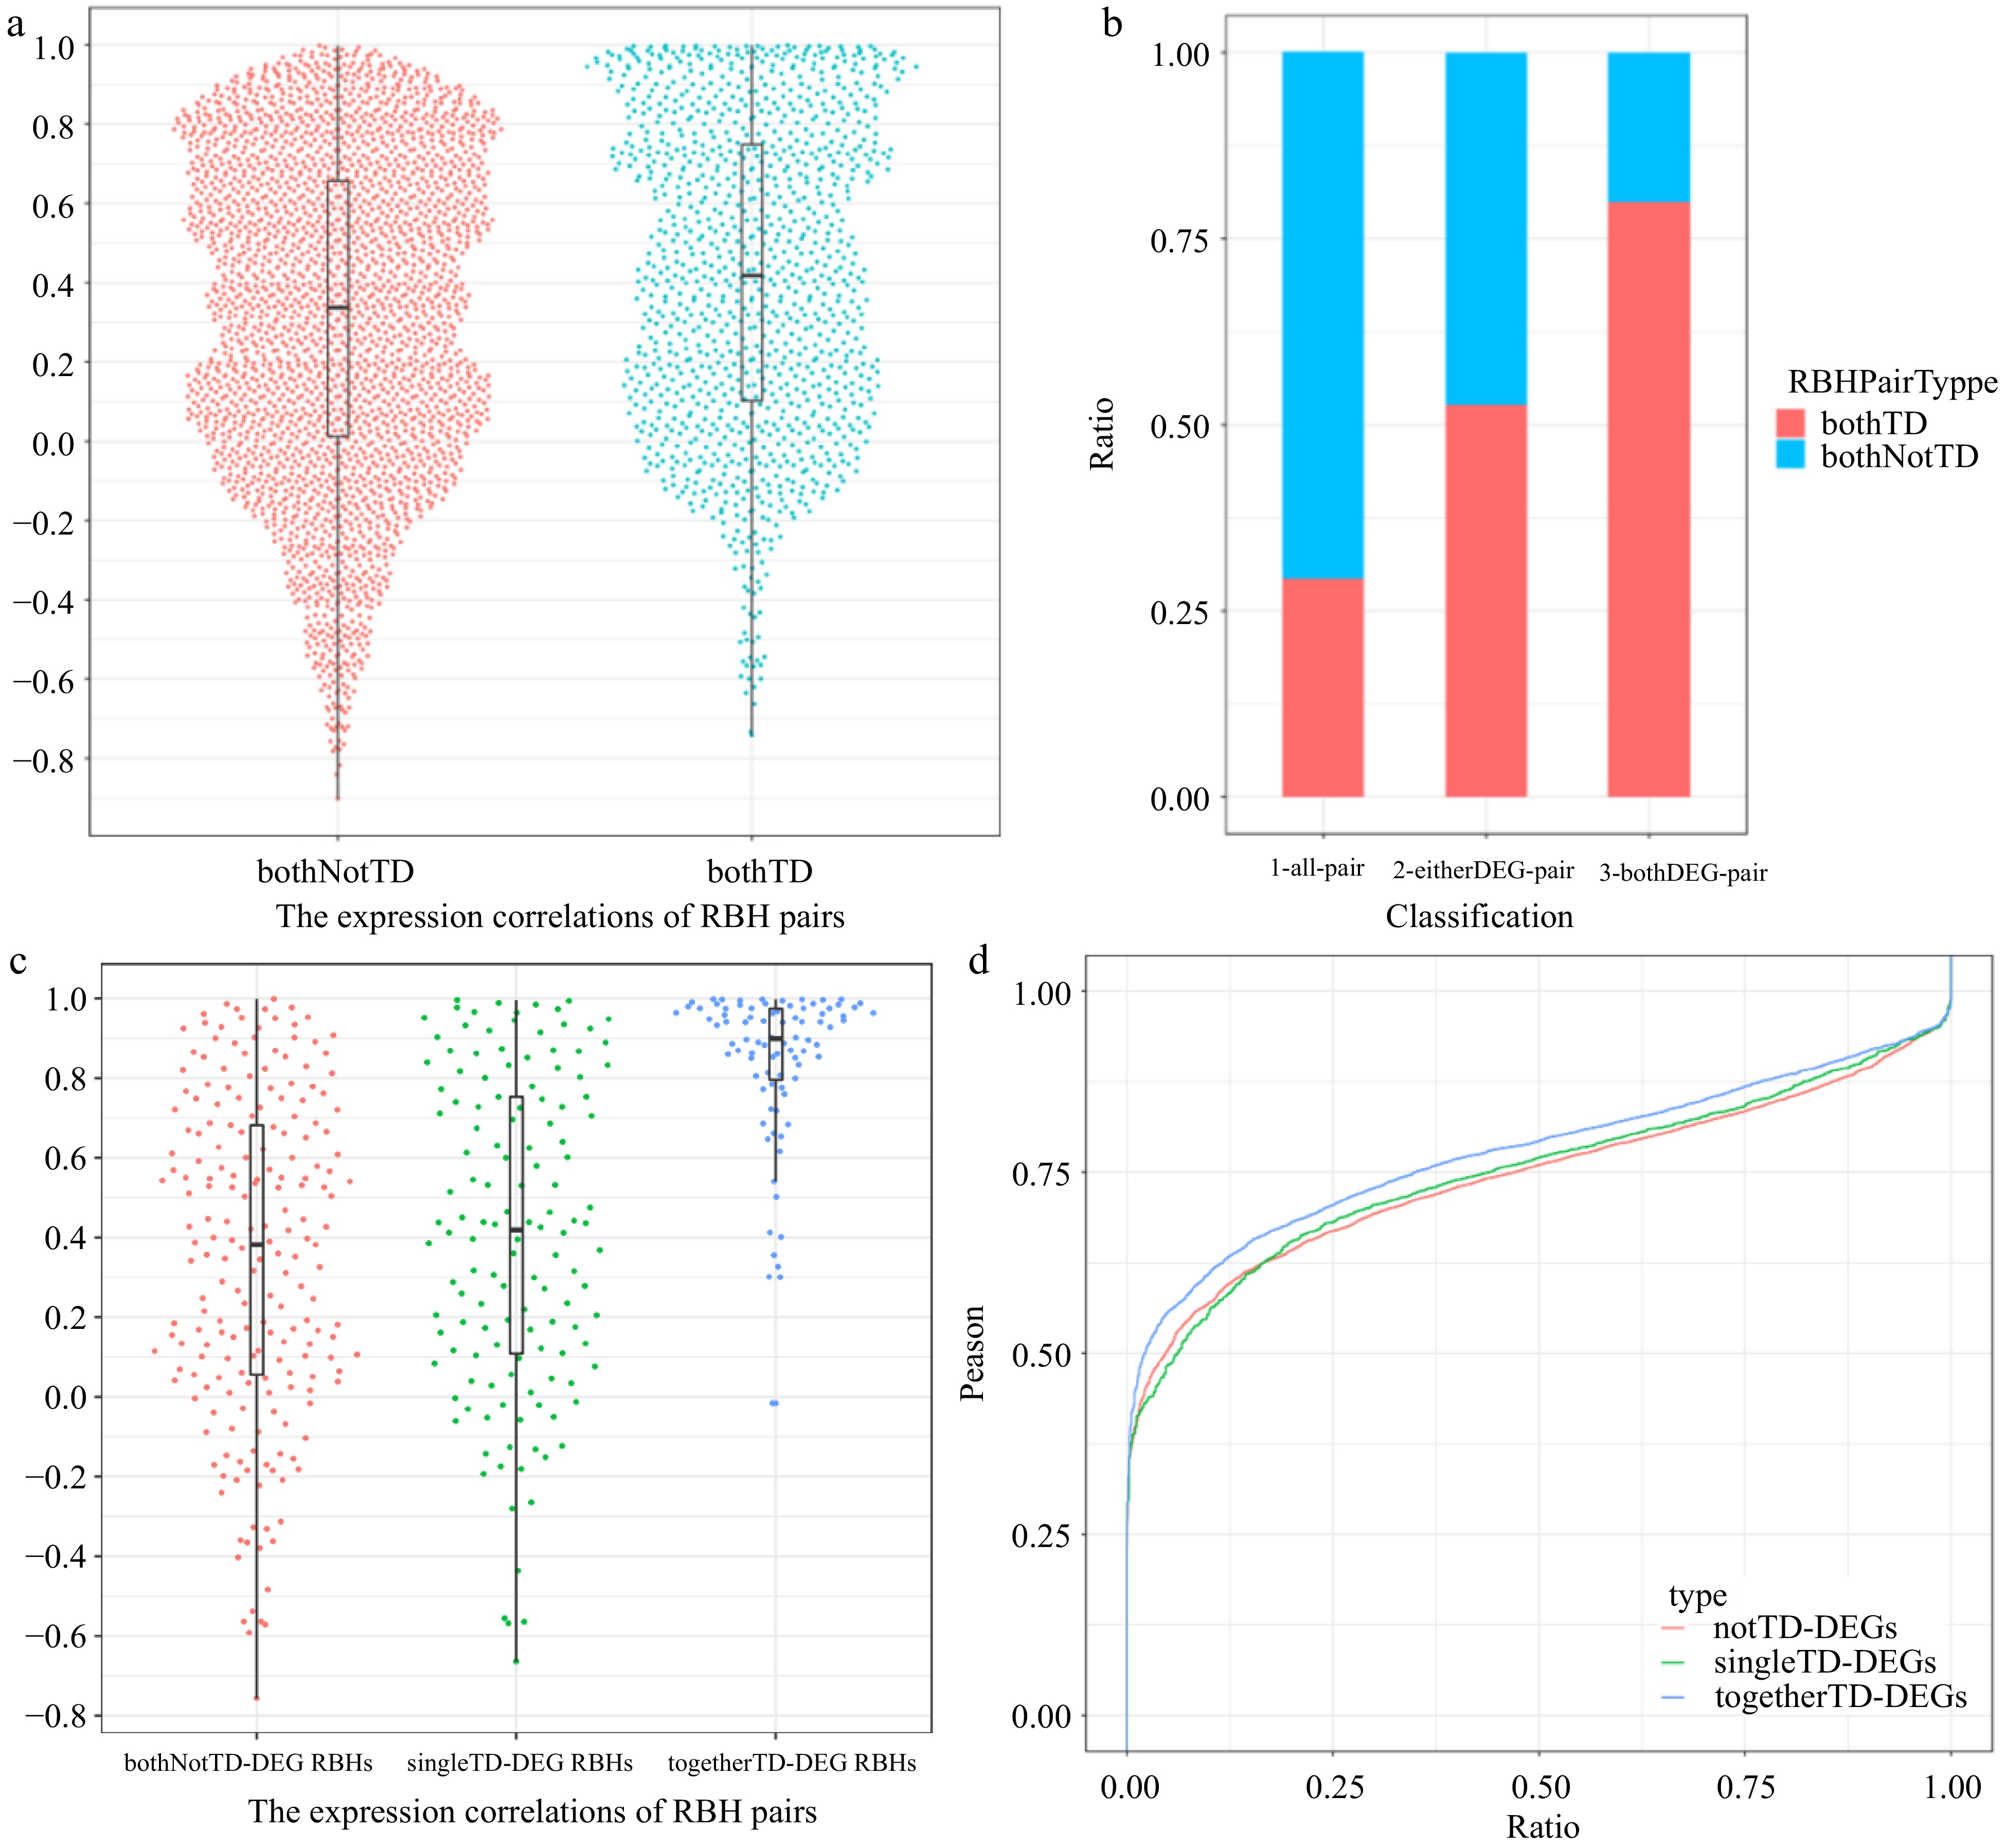
Figure 6.
Expression properties of different type RBH pairs. (a) Harp illustration of expression correlations between bothTD pairs and bothNotTD pairs, respectively. (b) Proportion of bothTD and bothnotTD RBH pairs among all pairs, pairs containing at least one DEG and pairs whose two genes are both DEGs, respectively. (c) Harp illustration of expression correlations among bothNotTD-DEG RBH pairs, singleTD-DEG RBH pairs and togetherTD-DEGs RBH pairs, respectively. (d) Overall distributions of expression correlations between differentially expressed WRKY transcription factors and NotTD-DEGs, singleTD-DEGs, togetherTD-DEGs containing WRKY TFBSs in black module, respectively.
-
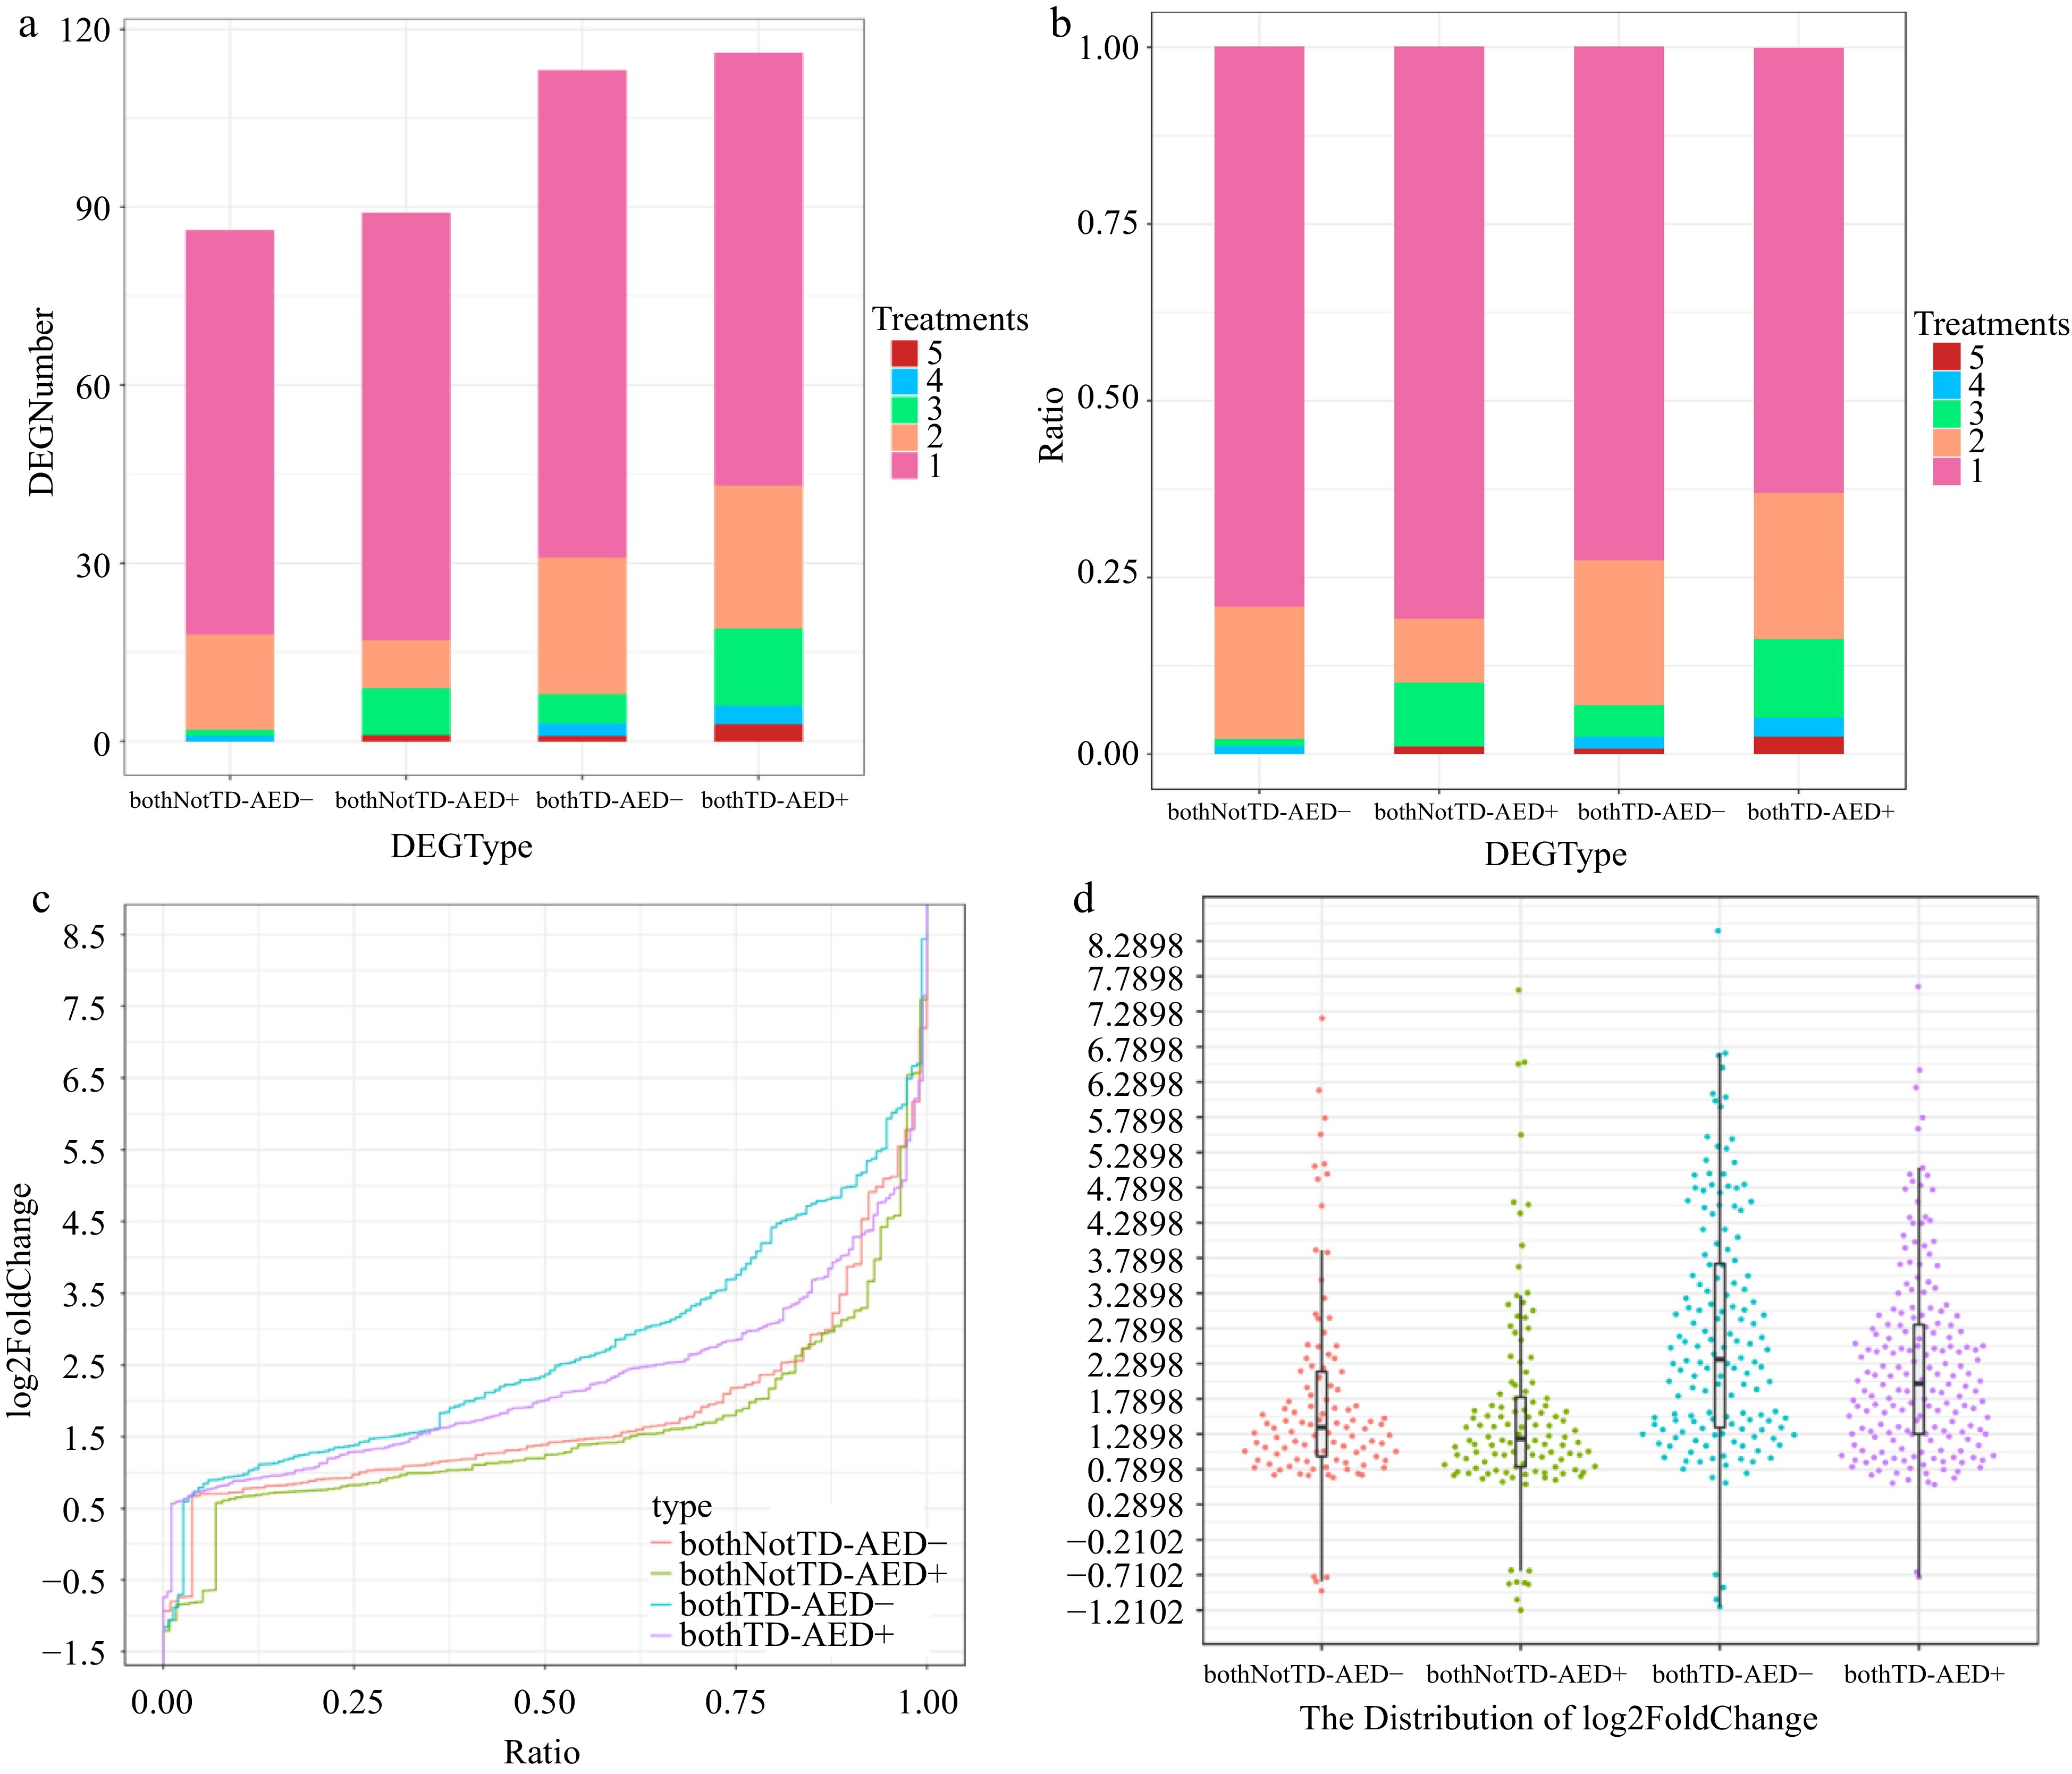
Figure 7.
Expression properties of DEGs in AED gene pairs. Distribution of various types of DEGs across different numbers of treatments. (a) By quantity. (b) By proportion. (c) Harp illustration of log2foldChange for various types of DEGs. (d) Overall distributions of log2foldChange for various types of DEGs. bothNotTD-AED-, differentially expressed AED- genes in bothNotTD pairs; bothNotTD-AED+, differentially expressed AED+ genes in bothNotTD pairs; bothTD-AED-, differentially expressed AED- genes in bothTD pairs; bothTD-AED+, differentially expressed AED+ genes in bothTD pairs.
-
K number Annotation All count TD genes Ratio (%) phenylpropanoid biosynthesis (map00940) K00083 CAD; cinnamyl-alcohol dehydrogenase [EC:1.1.1.195] 23 11 47.83 K00430 peroxidase [EC:1.11.1.7] 82 36 43.90 K00588 caffeoyl-CoA O-methyltransferase [EC:2.1.1.104] 5 2 40.00 K01188 beta-glucosidase [EC:3.2.1.21] 33 27 81.82 K01904 4CL; 4-coumarate--CoA ligase [EC:6.2.1.12] 7 2 28.57 K05349 bglX; beta-glucosidase [EC:3.2.1.21] 8 4 50.00 K05350 bglB; beta-glucosidase [EC:3.2.1.21] 5 2 40.00 K06892 F6H; feruloyl-CoA 6-hydroxylase [EC:1.14.11.61] 2 2 100.00 K10775 PAL; phenylalanine ammonia-lyase [EC:4.3.1.24] 19 11 57.89 K11188 PRDX6; peroxiredoxin 6 [EC:1.11.1.7 1.11.1.27 3.1.1.-] 3 2 66.67 K13065 HCT; shikimate O-hydroxycinnamoyltransferase [EC:2.3.1.133] 7 3 42.86 K13066 COMT; caffeic acid 3-O-methyltransferase [EC:2.1.1.68] 13 4 30.77 flavonoid biosynthesis (map00941) K00588 caffeoyl-CoA O-methyltransferase [EC:2.1.1.104] 5 2 40.00 K00660 CHS; chalcone synthase [EC:2.3.1.74] 43 31 72.09 K05278 FLS; flavonol synthase [EC:1.14.20.6] 4 4 100.00 K05280 CYP75B1; flavonoid 3'-monooxygenase [EC:1.14.14.82] 2 2 100.00 K13065 HCT; shikimate O-hydroxycinnamoyltransferase [EC:2.3.1.133] 7 3 42.86 K13082 DFR; bifunctional dihydroflavonol 4-reductase/flavanone 4-reductase [EC:1.1.1.219 1.1.1.234] 6 3 50.00 K13083 CYP75A; flavonoid 3',5'-hydroxylase [EC:1.14.14.81] 15 12 80.00 Table 1.
The overview of TD genes significantly enriched in metabolic pathways associated with flavor and biotic stress.
Figures
(7)
Tables
(1)