


-
Gene duplication is the main mechanism by which new genes and, ultimately, new biological functions are generated, which is very important for plant evolution and adaptation[1,2]. In addition to whole genome duplication (WGD), the two other major gene duplication mechanisms are segmental duplication and retrotransposition[3,4].
Unequal crossing-over between homologous chromosomes is a very important way to generate segmental duplication[5], resulting in gene clusters and multiple tandem duplicated (TD) genes belonging to the same gene family[6,7]. Based on the publication, in recent years, of a large number of plant genomes, it has become clear that many important functional genes exist in plant genomes in the form of homologous gene clusters[8−10]. Increasing evidence has suggested that gene expansion caused by tandem duplication (TD) may contribute to environmental adaptation[11−13]. But at present, most of these discoveries on plant TD genes are aimed at specific traits, genes or metabolic pathways. There are few systematic studies on TD genes from the genome-wide level. Furthermore, how TD genes arise and evolve, and how they specifically participate in a corresponding pathway, in genome evolution and in species adaptation, is still unclear.
Transposable elements (TEs) are an important component of the plant genome[14−16], which can affect gene expression by providing novel promoters or regulatory regions[17]. The epigenetic profile of the TEs can also alter gene expression[18]. Long terminal repeat retrotransposons (LTR-RTs) are the most prevalent TEs in plant genomes and the major force driving the evolution of animals, fungi and especially plants[19]. The proliferation of LTR-RTs could result in genome bloating[20], leading to the replication of new interspersed retrogenes by means of retroduplication[21−23]. At the same time, as a type of repeat sequence, its insertion can also increase the frequency of unequal exchange in surrounding genomic regions[24,25]. However, there is still a lack of direct evidence in plant genomes that LTR amplification is associated with unequal crossing-over, as well as TD gene amplification.
Plants experience various biotic stresses throughout their life cycle and many different types of genes respond to these stresses by differential changes in expression[26]. Numerous studies focus on this topic have discovered a variety of important functional genes which are of great significance to plant stress resistance breeding[27−30]. However, the vast majority of important functional genes are not present as single-copy genes in the genome. In the long evolutionary history of plants, in order to better adapt to the environment, a large number of multi-copy gene families related to various stress responses have arisen through different gene replication mechanisms[16,31,32]. Unfortunately, few studies have focused on whether these various types of paralogous genes, with similar sequences and functions, which have been generated by different duplication mechanisms are all induced in response to a specific stress, or which kind of genes are more likely to be induced than others. Furthermore, compared with interspersed duplicated genes, TD genes are located closer to each other in the genome. Little attention has also been paid to whether this positional difference leads to different expression characteristics, especially in response to stress. This is important because whether a gene is of great significance to the environmental adaptation of a species, depends not only on whether it has an effective molecular function, but also on whether it can express efficiently at the right time to play its role. Therefore, answers to these questions are critical for precise phenotype prediction and efficient selection of target genes in future breeding efforts.
Grapevine (Vitis vinifera L.) is indisputably one of the most popular fruit crop species in the world. Previous studies have shown that V. vinifera and dicots shared the same whole genome duplication event (r-WGT)[33,34]. However, besides WGD, there is a lack of knowledge about other large-scale gene duplication events in V. vinifera and the mechanism underpinning these duplication events. In addition, nearly 50% of the grapevine genome is composed of repetitive/transposable elements (TEs)[33]. This provides a good model for studying the effects of TEs/LTRs on gene duplication and genome evolution. Here, taking V. vinifera as an example, our genome-wide scale studies have shown that recent large-scale tandem gene duplication mediated by LTRs promotes the expansion of specific gene families involved in response to biotic stress, biosynthesis of various secondary metabolites and adaptive evolution in V. vinifera. More importantly, TD genes with similar protein sequences and upstream regulatory sequences exhibit a position effect and a synergistic effect and multifaceted overactivity and play a pivotal role in response to biotic stress caused by downy mildew (P. viticola) and powdery mildew (E. necator), the two most important diseases of grapevines. However, the higher co-expression level of TD genes is not only reflected in the co-response to biotic stress, but also across various tissues and developmental stages. This may be due to higher levels of co-regulation such as histone modification and higher transcription factor (TF) regulatory efficiency. Moreover, a relative expression balance is maintained between TD genes, which may be beneficial to provide relatively reduced constraint for the retention and further functional evolution of TD genes.
-
Gene duplication produces paralogous genes with similar sequences and functions, resulting in multi-copy gene families[7]. Tandem duplicates are paralogous genes closely adjacent to each other in the same chromosome[10]. A total of 13,677 gene families were identified by using OrthoMCL to classify all 27,978 genes located on 19 chromosomes in the V. vinifera cv. PN40024 genome[33]. Next, paralogous genes from the same family and with no more than two other intervals in the genome were defined as TD genes[35]. A total of 5,341 TD genes were identified from 19 chromosomes, and the remaining 22,637 genes were classified as 'notTD genes'. We then defined gene families containing TD genes as 'TD-families' and gene families without TD genes as 'notTD-families'. This facilitates an efficient comparative analysis between tandem duplicated (TD) genes with interspersed duplicated genes from the same family. Our subsequent analysis found that the number of TD-families only accounted for 7.02% (960/13,677) of all gene families in the genome, but the number of TD genes in TD-families accounted for up to 19.09% (5,341/27,978) of the total number of genes in the genome. Most strikingly, TD genes accounted for up to 57.10% (5,341/9,353) of all genes in TD-families (Supplemental Table S1). Although they are distributed on all 19 chromosomes (Fig. 1a), most of the TD genes from the same family are present on the same chromosome as only one gene cluster (Supplemental Fig. S1). Furthermore, comparative analysis between TD-families and multi-copy notTD-families showed that the former contained significantly more genes (t test, p = 1.86 × 10−39; Fig. 1b). Moreover, linear regression analysis found that the total number of all genes in the TD-families was significantly positively correlated with the number of TD genes it contained in the corresponding family (Fig. 1c). Taken together, it is clear that tandem gene duplication plays a key role in the expansion of a small subset of specific gene families and largely determines the extent of expansion.
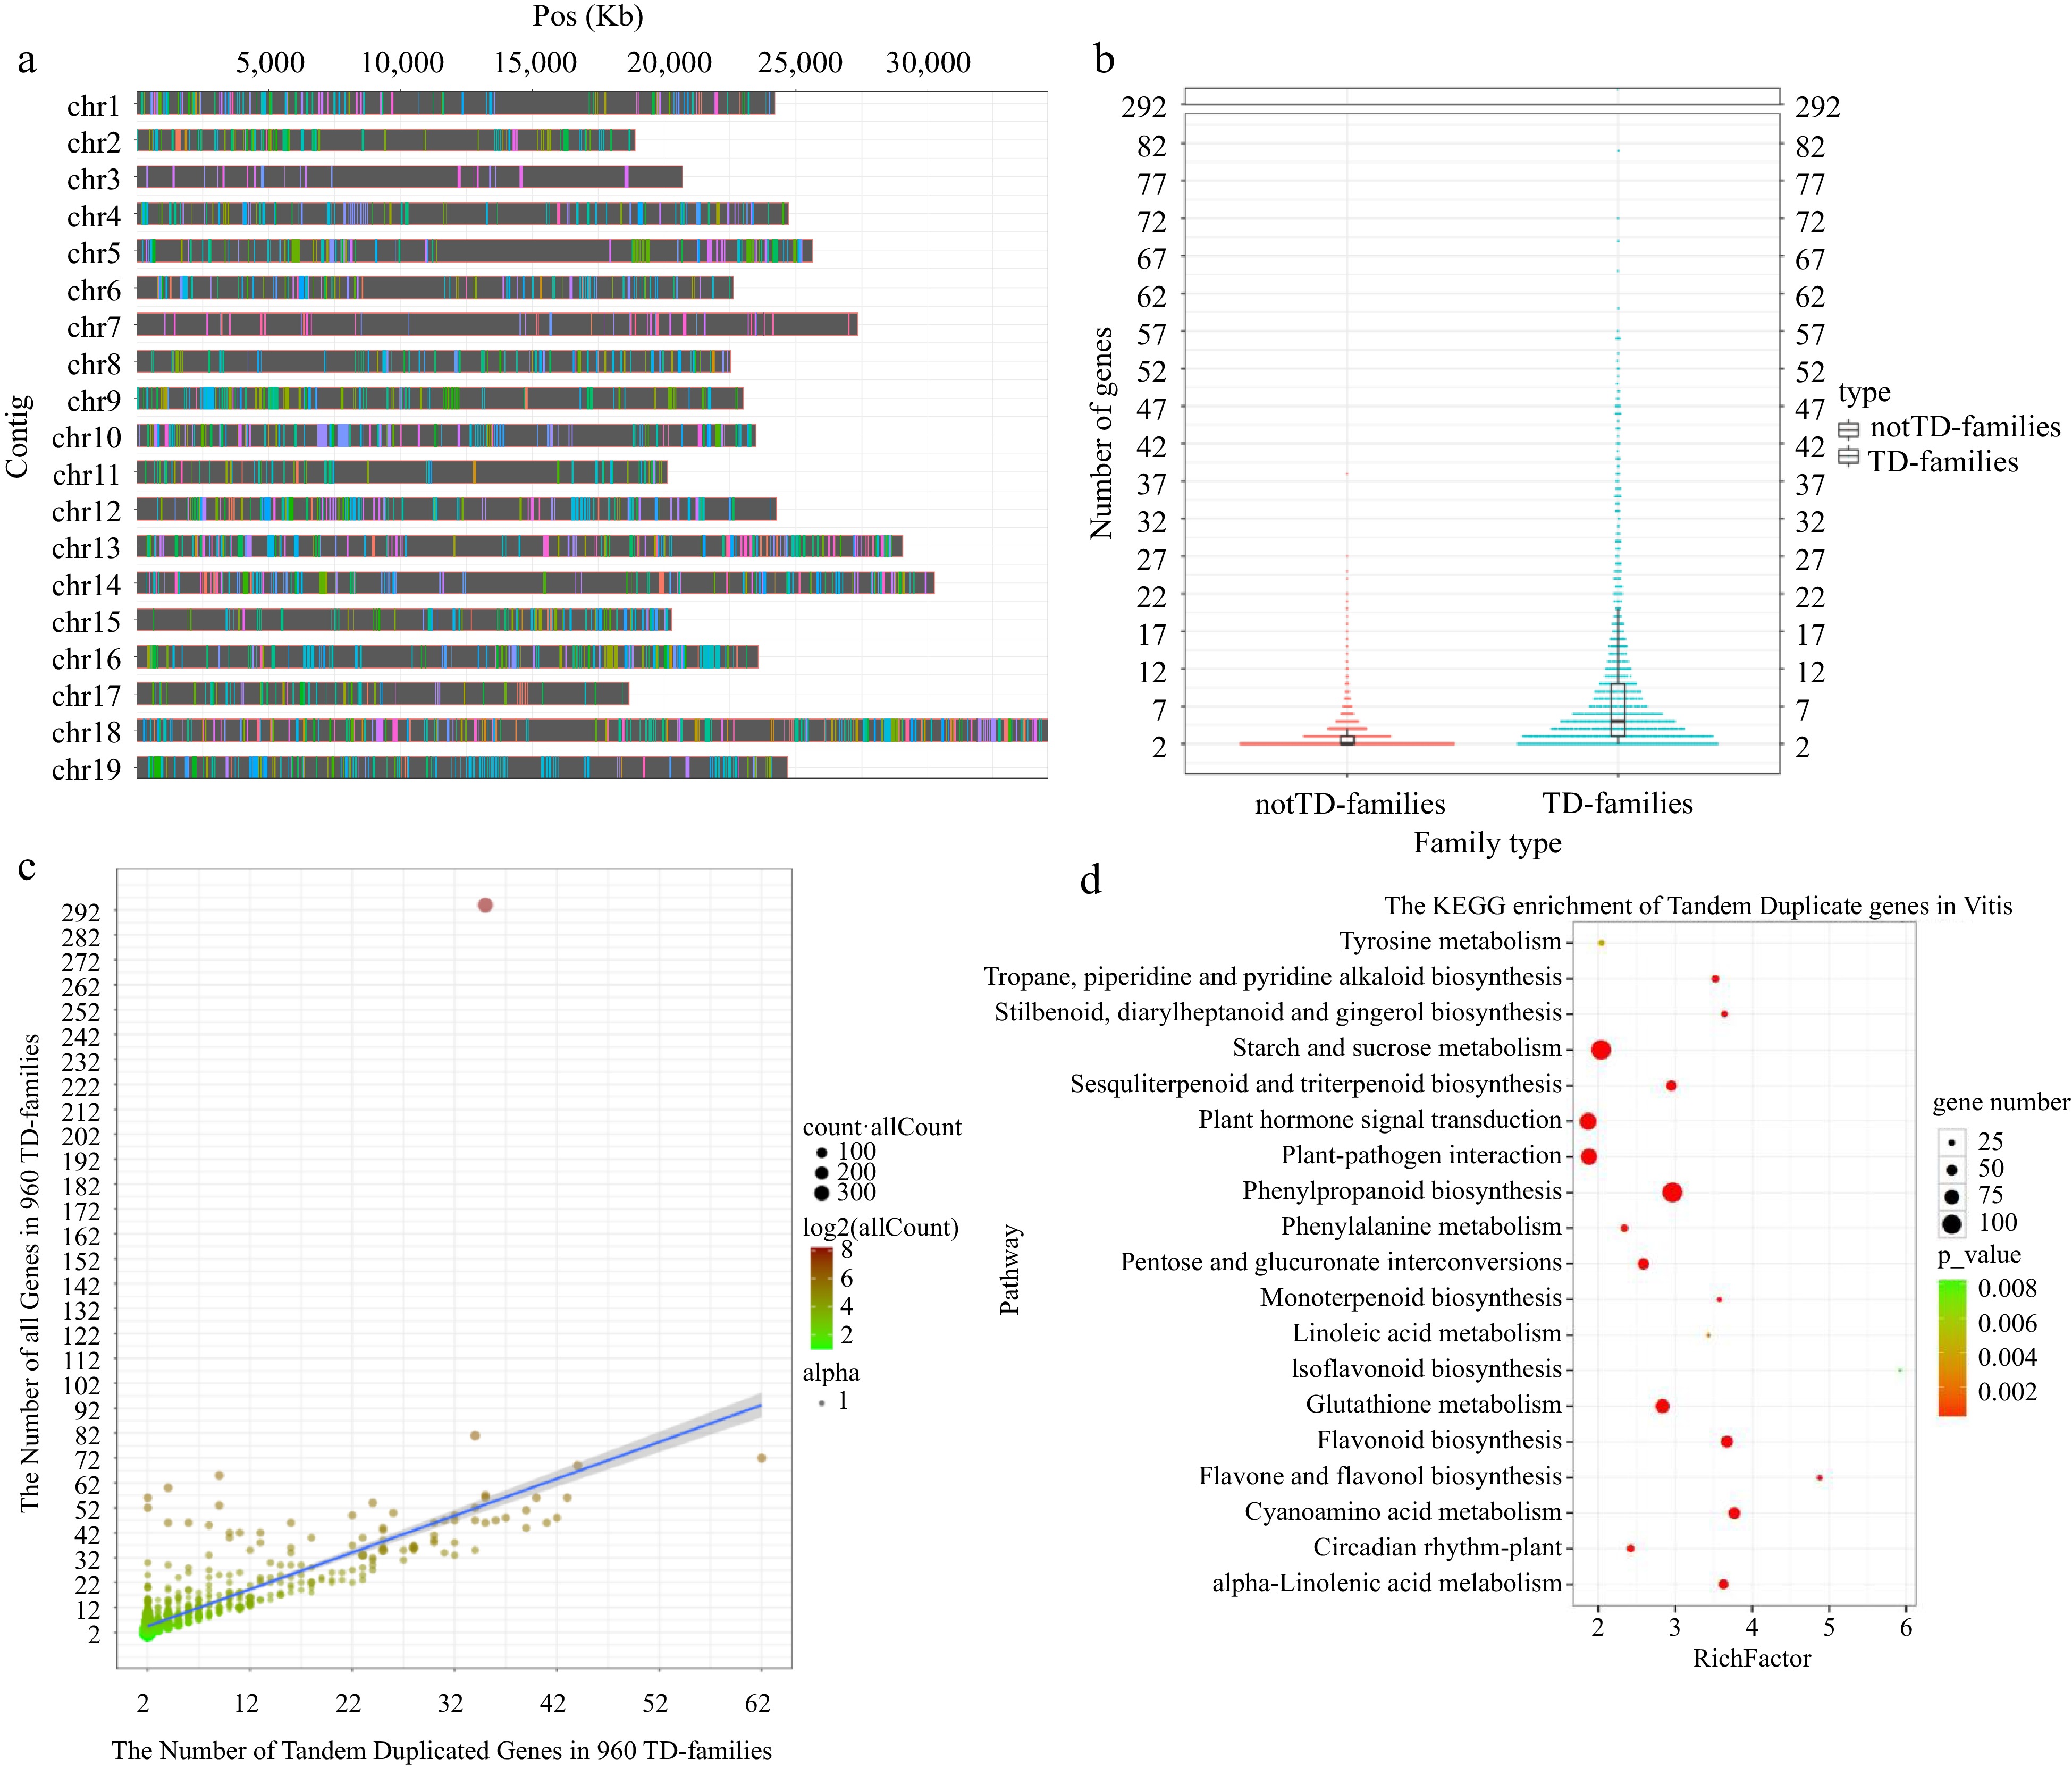
Figure 1.
Distribution of TD genes and their evolutionary impact on V. vinifera genome. (a) Distribution of TD genes on 19 chromosomes. The same color on the same chromosome represents TD genes from the same family. (b) Harp illustration of gene numbers between multi-copy notTD-families and TD-families. (c) The linear regression analysis between the total number of genes and the number of TD genes in 960 TD-families (y = 1.48018x + 1.50766, R2 = 0.5423, p = 5.75 × 10−165). The X-axes and Y-axes represent the number of tandem duplicated genes and all genes in 960 TD-families, respectively. The color depth of the circles is consistent with the total number of genes in the corresponding family. The size of the circle is consistent with the total number of genes in all corresponding families. (d) Scatterplot of KEGG enrichment for 5,341 TD genes (p < 0.01).
It is well known that secondary metabolites, such as terpenes and flavonoids, are responsible for the principal flavour and aroma compounds in grape fruit, wine and juice[36−38]. Additionally, decades of studies have revealed a large number of secondary metabolites with proven functions in plant responses to biotic stresses caused by pathogenic microorganisms or pests[39−41]. Kyoto Encyclopaedia of Genes and Genomes (KEGG) enrichment analysis showed that the 5,341 TD genes were significantly (p < 0.01) enriched in biosynthesis pathways of secondary metabolites including monoterpenoid biosynthesis (map00902); sesquiterpenoid and triterpenoid biosynthesis pathways (map00909); phenylpropanoid biosynthesis (map00940); flavonoid biosynthesis (map00941); isoflavonoid biosynthesis (map00943); flavone and flavonol biosynthesis (map00944); and stilbenoid, diarylheptanoid and gingerol biosynthesis (map00945); tropane, piperidine and pyridine alkaloid biosynthesis (map00960) (Fig. 1d & Table 1, Supplemental Table S2). All of these pathways are closely related to flavor and aroma compounds and/or plant defense to biotic stresses[27,29,36,42−47]. In particular, tandem gene duplications are present in many reaction steps in phenylpropanoid biosynthesis (map00940) and flavonoid biosynthesis (map00941) (Supplemental Figs S2, S3 & Table 1). Phenylpropanoid biosynthesis (map00940) provides precursors for numerous pathways related to biotic stress response or fruit flavor, such as ubiquinone and other terpenoid-quinone biosynthesis (map00130), flavonoid biosynthesis (map00941), stilbenoid, diarylheptanoid and gingerol biosynthesis (map00945)[48]. Phenylpropanoids are major players in plant immunity and contribute to all aspects of plant responses towards biotic and abiotic stimuli, which have been widely studied for their antimicrobial properties and their role in signalling during defence reactions[49,50]. Phenylalanine ammonia-lyase (PAL) catalyzes the first step of the phenylpropanoid pathway and produces precursors for a variety of important secondary metabolites, which is a key enzyme involved in plant defense against pathogens and insects[51,52]. The CYP75 gene family is composed of two subfamilies, i.e., CYP75A (flavonoid 3′,5′-hydroxylase, F3′5′H), CYP75A) and CYP75B (flavonoid 3′-hydroxylase, F3′H), which involves in the biosynthesis of the majority of plant secondary metabolites in adaptation to biotic and abiotic stress[53,54]. Chalcone synthase (CHS) is the first key enzyme in the flavonoid pathway, which catalyzes the stepwise condensation of three acetate moieties from malonyl-coenzyme A (CoA) with 4-coumaroyl-CoA to give 4', 2', 4', 6'-tetrahydroxy-chalcone[55]. Many studies have shown that overexpression of CHS genes can increase resistance to pests and pathogens[56−58]. Our further analysis showed that the vast majority of CYP75 genes and chalcone synthase genes in the flavonoid biosynthetic pathway (map00941) are tandem duplicated, while in phenylpropanoid biosynthesis pathway, there are a large number of tandem duplicated phenylalanine ammonia-lyase (PAL), beta-glucosidase, cinnamyl-alcohol dehydrogenase and peroxidase genes (map00940) (Supplemental Fig. S2, S3 & Table 1, Supplemental Table S3). Based on conserved domains, we further individually annotated the key synthetases, terpene synthase (TPS) genes and the stilbene synthase (STS) genes involved in the biosynthesis of terpenes and stilbenes, respectively. This analysis revealed that up to 89.13% (41/46) of TPS genes and 76.36% (42/55) of STS genes are tandem duplicated (Supplemental Table S3).
Table 1. The overview of TD genes significantly enriched in metabolic pathways associated with flavor and biotic stress.
K number Annotation All count TD genes Ratio (%) phenylpropanoid biosynthesis (map00940) K00083 CAD; cinnamyl-alcohol dehydrogenase [EC:1.1.1.195] 23 11 47.83 K00430 peroxidase [EC:1.11.1.7] 82 36 43.90 K00588 caffeoyl-CoA O-methyltransferase [EC:2.1.1.104] 5 2 40.00 K01188 beta-glucosidase [EC:3.2.1.21] 33 27 81.82 K01904 4CL; 4-coumarate--CoA ligase [EC:6.2.1.12] 7 2 28.57 K05349 bglX; beta-glucosidase [EC:3.2.1.21] 8 4 50.00 K05350 bglB; beta-glucosidase [EC:3.2.1.21] 5 2 40.00 K06892 F6H; feruloyl-CoA 6-hydroxylase [EC:1.14.11.61] 2 2 100.00 K10775 PAL; phenylalanine ammonia-lyase [EC:4.3.1.24] 19 11 57.89 K11188 PRDX6; peroxiredoxin 6 [EC:1.11.1.7 1.11.1.27 3.1.1.-] 3 2 66.67 K13065 HCT; shikimate O-hydroxycinnamoyltransferase [EC:2.3.1.133] 7 3 42.86 K13066 COMT; caffeic acid 3-O-methyltransferase [EC:2.1.1.68] 13 4 30.77 flavonoid biosynthesis (map00941) K00588 caffeoyl-CoA O-methyltransferase [EC:2.1.1.104] 5 2 40.00 K00660 CHS; chalcone synthase [EC:2.3.1.74] 43 31 72.09 K05278 FLS; flavonol synthase [EC:1.14.20.6] 4 4 100.00 K05280 CYP75B1; flavonoid 3'-monooxygenase [EC:1.14.14.82] 2 2 100.00 K13065 HCT; shikimate O-hydroxycinnamoyltransferase [EC:2.3.1.133] 7 3 42.86 K13082 DFR; bifunctional dihydroflavonol 4-reductase/flavanone 4-reductase [EC:1.1.1.219 1.1.1.234] 6 3 50.00 K13083 CYP75A; flavonoid 3',5'-hydroxylase [EC:1.14.14.81] 15 12 80.00 In addition, plant hormone signal transduction (map04075) and plant-pathogen interaction (map04626) pathways, which were closely related to disease resistance response (Fig. 1d & Supplemental Table S2)[59], were also found to be significantly enriched in TD genes. Programmed cell death (PCD) is of central importance in plant-microbe interactions[59,60]. Small Auxin Up RNA (SAUR) genes are early auxin-responsive genes which involved in leaf senescence and death[61]. Our analysis indicated that there are a large number of tandem duplicated SAUR genes, pathogenesis-related genes, and disease resistance genes in these two pathways (Supplemental Figs S4, S5 & Supplemental Table S2, S3). In addition, it is well known that NBS (nucleotide binding site)-type disease-resistance genes play an important role in the response of grapevine to pathogenic infection[29,62,63]. Among the 324 NBS genes annotated, based on conserved domains, TD genes accounted for up to 58.64% (190/324) (Supplemental Table S3). Not only that, but various transcription factors which play an important role in the growth and development and stress response of grapevine[27,29,64−66] were also found to be enriched in TD genes with 24.7% (37/150) of MYB, 37.5% (72/192) of ERF, 20.5% (15/73) of NAC, 10.5% (6/57) WRKY transcription factor genes being tandem duplicated.
In short, our analysis clearly demonstrates that gene tandem duplication has made major contributions in the expansion of specific gene families related to biotic stress resistance and biosynthesis of various secondary metabolites, and directly affected the family expansion level, as well as the adaptive evolution of V. vinifera.
TD genes play a pivotal role in response to Plasmopara viticola infection
-
A study in Drosophila[66] found that the tandem duplication of the Alcohol dehydrogenase (Adh) gene and an unrelated synthetic reporter gene both appears more than 2-fold higher in expression level than the single-copy gene, and also exhibits greater activity than two copies of the gene in trans. This study then proposed the concept of 'overactivity' and suggested that this overactivy at the expression level of TD genes is a general phenomenon and speculated that the overactivity of TD genes is due to a proximity position effect rather than simply copy number[66]. However, this hypothesis is only based on individual genes and has not been confirmed in plants. At present, the genome-wide analysis of TD gene expression signatures still lacks systematic attention. More importantly, the differences in the dynamic expression changes and the roles between TD genes and interspersed duplicated genes in response to environmental stimuli, cannot be fully reflected by the expression characteristics under a single specific condition. Considering the importance of the TD genes in the adaptive evolution of V. vinifera genome, we then sought to use V. vinifera as a model to explore these unsolved questions. To this end, while considering the important impact of grapevine downy mildew (DM) caused by the oomycete P. viticola on the viticulture worldwide[67], we investigated the dynamic expression characteristics of TD genes by analyzing our transcriptome data of grape leaves at different time points after P. viticola infection.
We first identified 1,330 non-redundant DEGs distributed on the 19 V. vinifera chromosomes, which were significantly differentially expressed at any specific time point within the first 36 h, in response to DM inoculation vs Mock (water) inoculation, in either MrRpv1-transgenic Shiraz or wild-type Shiraz. Subsequently, the 1,330 DEGs were classified into 584 TD-DEGs and 746 notTD-DEGs according to whether they were TD genes or not (Supplemental Table S4). Quantitative real-time PCR (qPCR) assays of a set of randomly selected DEGs have confirmed that their expression was in accordance with the transcriptome results, including 18 TD genes and seven notTD genes[29]. Our subsequent results greatly extend the meaning of 'overactivity'. TD genes played a pivotal role in the response to P. viticola infection through the multifaceted overactivity mentioned next. Firstly, in terms of quantity, while the proportion of TD genes located across the 19 chromosomes was only 19.09%, they accounted for 43.91% of all DEGs responding to P. viticola infection. In other words, TD genes were significantly more abundant in DEGs (t test, p = 1.59 × 10−54; Fig. 2a & Supplemental Fig. S6), including 29 STS genes, 21 CHS genes, 17 GST (glutathione S-transferase) genes, 11 PAL genes, seven chitinase genes and six PR1 (pathogenesis-related protein 1) genes. Second, in terms of scope, TD-DEGs were significantly differentially expressed at more earlier time points and in more treatments post-infection compared to notTD-DEGs, resulting in faster and longer-lasting responses (Fig. 2b, Supplemental Figs S7 & S8; Supplemental Table S4). Third, in terms of amplitude, the fold change of TD-DEGs is significantly higher than that of notTD-DEGs (t test, p = 1.24 × 10⁻²⁶; Fig. 2c, Supplemental Figs S8 & S9).
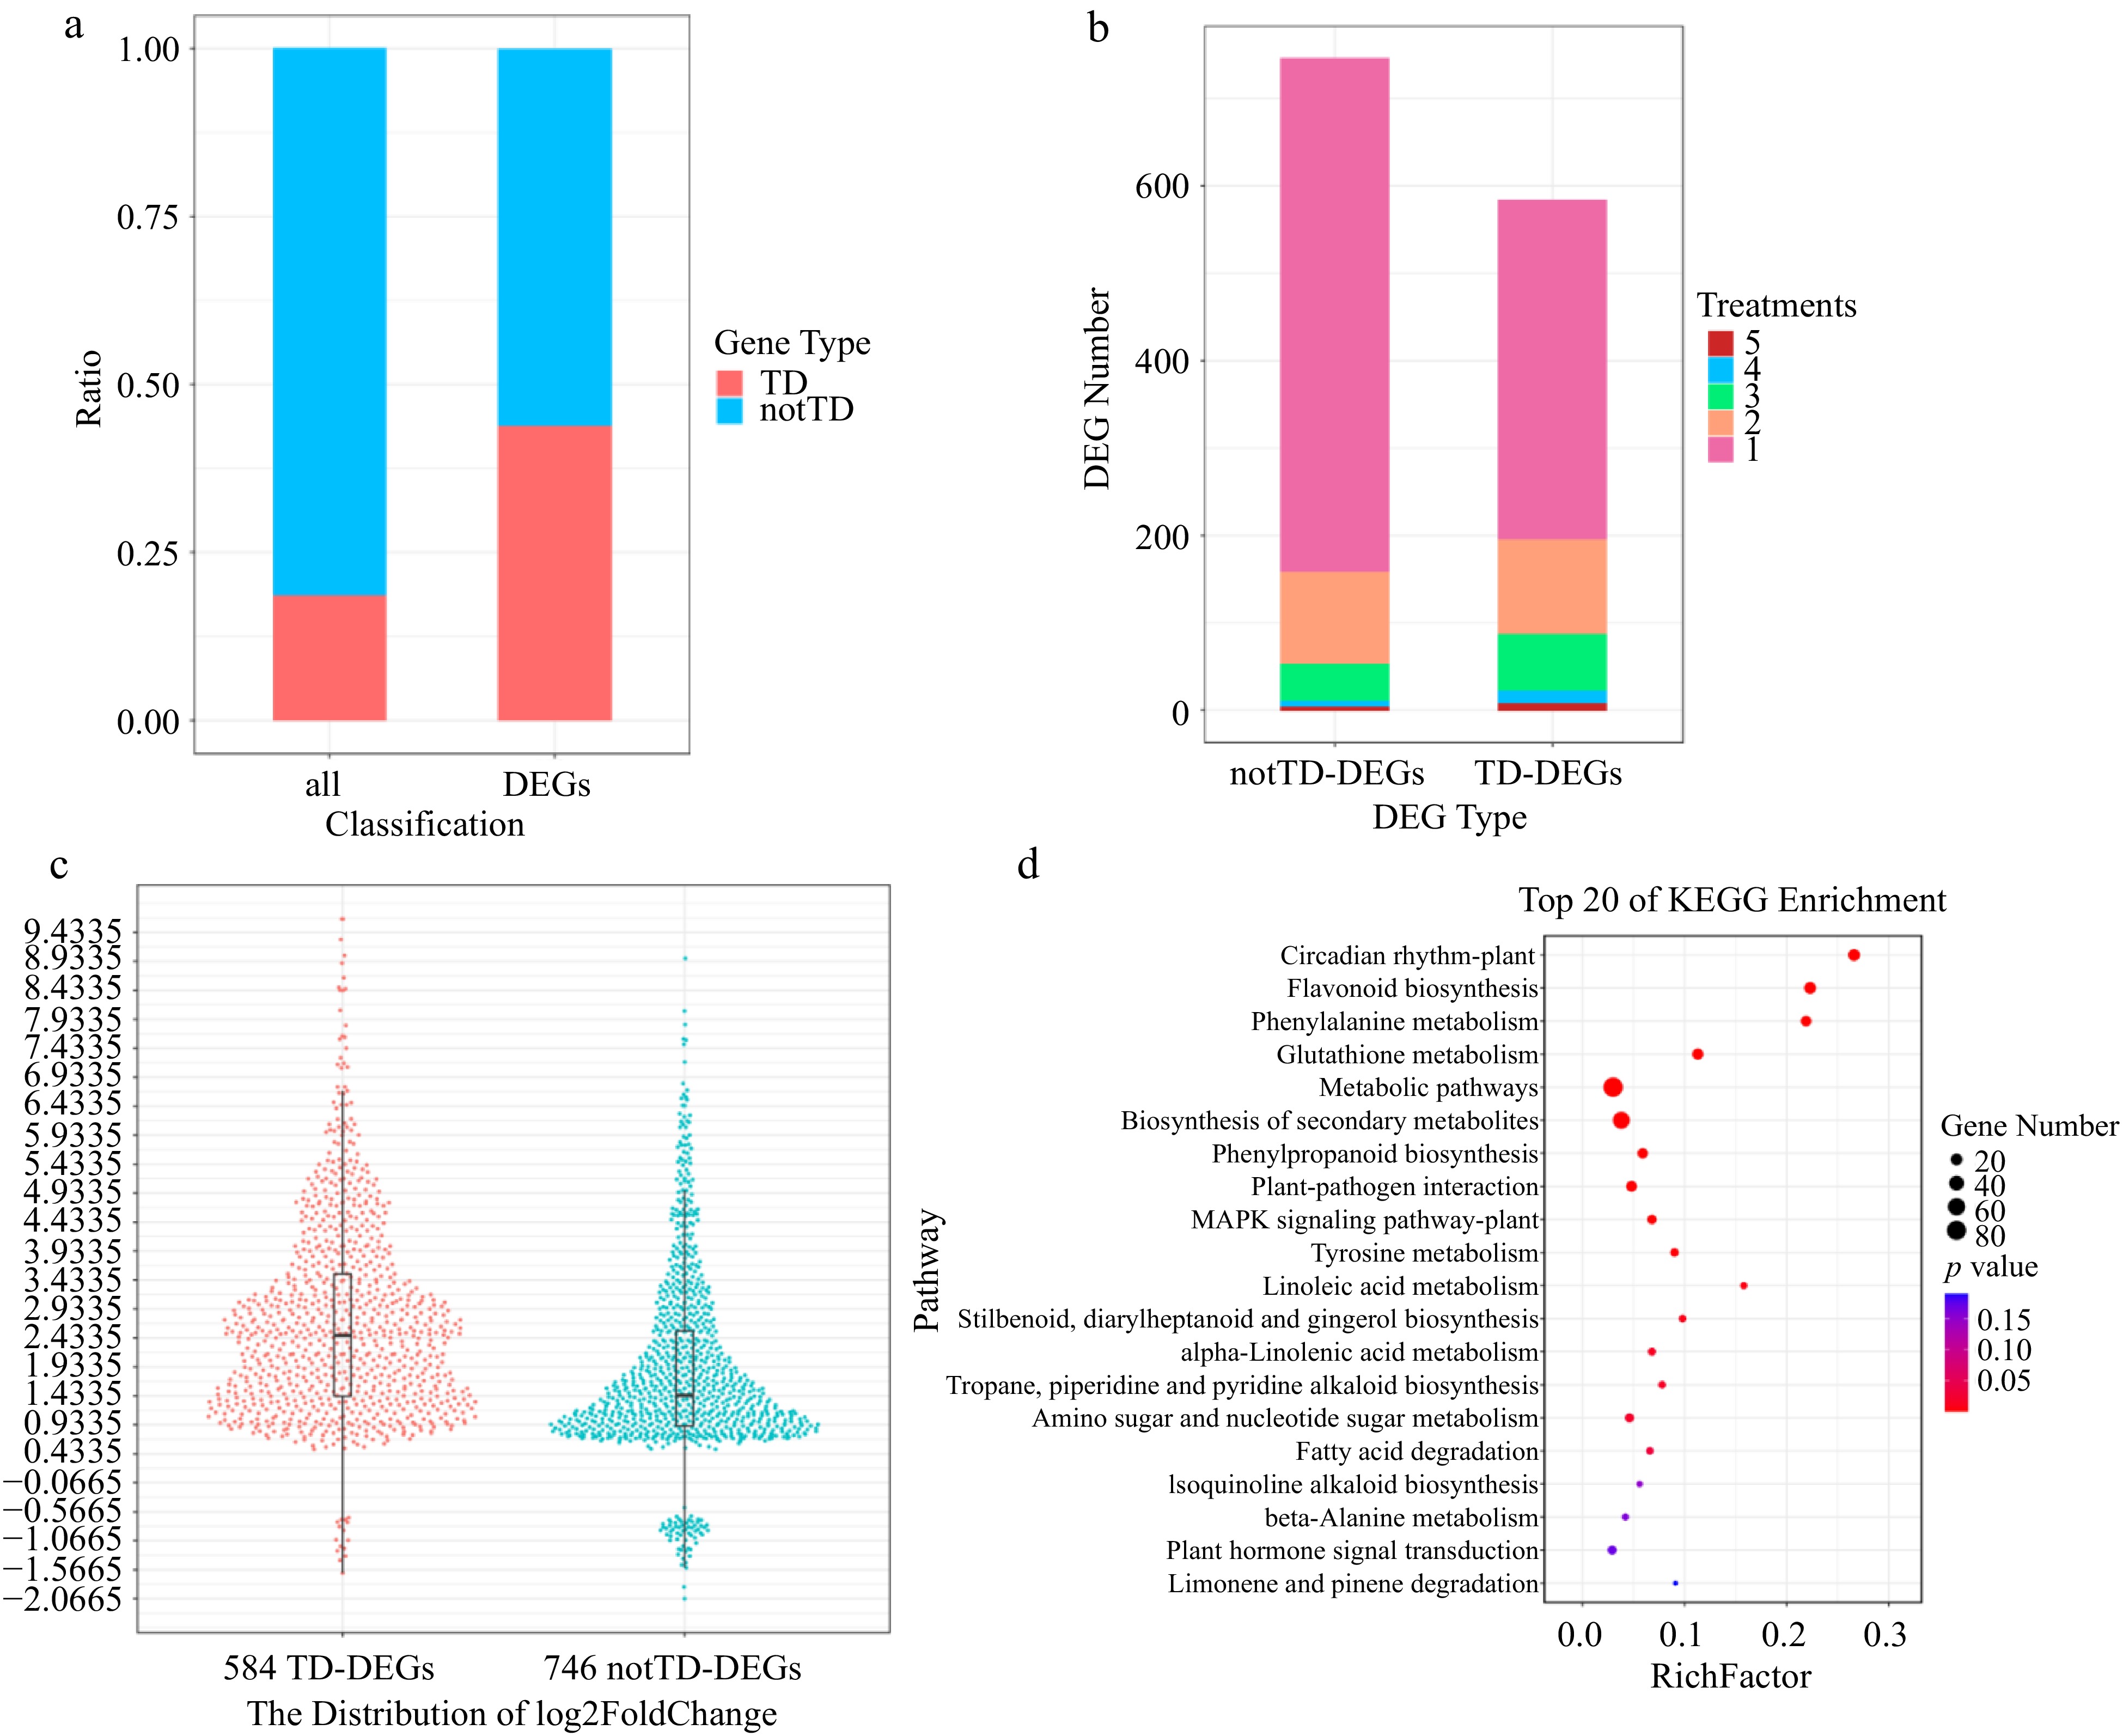
Figure 2.
Expression signature of TD genes. (a) Distribution of TD genes and notTD genes among all genes and DEGs, respectively by proportion. (b) Statistics on the number of notTD-DEGs and TD-DEGs distributed in different number of treatments by quantity. (c) Harp illustration of log2foldChange (DM vs Mock) for TD-DEGs and notTD-DEGs. (d) Scatterplot of KEGG enrichment for TD-DEGs.
Of the 584 TD-DEGs, there were 507, 386 and 554 genes that could be successfully annotated by the KEGG, GO, and PFAM databases, respectively. A KEGG enrichment analysis of the 584 TD-DEGs showed that they were significantly (p < 0.01) enriched in biological pathways related to biotic stress and plant immunity, such as flavonoid biosynthesis; phenylalanine metabolism; glutathione metabolism; biosynthesis of secondary metabolites; phenylpropanoid biosynthesis; plant-pathogen interaction; MAPK signaling pathway; tyrosine metabolism; linoleic acid metabolism; stilbenoid, diarylheptanoid and gingerol biosynthesis; tropane, piperidine and pyridine alkaloid biosynthesis; isoquinoline alkaloid biosynthesis; plant hormone signal transduction (Fig. 2d). Besides, the GO enrichment analysis of the 584 TD-DEGs revealed that genes involved in biological processes related to protein phosphorylation, protein modification process, defense response, defense response to fungus, response to stress, response to biotic stimulus were significantly enriched (p < 0.01). Among the molecular function terms, terms related to plant immunity, including protein kinase activity, phosphotransferase activity, ATP or nucleoside binding, transmembrane signaling receptor activity, ion channel activity were significantly enriched. PFAM enrichment analysis revealed that genes involved in Chalcone and stilbene synthases C-terminal domain and N-terminal domain, Protein kinase domain, Pathogenesis-related protein family, Glycosyl hydrolase family were significantly enriched. From the enrichment results of KEGG, GO and PFAM, it can be seen that TD genes are widely involved in the disease resistance process. In addition, our previous weighted-gene coexpression network analysis (WGCNA) indicated that the black module was the key module because it contains the most DEGs and most genes within this module were strongly induced and played an important role in the MrRPV1-mediated resistance to downy mildew[29]. Here, we further found that 54.14% (720/1,330) of all non-redundant DEGs are in the black module, of which 50.42% (363/720) are TD-DEGs (Supplemental Fig. S10 & Supplemental Table S5). In particular, as many as five of the top 10 hub genes identified by KME values in the black module are TD genes, namely VIT_08s0058g00860 (Protein LURP-one-related 15, G1139), VIT_14s0081g00030 (Pathogenesis-related protein PR-4, G1904), VIT_16s0050g02210 (Acidic endochitinase, G191), VIT_15s0021g01270 (uncharacterized protein, G1696) and VIT_16s0050g02220 (Acidic endochitinase, G191). Clearly there are significantly more TD-DEGs in this core module compared to notTD-DEGs (t test, p = 2.41 × 10⁻⁷).
To further confirm that this multifaceted overactivity phenomenon is caused by the position effect between TD genes, rather than the functional differences between TD and notTD genes, we narrowed the comparative analysis to the 310 TD-DEGs and 144 notTD-DEGs in 84 families containing both TD-DEGs and notTD-DEGs. It is clear that after exclusion the interference of the functional differences, it is further confirmed that tandem duplication is a key factor responsible for the multifaceted overactivity phenomenon (Supplemental Figs S11−S14 & Supplemental Tables S6, S7). In conclusion, our results demonstrate the multifaceted overactivity phenomenon of TD genes at the genome-wide level and their essential role in response to Plasmopara viticola infection through effective differential changes in expression.
The recent burst of LTR contributes to tandem and interspersed gene duplication
-
The results of the analysis presented above greatly enhanced our interest in the TD genes. To further clarify their replication times, we identified the reciprocal best-hit (RBH) paralogous gene pairs using blastp with an E-value threshold of 1E-5[16,32]. The synonymous nucleotide substitution rate (Ks) of the RBH pairs was used as a proxy for divergence time. This identified 4,486 RBH pairs across the 19 chromosomes with ks < 3.
For the convenience of description and further analysis, we then defined the RBH pairs in which both genes were TD genes as 'bothTD' pairs, whereas the pairs in which both genes were notTD genes were defined as 'bothNotTD' pairs. Remaining pairs in which one was a TD gene and the other was not were defined as 'TDnotTD' pairs. Of the 4,486 RBH pairs identified, a total of 1,299 were classified as bothTD pairs which accounted for 48.64% (2,598/5,341) of all previously identified TD genes distributed on the 19 chromosomes, 2,936 as bothNotTD pairs and 251 as TDnotTD pairs (Fig. 3 & Supplemental Table S8).
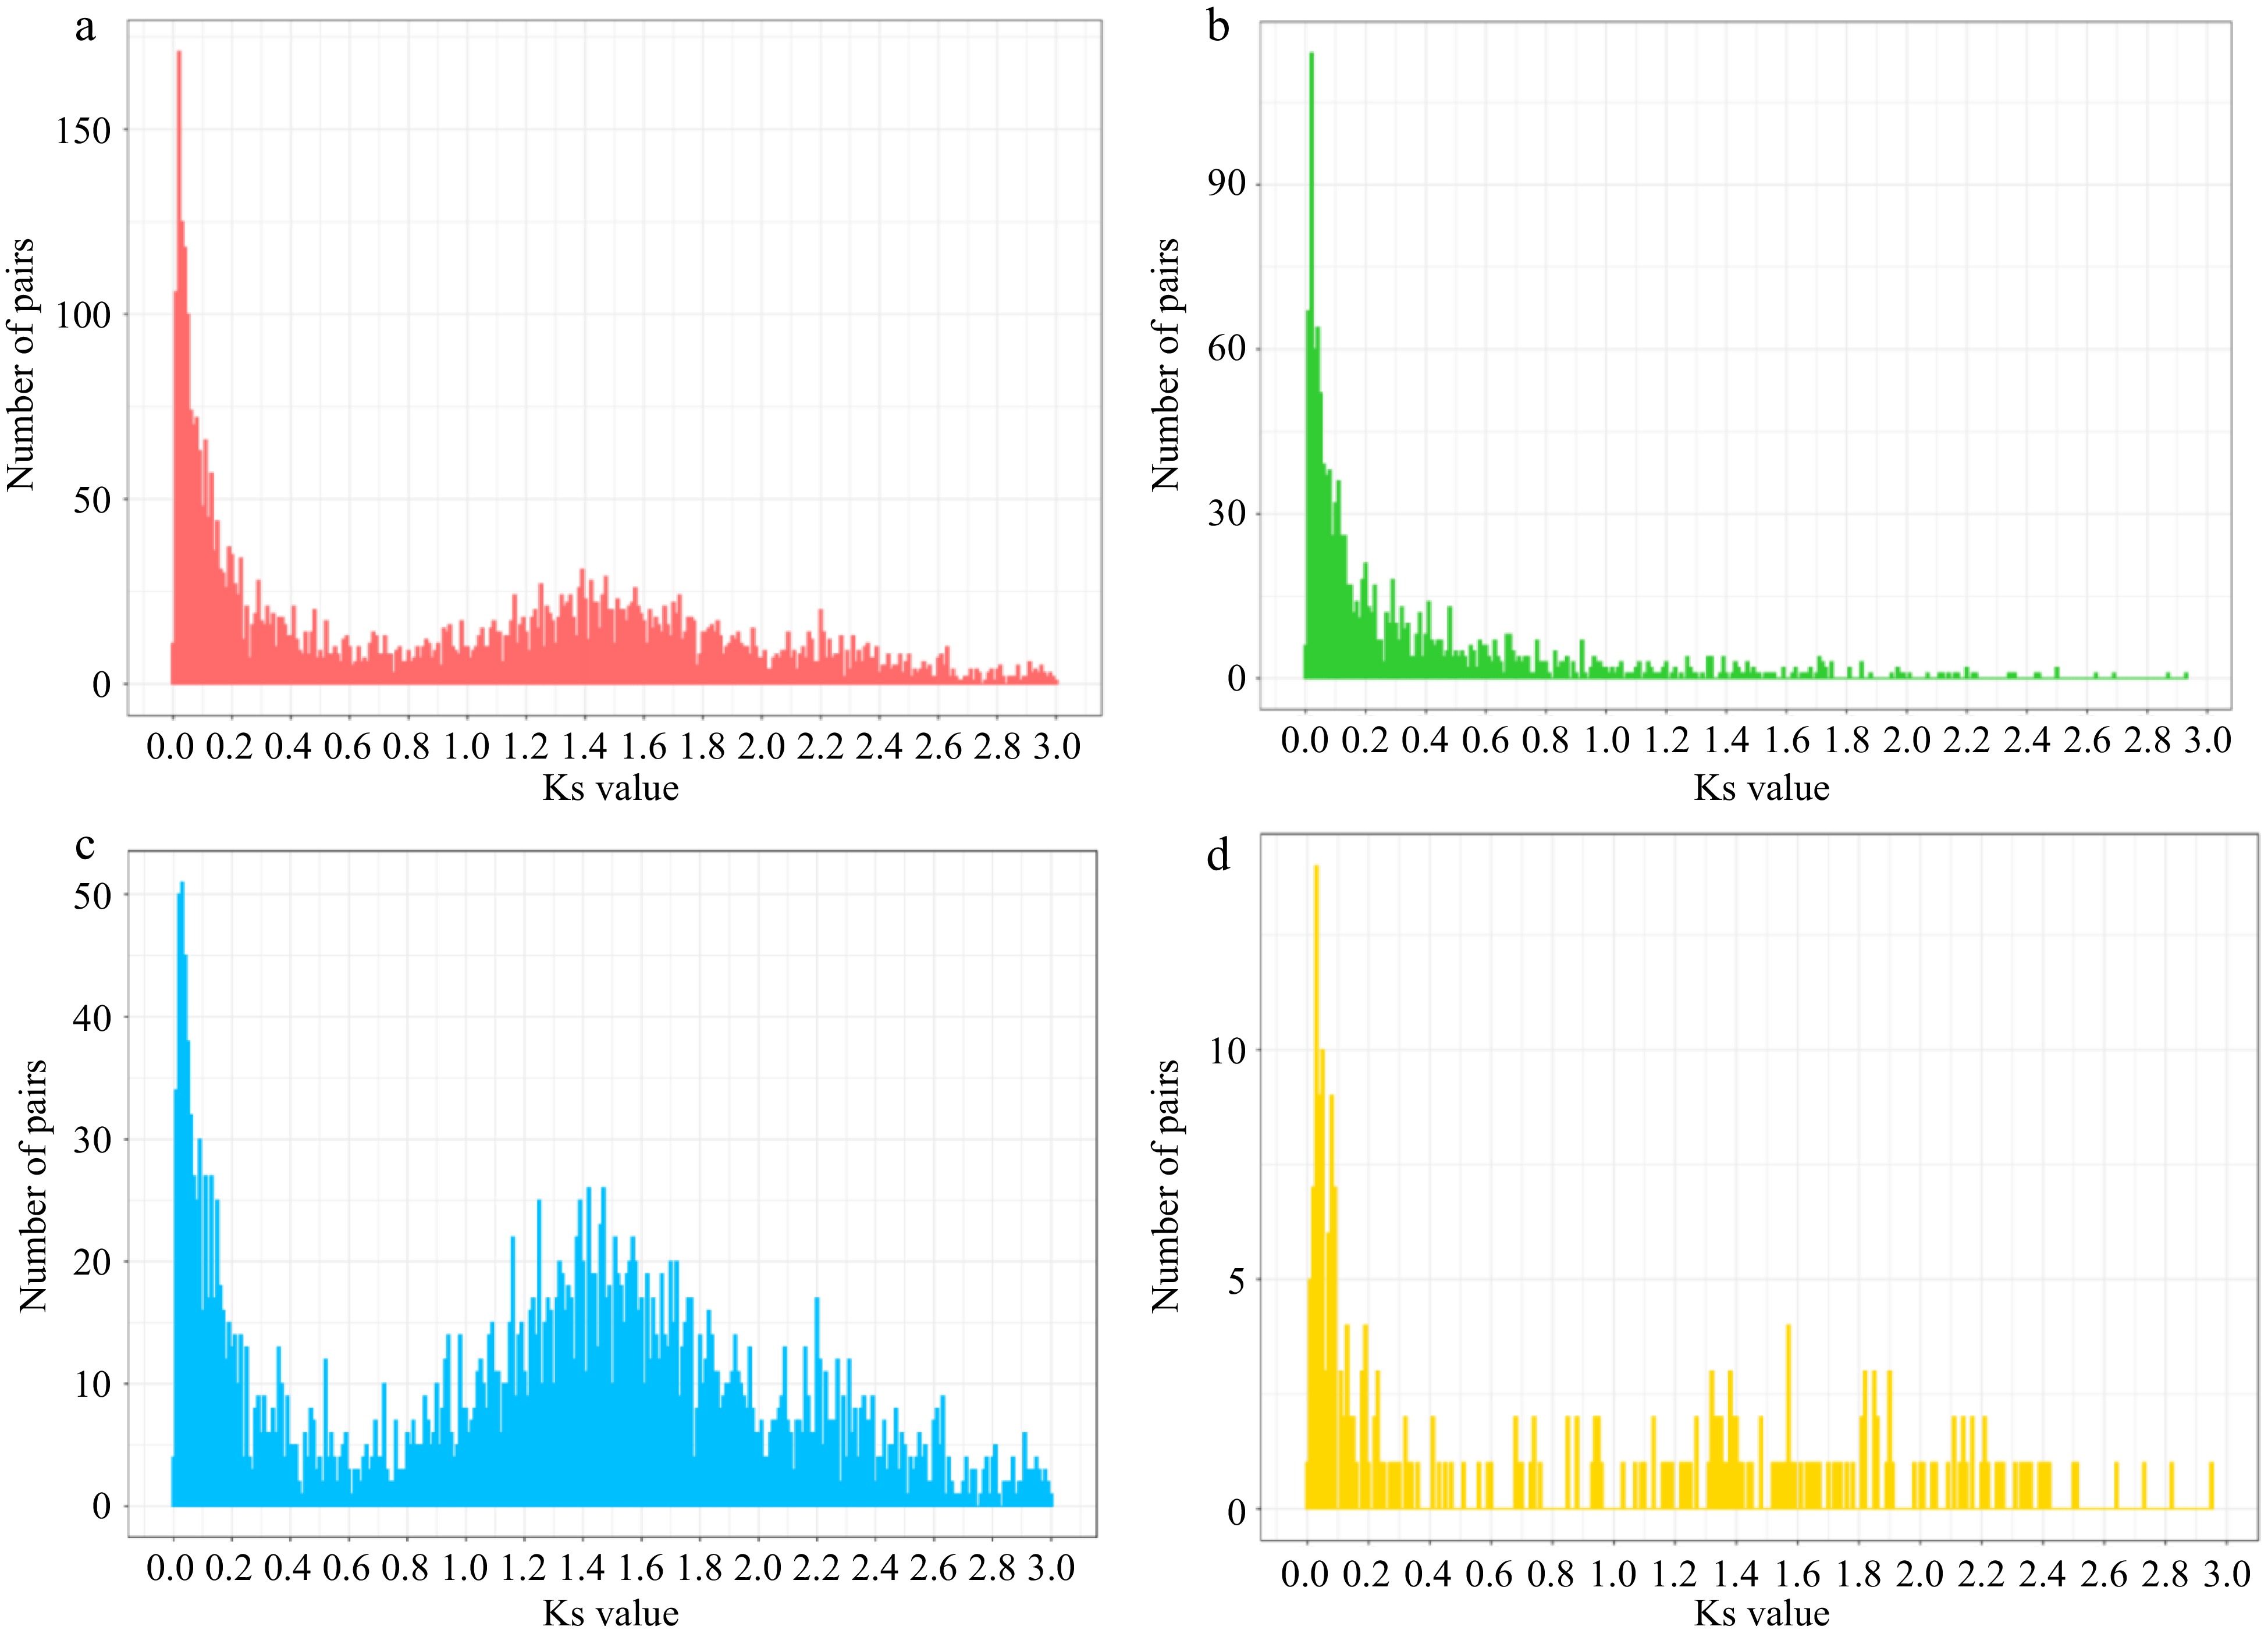
Figure 3.
The ks distribution of RBH pairs. (a) All pairs. (b) Both TD pairs. (c) BothNotTD pairs. (d) TD notTD pairs.
Interestingly, the ks distribution of all identified 4,486 RBH pairs shows that, in addition to an older WGD peak around 1.4, massive gene duplication between 0-0.2 resulted in another more recent peak around 0.03 (Fig. 3a). It is clear that most of the bothTD pairs were duplicated more recently and accounted for the majority of recent RBH pairs, suggesting that gene tandem duplication is the main mode of gene expansion in recent times (Fig. 3b & Supplemental Table S8). In contrast, most RBH pairs that arose during WGD period are bothNotTD pairs, which is consistent with the mechanism of WGD (Fig. 3c & Supplemental Table S8). A comparison of KEGG enrichment results across all recently duplicated 1,351 pairs, identified 722 bothTD pairs and 536 bothNotTD pairs with ks < 0.2, suggesting that the recent generation of TD genes, but not the notTD genes, was a key factor to the adaptive evolution of V. vinifera (Supplemental Fig. S15), which was consistent with the KEGG enrichment results of all 5,341 TD genes (Fig. 1d).
To explore the reason for the recent burst of gene duplication events in the V. vinifera genome, and considering the remarkable impact of LTRs on plant genome evolution, we identified intact LTRs and analyzed their insertion time. As we expected, large-scale insertions of LTRs have also occurred recently and still continue, which is consistent with the recent large-scale gene duplication events. (Supplemental Fig. S16).
We then investigated the sequence similarities between the 2 kb flanking sequences of the recently duplicated 722 bothTD pairs (ks < 0.2) and found that there were 237 pairs with similar 5' or 3' flanking sequences. Of these 237 pairs, 53 were found to have similar 5' and 3' flanking sequences, 85 have similar 5' flanking sequences and 99 have similar 3' flanking sequences (where similar is defined as at least 80% sequence identity across at least 50% of the length[16]). Next, we found that up to 84.45% (2,194/2,598) of genes within all 1,299 bothTD pairs contained TEs within the 2 kb flanking sequence, of which 1,231 genes contained TEs in both 5' and 3' flanking sequences, another 514 genes contained TEs in 5' flanking sequences, and 449 genes contained TEs in 3' flanking sequences. Among these TEs, LTRs accounted for 71.62%, with Copia the most common, followed by Gypsy. Combined with the recent outbreak of tandem gene duplication, this seems to imply that the production of TD genes may be related to TEs.
Furthermore, based on comparative analysis with other types of RBH pairs, we speculate that the TD gene is highly unlikely to be generated by retrotransposition. Since a hallmark of retrotransposition is an intronless coding region with a poly-A tail, pairs were inferred to be likely retrotransposed duplications if one gene contains only one exon and the other gene contains at least three exons[68]. Following such stringent criteria, we then individually checked all 1,299 bothTD pairs, 536 recently replicated bothNotTD pairs (ks < 0.2), and 989 bothNotTD pairs during WGD (ks between 1.2-1.8), and identified 21 pairs, 71 pairs and 16 pairs of retrotransposed duplications, respectively. Recently duplicated bothNotTD pairs were the least in number, whereas this category has the most pairs which met the criteria for retrotransposed duplications, implying the importance of retrotransposition for the recent interspersed duplications. In addition, among the 536 recently replicated bothNotTD RBHs, 322 pairs were located on different chromosomes, and another 49 pairs were separated by spacings of over 1Mb. Furthermore, there were 51 pairs with similar 5' and 3' flanking sequences, another 58 pairs with similar 5' flanking sequences, and 74 pairs with similar 3' flanking sequences (defined as at least 80% sequence identity across at least 50% of the length in the 2 kb flanking sequences). Meanwhile, there are 84.14% (902/1,072) genes containing TEs in flanking sequences, of which 516 genes contained TEs in both 5' and 3' flanking sequences, another 210 genes contained TEs in 5' flanking sequences, and 176 genes contained TEs in 3' flanking sequences. Among these TEs, LTRs accounted for 71.93%, with Gypsy the most common, followed by Copia. Taken together, it seems reasonable to speculate that the recent burst of LTR activity may explain the recent generation of a large number of interspersed duplications.
In contrast, while bothTD pairs are present in the highest number, they were found to contain the lowest ratio of retrotransposed duplications. At the same time, considering the flanking sequence features outlined above, the close positional relationship and the presence of very few intron deletions between TD genes, it seems reasonable to speculate that recent LTR insertions may have indirectly promoted the recent outbreak of TD genes by increasing the probability of unequal crossovers in nearby genomic regions, which greatly promoted the adaptive evolution in V. vinifera. Moreover, the resulting TD genes even exceeded the number of interspersed duplications generated directly by retrotransposition, in which different LTR subtypes played different dominant roles.
The discovery that such a large number of recently duplicated genes have LTR insertions in the upstream promoter regions, we decided to further evaluate the potential impact of LTR insertions on gene regulation and function. To do this, we analysed the transcription factor binding sites (TFBS) in the upstream 1 kb promoter region of 536 bothNotTD pairs (ks < 0.2) and all 1,299 bothTD pairs and then focused on the proportion of TFBS located within the TE/LTR. The results show that TE-embedded motifs accounted for 63.43% (680/1,072) and 64.09% (1,665/2,598), respectively. The vast majority of TEs were LTRs, among which Copia was the most common, followed by Gypsy. This indicates that the insertion of LTRs not only promotes gene duplication, but also may extensively modify gene expression.
Sequence similarity affects distinct expression activity profiles among different gene clusters
-
The results presented above suggest that the recent outbreak of LTRs is an important reason for the large-scale replication of TD genes and whether a gene is a TD gene seems to determine whether the gene has multifaceted overactivity phenomenon. However, it is important to note the 584 TD-DEGs were derived from 230 TD-families, but there are in fact a total of 2,407 TD genes in these 230 TD-families, which means that only 24.26% display differential gene expression in response to P. viticola infection. This raises two new questions. Firstly, if only the TD properties of genes determine their expression activity, we would expect these 584 DEGs to be relatively randomly and uniformly distributed within the gene clusters of these families. Secondly, since these 2,407 genes are all TD genes, why do only 584 genes show differential expression in response to P. viticola infection, while the remaining 1,823 genes from the same family do not?
The results of the subsequent analysis were somewhat unexpected. In contrast to our speculation, the 584 TD-DEGs were not randomly and uniformly distributed with most of them (64.55%, 377/584) distributed in clusters (defined as containing at least two DEGs in the same gene cluster) and only came from 99 TD-families. These clustered TD-DEGs were designated as 'togetherTD-DEGs'. For example, among the 55 STS genes in the V. vinifera genome, 32 are differentially expressed in response to P. viticola infection, of which 29 are togetherTD-DEGs. We also found that all 11 identified tandem duplicated phenylalanine ammonia-lyase (PAL) genes were significantly differentially expressed. The remaining 207 TD-DEGs were found to be in a scattered distribution and were from as many as 166 gene families (average of 1.25 DEGs per family). These scattered TD-DEGs were designated as 'singleTD-DEGs' (defined as containing only one DEG in the same gene cluster) (Fig. 4). It is worth noting that there are 64 TD-families which all 231 TD-DEGs from these families are all togetherTD-DEGs, accounting for 61.27% (231/377) of all togetherTD-DEGs (Fig. 4). However, there are actually a total of 542 TD genes in these 64 TD-families, which means that, apart from the 231 togetherTD-DEGs, the remaining 311 TD genes are not differentially expressed under any treatments. In conclusion, it would appear that the differential expression of TD genes have the characteristics of selective clustering in response to P. viticola infection.
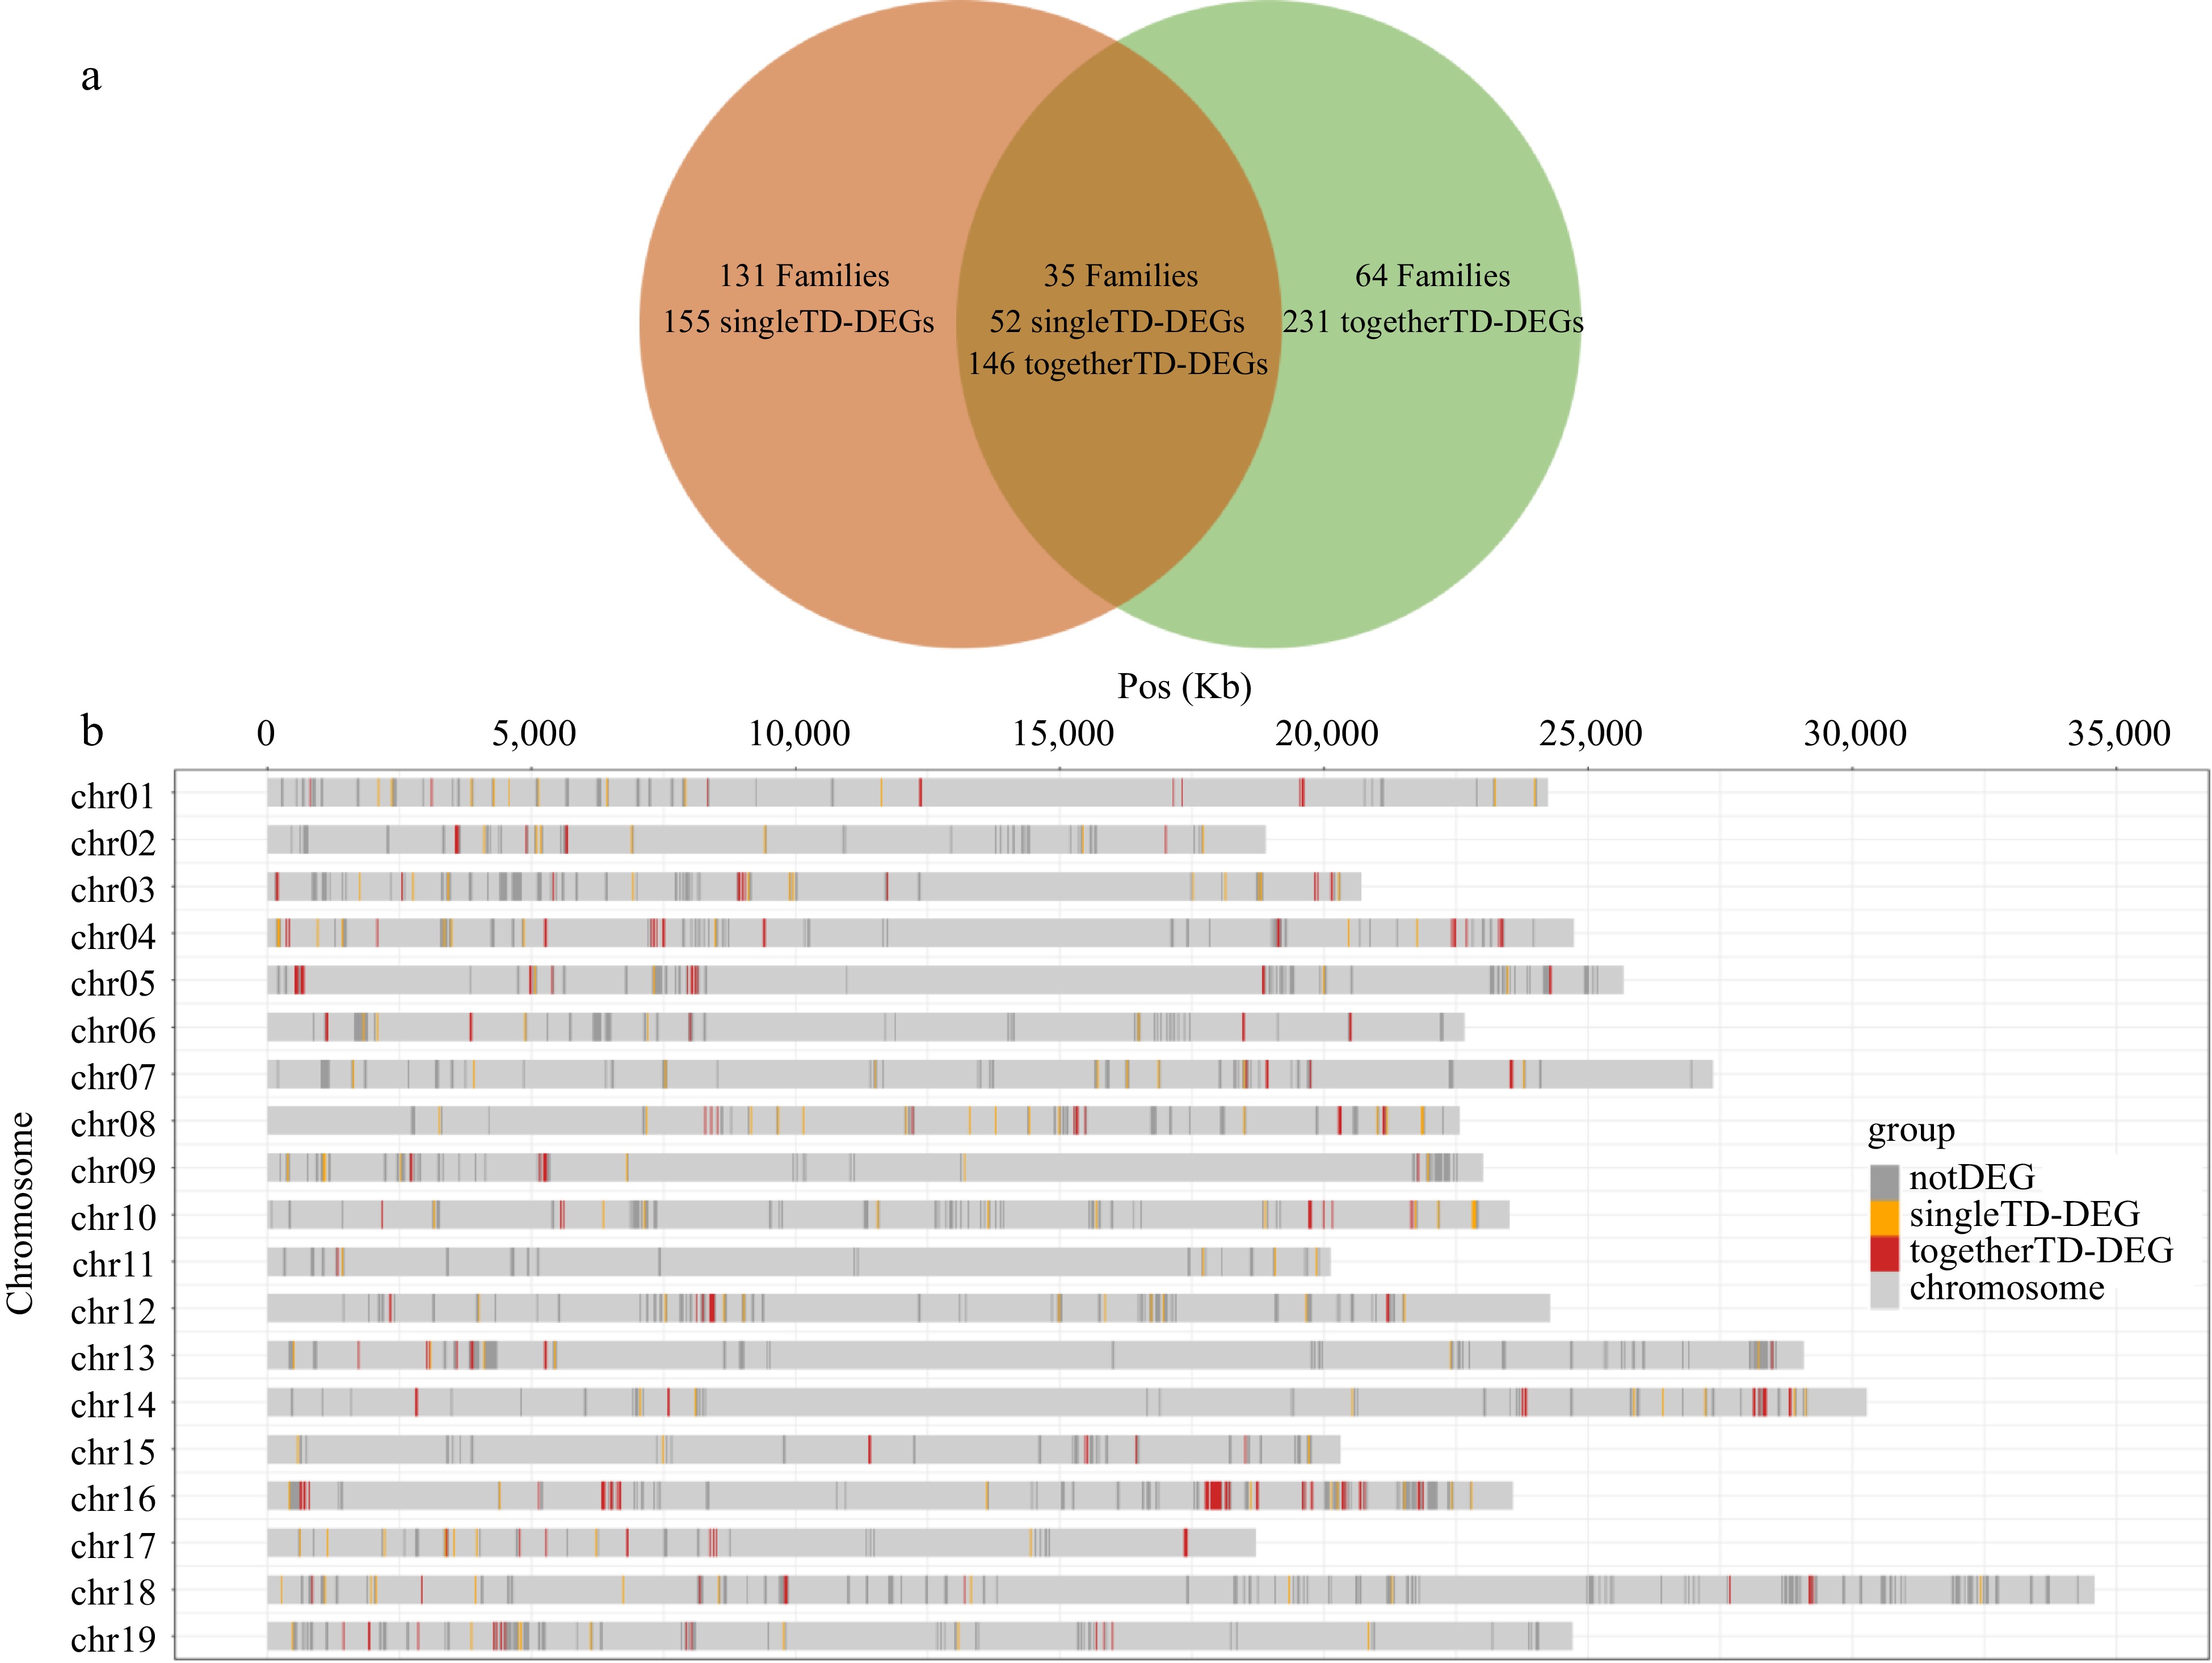
Figure 4.
The distribution of different type DEGs. (a) Venn diagram of family distribution of 377 togetherTD-DEGs and 207 singleTD-DEGs. Families are shown in bold font. The numbers of singleTD-DEGs and togetherTD-DEGs contained in the corresponding families are directly below. (b) The chromosomal distribution of 2,407 TD genes in 230 gene families containing TD-DEGs. notDEGs, singleTD-DEGs, togetherTD-DEGs are displayed separately.
Further analysis found that togetherTD-DEGs exhibited multifaceted overactivity compared with singleTD-DEGs, including more DEGs (Supplemental Fig. S17 & Supplemental Table S9), a faster and longer lasting response (Fig. 5a & Supplemental Fig. S18), a significantly higher fold change (t test, p = 2.91 × 10⁻⁷; Fig. 5c & d) and significantly more togetherTD-DEGs in core black module (t test, p = 0.00574; Fig. 5b, Supplemental Fig. S19 & Supplemental Table S10). In contrast, the difference between singleTD-DEGs and notTD-DEGs is not obvious, and the former is even slightly inferior in some respects to the latter. For example, in terms of the proportion of differentially expressed genes in more treatments, singleTD-DEGs are slightly less than notTD-DEGs (Fig. 5a).
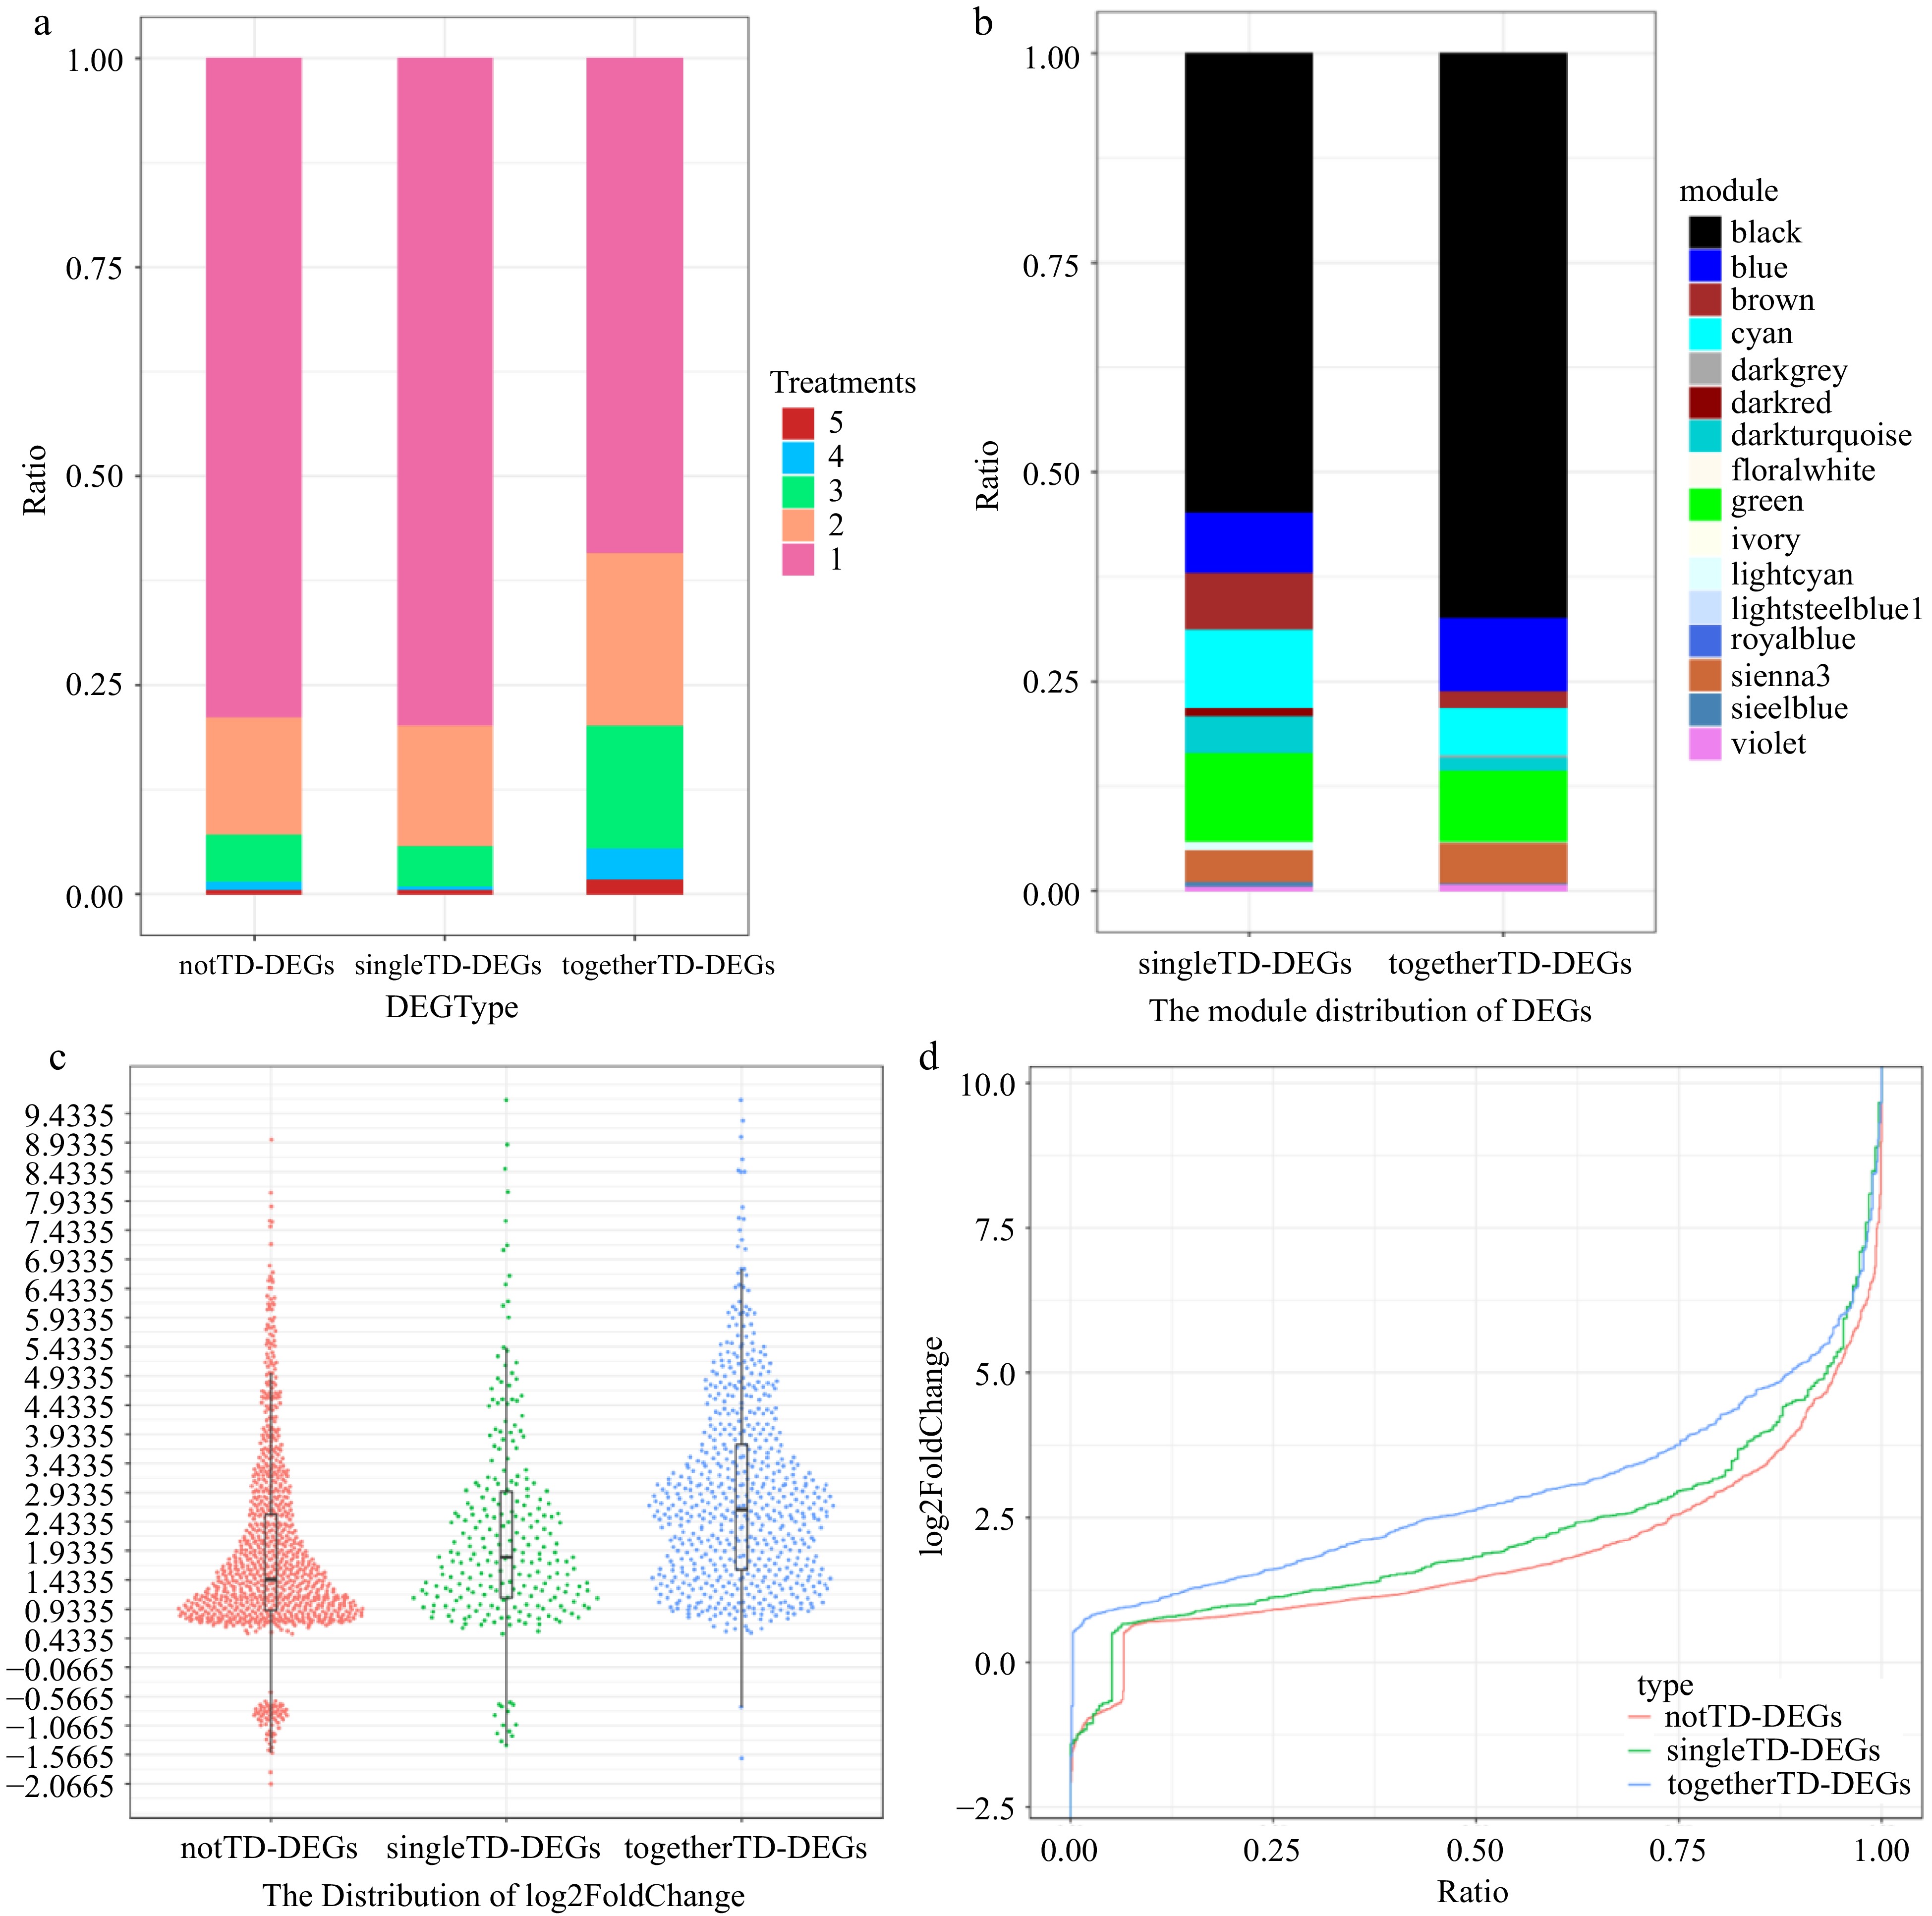
Figure 5.
Expression signature of togetherTD-DEGs. (a) Statistics on the number of notTD-DEGs, singleTD-DEGs and togetherTD-DEGs distributed in different number of treatments by proportion. (b) Modules distribution of singleTD-DEGs and togetherTD-DEGs of WGCNA analysis by proportion. (c) Harp illustration of log2foldChange for notTD-DEGs, singleTD-DEGs and togetherTD-DEGs. (d) Overall distributions of log2foldChange for notTD-DEGs, singleTD-DEGs and togetherTD-DEGs.
In conclusion, our results show that not all TD genes are overactive, and different gene clusters have different expression activity profiles, with some containing a large number of overactive togetherTD-DEGs, while some containing a few, scattered and relatively inactive singleTD-DEGs, and some contain no DEGs at all. This suggests that whether a DEG is a TD gene is not the only factor that determines its overactivity, and whether adjacent paralogous genes in the cluster can be differentially expressed synergistically is also an important factor. This raises the question for different gene clusters from the same family, as to why some clusters are synergistically differentially expressed, while the others are not?
We then asked whether the synergistic ability of distinct paralogous gene clusters to be expressed in response to P. viticola infection could be explained in part by functional differentiation related to sequence differences within gene clusters. To confirm this, we focused on the above-mentioned 64 TD-families containing only togetherTD-DEGs but no singleTD-DEGs, and selected relatively large gene families from them. The gene clusters formed by TD genes were then divided into two different categories according to whether they contain DEGs: togetherDEGs-clusters and noDEGs-clusters. Maximum-likelihood trees were constructed based on both the predicted protein sequences and the 1,000 nt region upstream of the transcription start sites of all TD genes. In general, the results showed that there are greater differences between, not only the upstream promoters, but also the amino acid sequences between noDEGs-clusters and togetherDEGs-clusters, and within the noDEGs-clusters, while a higher similarity is observed within the togetherDEGs-clusters (Supplemental Figs S20, S21 & S23).
Furthermore, based on the previously identified bothTD RBH pairs, we named the RBH pairs in which both genes are togetherTD-DEGs as 'togetherTD-DEGs RBHs', and RBH pairs in which either of the genes is singleTD-DEG as 'singleTD-DEG RBHs'. Sequence similarity analysis indicated that there are higher similarity both in protein sequences and 1 kb promoter sequences between togetherTD-DEGs RBHs than singleTD-DEG RBHs (Supplemental Fig. S24). Thus, our results suggested that gene clusters with higher homology in upstream promoters and protein sequences can respond more synergistically to P. viticola infection and exhibit multifaceted overactivity.
Position effect and synergistic effect of TD genes, especially in response to P. viticola infection
-
Gene duplication will cause the original expression dosage balance to be disrupted. The balance will be achieved again through down-regulation of expression, sub- or neofunctionalization of duplicates, or mutational degradation of one copy[68,69]. To further dissect the position effect of TD genes more comprehensively and compare the distinct expression signatures and their fates between tandem and interspersed duplicated genes, we analyzed their expression profiles and divided all identified 4,486 RBH pairs into three categories. Gene pairs were defined as asymmetrically expressed duplicates (AEDs) when the expression level of one the genes of the pairs was significantly higher in at least two treatments, and never lower than its sister gene in the other treatments. Gene pairs were defined as potentially sub- or neo-functionalized if the expression level of each gene was significantly higher than that of the other in at least one treatment. The remaining gene pairs were classified as having no differences (no-diff) in expression level[32,68]. For the following analysis, we confirm that the position effect of TD genes resulted in a higher level of expression synergy and activity, which is particularly important in response to P. viticola infection. Here, in order to express this concept more clearly, we officially named the expression characteristic of the TD genes as their positional effect and synergistic effect.
Although the vast majority of bothTD pairs and bothNotTD pairs are AEDs, the former still have significantly more no-diff pairs than the latter (t test, p = 3.07 × 10⁻⁵; Supplemental Fig. S25). Meanwhile, gene expression is significantly more correlated for bothTD pairs than for bothNotTD pairs (t test, p = 6.00 × 10⁻¹³; Fig. 6a & Supplemental Fig. S26). Considering that large-scale duplication of bothTD pairs and bothNotTD pairs occurred at different times, we therefore wondered whether the segregation of duplicates contributed to the differential expression between them, or whether the lower expression correlations simply reflected the greater age of bothNotTD pairs. In fact, even controlling for duplicate age and only recently generated (ks < 0.4) bothTD and bothNotTD pairs were selected, there is also a strong signal that interspersed duplication is a key factor enabling expression divergence (t test, p = 1.157 × 10⁻⁸; Supplemental Fig. S27). In other words, the position effect of the TD genes is critical for the higher expression synergy level (or synergistic effect).
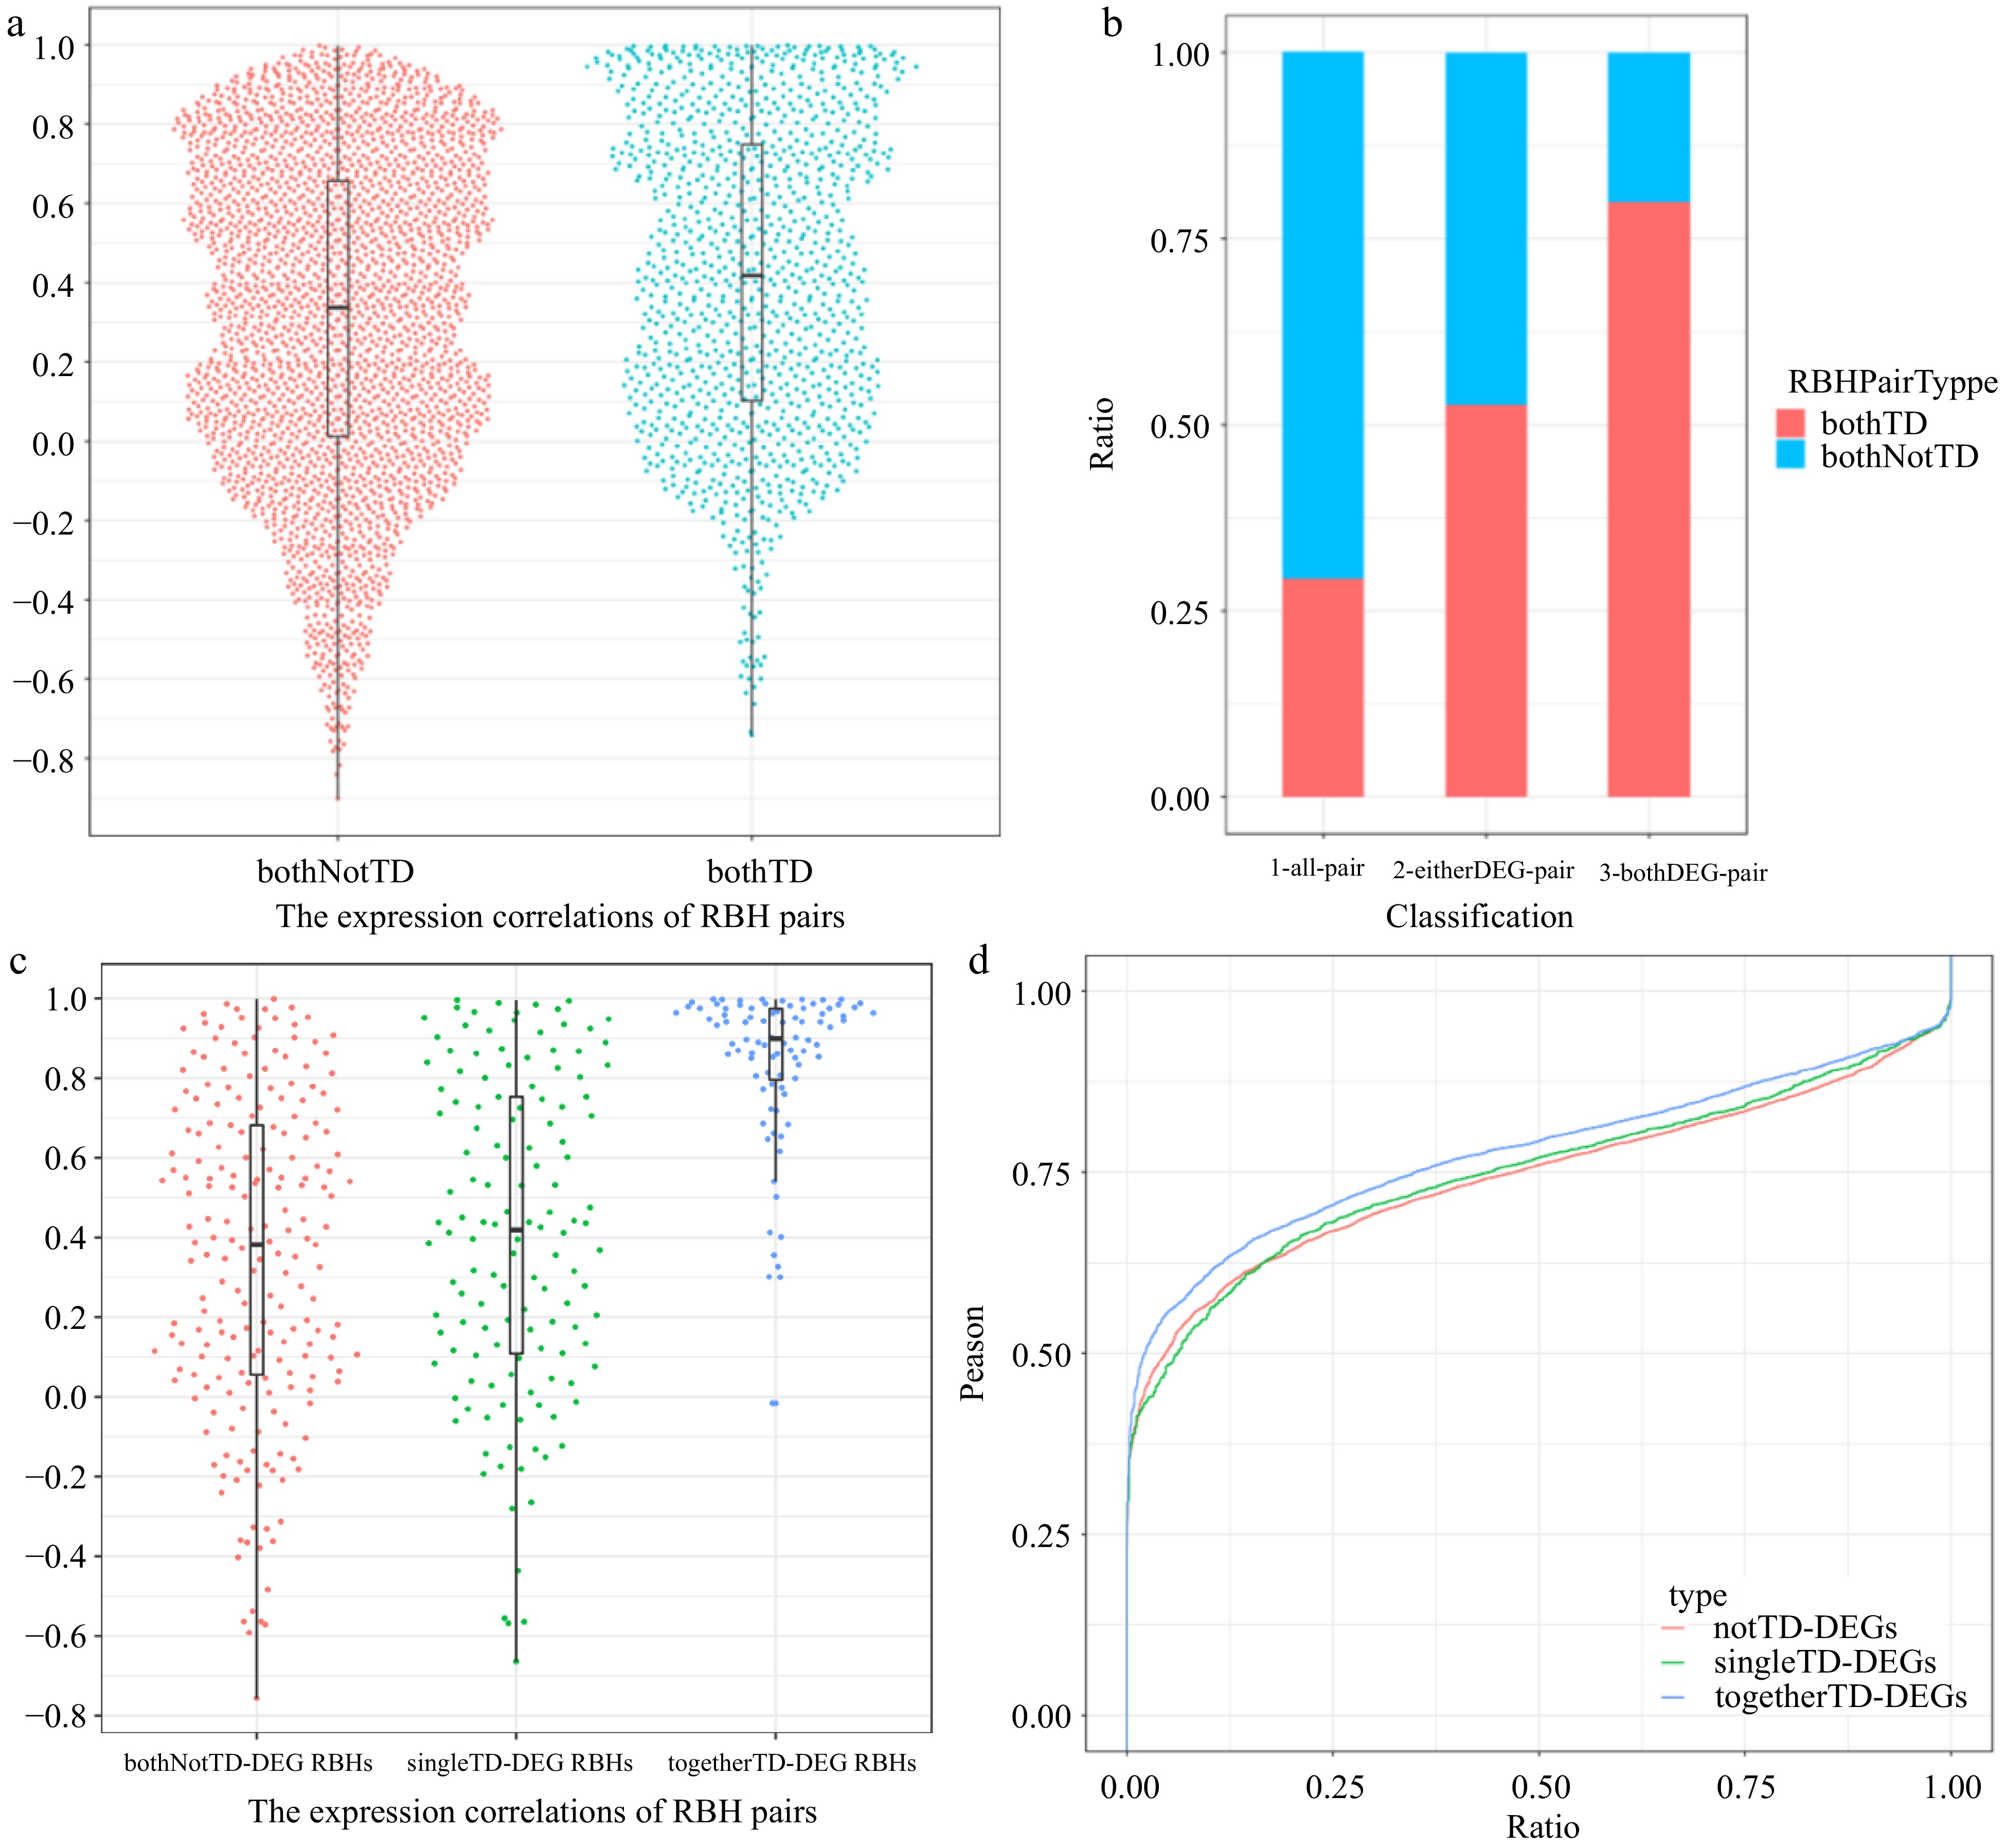
Figure 6.
Expression properties of different type RBH pairs. (a) Harp illustration of expression correlations between bothTD pairs and bothNotTD pairs, respectively. (b) Proportion of bothTD and bothnotTD RBH pairs among all pairs, pairs containing at least one DEG and pairs whose two genes are both DEGs, respectively. (c) Harp illustration of expression correlations among bothNotTD-DEG RBH pairs, singleTD-DEG RBH pairs and togetherTD-DEGs RBH pairs, respectively. (d) Overall distributions of expression correlations between differentially expressed WRKY transcription factors and NotTD-DEGs, singleTD-DEGs, togetherTD-DEGs containing WRKY TFBSs in black module, respectively.
Among all RBH pairs, bothTD pairs accounted for a smaller proportion compared with bothNotTD pairs (Fig. 6b). However, further analysis found that bothTD pairs were significantly higher in pairs containing at least one DEG (t test, p = 1.09 × 10⁻²¹) and much higher in the pairs whose two genes are both DEGs (Fig. 6b). We also found that the expression correlation of all togetherTD-DEGs RBHs was surprisingly higher than that of singleTD-DEG RBHs and bothNotTD-DEG RBHs (bothNotTD pairs containing DEGs) (Fig. 6c & Supplemental Fig. S28). This is consistent with the previous finding that TD genes can respond more synergistically to P. viticola infection.
Based on the previously identified bothTD RBH pairs, we identified 88 togetherTD-DEGs RBHs, and 109 singleTD-DEG RBHs. Next, we found that there are five families containing both togetherTD-DEGs RBHs and singleTD-DEG RBHs. Comparative analysis between togetherTD-DEGs RBHs and singleTD-DEG RBHs from the same family found that in four of the five families, compared with the latter, the former exhibited higher expression correlation between genes within the gene pairs and multifaceted overactivity (Supplemental Table S11). Not only that, none of the other genes in singleTD-DEG RBHs were DEGs (Supplemental Table S11). This is the most direct and convincing evidence that TD genes with higher synergistic expression levels could respond more synergistically to P. viticola infection and exhibited multifaceted overactivity, since comparisons within gene families maximizes the exclusion of interference caused by differences in gene function among families.
Position effect and synergistic effect of TD genes is ubiquitous
-
Considering that distance proximity is always present between TD genes within gene clusters, we speculated that the co-expression of TD genes should also be a general phenomenon, not just limited to certain specific situations or tissues (such as in response to P. viticola infection or in leaves). To confirm our speculation and exclude the conditional interference of P. viticola infection, we separately examined the raw rpkm results of the water-treated mock controls sampled at 12, 18, 24 and 36 h based on the transcriptome data mentioned above. As expected, bothTD pairs did exhibit significantly higher synergistic expression levels than bothNotTD pairs (t test, p = 5.225 × 10⁻⁸). The trend also remains the same even when only recently generated (ks < 0.4) gene pairs were selected for analysis (t test, p = 9.653 × 10⁻⁵).
Furthermore, we further separately examined the gene expression profiles of V. vinifera cv. Cabernet Sauvignon fruits at three different developmental stages (enlargement, mid-ripe, and harvest ripe), and 10 different tissue types collected from flowers of V. vinifera cv Pinot noir plants grown in the vineyard (of which six tissue samples were collected from pre-anthesis flowers, namely calyptra, calyx, filament, anther, ovary and stigma, and four tissue samples were collected after anthesis: calyx, ovary, stigma, and embryo). Similarly, compared to bothNotTD pairs, bothTD pairs exhibited significantly higher synergistic expression levels whether in fruit or flowers (t test, p = 1.26 × 10⁻¹⁷ and 1.74 × 10⁻²¹, respectively). In addition, we also noticed that the number of significantly differentially expressed bothTD pairs was much lower than bothNotTD pairs in any above-mentioned treatments from leaves, flowers and fruits (Supplemental Table S12). Therefore, the above analysis based on wide variety of gene expression profiles confirmed our hypothesis that the position effect of TD genes is ubiquitous, and TD genes have a higher synergistic expression level than interspersed duplicated genes, irrespective of tissues or conditions.
Higher level of co-regulation and TF regulatory efficiency of TD genes are correlated with co-expression and co-response to stress
-
Given that gene expression is closely related to gene regulation, one intuitive explanation for the higher co-expression level of TD genes and, in particular, the higher co-response to stress, is that TD genes may have higher level of co-regulation and regulatory efficiency, compared with interspersed duplicated genes. Histone modifications represent the crux of epigenetic gene regulation essential for most biological processes in plants[70]. As one test of this, we examined the ChIP-seq data from young leaf tissue of V. vinifera cv. Pinot Noir grapes with antibodies to three modified histones (H3K4me3, H3K27ac, and H3K4me1) shown to fulfill important roles in eukaryotic organisms. The results indicated that TD genes have a significantly more consistent histone modification level than interspersed duplicated genes (t test, p = 1.871 × 10⁻¹¹), which is consistent with the significantly higher co-expression level.
The previous WGCNA analysis based on the expression data of grapes responding to P. viticola infection found that the TD genes tend to be at the core of the regulatory network. As another test, to further analyze how TD genes and interspersed duplicated genes respond to regulation, we focused on the WRKY TFs which play a key regulatory role in the core module (black module) of the regulatory network. A total of nine differentially expressed WRKY transcription factors, as well as 205 togetherTD-DEGs, 87 singleTD-DEGs and 269 notTD-DEGs which contain the WRKY binding site within 1 kb upstream of the start codon, were selected from all DEGs in the black module. Correlation analysis showed that togetherTD-DEGs had significantly higher co-expression level with WRKY transcription factors than singleTD-DEGs and notTD-DEGs (t test, p = 8.18 × 10⁻⁷ and 6.79 × 10⁻¹⁸, respectively; Fig. 6d & Supplemental Fig. S29). In addition, we also tested two differentially expressed MYB transcription factors (MYB15, VIT_05s0049g01020 and MYB13, VIT_05s0049g01010), as well as 205 togetherTD-DEGs, 93 singleTD-DEGs and 301 notTD-DEGs which contain the MYB binding site within 1 kb upstream of the start codon in the black module. Correlation analysis also yielded consistent results (t test, p = 0.00253 and 9.84e-06, respectively). Thus, these results suggest that TD genes can be regulated more efficiently by WRKY and MYB transcription factors.
The transcription factor VqWRKY31 has been shown to enhance powdery mildew resistance in grapevine through activation of salicylic acid defense signaling and promotion of specific disease resistance-related metabolite synthesis[47]. To further verify it is a general phenomenon that TD genes can be more efficiently regulated by TFs, we examined the DEGs in VqWRKY31-transgenic V. vinifera cv. Thompson Seedless compared with wild-type Thompson Seedless at 0 h and 24 h after powdery mildew infection, respectively, which is possible to exclude the interference of other factors and more directly peeked into the differences between TD genes and notTD genes due to one single transcription factor regulatory changes. Notably, at 0 h, all 2,801 DEGs were mediated by overexpression of VqWRKY31, including 966 TD-DEGs and 1835 notTD-DEGs, accounting for 18.1% (966/5,341) TD genes and 8.1% (1,835/22,637) notTD genes, respectively. We also observed very similar results at 24 h after powdery mildew infection, with 1,566 TD-DEGs and 3,871 notTD-DEGs, which accounted for 29.3% TD genes and 17.1% notTD genes, respectively. Thus, independent of whether the tissue was infected with powdery mildew or not, the number of differentially expressed TD genes mediated by VqWRKY31 was significantly higher (t test, p = 1.53 × 10−92 for 0 h and 8.77 × 10−85 for 24 h, respectively). Furthermore, TD genes always showed a significantly higher level of up-regulated expression than notTD genes (t test, p = 0.00155 for 0 h and 2.65e-11 for 24 h, respectively).
Relative expression balance facilitates the retention of the TD genes
-
Adequate expression of a gene is critical for the maintenance of its functional importance[68,69]. This appears to be detrimental to the long-term preservation of minor genes of AEDs, compared to major genes. However, the vast majority of RBHs are asymmetrically expressed (AED) in our transcriptome results. Therefore, we attempted to explore the mechanism for the preservation of minor genes of AEDs by comparing the differences in the differential expression of AED RBHs in V. vinifera leaves in response to P. viticola infection.
We selected a total of 172 bothTD RBHs and 160 bothNotTD RBHs which contained at least one DEG in response to P. viticola infection from all AED RBH pairs. Genes in AED RBHs with relatively high expression levels were designated as AED+, and those with relatively low expression levels as AED-. The results suggest that there were more differentially expressed AED+ genes compared to AED- genes in response to P. viticola infection, whether for bothTD RBHs or bothNotTD RBHs (Fig. 7a). Furthermore, there were slightly more AED+ genes differentially expressed at earlier time points (Supplemental Table S13). Moreover, the AED+ genes in bothTD RBHs were significantly differentially expressed in more treatments than the AED- genes in bothTD RBHs (Fig. 7a & b). In contrast, no significant difference was observed between the AED+ genes and the AED- genes in bothNotTD RBHs (Fig. 7a & b). However, compared to the AED+ genes, the AED- genes in bothTD RBHs clearly prevailed in terms of the magnitude of differential expression, with a significantly higher log2foldchange (t test, p = 0.00873; Fig. 7c & d). However, there is no significant difference in the magnitude of differential expression between AED+ and AED- genes in bothNotTD RBHs (t test, p = 0.271; Fig. 7c & d).
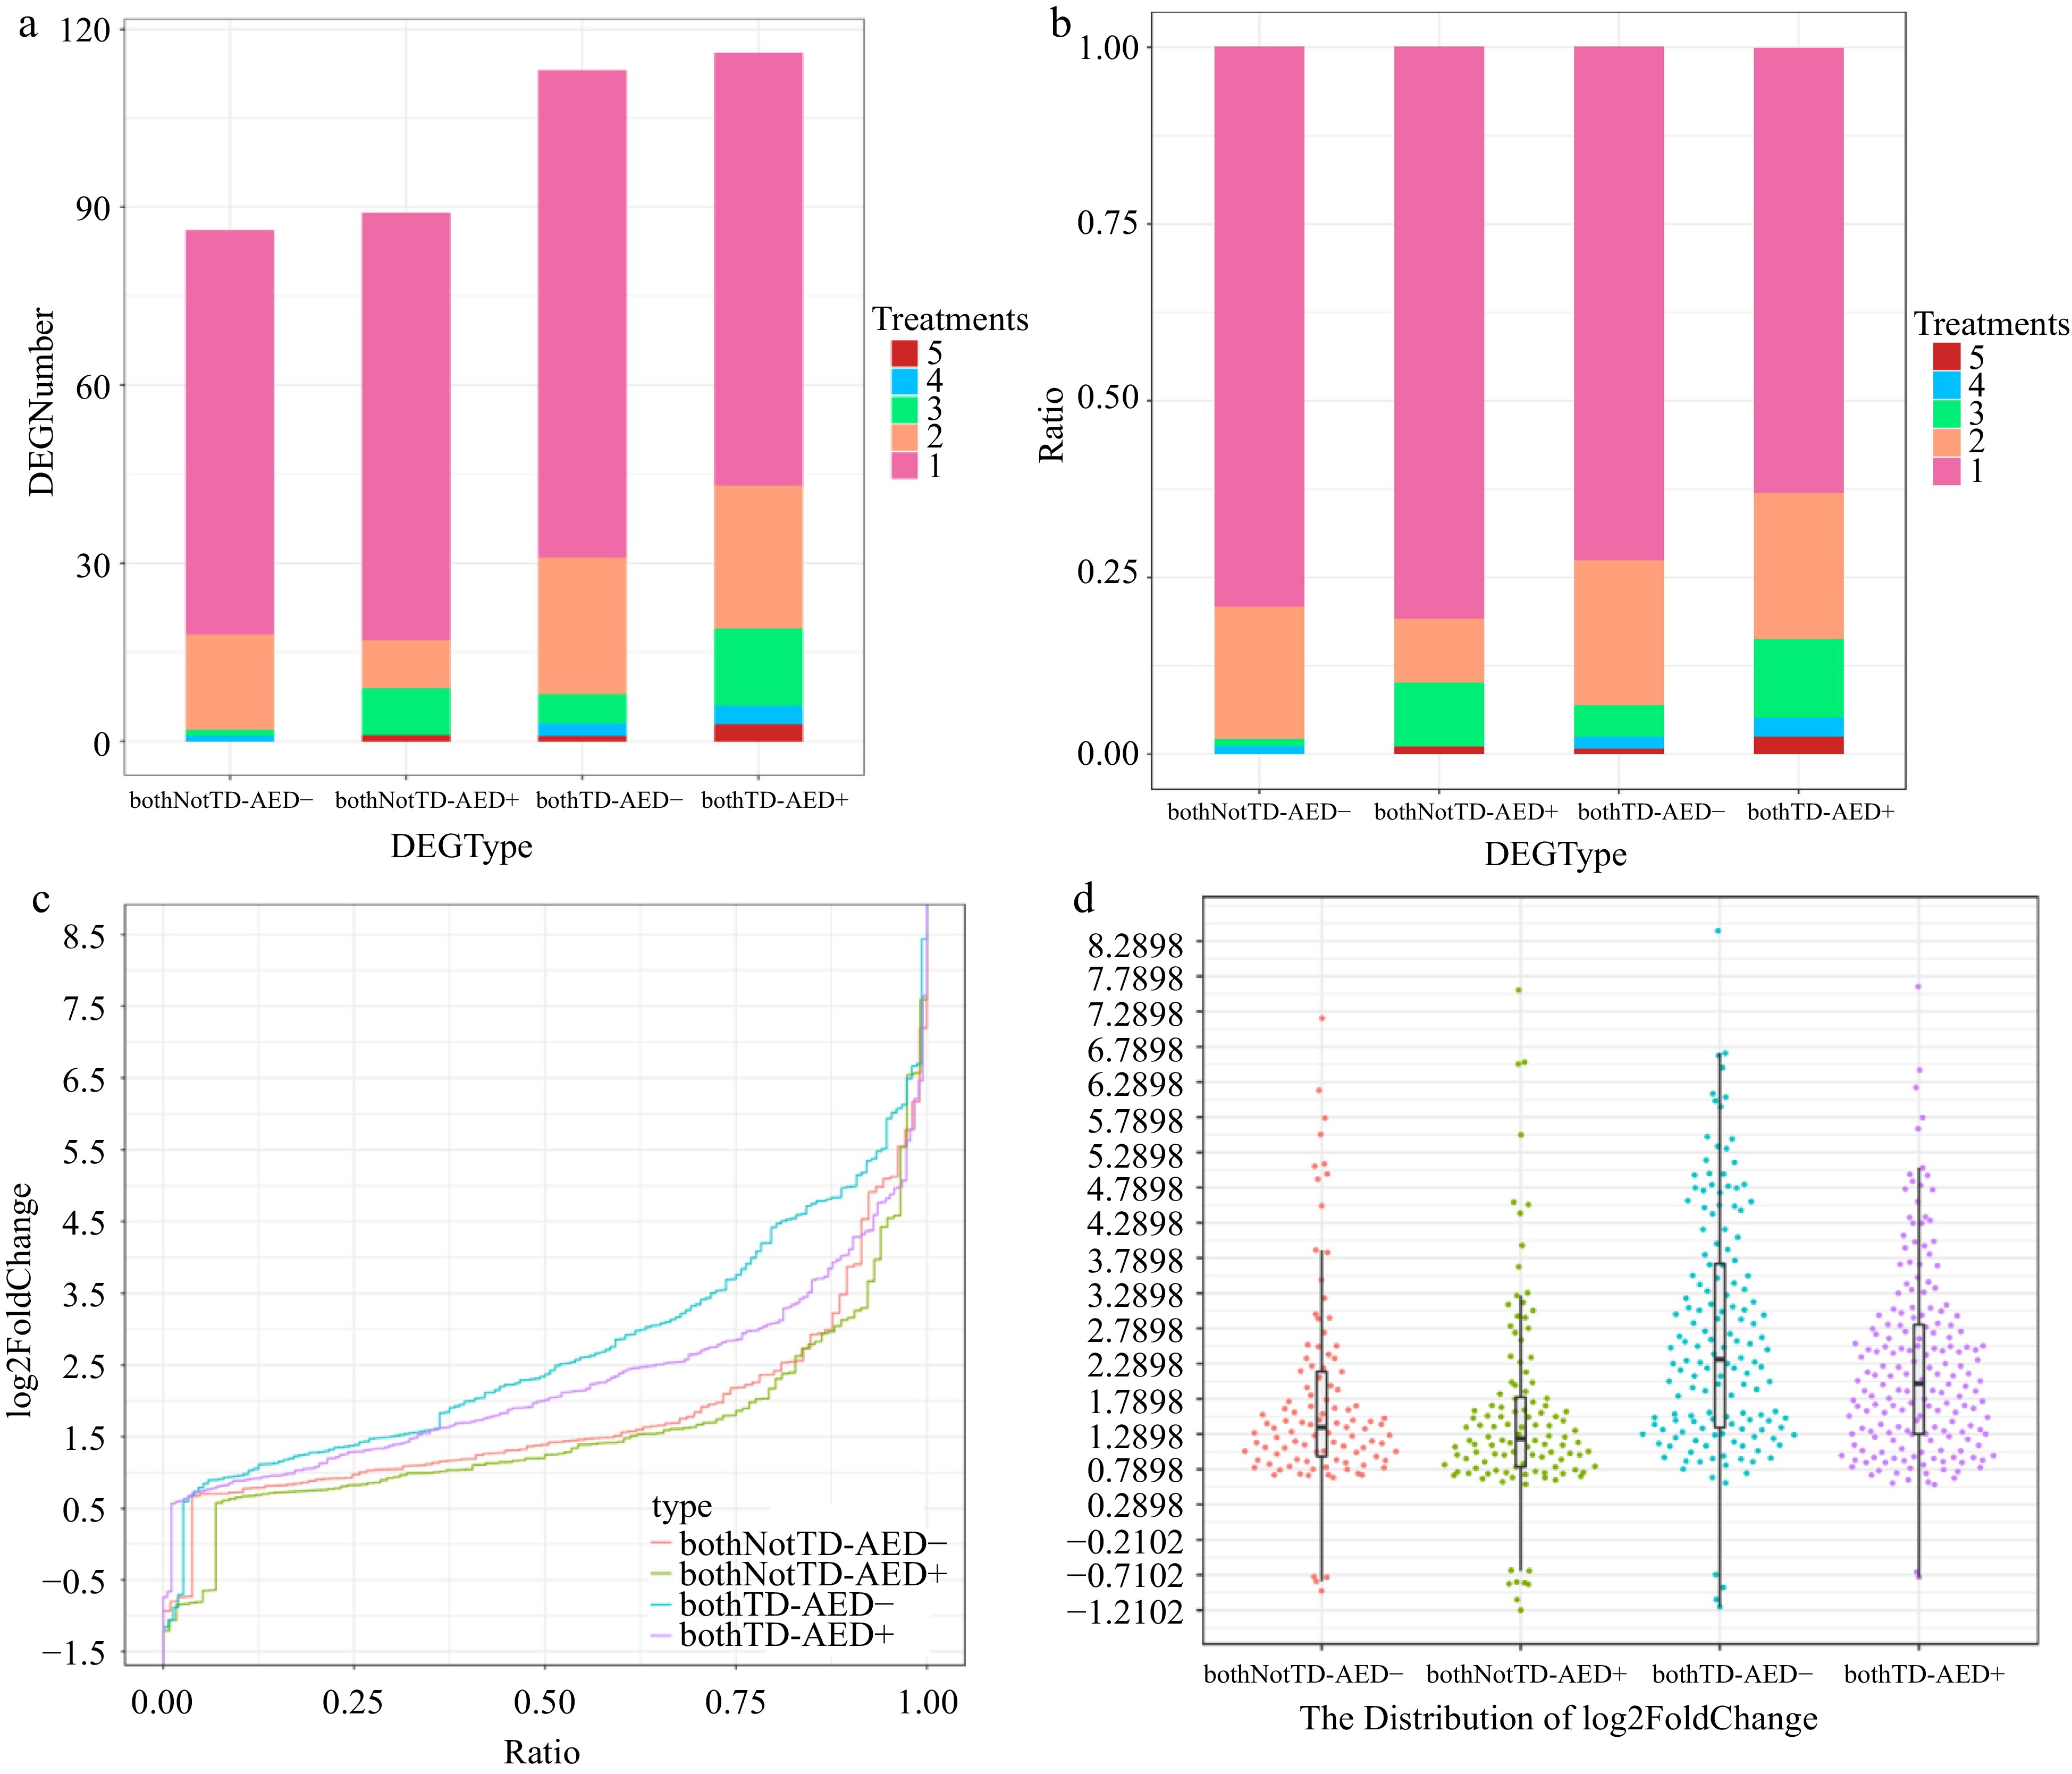
Figure 7.
Expression properties of DEGs in AED gene pairs. Distribution of various types of DEGs across different numbers of treatments. (a) By quantity. (b) By proportion. (c) Harp illustration of log2foldChange for various types of DEGs. (d) Overall distributions of log2foldChange for various types of DEGs. bothNotTD-AED-, differentially expressed AED- genes in bothNotTD pairs; bothNotTD-AED+, differentially expressed AED+ genes in bothNotTD pairs; bothTD-AED-, differentially expressed AED- genes in bothTD pairs; bothTD-AED+, differentially expressed AED+ genes in bothTD pairs.
-
In this study, we showed that gene tandem duplication mediated by LTR retrotransposons played a key role in the adaptive evolution of V. vinifera. Not only that, we also found that TD genes showed a position effect and synergistic effect, and their co-response and overactivity to biotic stress. The high co-expression pattern of these TD genes was suspected to be related to their sequence similarity and a higher transcription factor regulatory efficiency.
A better understanding of TD gene expression signatures will guide us in the prediction of which genes may be relatively more important from the same gene family. Our findings not only advance the understanding of the evolution of the V. vinifera genome. Based on the positional features of the target genes and/or the sequence characteristics within specific gene clusters, breeders can predict the gene activity, which can further guide phenotype prediction and the directional selection of target loci or genes, to achieve more enhanced traits in future crop breeding work. Furthermore, on the basis of these signatures, the promoter regions of specific genes within the gene clusters which are not synergistically expressed with others could be targeted for gene-editing, to make their sequences consistent with genes with higher activity, and then to better activate the specific gene clusters.
Tandem duplication leads to a higher local concentration of transcription factor binding sites and increases the binding frequency and efficiency of transcription factors[66,71], which may be the reason why TD genes can be more efficiently regulated by TFs. Our results suggest that TD genes which are closer to each other in proximity than interspersed duplicated genes, generally have a higher level of co-regulation such as histone modification, and can be more efficiently regulated by transcription factors. In addition, evidence from whole-genome chromosome conformation capture (Hi-C) studies in humans suggests that TD genes have higher connectivity than interspersed duplicated genes, including higher promoter-promoter interaction, which may reflect a tendency of coregulated genes to be transcribed simultaneously within transcription factories[68,71,72].
Although it is not certain that TD genes have more important molecular functions than interspersed duplicated genes, the results of our analysis reveal that tandem duplicated genes could have higher level of co-regulation, higher regulatory efficiency, and co-expression, especially efficient co-response to biotic stress. This more effective and appropriate expression is indeed important for environmental adaptation. It is conceivable that offspring with a greater accumulation of TD genes would have significant advantages in response to environmental stress, that their selective retention naturally became an inevitable choice for plant adaptive evolution. This may be why we found so many TD genes in the genome. Future analyses based on more species will help to further confirm the universality of the evolution dynamics of TD genes. And awareness of this will also accelerate our future breeding speed and efficiency.
Dose balance models of gene expression focus on the importance of maintaining the correct expression dose among different genes after gene duplication occurs[69,73,74], and provide a good explanation for why gene copies are preserved, because subsequent gene loss would disrupt the dose balance[69,75]. Our findings have shown that, compared to interspersed duplicated genes, among tandem duplicated genes, although the expression of the AED+ genes are dominant in many aspects, the AED- genes still have their own irreplaceable superiority, such as higher up-regulation fold. This seems to indicate that when a tandem duplicated gene is produced, the dosage balance between it and its copy may be maintained in this way, which may be beneficial to provide a relatively reduced constraint due to their combined expression[68,75,76]. This kind of dosage balance is conducive to making the roles of each tandem duplicated gene indispensable, thereby ensuring long-term survival, rather than being cleared. This is especially true for the AED- genes, opening the possibility for further functional differentiation in the future. Recent research has also found that, after the mutation of one gene copy, the other copy from the same family can compensate for its loss of function and ensure the robustness of the function[77]. The dosage balance between closely-adjacent tandem duplicated genes appears to be better than that between distant interspersed duplicated genes, which, we speculate, may also be related to their position and synergistic effect. In contrast, we surmise that those genes that are consistently relatively disadvantaged in expression, especially for interspersed disadvantaged genes, have a greater probability of being lost or pseudogenized in the future due to their less important functions. All these findings offer new understandings of the evolution of the grapevine genome as well as TD genes.
-
Genome sequences, gene sequences and general feature format (GFF) files of V. vinifera cv. PN40024 were downloaded from
https://urgi.versailles.inra.fr/Species/Vitis/Annotations . MrRPV1 is a typical TIR-NBS-LRR type DM disease resistance gene cloned from the wild North American grapevine species Muscadinia rotundifolia. Leaves of MrRpv1-transgenic Shiraz and wild-type Shiraz inoculated with DM sporangia or water at 12, 18, 24 and 36 h were used for transcriptome analysis. We subjected the expression data to pairwise comparisons, i.e., S_DM vs S_Mock and TS_DM vs TS_Mock, at different time points (https://www.nature.com/articles/s41438-021-00597-w ).Paired-end clean reads were aligned to the reference Grapevine genome PN40024 (GenBank assembly accession No: GCA_000003745.2) using TopHat v2.0.9. The proportion of unique mapped reads in all samples was very high (88.69%-91.26%, above 90% in most samples). To ensure the accurate quantification of the expression levels of homologous copies with similar sequences, only unique mapped reads were used for further analysis[68]. HTSeq v0.6.1 was used to count the read numbers mapped to each gene. DESeq R package (1.10.1) was used for differential expression analysis. Genes with an adjusted P-value < 0.05 were assigned as differentially expressed.
The expression profiles of 10 different tissues collected from flowers of V. vinifera cv Pinot noir plants grown in open fields, the ChIP-seq data from young leaf tissue of Pinot Noir grapes with antibodies to three modified histones (H3K4me3, H3K27ac, and H3K4me1), and the DEGs in VqWRKY31-transgenic V. vinifera 'Thompson Seedless' compared with wild-type 'Thompson Seedless' at 0 h and at 24 h after powdery mildew infection can be obtained from public data[47,65,78].
Identification and analysis of gene families and TD genes
-
Gene families were identified using OrthoMCL with default parameters based on blastp result generated by DIAMOND with the threshold of E-value of 1e-5 and min coverage ≥ 40%. The minimum gene family size is 1. KEGG enrichment analysis (p < 0.01) was performed using the OmicShare tools, a free online platform for data analysis (
https://www.omicshare.com/tools ). Maximum-likelihood trees were constructed using MEGA 7 (version 7.0.14) with the muscle and 100 bootstrap replicates for each alignment.Identification of NBS, TPS and STS genes
-
The gene domain were identified by pfam_scan.pl (
http://ftp.ebi.ac.uk/pub/databases/Pfam/Tools/ ) based on pfam (http://pfam.xfam.org/ ) database. Paircoil2 (http://cb.csail.mit.edu/cb/paircoil2/ ) was used to predict the parallel coiled coil (CC) fold from sequence. The genes with TIR (PF01582), NB-ARC (PF00931) and LRR domains were classified as TIR_NBS_LRR, genes with TIR (PF01582) and NB-ARC (PF00931) domains were classified as TIR_NBS, genes with NB-ARC (PF00931) and LRR domains were classified as NBS_LRR. The genes with CC structure, NB-ARC (PF00931) and LRR domain were classified as CC_NBS_LRR, genes with CC structure and NB-ARC (PF00931) domain were classified as CC_NBS, the remaining genes with only NB-ARC (PF00931) domain were classified as NBS. The gene with Terpene_synth (PF01397) and/or Terpene_synth_C (PF03936) domains was identified as TPS gene. The gene with Chal_sti_synt_N(PF00195.18) and/or Chal_sti_synt_C(PF02797.14) domains was identified as STS gene.Identification and analysis of RBH pairs and intact LTR retrotransposons
-
We performed an all-versus-all comparison of whole genome protein sequences to find reciprocal best hits (RBH) pairs using diamond with the threshold of E-value of 1e-5. Sequence alignment of CDS sequences of RBH pairs was performed using muscle, and finally Ks values between gene pairs were calculated using the YN model in KaKs_Calculator. Ks values >3.0 indicate saturated substitutions at synonymous sites and those gene pairs were excluded from further analysis. The Ks distribution was plotted and displayed using R (version 4.1.2). The significant differential expression analysis between two genes in the RBH gene pairs were performed using the original FPKM through the T test analysis tool provided by OmicShare tools (
https://www.omicshare.com/tools/ , FDR < 0.05).LTR_Finder v1.07 and LTRharvest v1.5.8[79,80] were used to perform de novo search for intact LTR retrotransposons against the genome sequences. The two ends of these LTR retrotransposons were aligned with MUSCLE v3.8.31[81] and the nucleotide divergence rate (λ) between the two LTRs was filtered when more than 0.75. The genetic distance (K) was calculated by K = -0.75ln(1-4λ/3).
Transposable elements annotation
-
Transposable elements (TEs) in the V. vinifera genome were searched by combining the de novo approach and the homology based approaches. For the de novo approach, we used RepeatModeler, LTR_FINDER (
http://tlife.fudan.edu.cn/ltr_finder/ ), Piler (http://www.drive5.com/piler/ ) and RepeatScout (http://www.repeatmasker.org/ ) to build a de novo repeat library. For the homology based approach, we used RepeatMasker (version 3.3.0) against the Repbase TE library and used RepeatProteinMask against the TE protein database, respectively.Transcription factors, TFBS prediction and analysis
-
The genome-wide annotation of MYB, ERF, NAC, WRKY transcription factors was based on plantTFDB, swissprot and pfam databases.
The 1 kb sequences in front of the start codon of all genes in the V. vinifera genome was extracted as the promoter sequence. Then, motif information files of plant TFs were downloaded from the JASPAR database (
https://jaspar.genereg.net/downloads/ ). Finally, using the local FIMO subprogram of MEME (https://meme-suite.org/meme/tools/fimo ), the prediction results of TF binding sites (TFBS) in the promoter region of the whole genome were obtained. Combining TFBS results and LTR results, TFBS located within LTR were identified using bedtools.Histone modification level analysis
-
The three histone modification levels of each gene were measured separately by the total peak length (the sum of the peak length of all peaks located in the gene region and the 1 kb promoter region, results for three histones are calculated separately). Correlations of histone modification levels between gene pairs were then analyzed.
Data availability
-
Genome sequences, gene sequences and general feature format (GFF) files of V. vinifera cv. PN40024 can be downloaded from
https://urgi.versailles.inra.fr/Species/Vitis/Annotations . The raw transcriptome sequencing data relevant to this study can be found at the NCBI repository under the following accession number: PRJNA706058. We thank Ian Dry (CSIRO) for his professional language polishing and Hainan Zhao and Kui Li for their advice on manuscript writing. This work was supported by the National Natural Science Foundation of China (Grant No. 31860493), the Special Fund for the Central Government Guides Local Science and Technology Development (Guike ZY21195039), Guangxi Key R&D Program Project (GuiKe AB21076001) and the Science and Technology Development Fund of Guangxi Academy of Agricultural Sciences (2021YT121).
-
The authors declare that they have no conflict of interest.
- Supplemental Fig. S1 Number of gene clusters and chromosomal distribution of TD genes from different families.
- Supplemental Fig. S2 Distribution of TD genes in phenylpropanoid biosynthesis (map00940) pathway.
- Supplemental Fig. S3 Distribution of TD genes in flavonoid biosynthesis (map00941) pathway.
- Supplemental Fig. S4 Distribution of TD genes in plant hormone signal transduction (map04075) pathway.
- Supplemental Fig. S5 Distribution of TD genes in plant-pathogen interaction (map04626) pathway.
- Supplemental Fig. S6 Distribution of TD genes and notTD genes among all genes and DEGs, respectively. By quantity.
- Supplemental Fig. S7 Statistics on the number of notTD-DEGs and TD-DEGs distributed in different number of treatments. By proportion.
- Supplemental Fig. S8 The heat map of log2foldchange (DM vs. Mock) of notTD-DEGs and TD-DEGs in different treatments.
- Supplemental Fig. S9 Overall distributions of log2foldChange (DM vs. Mock) for TD-DEGs and notTD-DEGs.
- Supplemental Fig. S10 Modules distribution of TD-DEGs and notTD-DEGs of WGCNA analysis. (A) by quantity. (B) by proportion.
- Supplemental Fig. S11 Distribution of TD genes and notTD genes among all genes and DEGs in 84 families containing both TD-DEGs and notTD-DEGs, respectively. By proportion (t test, p = 0.000503).
- Supplemental Fig. S12 Statistics on the number of notTD-DEGs and TD-DEGs distributed in different number of treatments in 84 families containing both TD-DEGs and notTD-DEGs. By proportion.
- Supplemental Fig. S13 The heat map of log2foldchange (DM vs. Mock) of notTD-DEGs and TD-DEGs in different treatments in 84 families containing both TD-DEGs and notTD-DEGs.
- Supplemental Fig. S14 Harp illustration (A) and Overall distributions (B) of log2foldChange (DM vs. Mock) for TD-DEGs and notTD-DEGs in 84 families containing both TD-DEGs and notTD-DEGs (t test, p =5.95e-05).
- Supplemental Fig. S15 Scatterplot of KEGG enrichment for different types of recently duplicated RBH pairs. (A) all pairs. (B) bothTD pairs. (C) bothNotTD pairs.
- Supplemental Fig. S16 The genetic distance (K) distribution of inserted LTRs in the V. vinifera genome.
- Supplemental Fig. S17 Statistics on the number of notTD-DEGs, singleTD-DEGs and togetherTD-DEGs distributed in different number of treatments. By quantity.
- Supplemental Fig. S18 The heat map of log2foldchange (DM vs. Mock) of singleTD-DEGs and togetherTD-DEGs in different treatments.
- Supplemental Fig. S19 Modules distribution of singleTD-DEGs and togetherTD-DEGs of WGCNA analysis. By quantity.
- Supplemental Fig. S20 The maximum-likelihood trees of the protein sequence (A) and the 1000 nt upstream of the transcription start sites (B) of 42 tandem duplicated STS genes in gene clusters of G34 families.
- Supplemental Fig. S21 The maximum-likelihood trees of the protein sequence (A) and the 1000 nt upstream of the transcription start sites (B) of all TD genes in gene clusters of G104 families.
- Supplemental Fig. S22 The maximum-likelihood trees of the protein sequence (A) and the 1000 nt upstream of the transcription start sites (B) of all TD genes in gene clusters of G37 families.
- Supplemental Fig. S23 The maximum-likelihood trees of the protein sequence (A) and the 1000 nt upstream of the transcription start sites (B) of all TD genes in gene clusters of G46 families.
- Supplemental Fig. S24 The Sequence similarity Distribution of the protein sequence (A) and the 1000 nt upstream of the transcription start sites (B) of togetherTD-DEGs RBHs and singleTD-DEG RBHs.
- Supplemental Fig. S25 Classification of RBH gene pairs by expression patterns.
- Supplemental Fig. S26 Overall distributions of expression correlations for bothTD pairs and bothNotTD pairs, respectively.
- Supplemental Fig. S27 Expression properties of recently generated bothTD and bothnotTD RBH pairs.
- Supplemental Fig. S28 Overall distributions of expression correlations for all bothNotTD-DEG RBH pairs, singleTD-DEG RBH pairs and togetherTD-DEGs RBH pairs, respectively.
- Supplemental Fig. S29 Harp illustration of expression correlations between differentially expressed WRKY transcription factors and NotTD-DEGs, singleTD-DEGs, togetherTD-DEGs containing WRKY TFBSs in black module, respectively.
- Supplemental Table S1 Various statistics about the TD genes.
- Supplemental Table S2 The overview of TD genes significantly enriched in metabolic pathways associated with flavor and biotic stress.
- Supplemental Table S3 important TD genes information.
- Supplemental Table S4 Distribution of 584 TD-DEGs and 746 notTD-DEGs.
- Supplemental Table S5 The module distribution of 584 TD-DEGs and 746 notTD-DEGs.
- Supplemental Table S6 Distribution of all genes and DEGs in 84 families containing both TD-DEGs and notTD-DEGs.
- Supplemental Table S7 Distribution of 310 TD-DEGs and 144 notTD-DEGs in 84 families containing both TD-DEGs and notTD-DEGs.
- Supplemental Table S8 Ks distribution of different type RBH pairs.
- Supplemental Table S9 Distribution of 377 togetherTD-DEGs and 207 singleTD-DEGs.
- Supplemental Table S10 The module distribution of 377 togetherTD-DEGs and 207 singleTD-DEGs.
- Supplemental Table S11 Expression Comparison of different RBHs in 5 families containing both togetherTD-DEGs RBHs and singleTD-DEG RBHs.
- Supplemental Table S12 The number of significantly differentially expressed bothTD pairs and bothNotTD pairs.
- Supplemental Table S13 Distribution of DEGs in AED pairs.
- Copyright: © 2023 by the author(s). Published by Maximum Academic Press, Fayetteville, GA. This article is an open access article distributed under Creative Commons Attribution License (CC BY 4.0), visit https://creativecommons.org/licenses/by/4.0/.
-
About this article
Cite this article
Qu J, Liu L, Guo Z, Li X, Pan F, et al. 2023. The ubiquitous position effect, synergistic effect of recent generated tandem duplicated genes in grapevine, and their co-response and overactivity to biotic stress. Fruit Research 3:16 doi: 10.48130/FruRes-2023-0016 

The ubiquitous position effect, synergistic effect of recent generated tandem duplicated genes in grapevine, and their co-response and overactivity to biotic stress
- Received: 04 May 2023
- Accepted: 25 June 2023
- Published online: 13 July 2023
Abstract: Tandem gene duplication is an important process in plant adaptive evolution, but the generation mechanism and expression characteristics of tandem duplicated (TD) genes and their roles in plant stress response have not been rigorously investigated. Here, we take grapevine (V. vinifera) as an example to show that recent large-scale tandem gene duplication, mediated by long terminal repeat retrotransposons, promotes the expansion of specific gene families involved in response to biotic stress, biosynthesis of various secondary metabolites and adaptive evolution. More importantly, compared with interspersed duplicated genes, TD genes exhibit a position and synergistic effect, and multifaceted overactivity and play key roles in response to biotic stress caused by pathogens such as P. viticola (downy mildew) and Erysiphe necator (powdery mildew). The higher co-expression level of TD genes is not only reflected in the co-response to biotic stress, but also universal in various tissues and developmental stages. This may be related to a higher level of co-regulation and a higher transcription factor regulatory efficiency, as well as sequence similarity within gene clusters. Moreover, most TD genes are expressed asymmetrically, while maintaining a relative balance, which may be beneficial for the retention and functional differentiation of the TD genes. These findings not only advance our understanding of the evolution of the V. vinifera genome and the evolution dynamics of the TD genes which has often been overlooked, but also provide guidance for the directional selection in breeding work.