-

Figure 1.
(a) Anthocyanins' biosynthesis pathway in plants. PAL: L-phenylalanine ammonia-lyase; 4CL: 4-coumarate: coenzyme A Ligase; CHS: chalcone synthase; C4H: cinnamate 4-hydrogenase; GST: glutathione S-transferase; UFGT: UPD-3-O- glycosyltransferase; CHI: chalcone isomerase; F3H: flavanone-3-hydroxylase; FLS: flavonol synthase; DFR: dihydroflavonol 4-reductase; ANS: leucoanthocyanidin dioxygenase. (b) Cross-sectional images of fruits at various phases of development of both purple and yellow passion fruits.
-
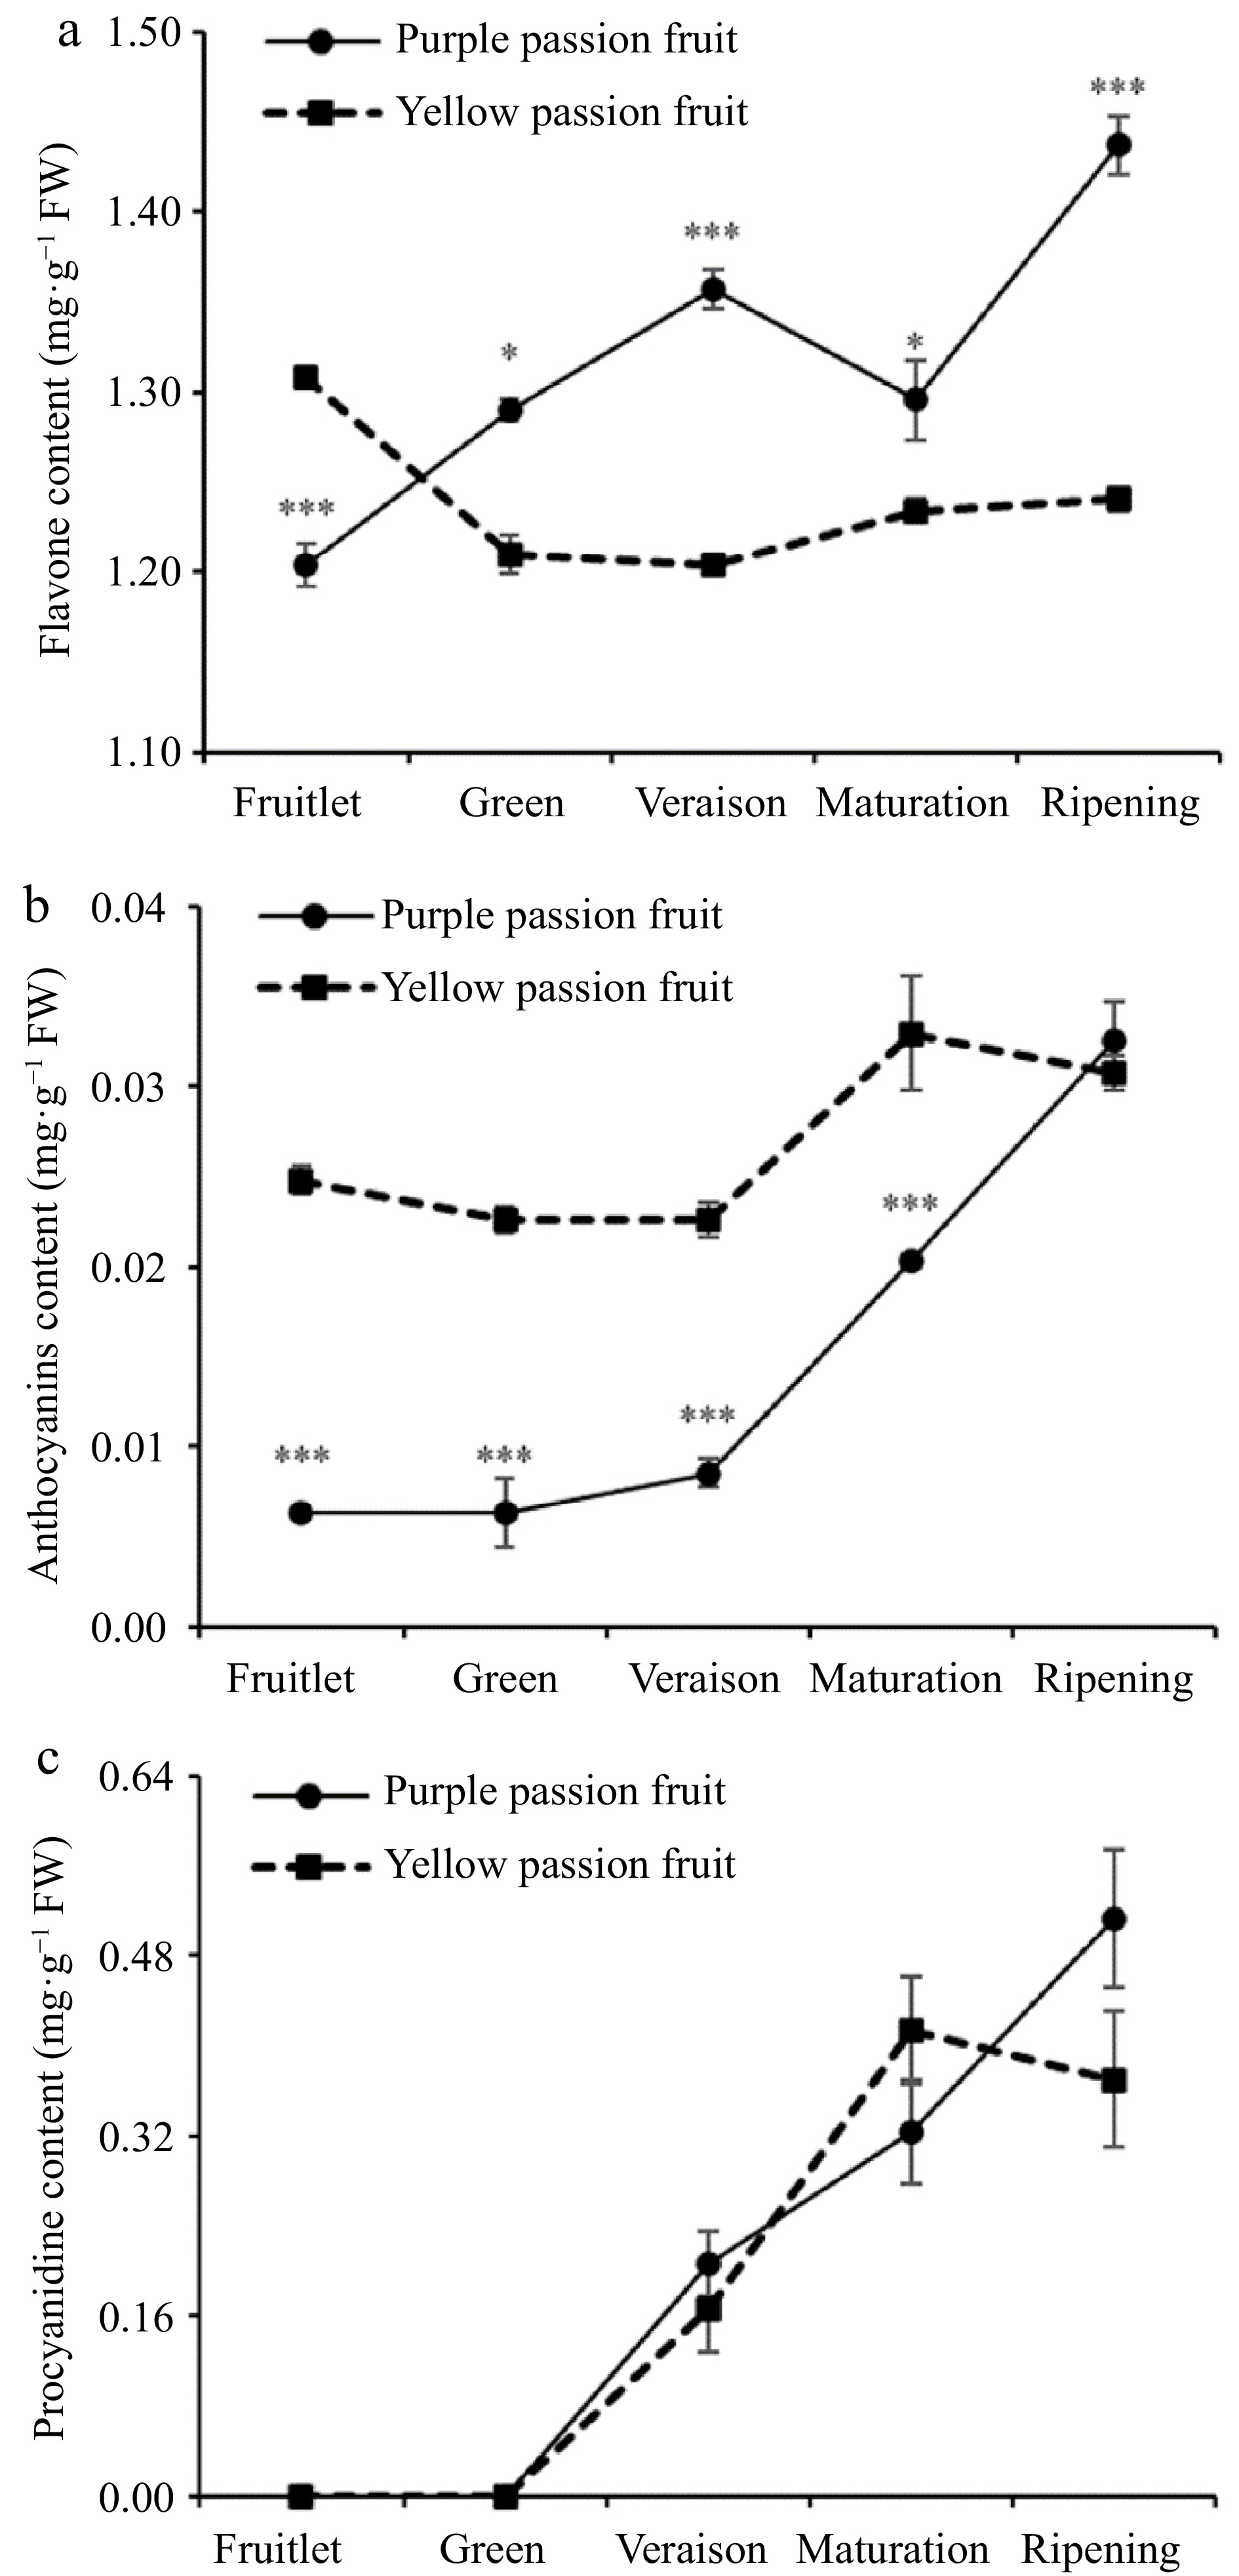
Figure 2.
Alterations in the levels of (a) total flavonoids, (b) anthocyanin, and (c) procyanidins found in the pulp of yellow and purple passion fruit as the fruit matures. Vertical bars indicate means ± SD (n = 3, 5 fruits per replicate). According to Student's t-test, the significance is indicated by the symbols *, **, and *** when the corresponding values for p are less than 0.05, 0.01, and 0.001, respectively.
-
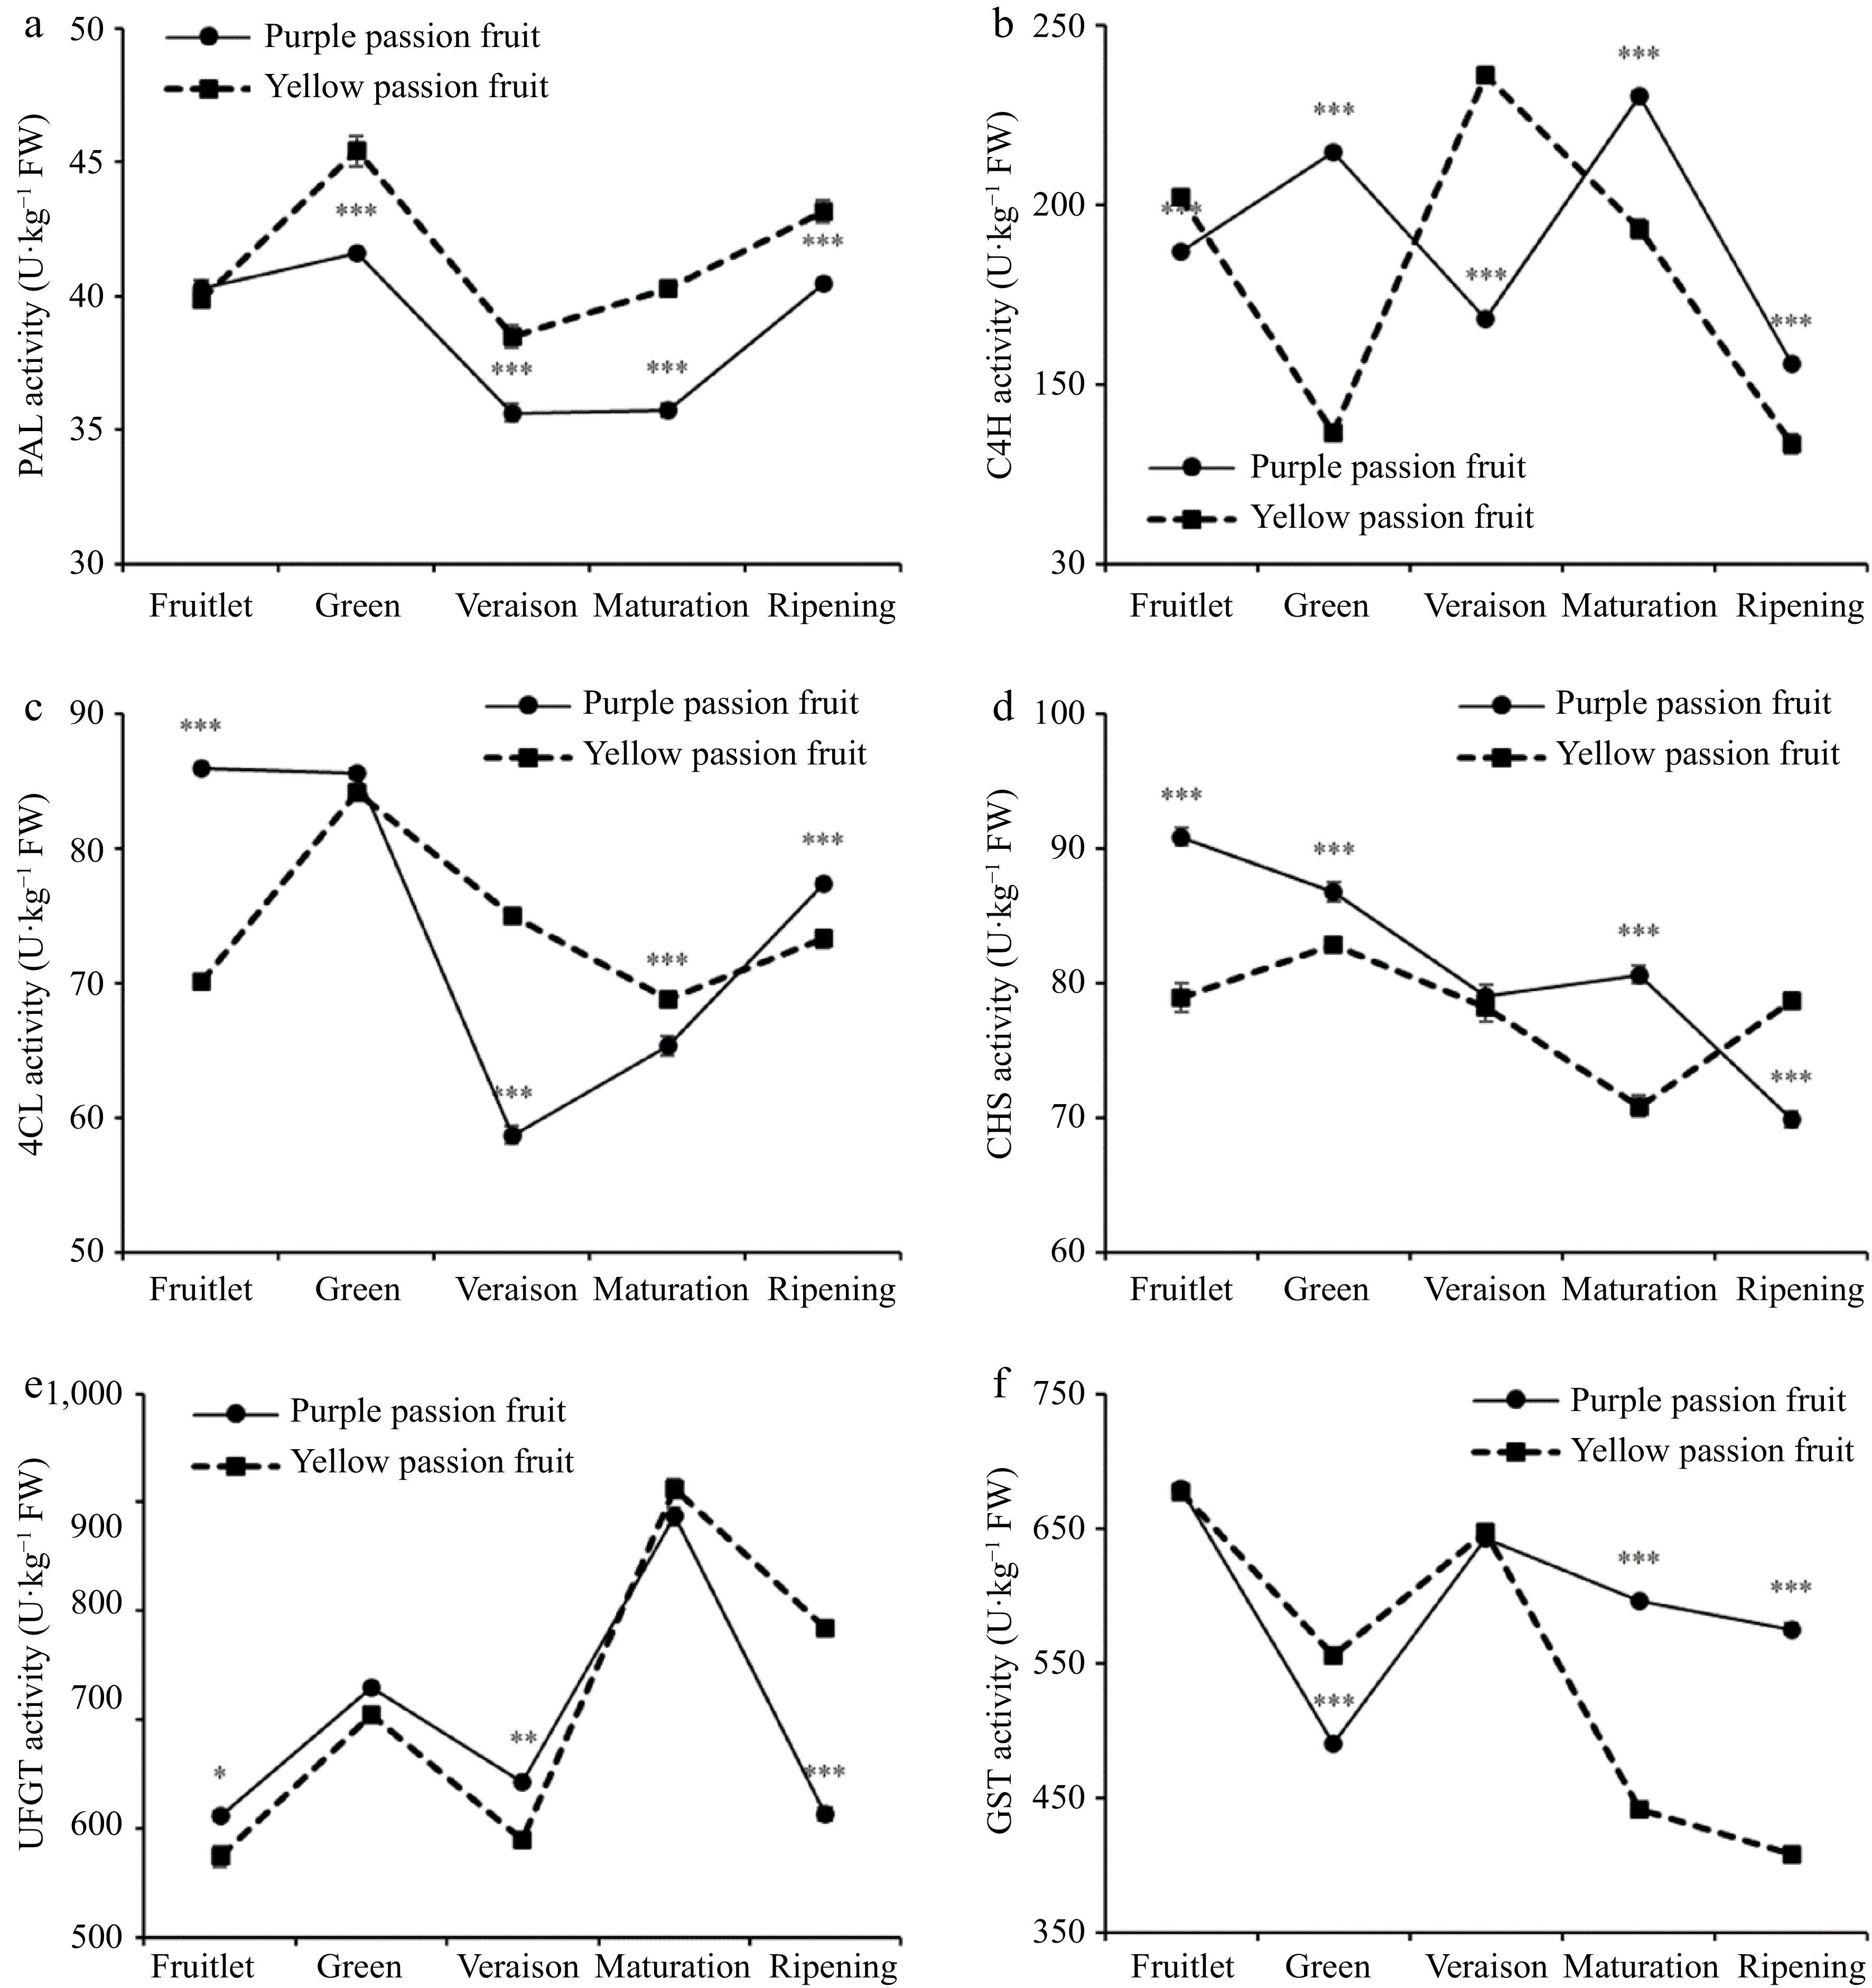
Figure 3.
Alterations in the PAL, C4H, 4CL, UFGT and GST activities of the purple and yellow passion fruits throughout the fruit's growth and development. Vertical bars indicate means ± SD (n = 3, 5 fruits per replicate). According to Student's t-test, the significance is indicated by the symbols *, **, and *** when the corresponding values for p are less than 0.05, 0.01, and 0.001, respectively.
-
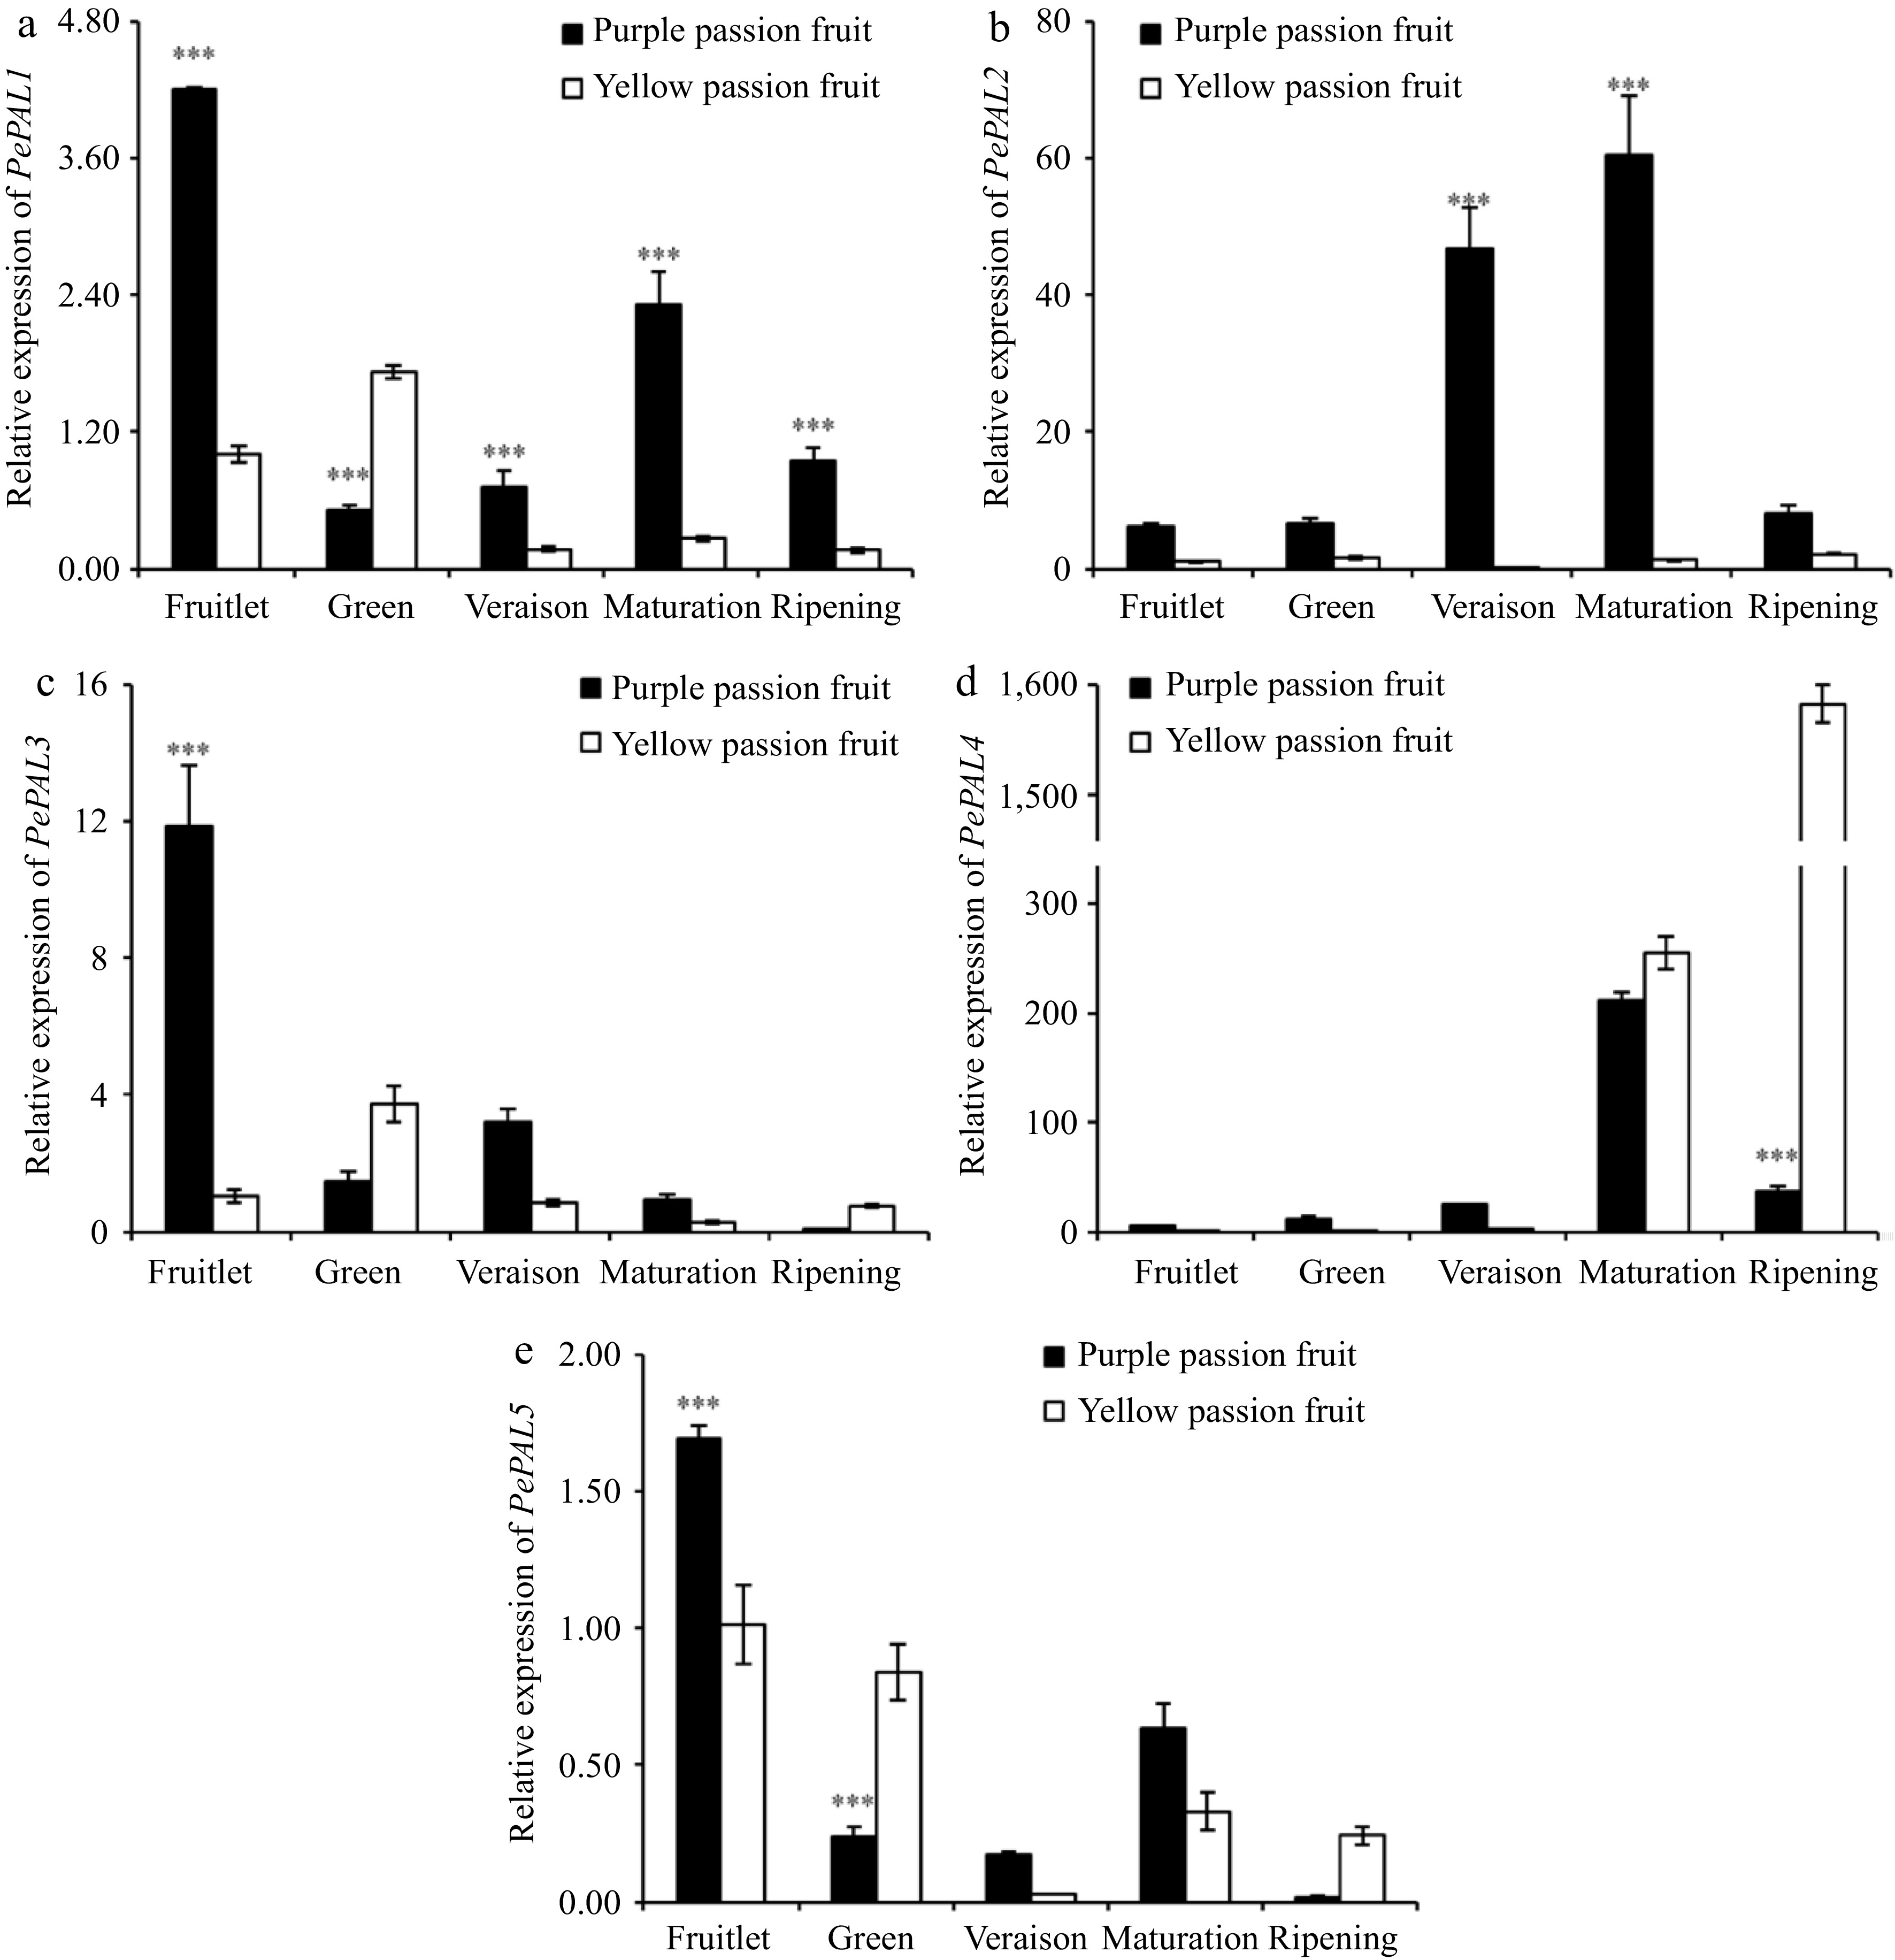
Figure 4.
Relative expressions of PAL genes in fruit pulp of purple and yellow passion fruit during fruit development. Vertical bars indicate means ± SD (n = 3, 5 fruits per replicate). According to Student's t-test, the significance is indicated by the symbols *, **, and *** when the corresponding values for p are less than 0.05, 0.01, and 0.001, respectively.
-

Figure 5.
Relative expression of C4H gene in fruit pulp of purple and yellow passion fruit during fruit development. Vertical bars indicate means ± SD (n = 3, 5 fruits per replicate). According to Student's t-test, the significance is indicated by the symbols *, **, and *** when the corresponding values for p are less than 0.05, 0.01, and 0.001, respectively.
-
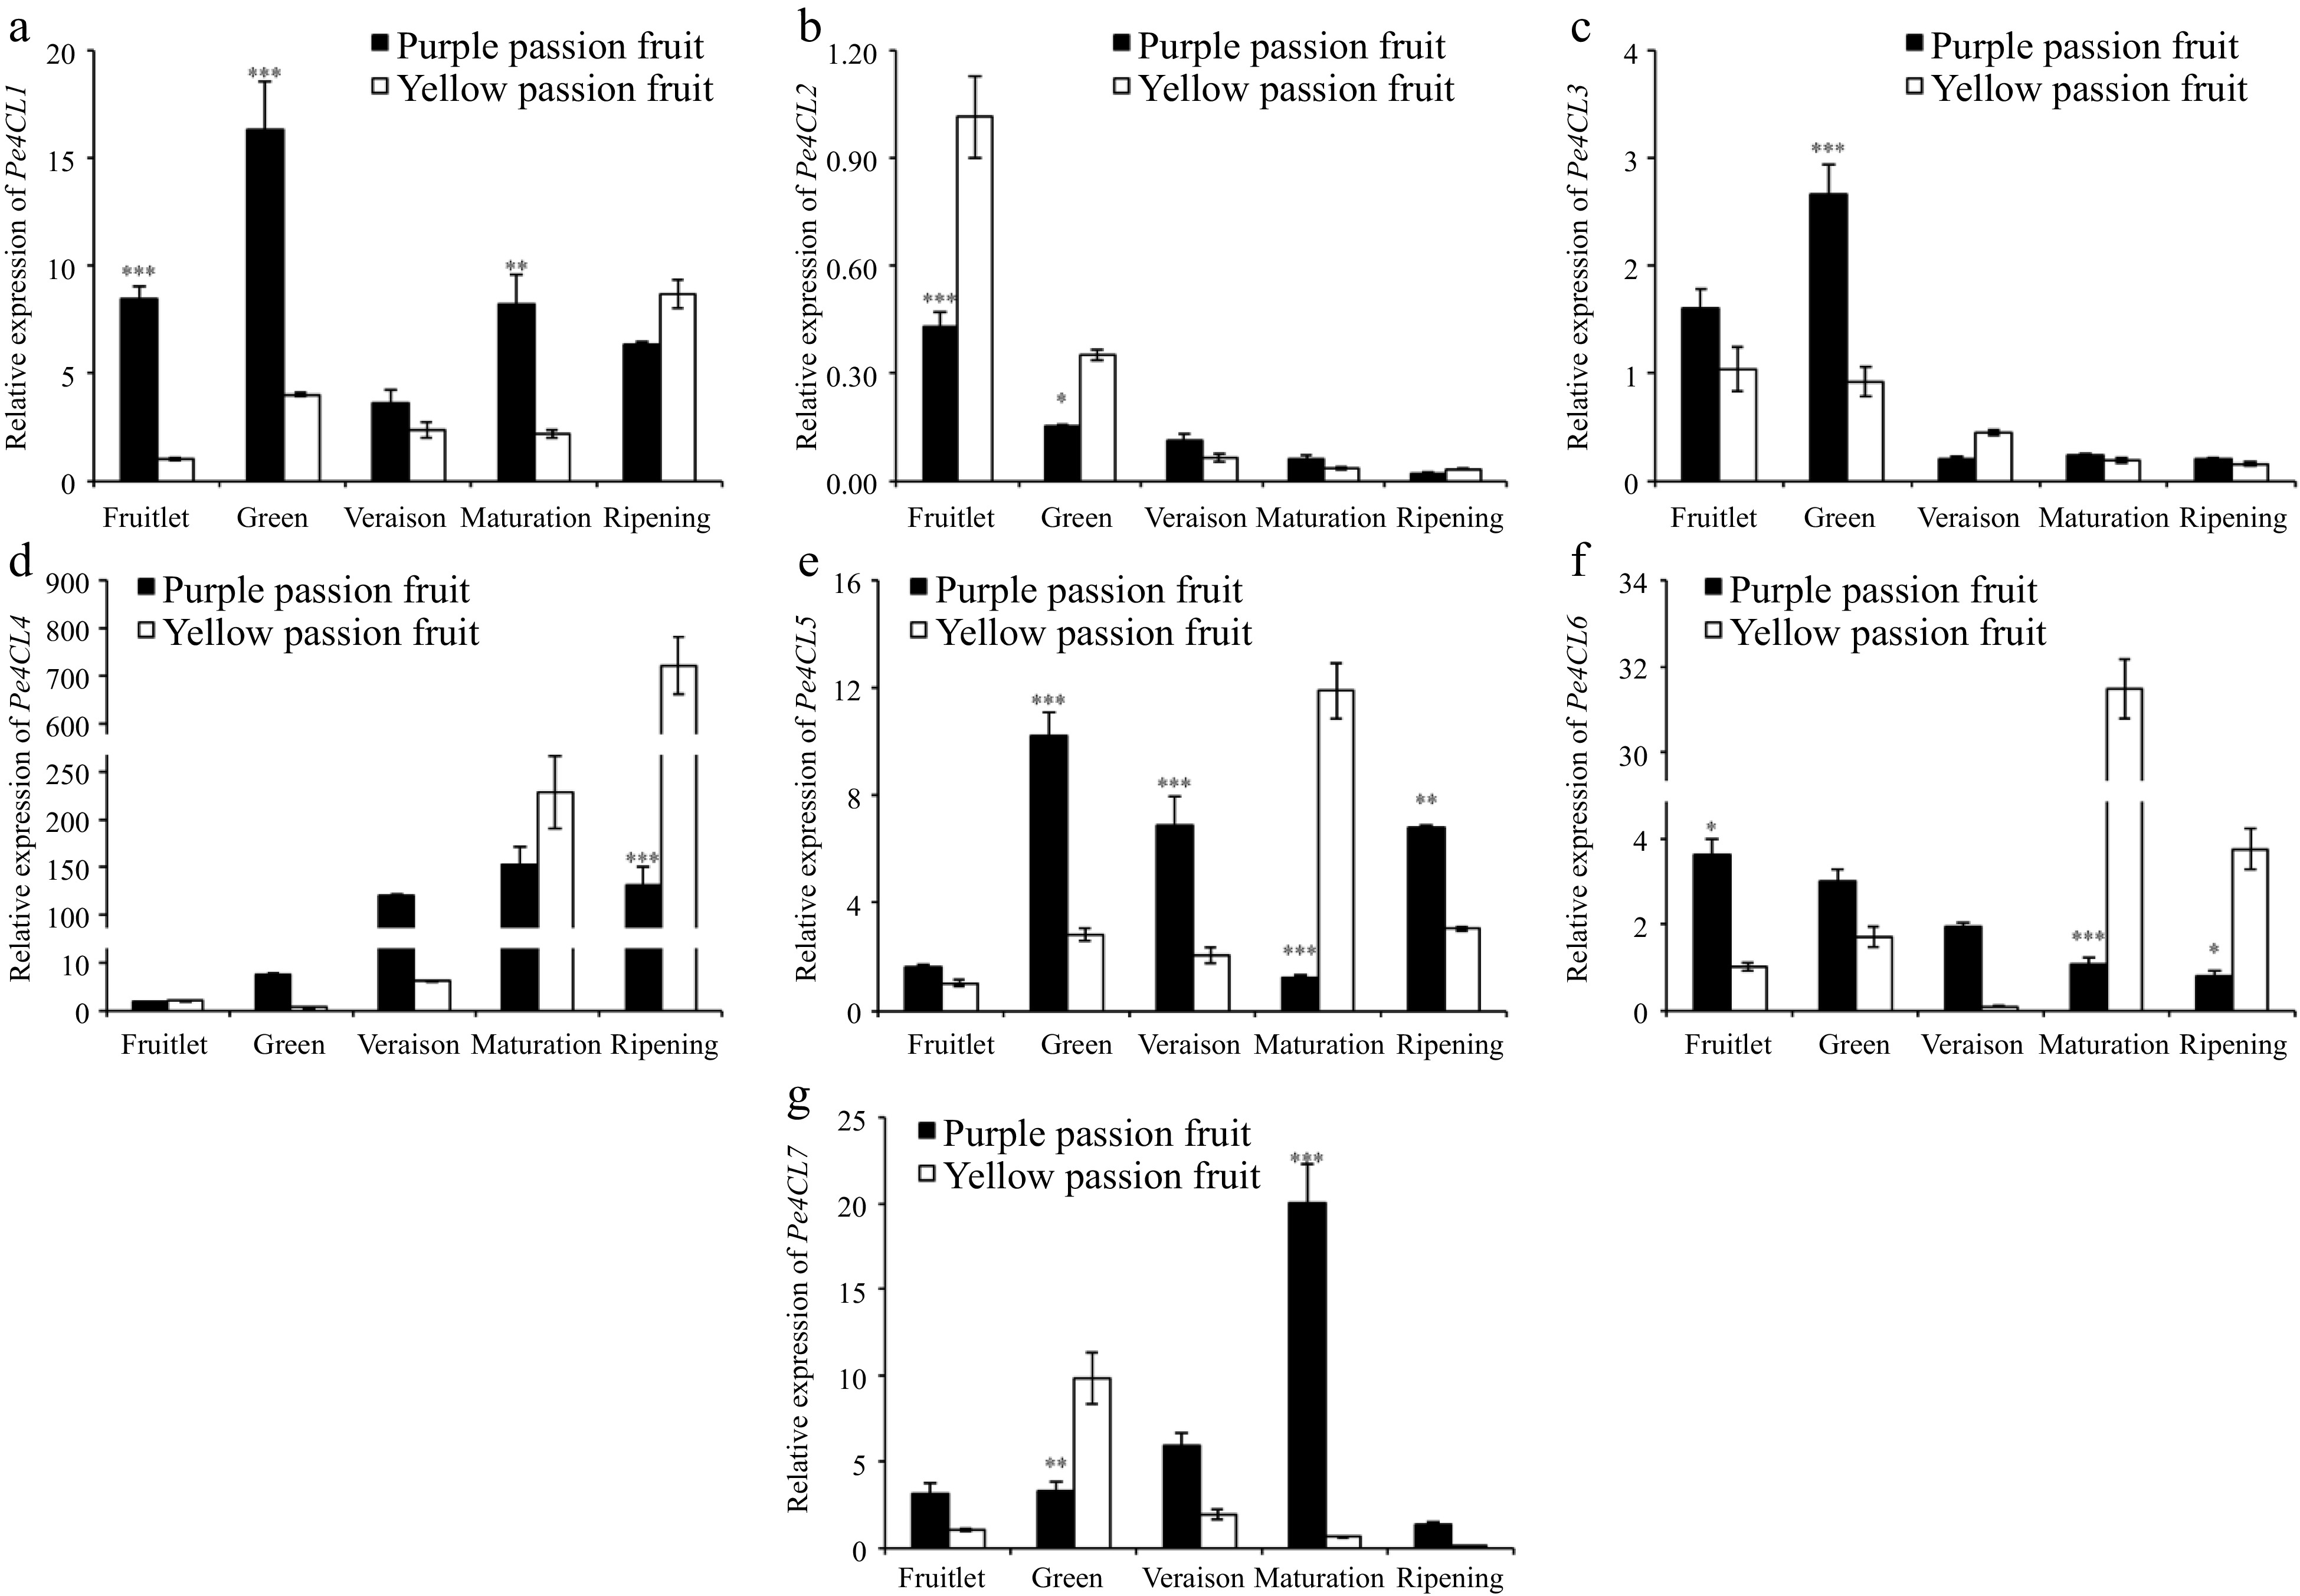
Figure 6.
Relative expressions of 4CL genes in fruit pulp of purple and yellow passion fruit during fruit development. Vertical bars indicate means ± SD (n = 3, 5 fruits per replicate). According to Student's t-test, the significance is indicated by the symbols *, **, and *** when the corresponding values for p are less than 0.05, 0.01, and 0.001, respectively.
-
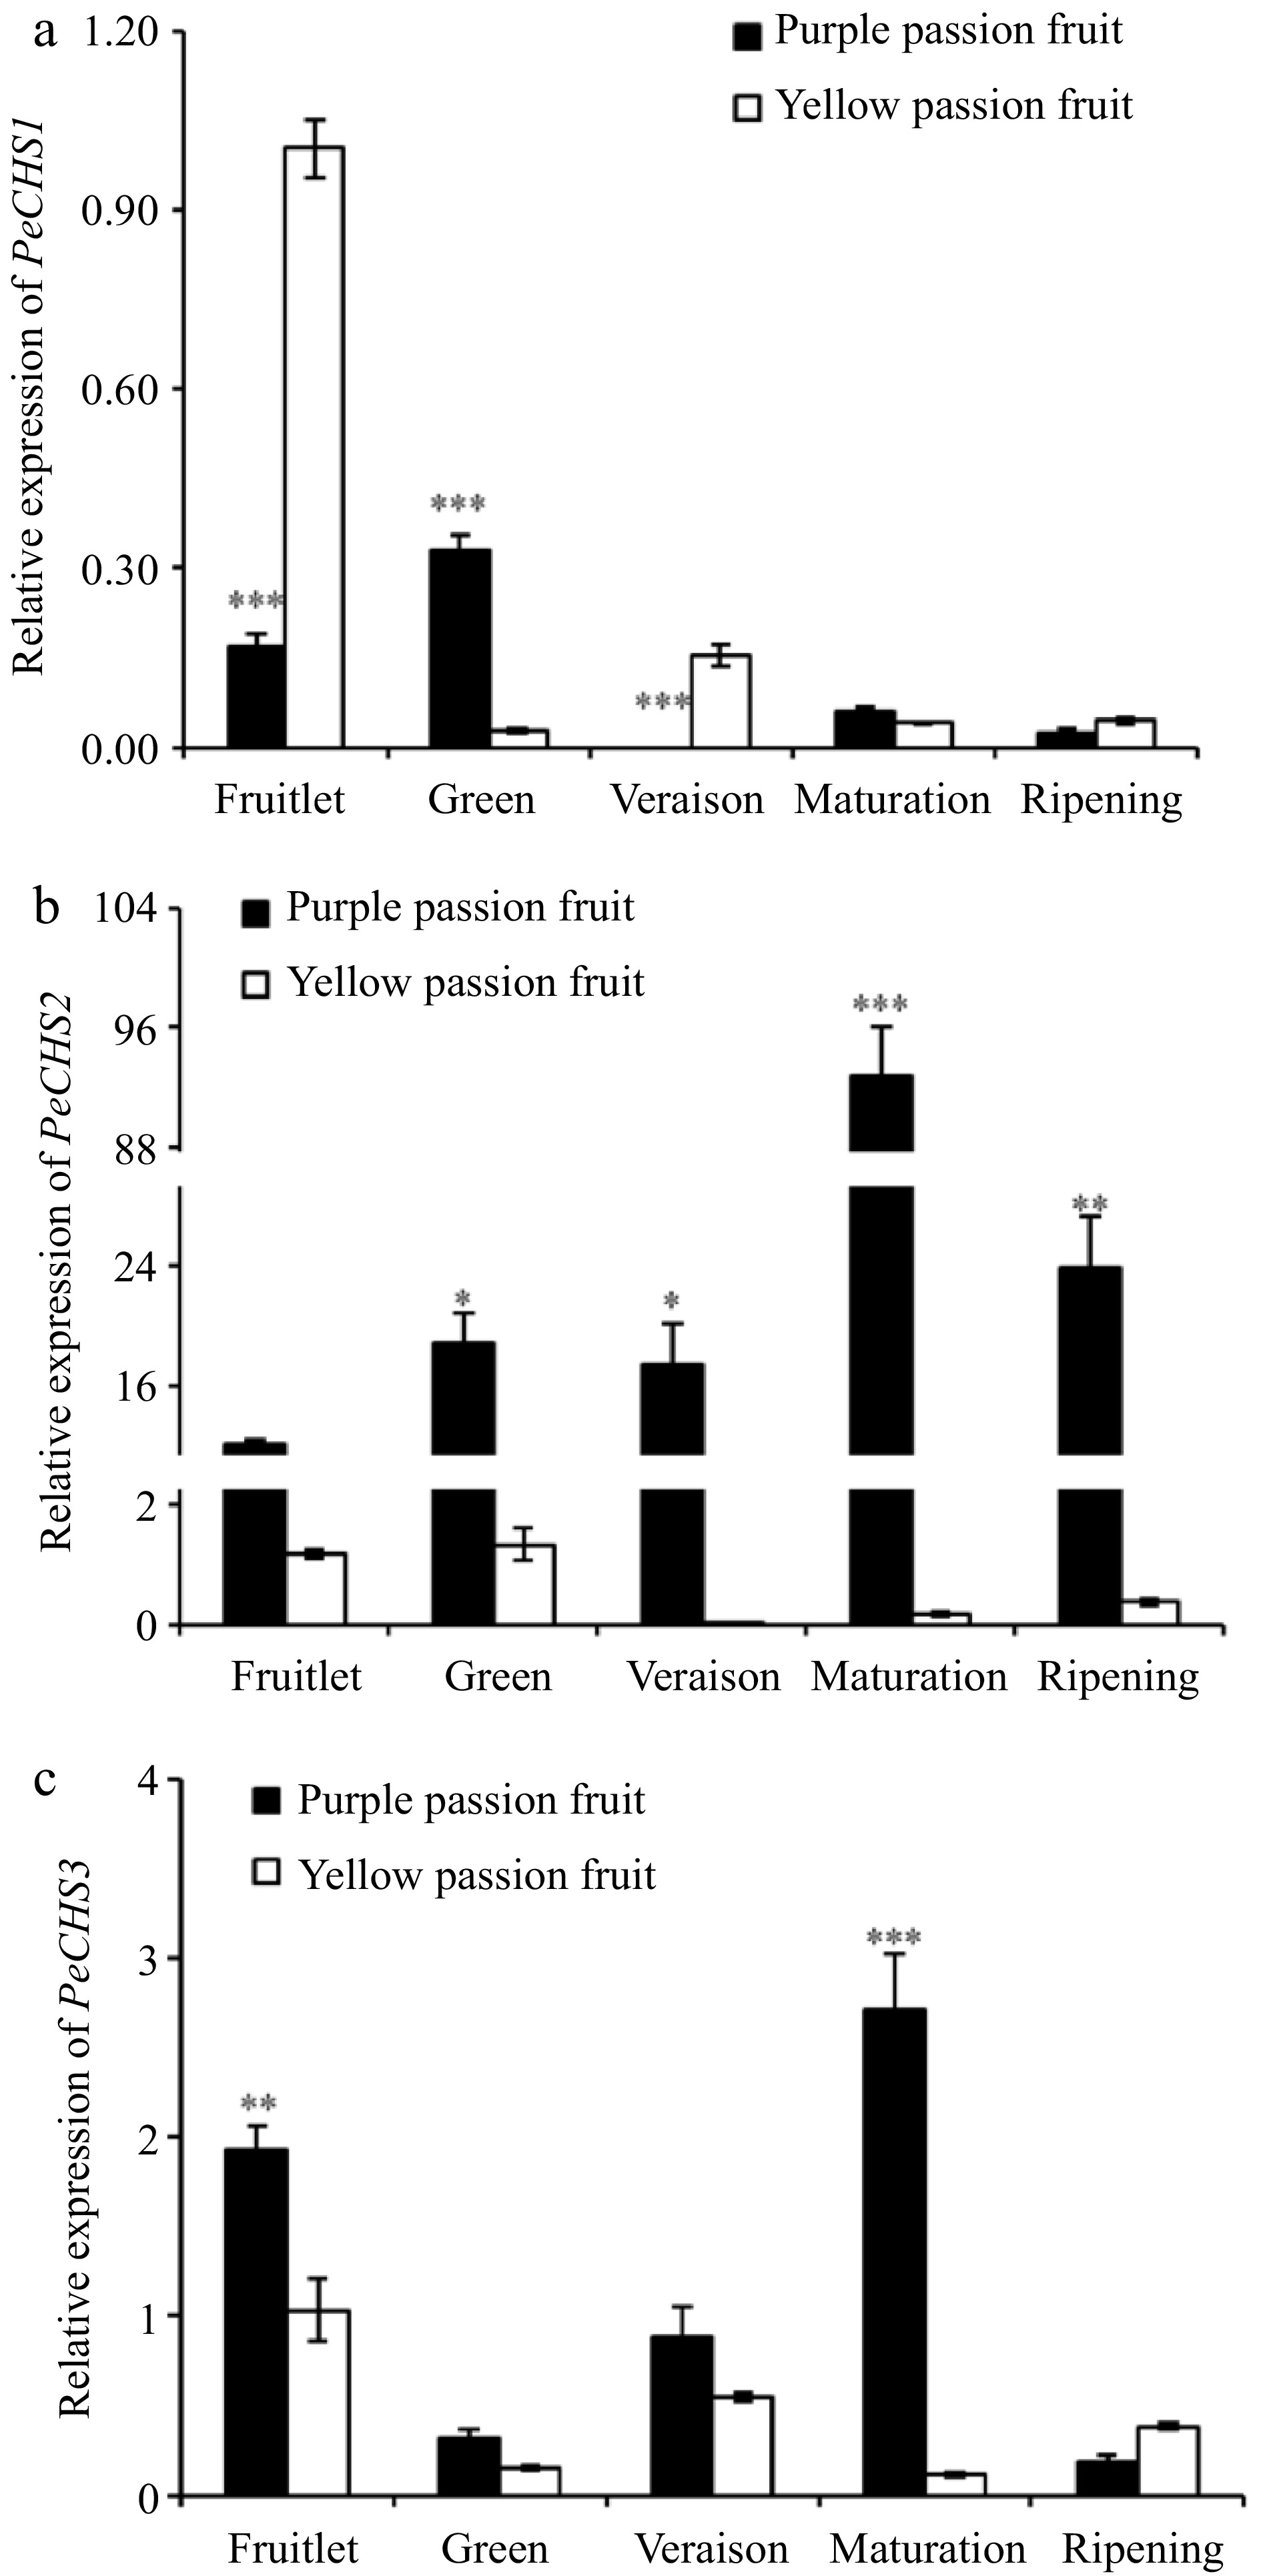
Figure 7.
Relative expressions of CHS genes in fruit pulp of purple and yellow passion fruit during fruit development. Vertical bars indicate means ± SD (n = 3, 5 fruits per replicate). According to Student's t-test, the significance is indicated by the symbols *, **, and *** when the corresponding values for p are less than 0.05, 0.01, and 0.001, respectively.
-

Figure 8.
Relative expressions of UFGT genes in fruit pulp of purple and yellow passion fruit during fruit development. Vertical bars indicate means ± SD (n = 3, 5 fruits per replicate). According to Student's t-test, the significance is indicated by the symbols *, **, and *** when the corresponding values for p are less than 0.05, 0.01, and 0.001, respectively.
-

Figure 9.
Relative expression of GST genes in fruit pulp of purple and yellow passion fruit during fruit development. Vertical bars indicate means ± SD (n = 3, 5 fruits per replicate). According to Student's t-test, the significance is indicated by the symbols *, **, and *** when the corresponding values for p are less than 0.05, 0.01, and 0.001, respectively.
-

Figure 10.
Correlation between 'total flavonoids, anthocyanins and procyanidins', 'flavonoid and anthocyanin metabolites' and 'key enzymes involved in flavonoids metabolism' in the pulp of (a) purple and (b) yellow passion fruit. Following Pearson (n) method, the significance is indicated by the symbols *, **, and *** when the corresponding values for p are less than 0.05, 0.01, and 0.001, respectively.
-
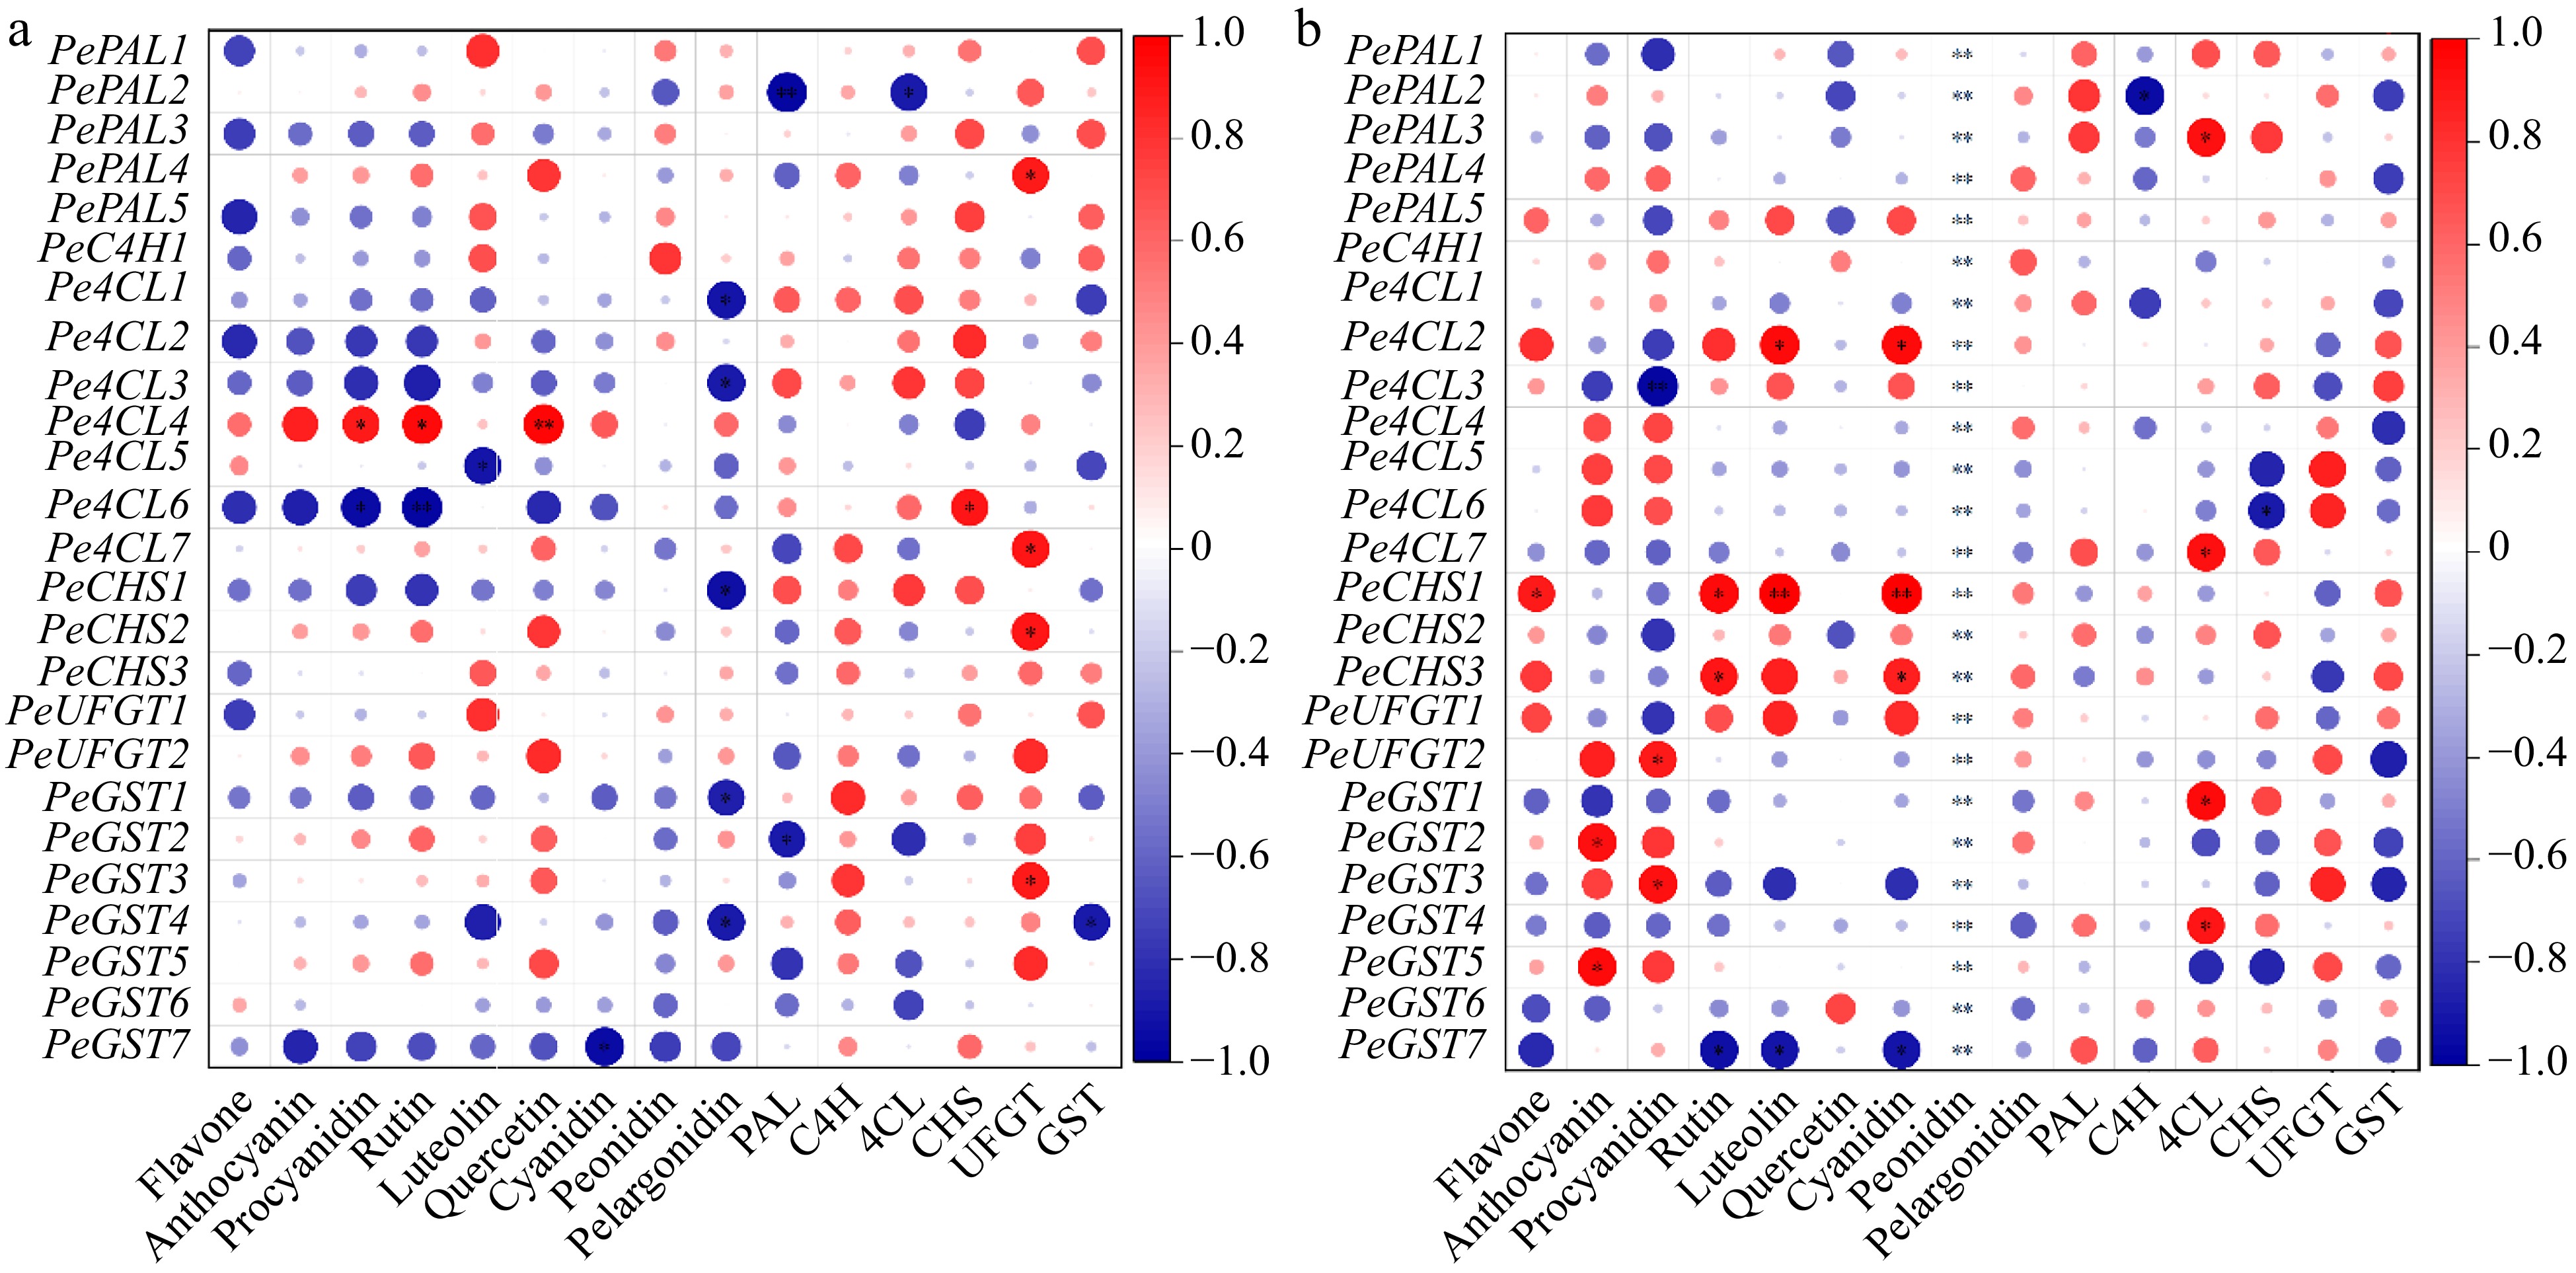
Figure 11.
The correlation analysis between 'anthocyanins components and key enzymes involved in its metabolism' and 'relative expressions of related genes' in fruit pulp of (a) purple and (b) yellow passion fruit. Following Pearson (n) method, the significance is indicated by the symbols *, **, and *** when the corresponding values for p are less than 0.05, 0.01, and 0.001, respectively.
-
Flavonoid/anthocyanin component Linearity (r2) Slope (y) Response (Sy) Sy/y LOD* (µg·mL−1) LOQ** (µg·mL−1) Rutin 0.999303 0.2737 5.2262 19.0921 63.00 190.92 Luteolin 0.999692 0.2745 4.9727 18.1111 59.76 181.11 Quercetin 0.999667 0.2756 4.6358 16.8164 55.49 168.16 Cyanidin-3-O-glucoside chloride 0.998590 0.2767 4.3319 15.6526 51.65 156.52 Peonidin-3-O-glucoside 0.999506 0.2757 4.6096 16.7147 55.15 167.14 Pelargonidin-3-O-glucoside 0.998351 0.2754 4.7720 17.3254 57.17 173.25 * Limit of detection; ** Limit of quantification. Table 1.
Parameters for the validation of the ultra-performance liquid chromatography (UPLC) technique.
-
Cultivar Fruiting stage Cyanidin-3-O-
glucoside chloride (ng·g−1)Peonidin-3-O-glucoside (ng·g−1) Pelargonidin-3-O-glucoside (ng·g−1) Rutin (ng·g−1) Luteolin (ng·g−1) Quercetin (ng·g−1) Purple Fruitlet 3.24 ± 1.89 b 1.14 ± 0.21 a 2.63 ± 0.19 c 48.56 ± 2.12 c 9.85 ± 0.35 a 2.66 ± 0.15 c Green 0 0 0 47.43 ± 5.77 c 0 0.47 ± 0.41 c Veraison 0.84 ± 0.21 b 0 2.84 ± 0.00 bc 61.69 ± 5.42 b 4.97 ± 0.00 c 1.14 ± 0.08 c Maturation 4.95 ± 1.50 b 0 2.96 ± 0.20 b 72.57 ± 1.28 a 7.43 ± 2.03 ab 32.47 ± 1.00 a Ripening 16.79 ± 8.21 a 1.04 ± 1.05 a 3.36 ± 0.23 a 77.33 ± 9.52 a 6.23 ± 2.18 c 25.67 ± 3.06 b Yellow Fruitlet 1.60 ± 0.68 a 0 2.54 ± 0.09 b 71.14 ± 11.71 a 134.39 ± 61.28 a 2.13 ± 1.48 b Green 0 0 0 33.97 ± 3.65 b 6.54 ± 0.19 b 0 Veraison 0 0 0 41.84 ± 10.74 b 5.56 ± 0.36 b 6.61 ± 3.60 a Maturation 0 0 0 41.66 ± 5.27 b 5.12 ± 0.19 b 1.43 ± 0.12 b Ripening 0 0 2.84 ± 0.12 a 45.82 ± 9.38 b 5.25 ± 0.41 b 2.54 ± 0.12 b According to Fisher’s LSD, Same lowercase letters indicate non-significant difference (p ≤ 0.05) between different growth stages. Table 2.
Changes in the concentration of flavonoid and anthocyanin metabolites in developing purple and yellow passion fruits.
Figures
(11)
Tables
(2)