-
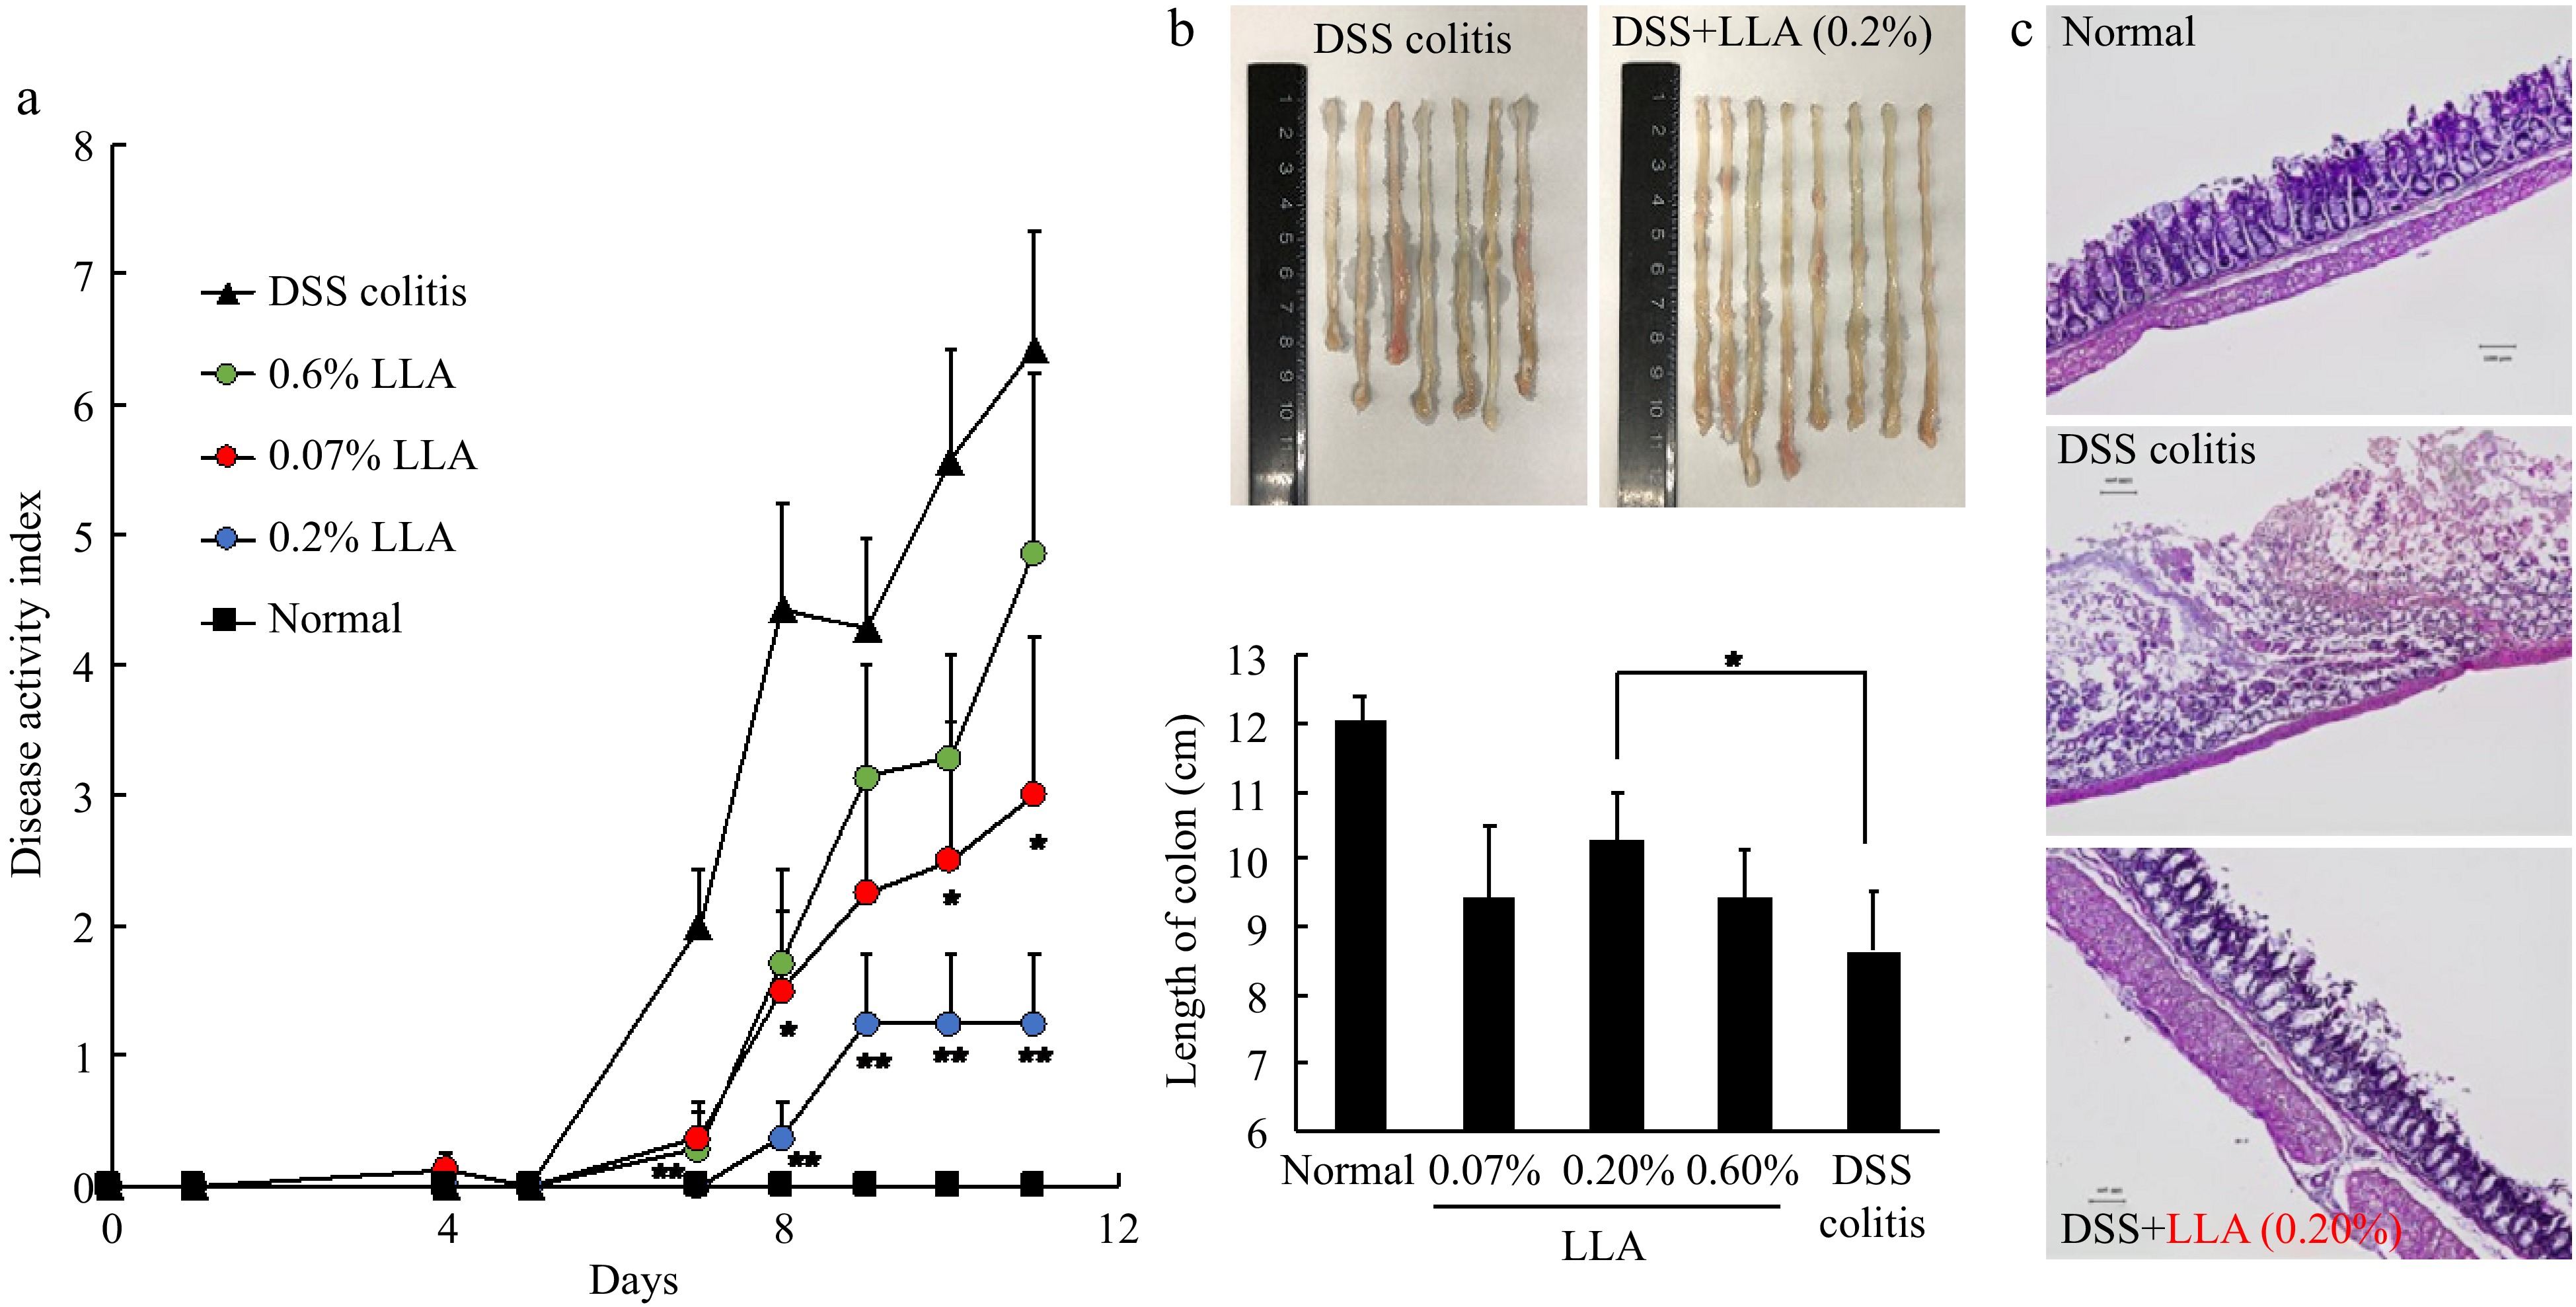
Figure 1.
Anti-inflammatory effect of LLA on DSS-induced mouse colitis. The DSS-induced colitis model was triggered by oral administration of 2% DSS. LLA treatment was carried out throughout the experiment. During the experiments, symptoms of colitis were recorded daily, and (a) the disease activity index (DAI) values were calculated. On day 11, when severe colitis appeared, mice were killed, (b) the length of the colon was measured, and (c) histological examination of the colon was carried out. Values are mean ± SD; n = 7–8. *, p < 0.05; **, p < 0.01 vs DSS colitis group. See text for details.
-
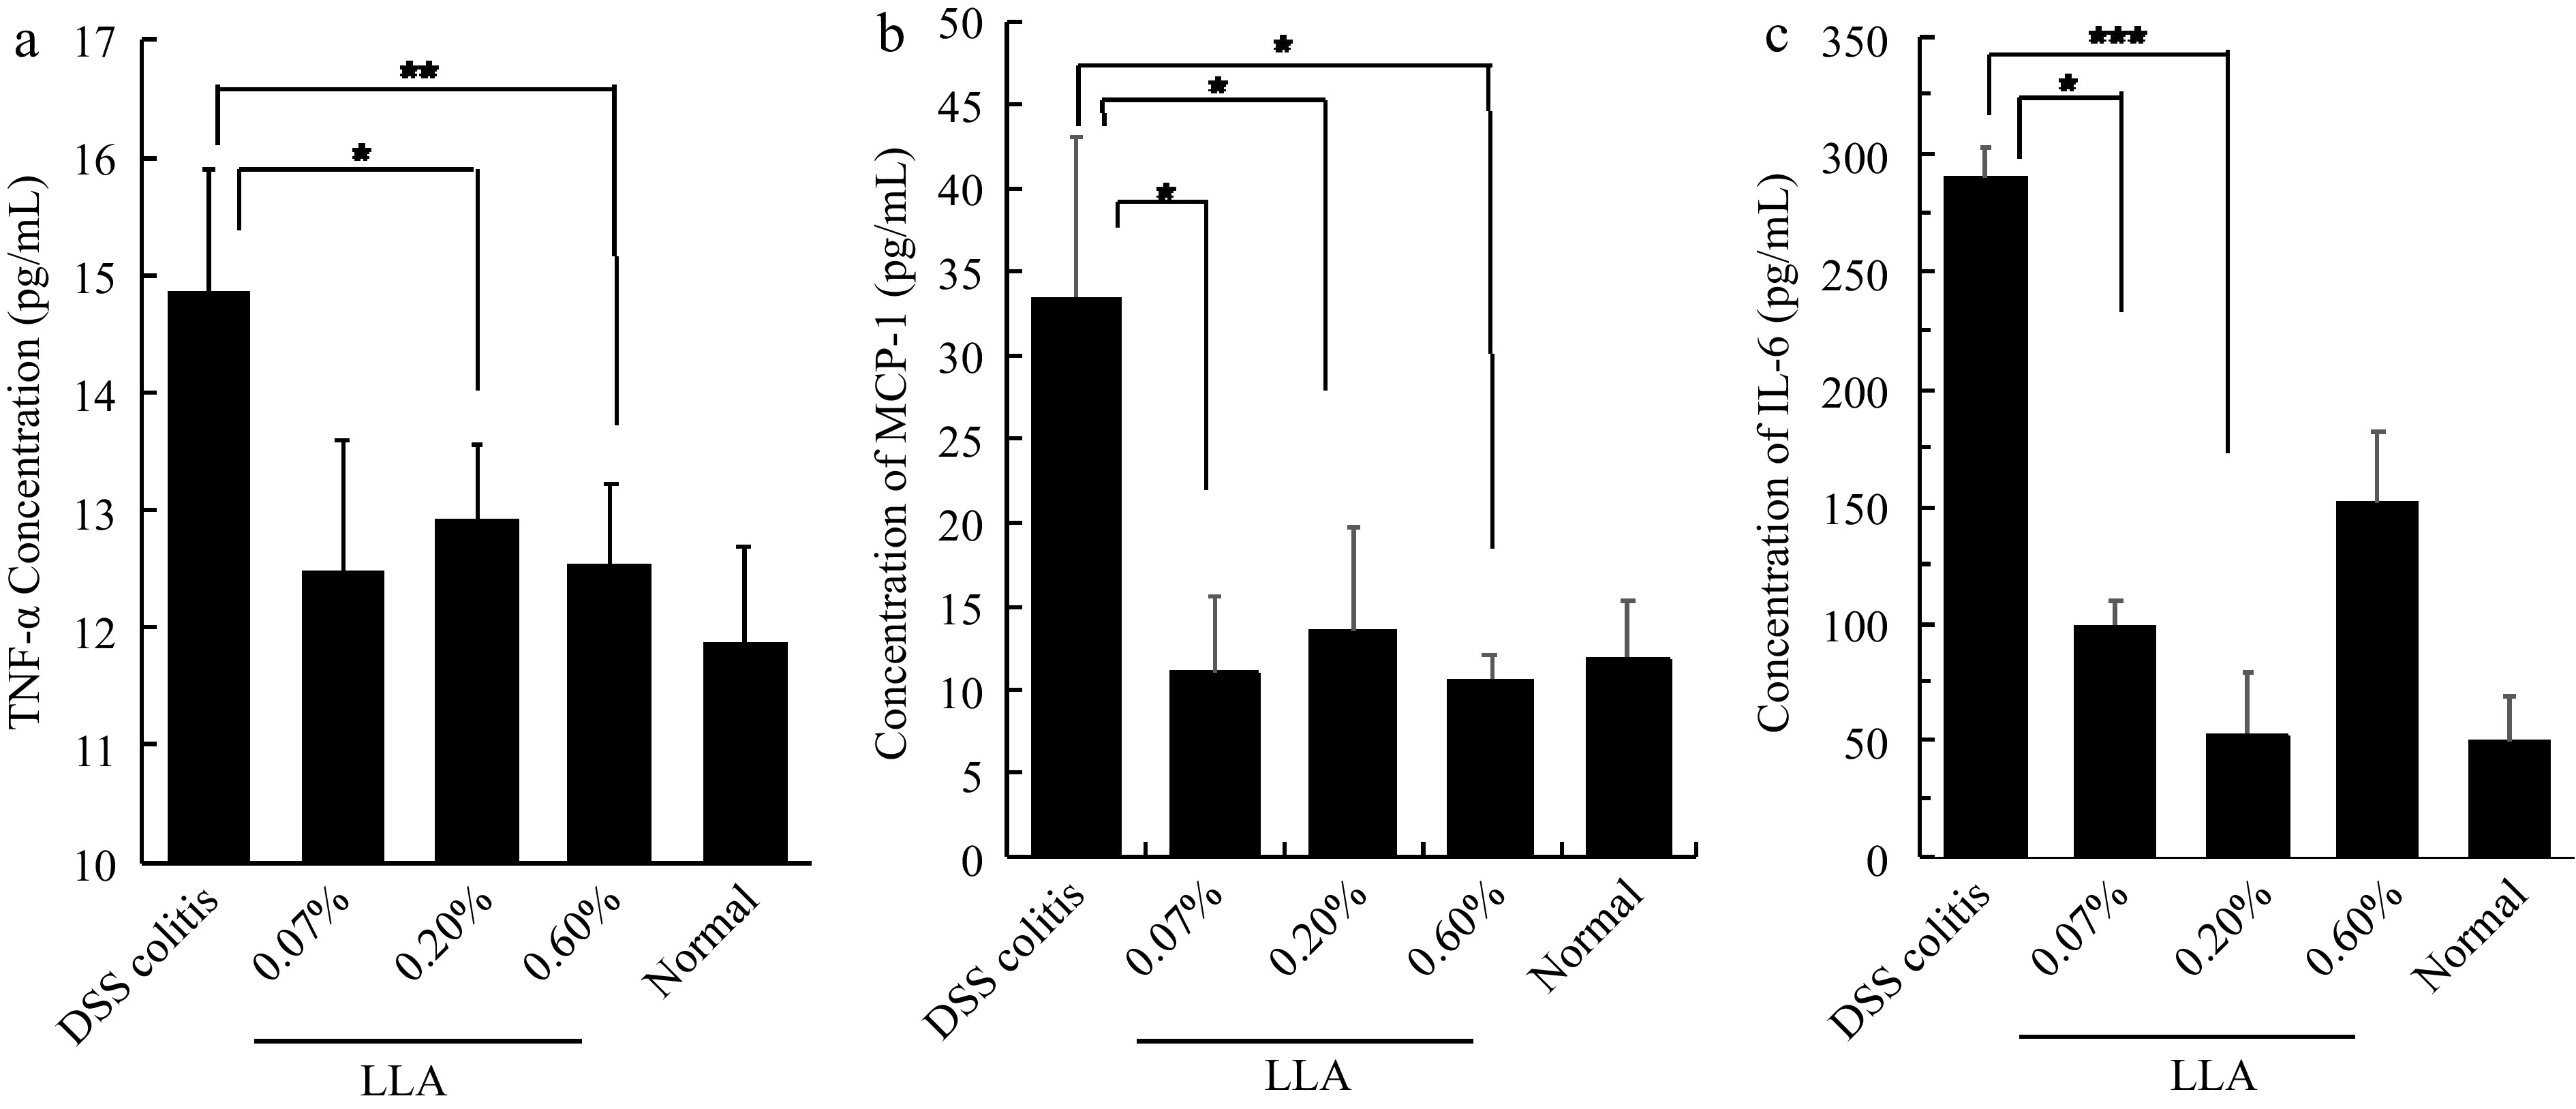
Figure 2.
(a) Inhibition of inflammatory cytokines TNF-α, (b) MCP-1, and (c) IL-6 by LLA in DSS-induced murine colitis. The experimental protocol is the same as that described in Fig. 3. On day 11 of the experiment, mice were killed, and serum samples were collected for measurement of the cytokines by using ELISA. Values are mean ± SD; n = 7–8. *, p < 0.05; **, p < 0.01; *, ***, p < 0.001. See text for details.
-
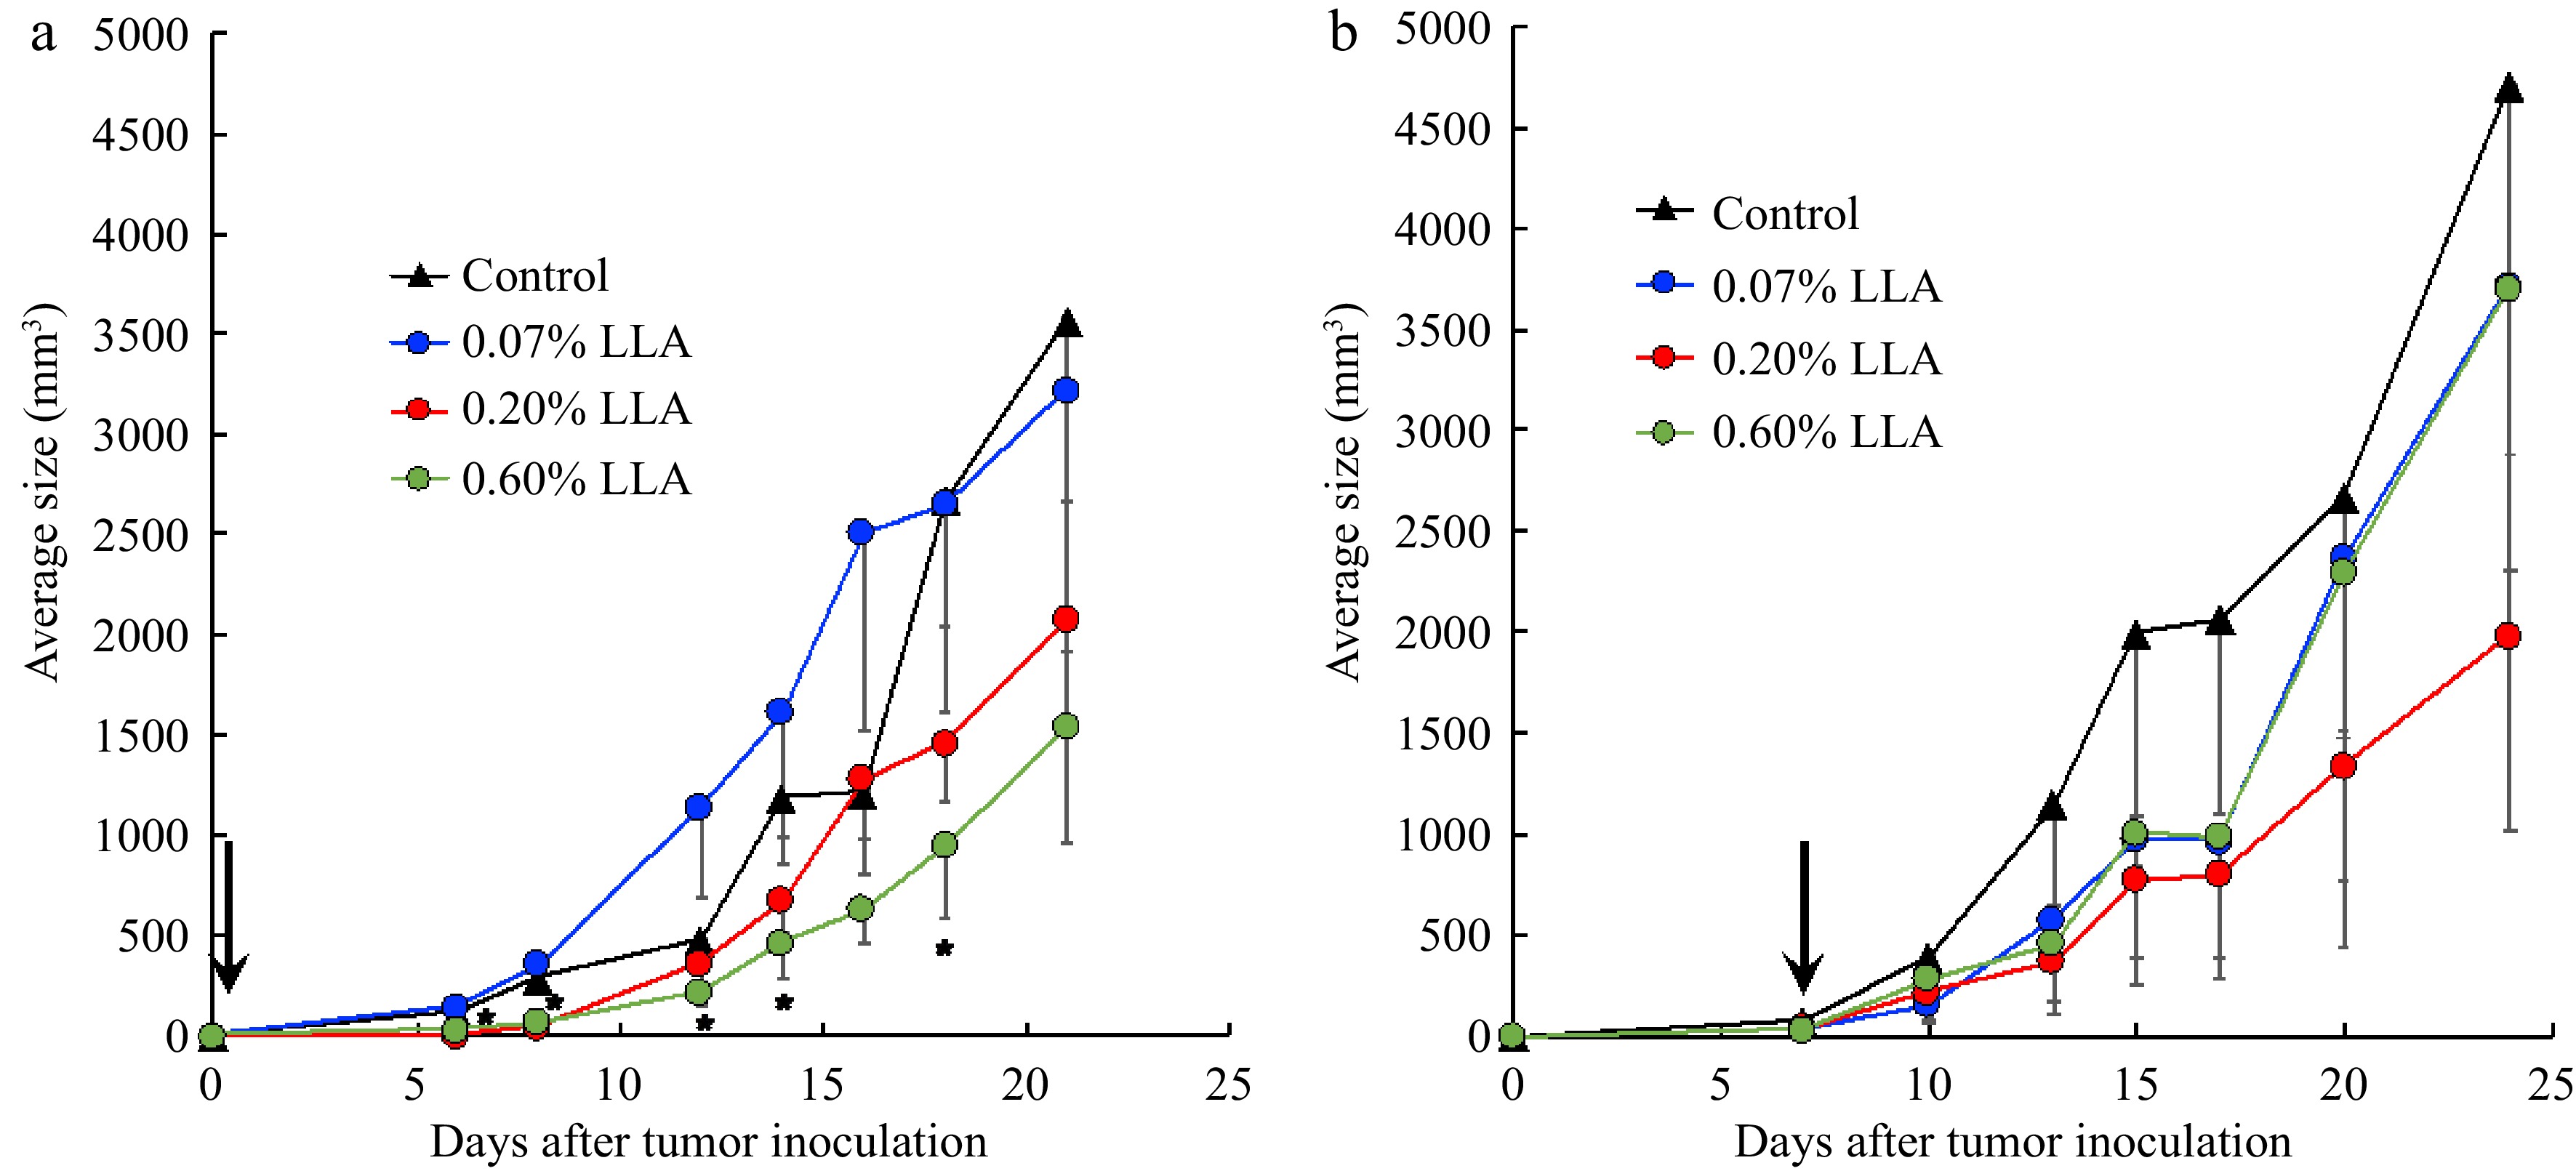
Figure 3.
Antitumor effect of Ligustrum lucidum ait (LLA) against mouse sarcoma S180 solid tumor. (a) LLA was fed to the mice from the day of mouse sarcoma S180 tumor cell inoculation. (b) LLA was fed to the mice from day 7 after S180 tumor cell inoculation when the tumor had grown to 7–8 mm in diameter. Arrows indicate the date to start the LLA treatment. Data are mean ± SD, n = 4. *, p < 0.05, 0.6% LLA group vs Control. See text for details.
-
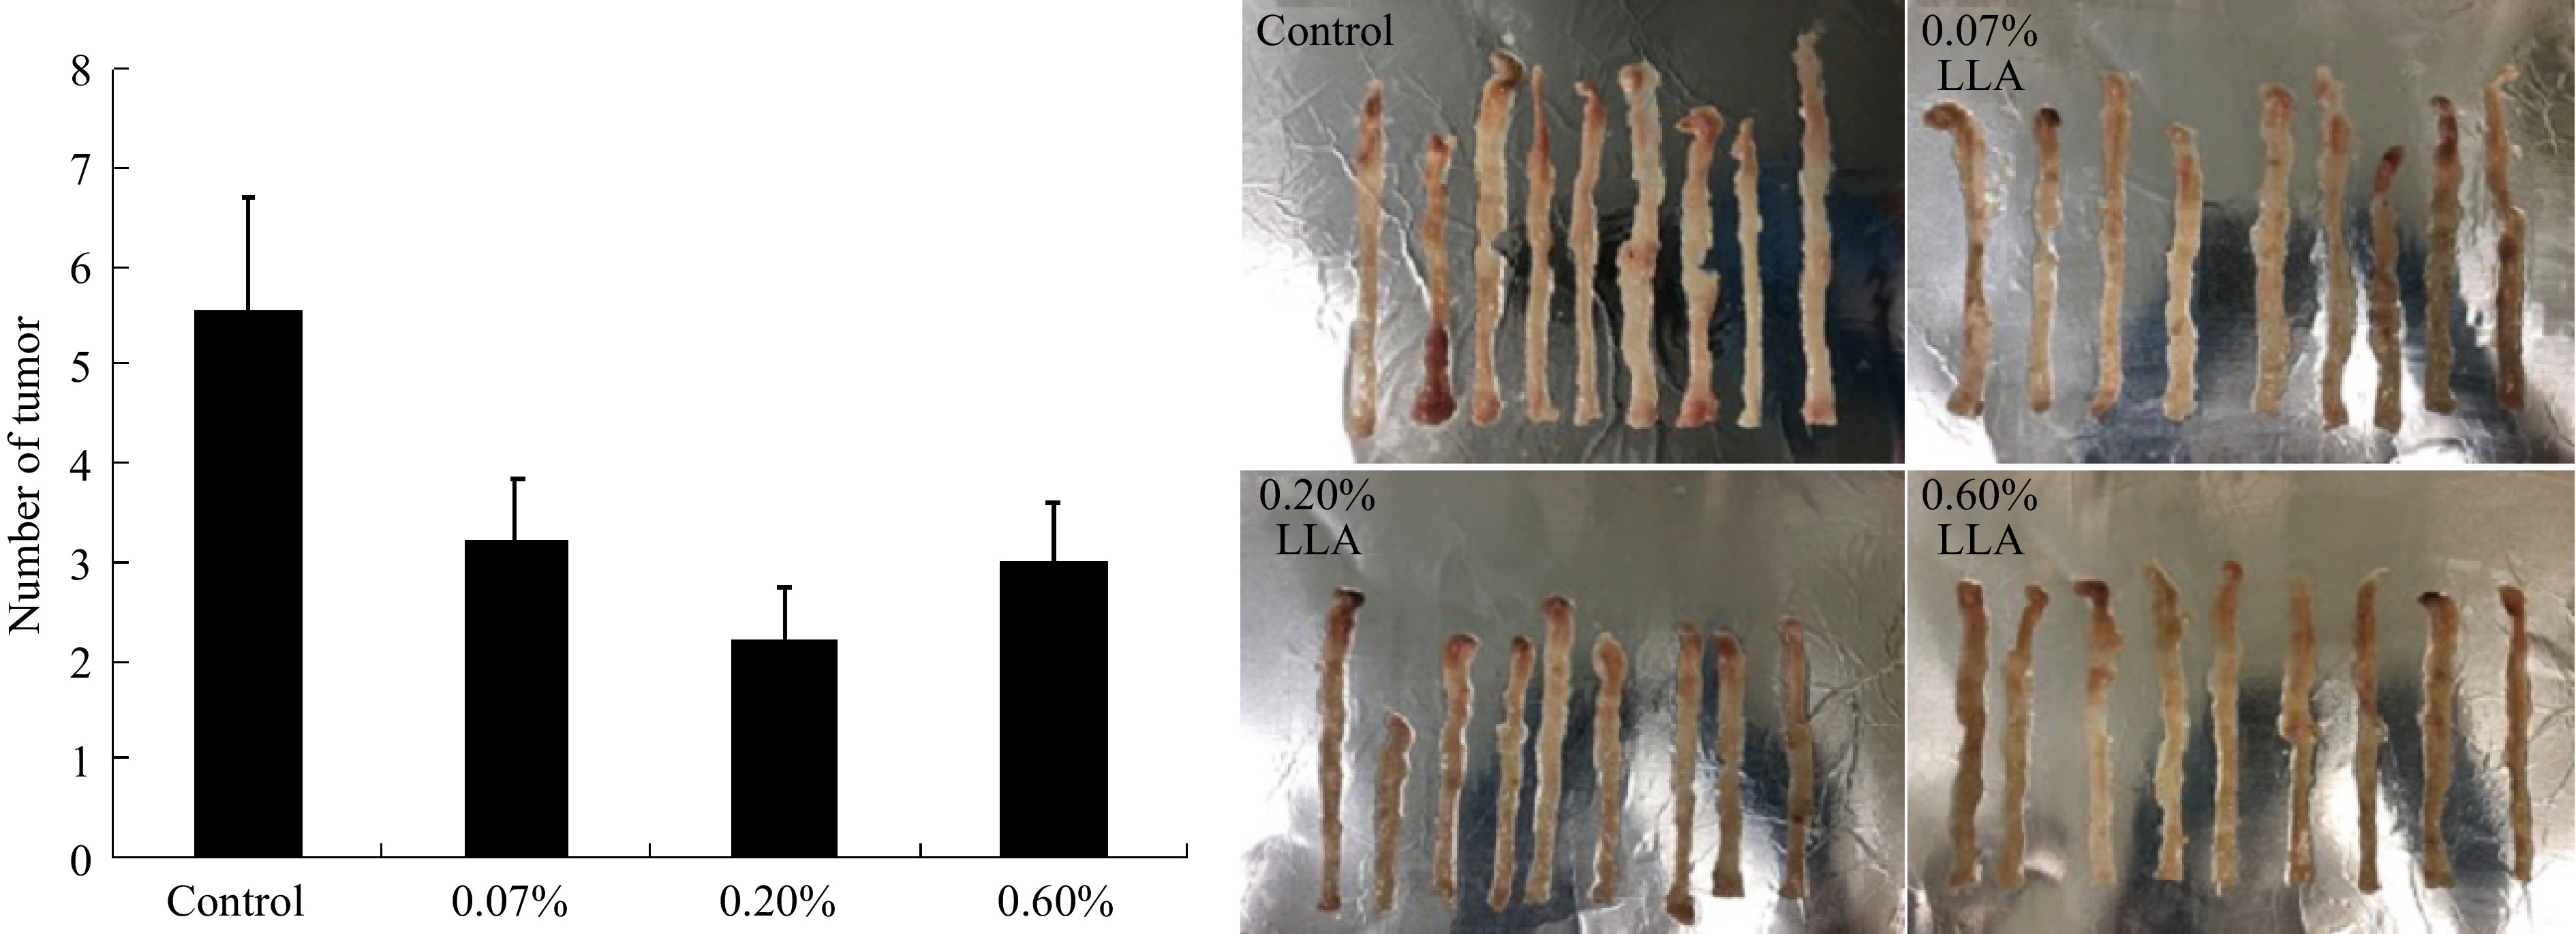
Figure 4.
Suppression of azoxymethane/dextran sulfate sodium (AOM/DSS) induced mouse colon carcinogenesis by LLA. At 12-13 weeks after AOM administration with/without LLA treatment, mice were killed and the numbers of tumor nodules in the colon were counted (left), and the photos of the colon were shown on the right Data are mean ± SD, n = 9. *, p < 0.05 vs control. See text for details.
-
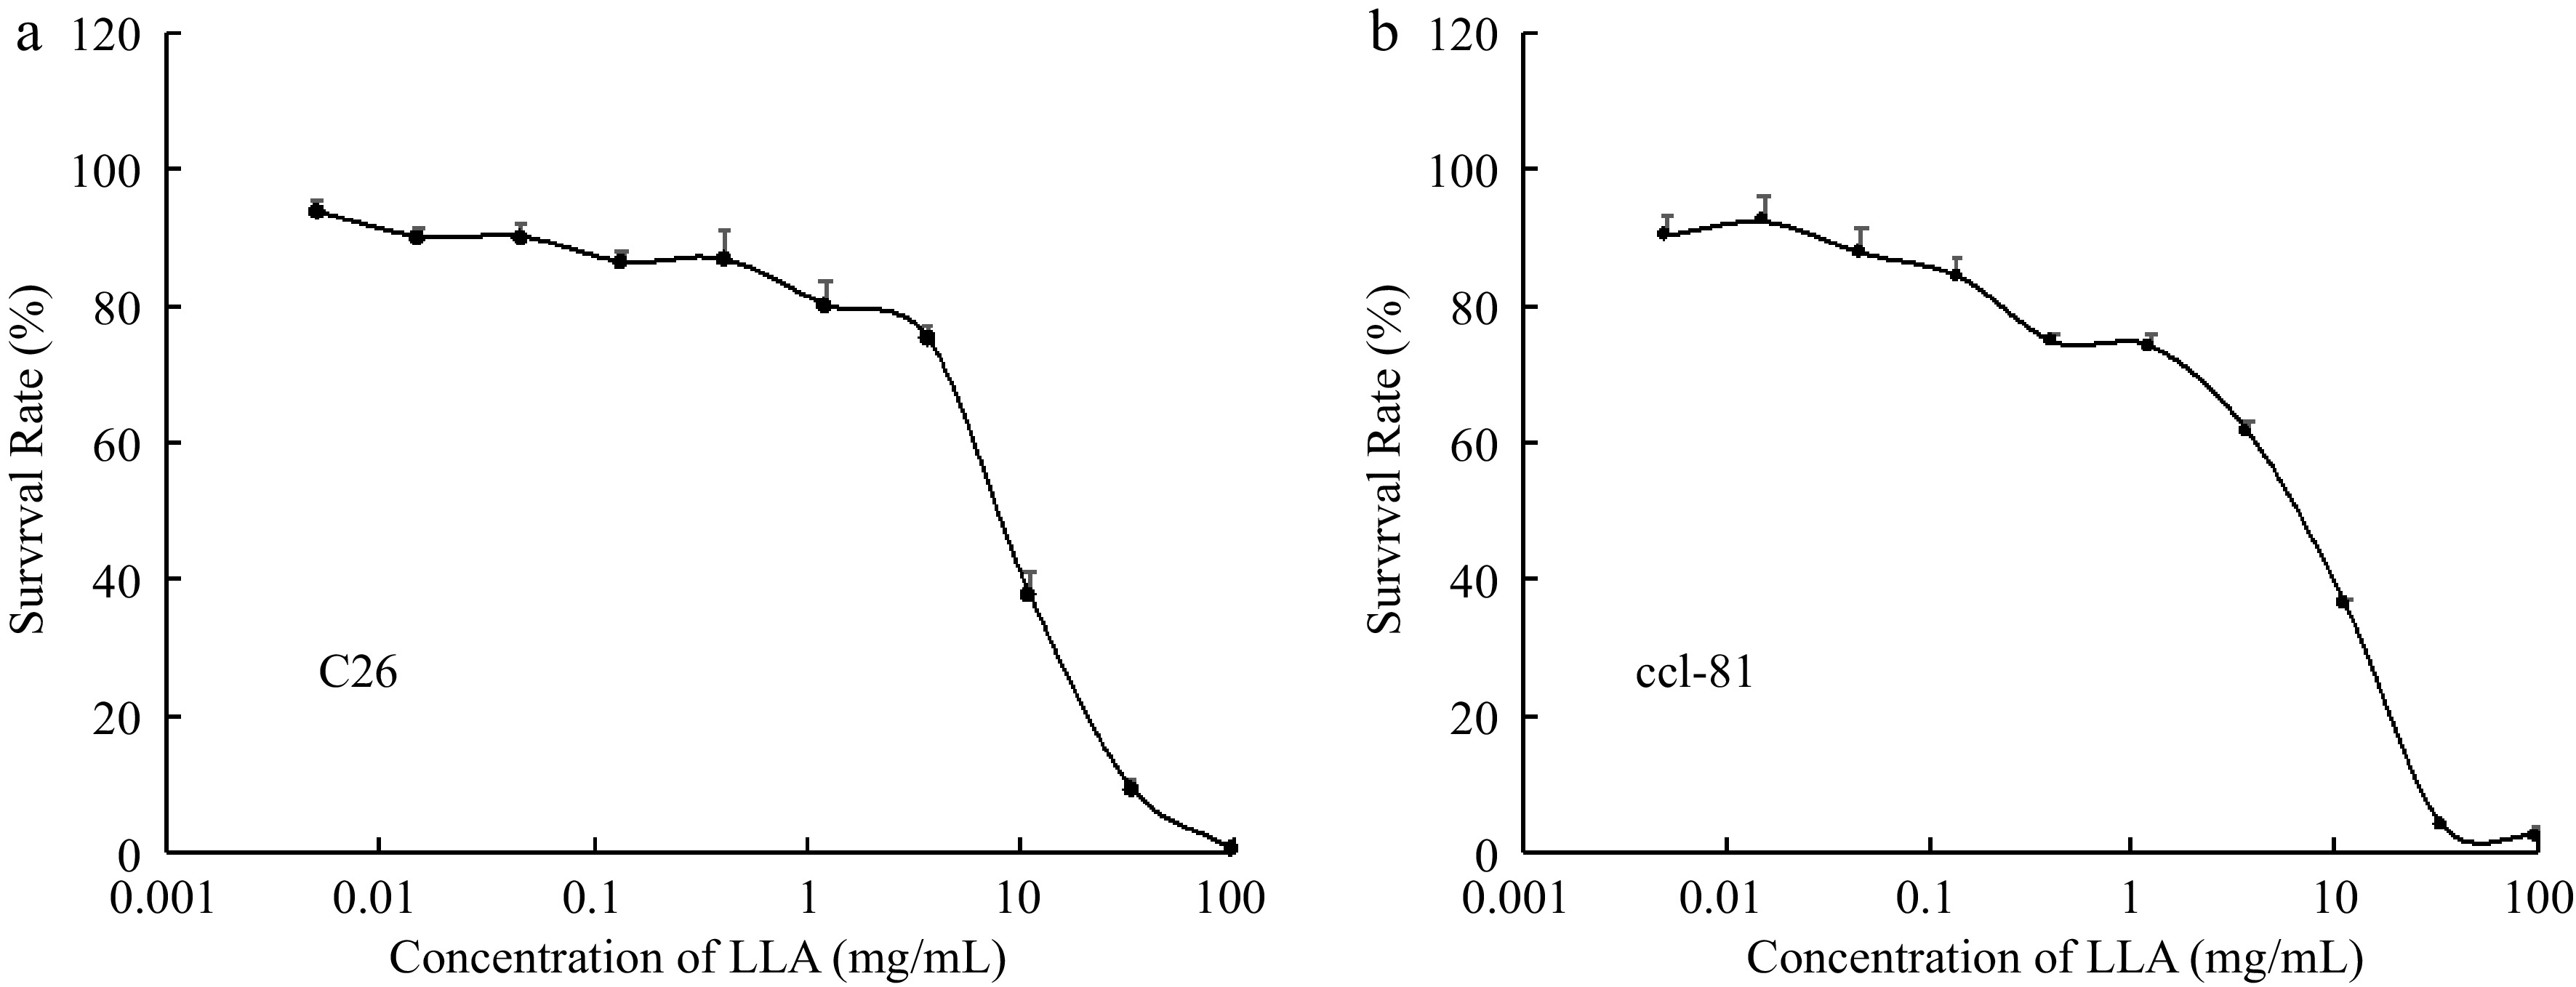
Figure 5.
(a) In vitro cytotoxicity of LLA to normal cells (monkey kidney epithelial cells CCL-81, as well as (b) tumor cells (human ovarian cancer A2780). Cell viability after LLA treatment was examined by MTT assay. Values are mean ± SD; n = 8. See text for details.
-
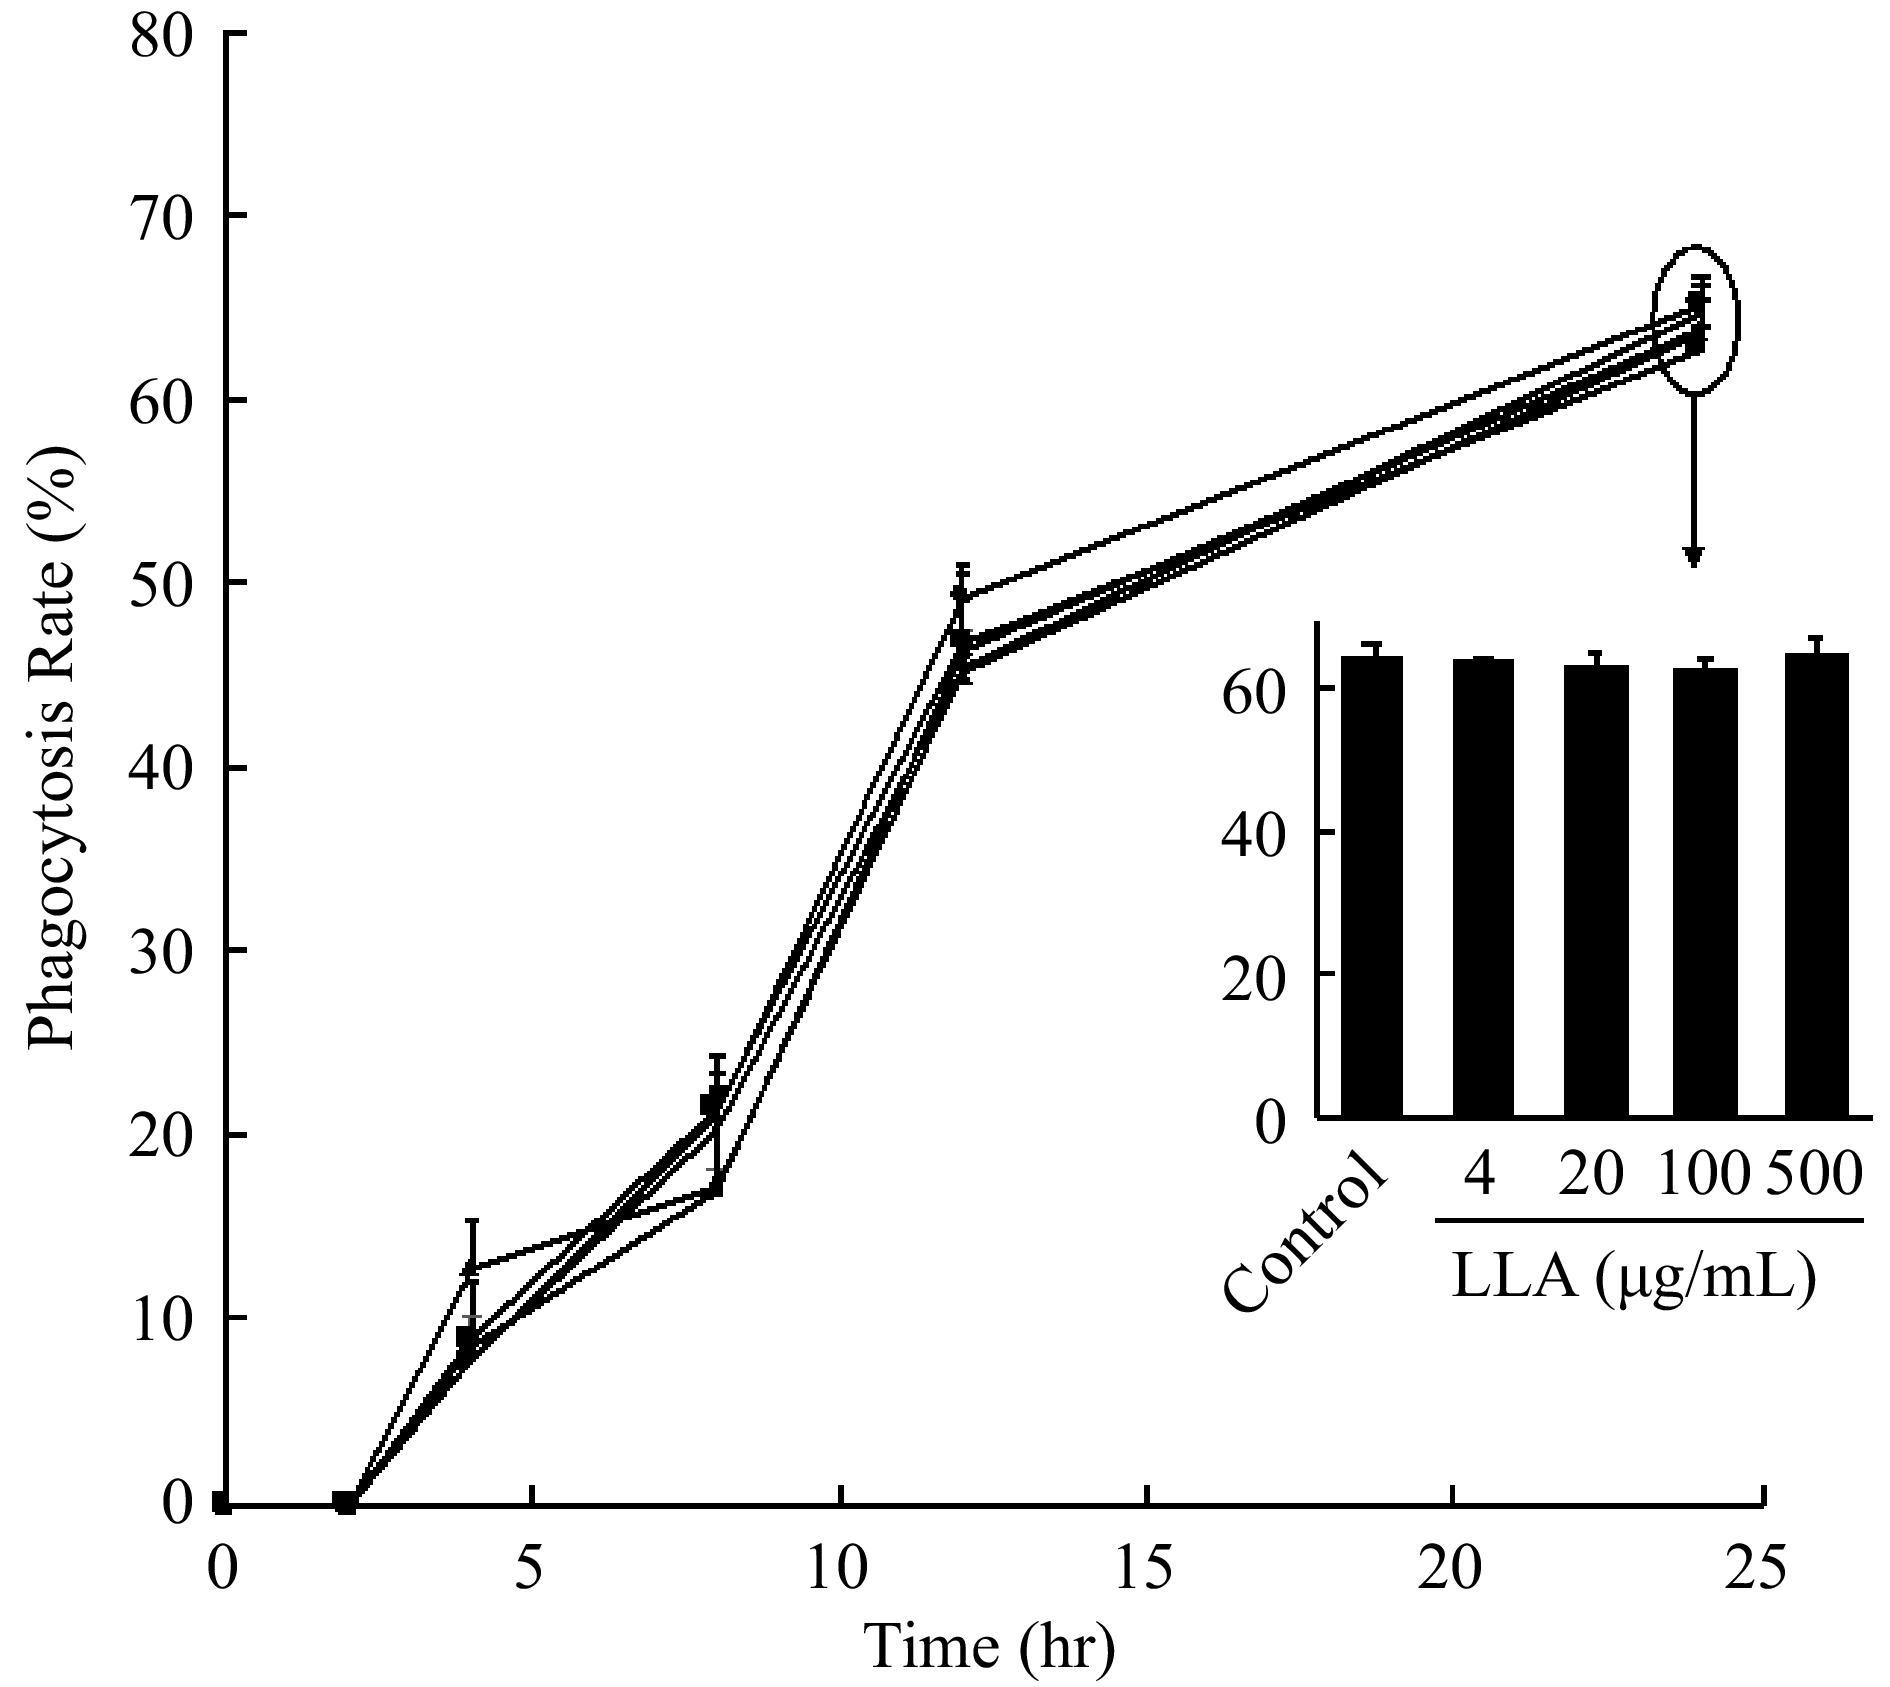
Figure 6.
Effect of LLA on the phagocytotic activity of macrophage. Engulfment of yeast by macrophages in the presence /absence (control) of LLA was observed and counted with a microscope for 12 h after adding yeast to macrophages, the phagocytosis rate of macrophages was then calculated. Values are mean ± SD; n = 3. See text for details.
-
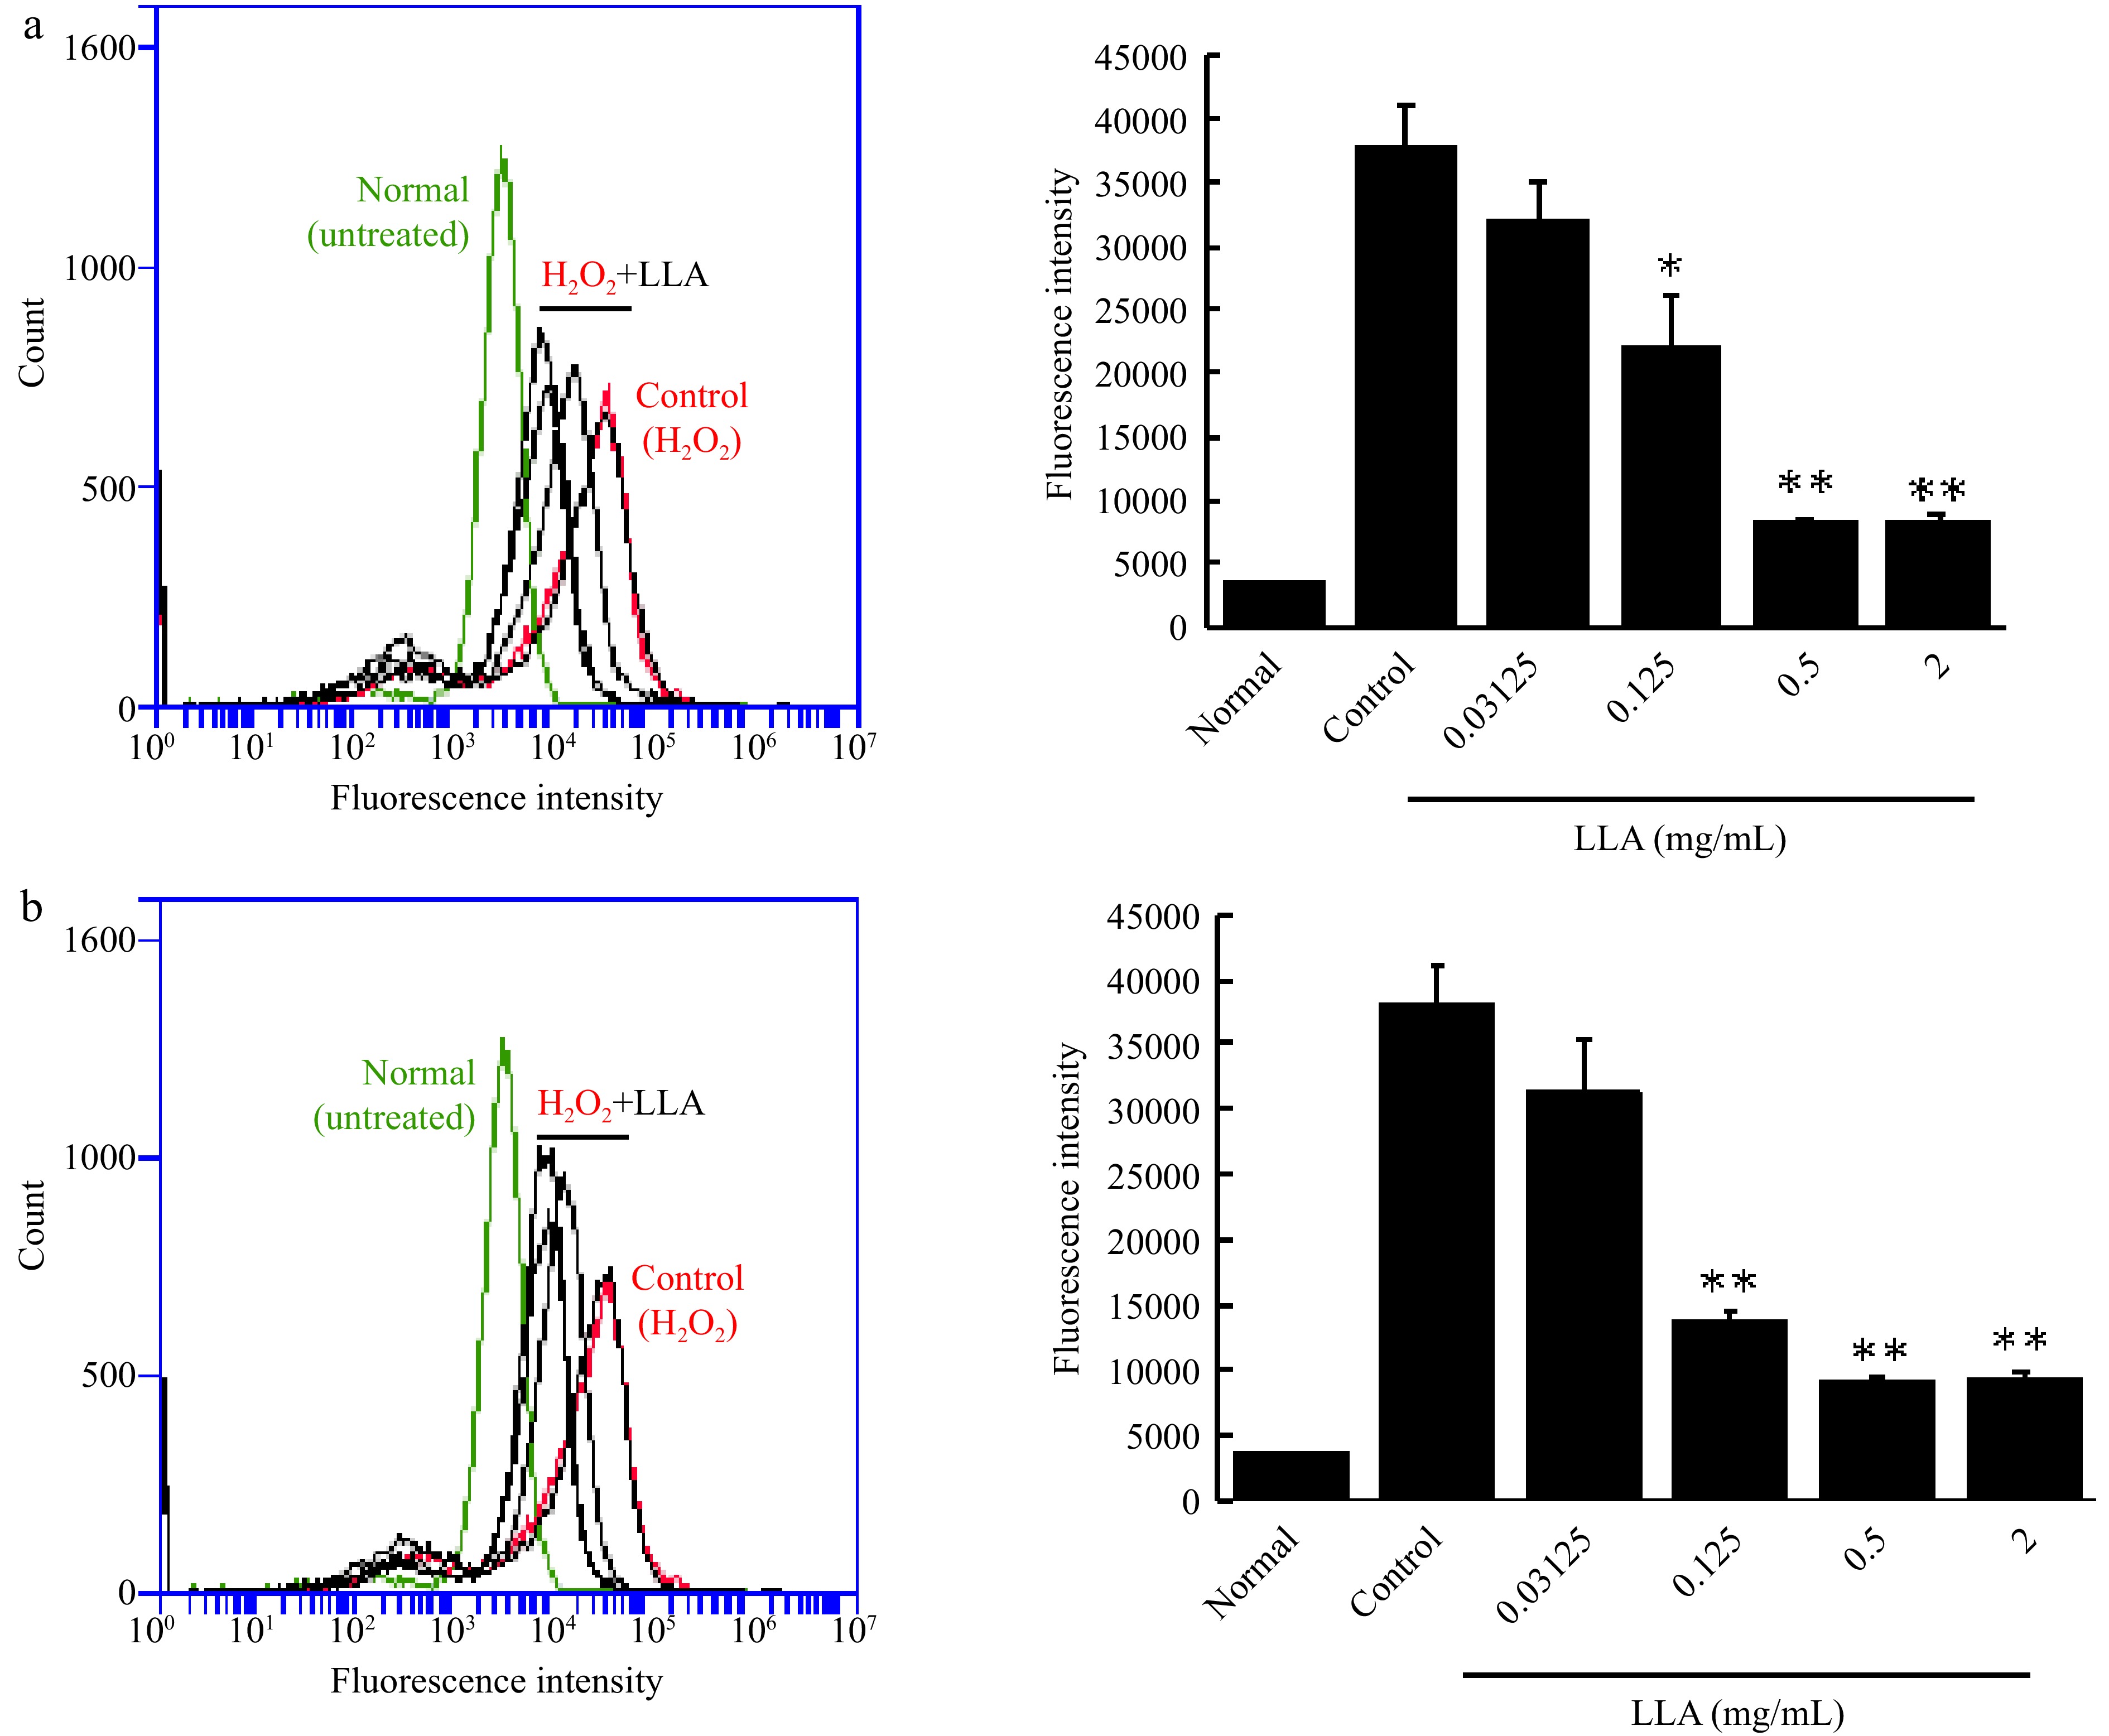
Figure 7.
Suppression of intracellular ROS induced by hydrogen peroxide (H2O2) through LLA treatment in C26 colon cancer cells. (a) Pre-treatment: C26 cells were treated with increasing concentrations of LLA for 24 h prior to H2O2 addition. (b) Co-exposure: LLA was administered simultaneously with H2O2 exposure. The intracellular ROS levels were quantified using the fluorescence ROS probe DCDHF-DA and analyzed by flow cytometry. Mean values ± standard deviation (SD) are shown; n = 4–8. *, p < 0.05, **, p < 0.01 compared to the H2O2 alone group. See text for details.
Figures
(7)
Tables
(0)