-
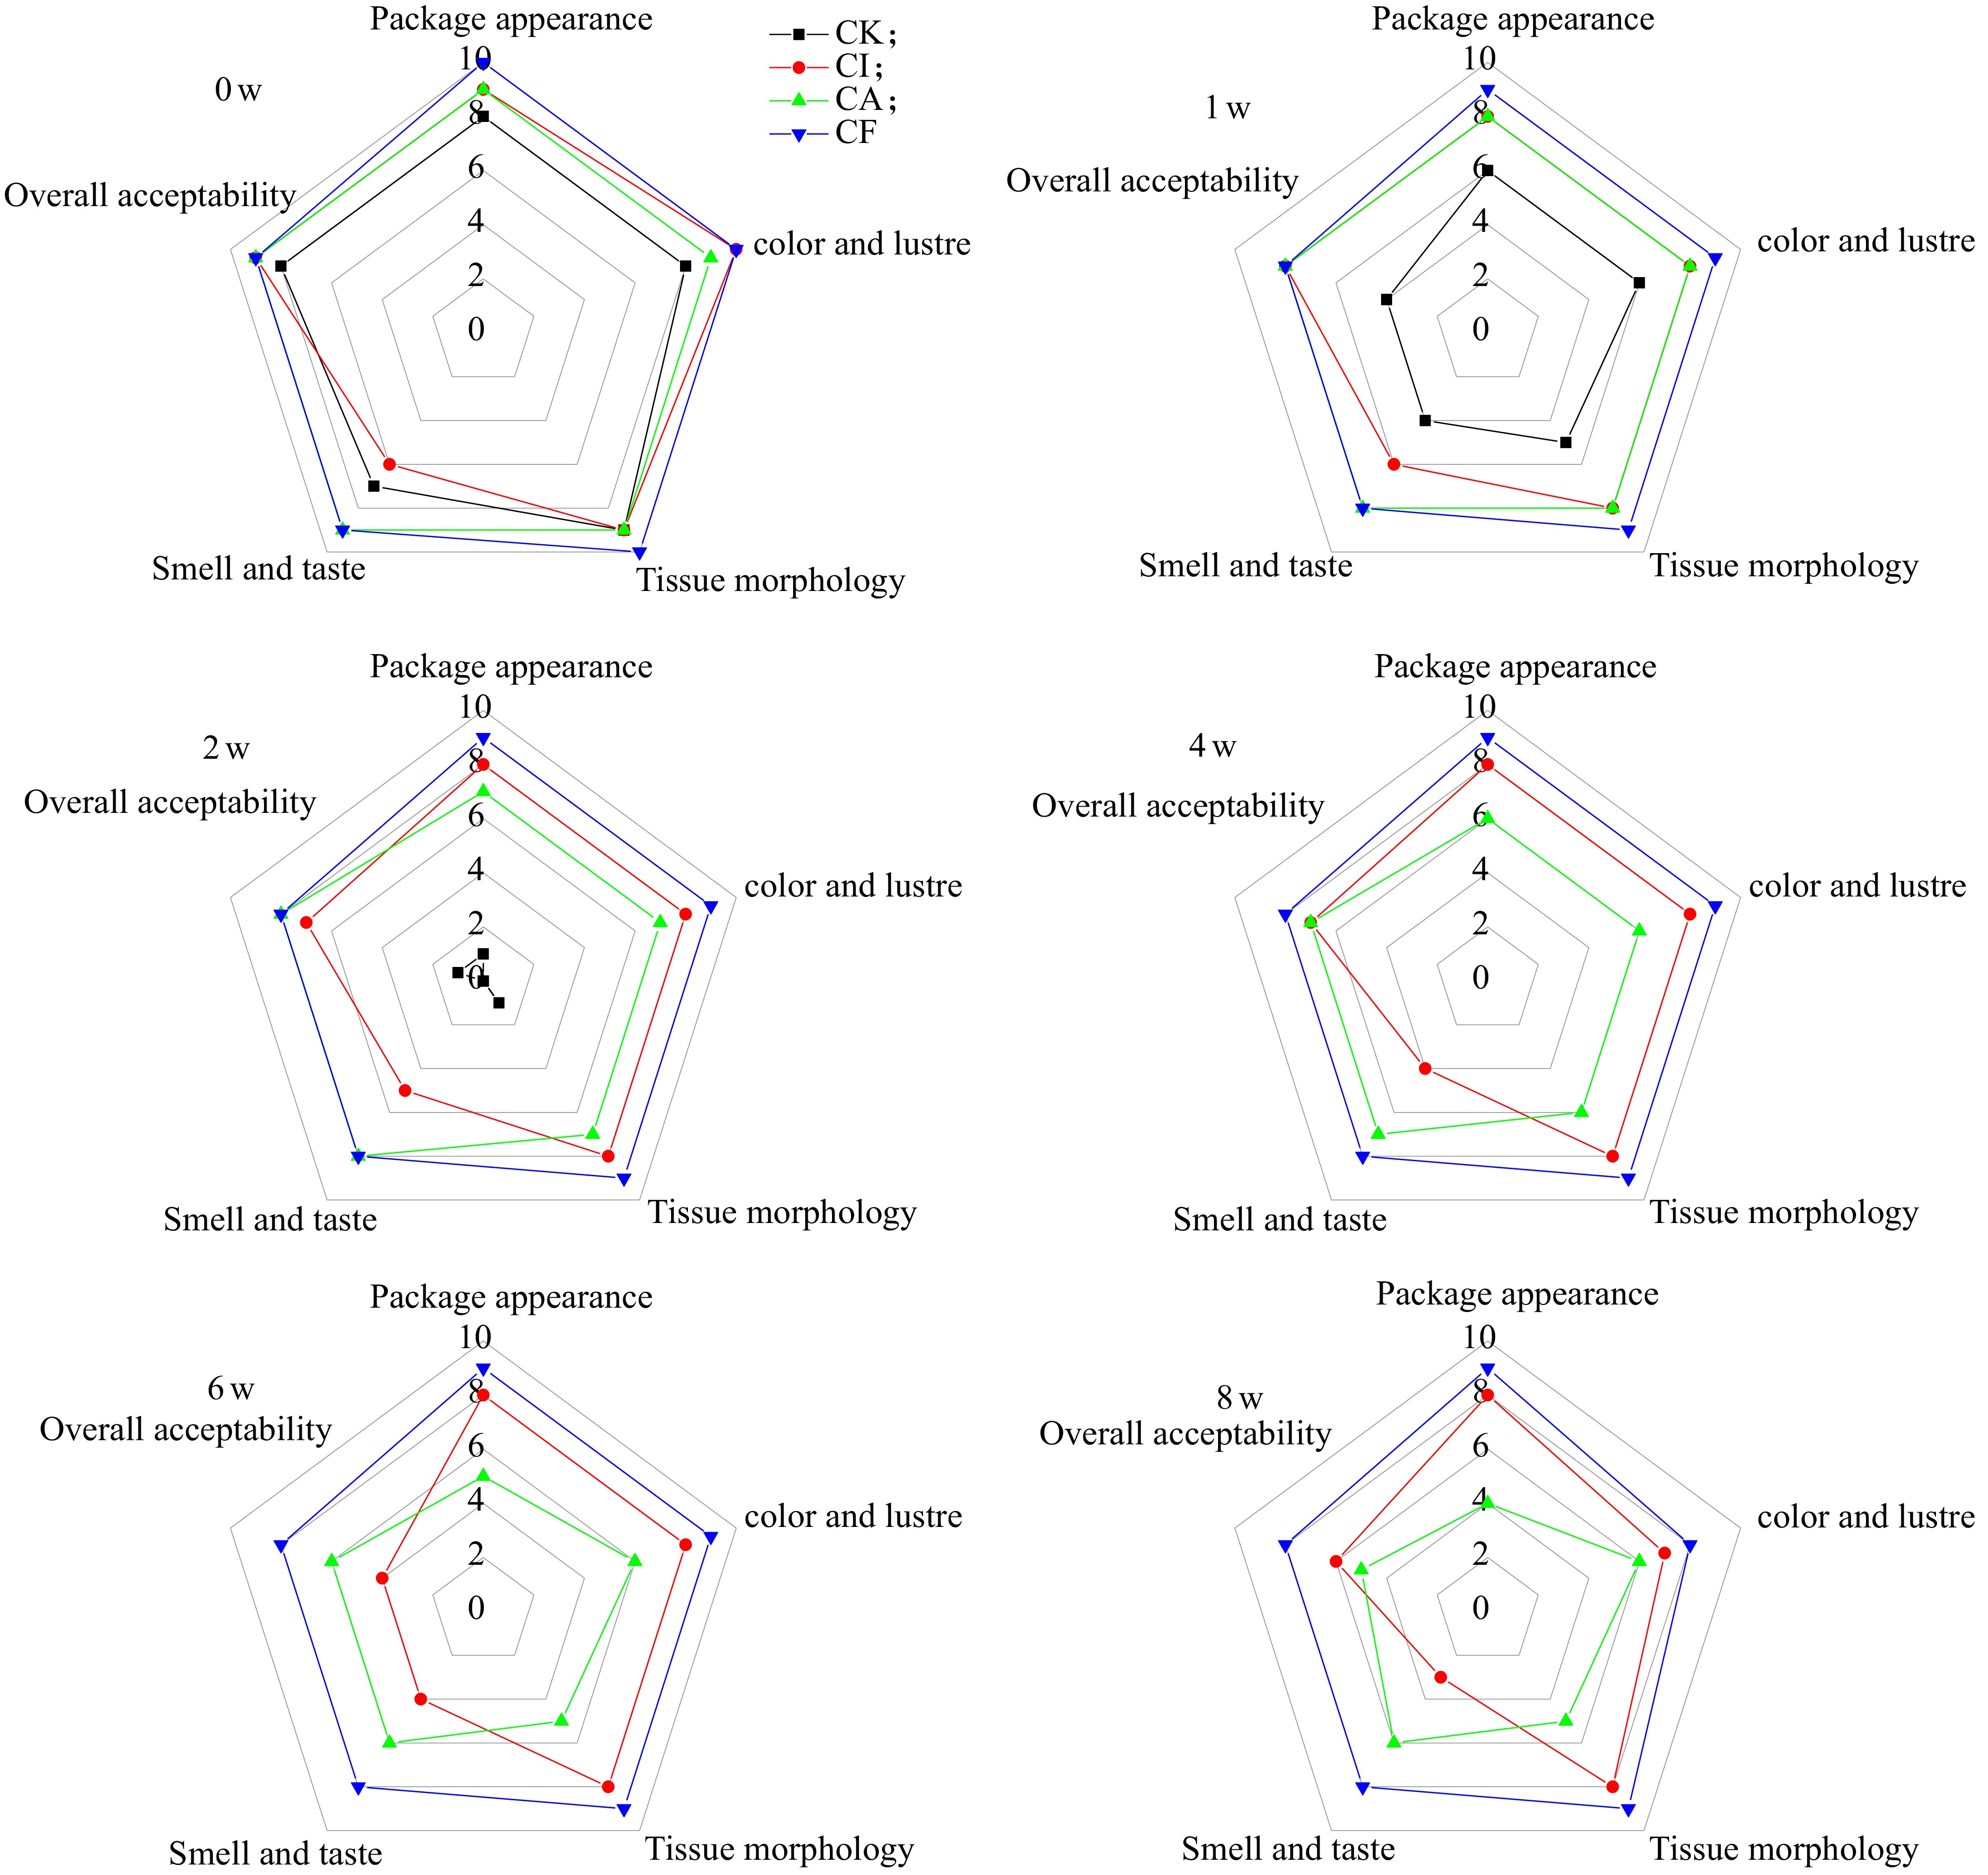
Figure 1.
The change of sensory characteristics (appearance, color, texture, smell and taste, an overall acceptability) of wet konjac noodles with different treatment methods during storage.
-
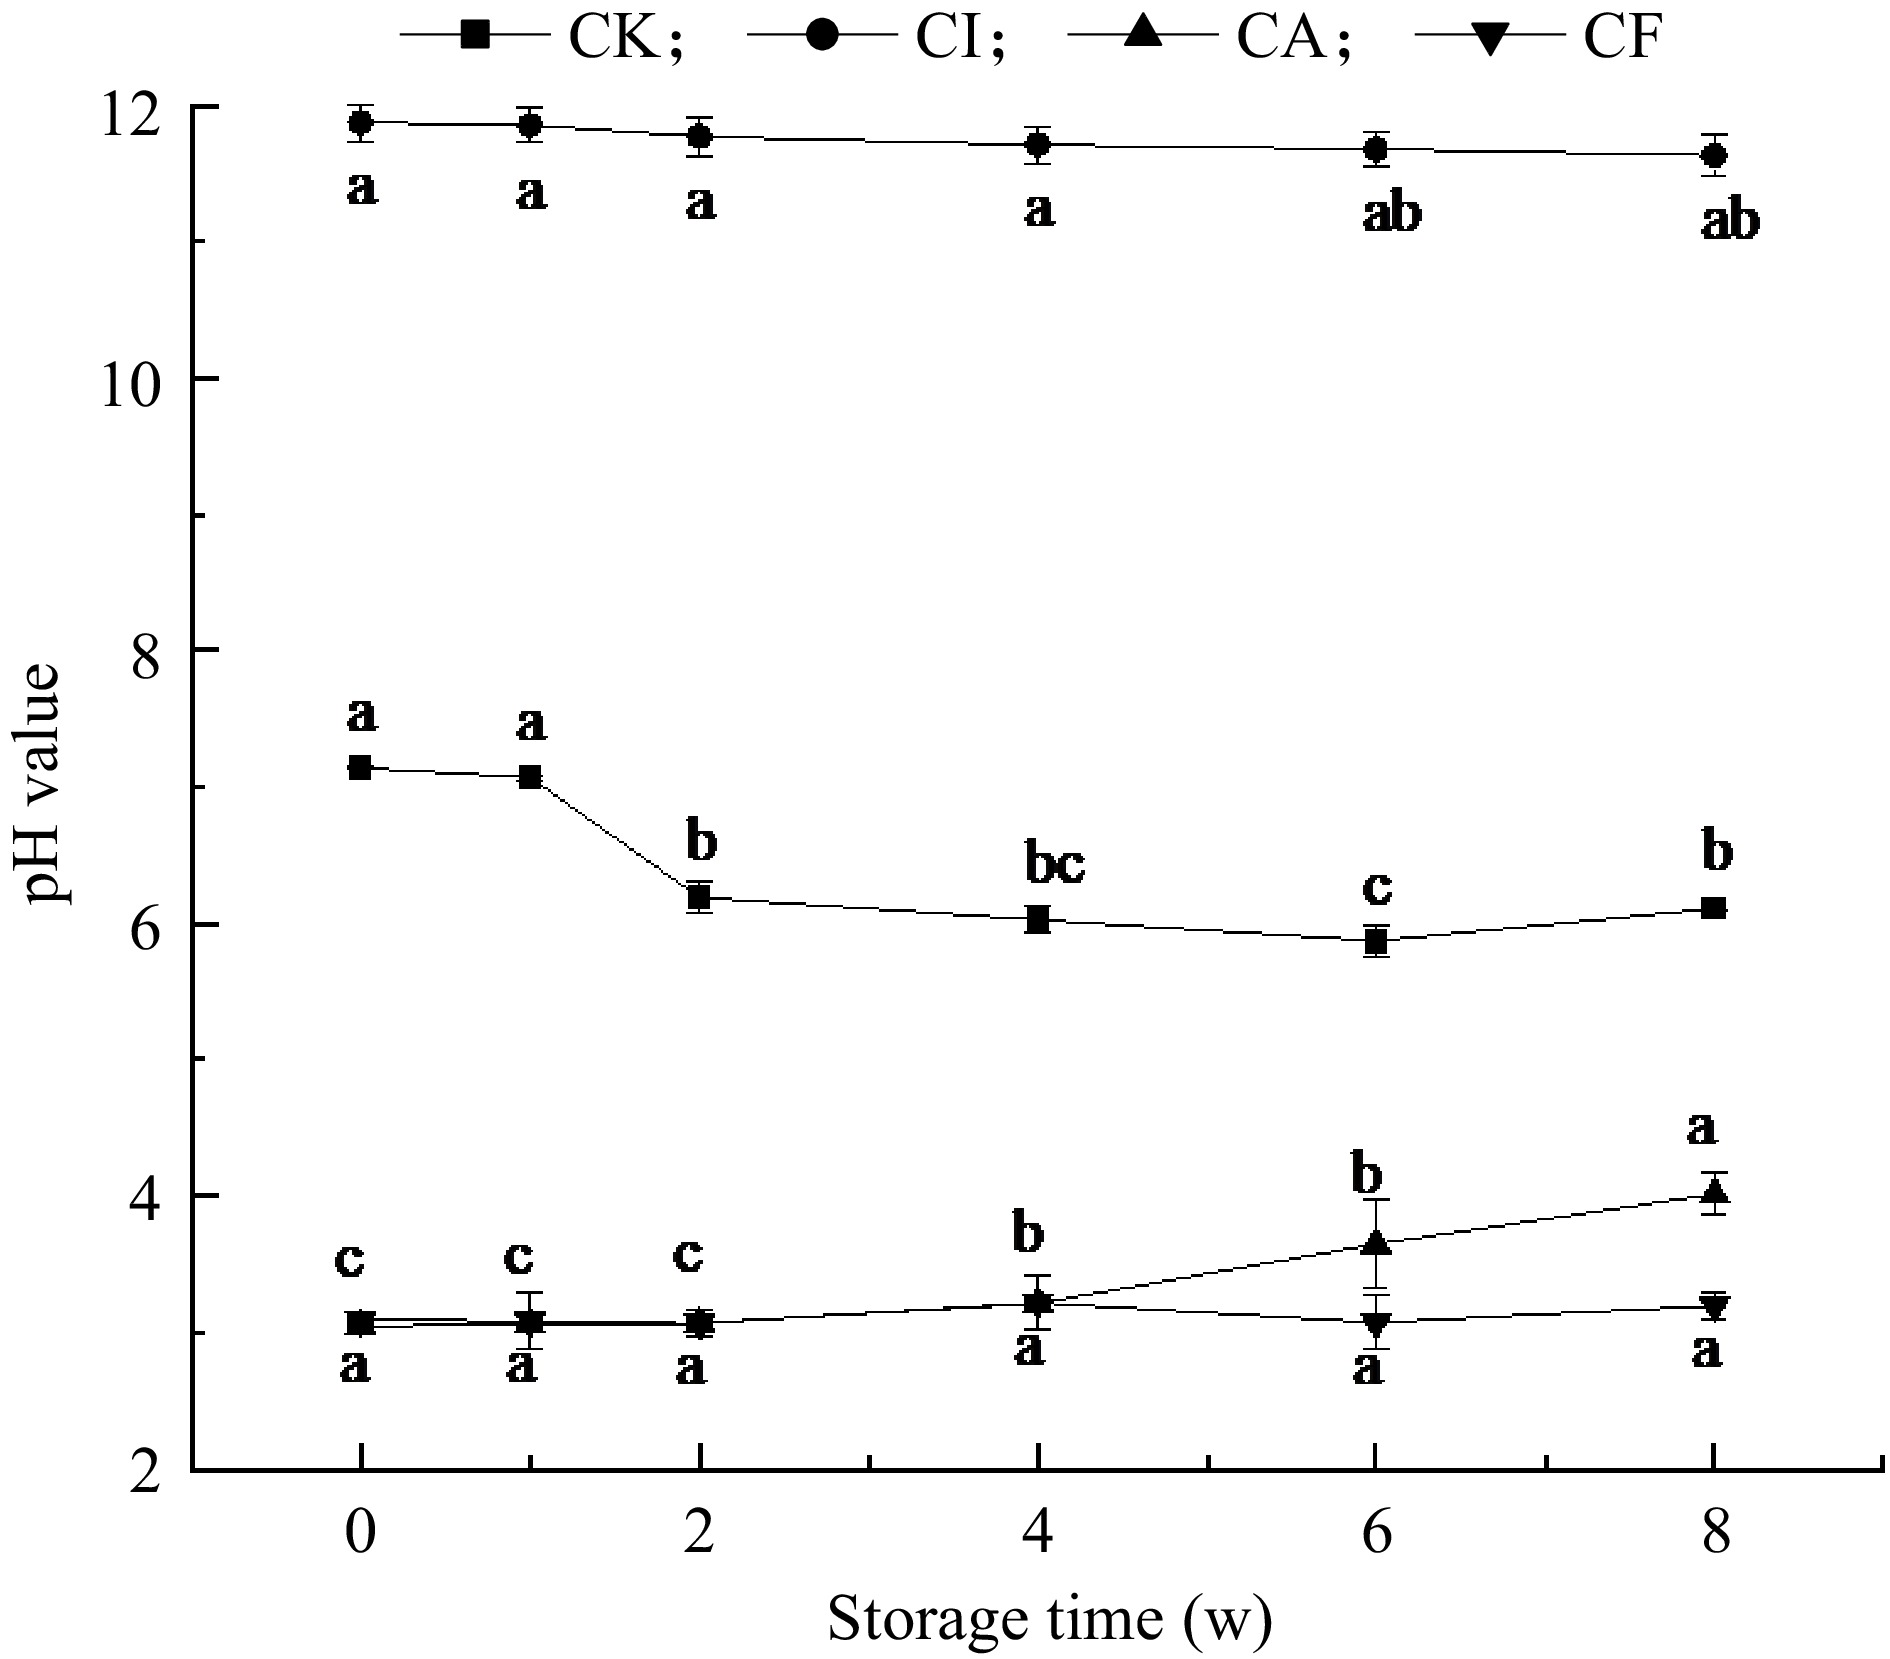
Figure 2.
Effects of different preserving methods on pH of wet konjac cold noodles during storage. Different letters indicate significantly different at p < 0.05
-
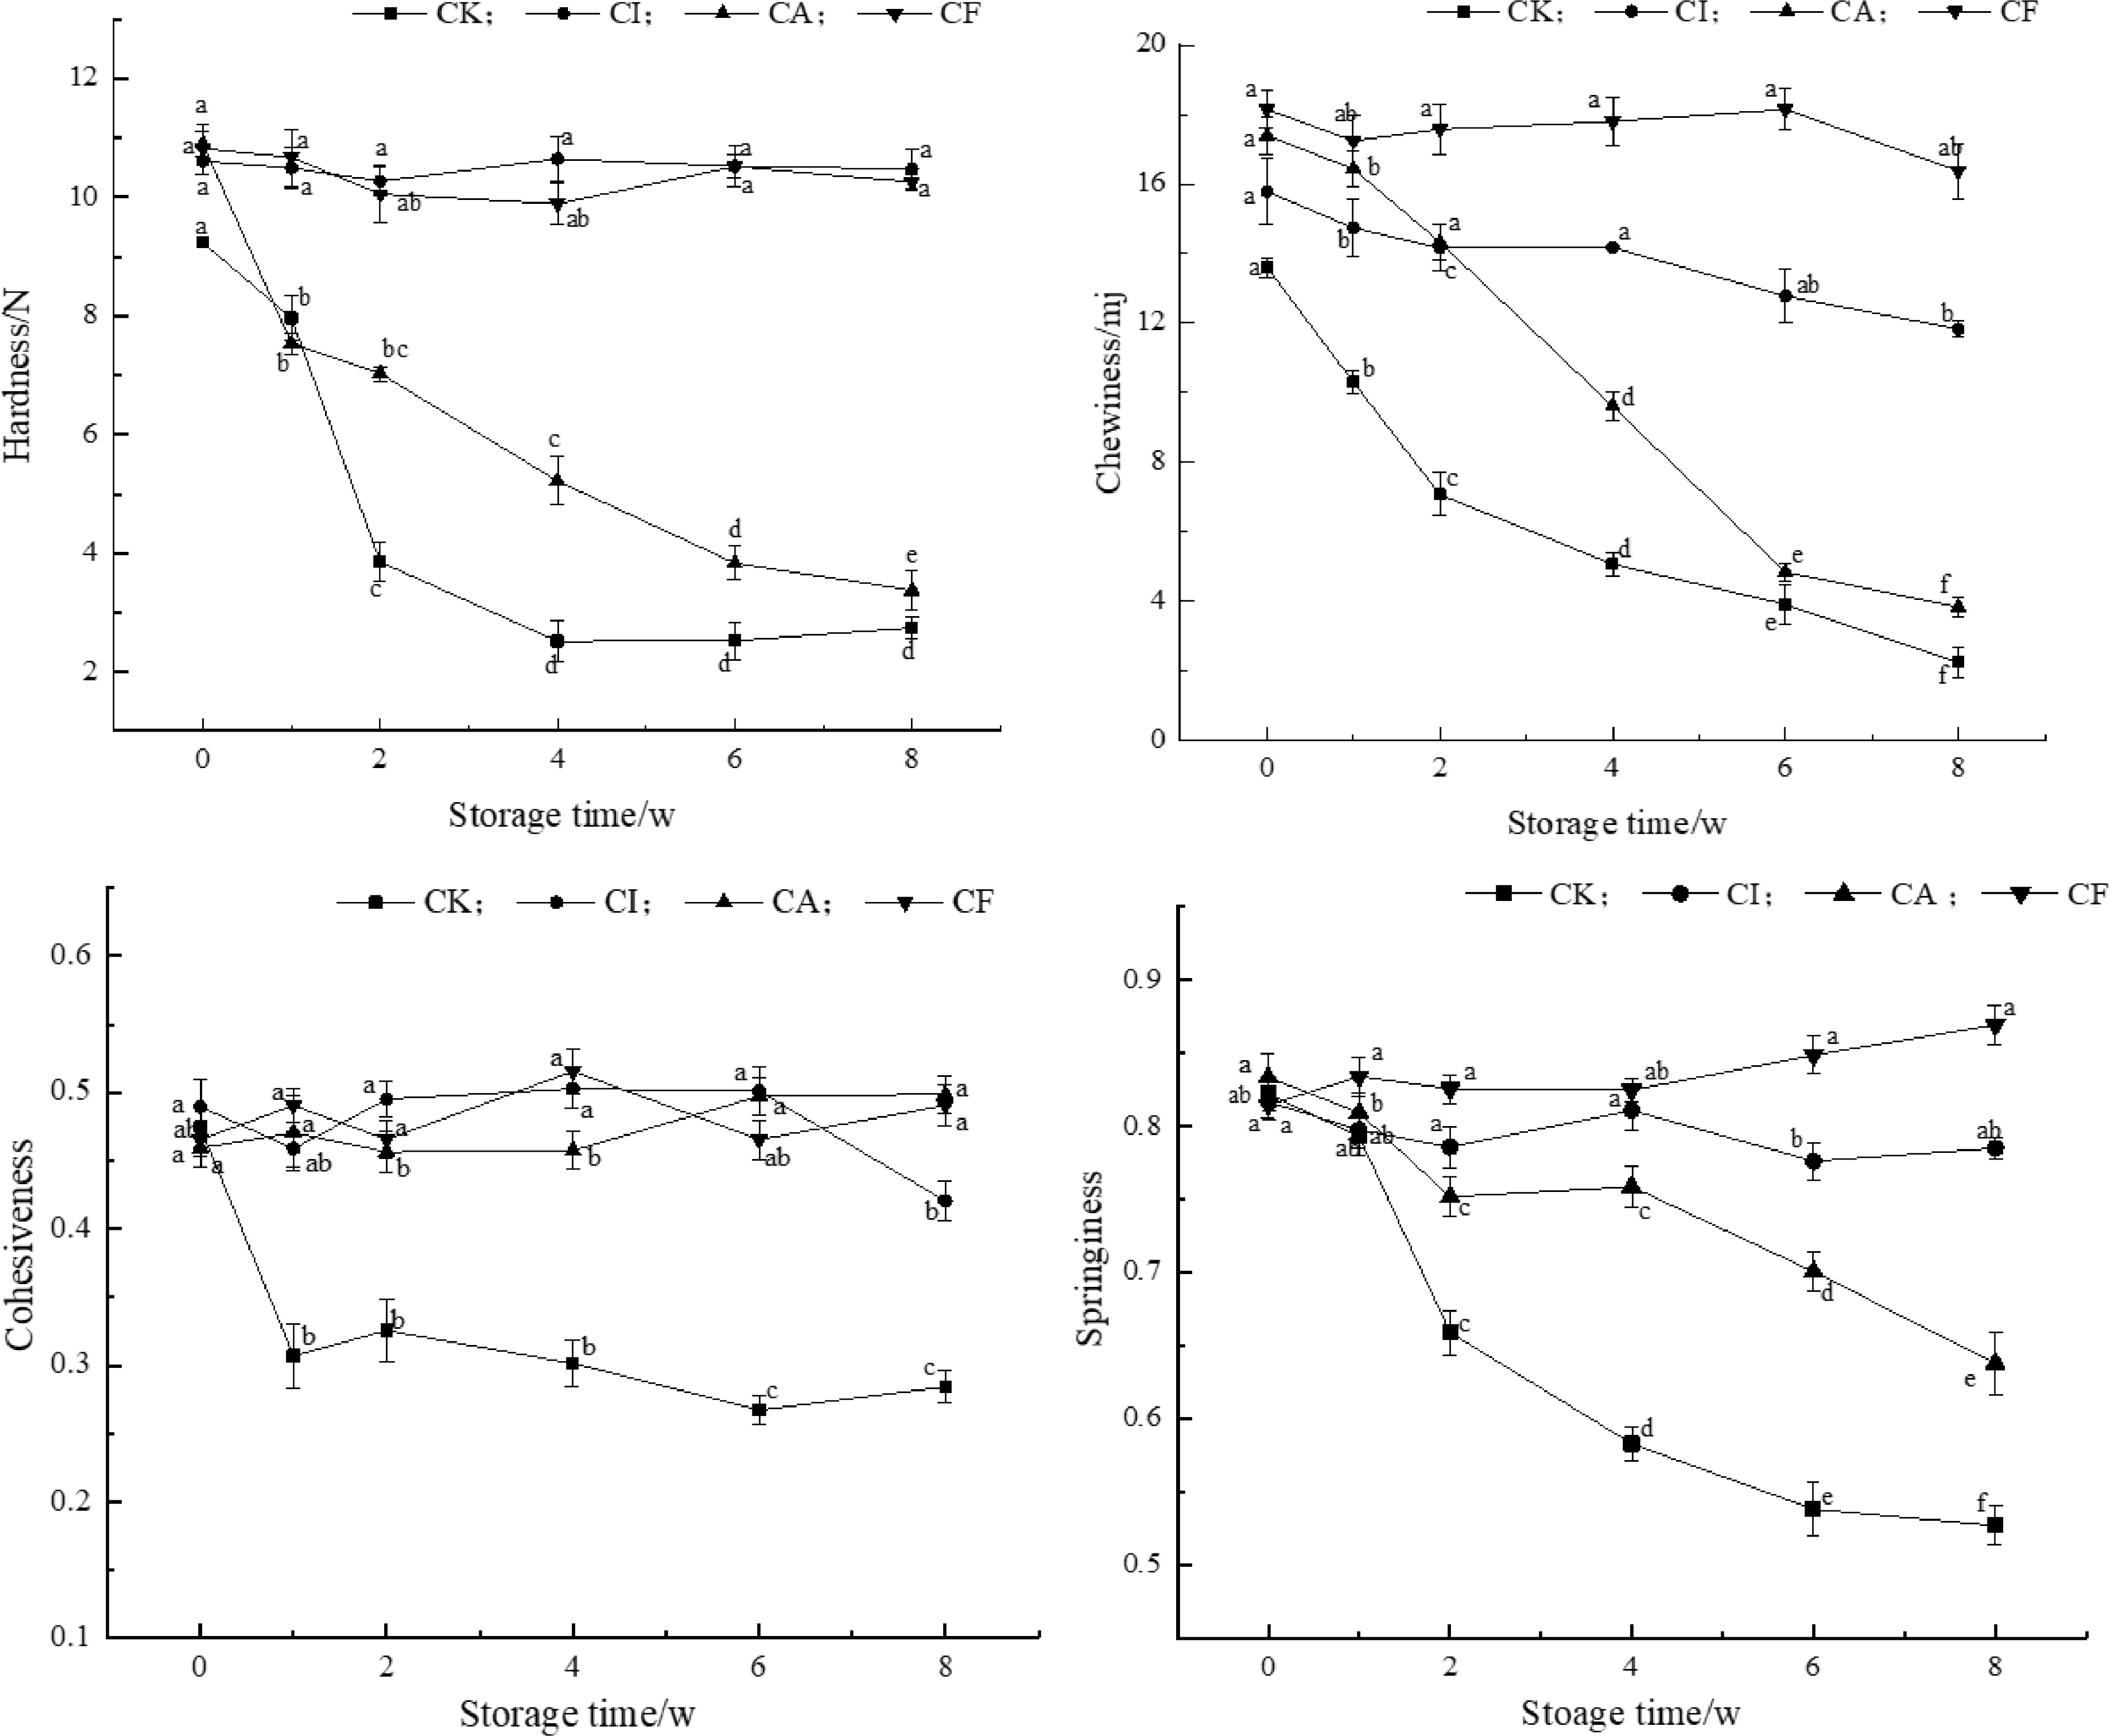
Figure 3.
Effects of different preserving methods on the texture properties of wet konjac noodles during storage. Different letters indicate significantly different at p < 0.05.
-
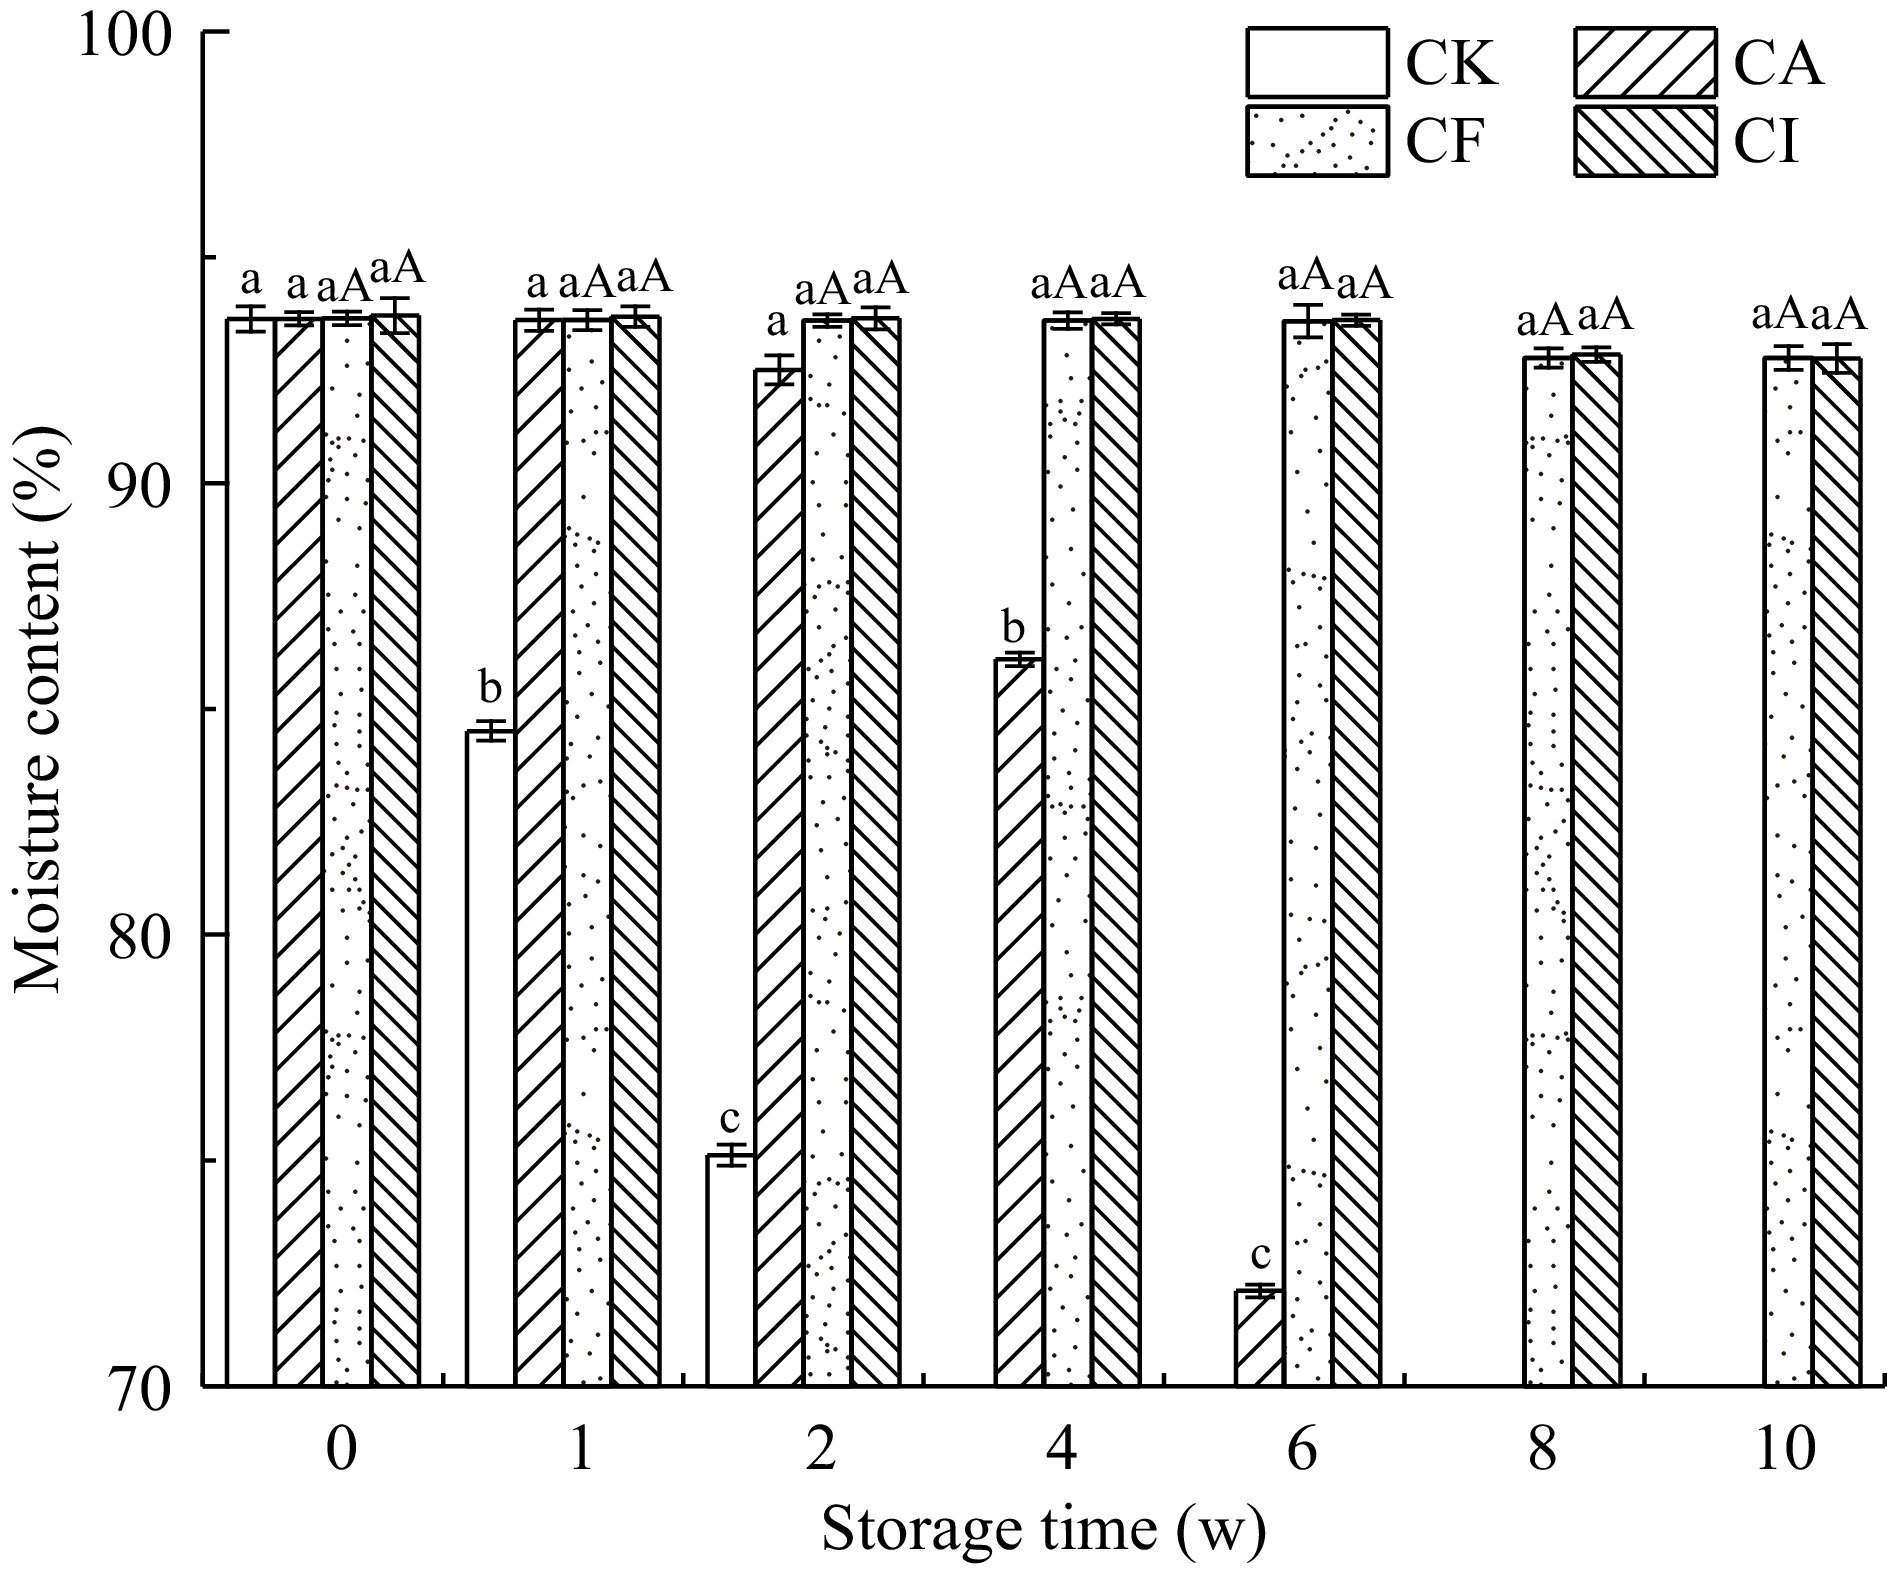
Figure 4.
Different preserving method effects on the moisture content of wet konjac cold noodles during storage. Different lowercase letters indicate significant different at p < 0.05 in the same group at different storage times; Different capital letters indicate significant different at p < 0.05 between different groups during the same storage time.
-
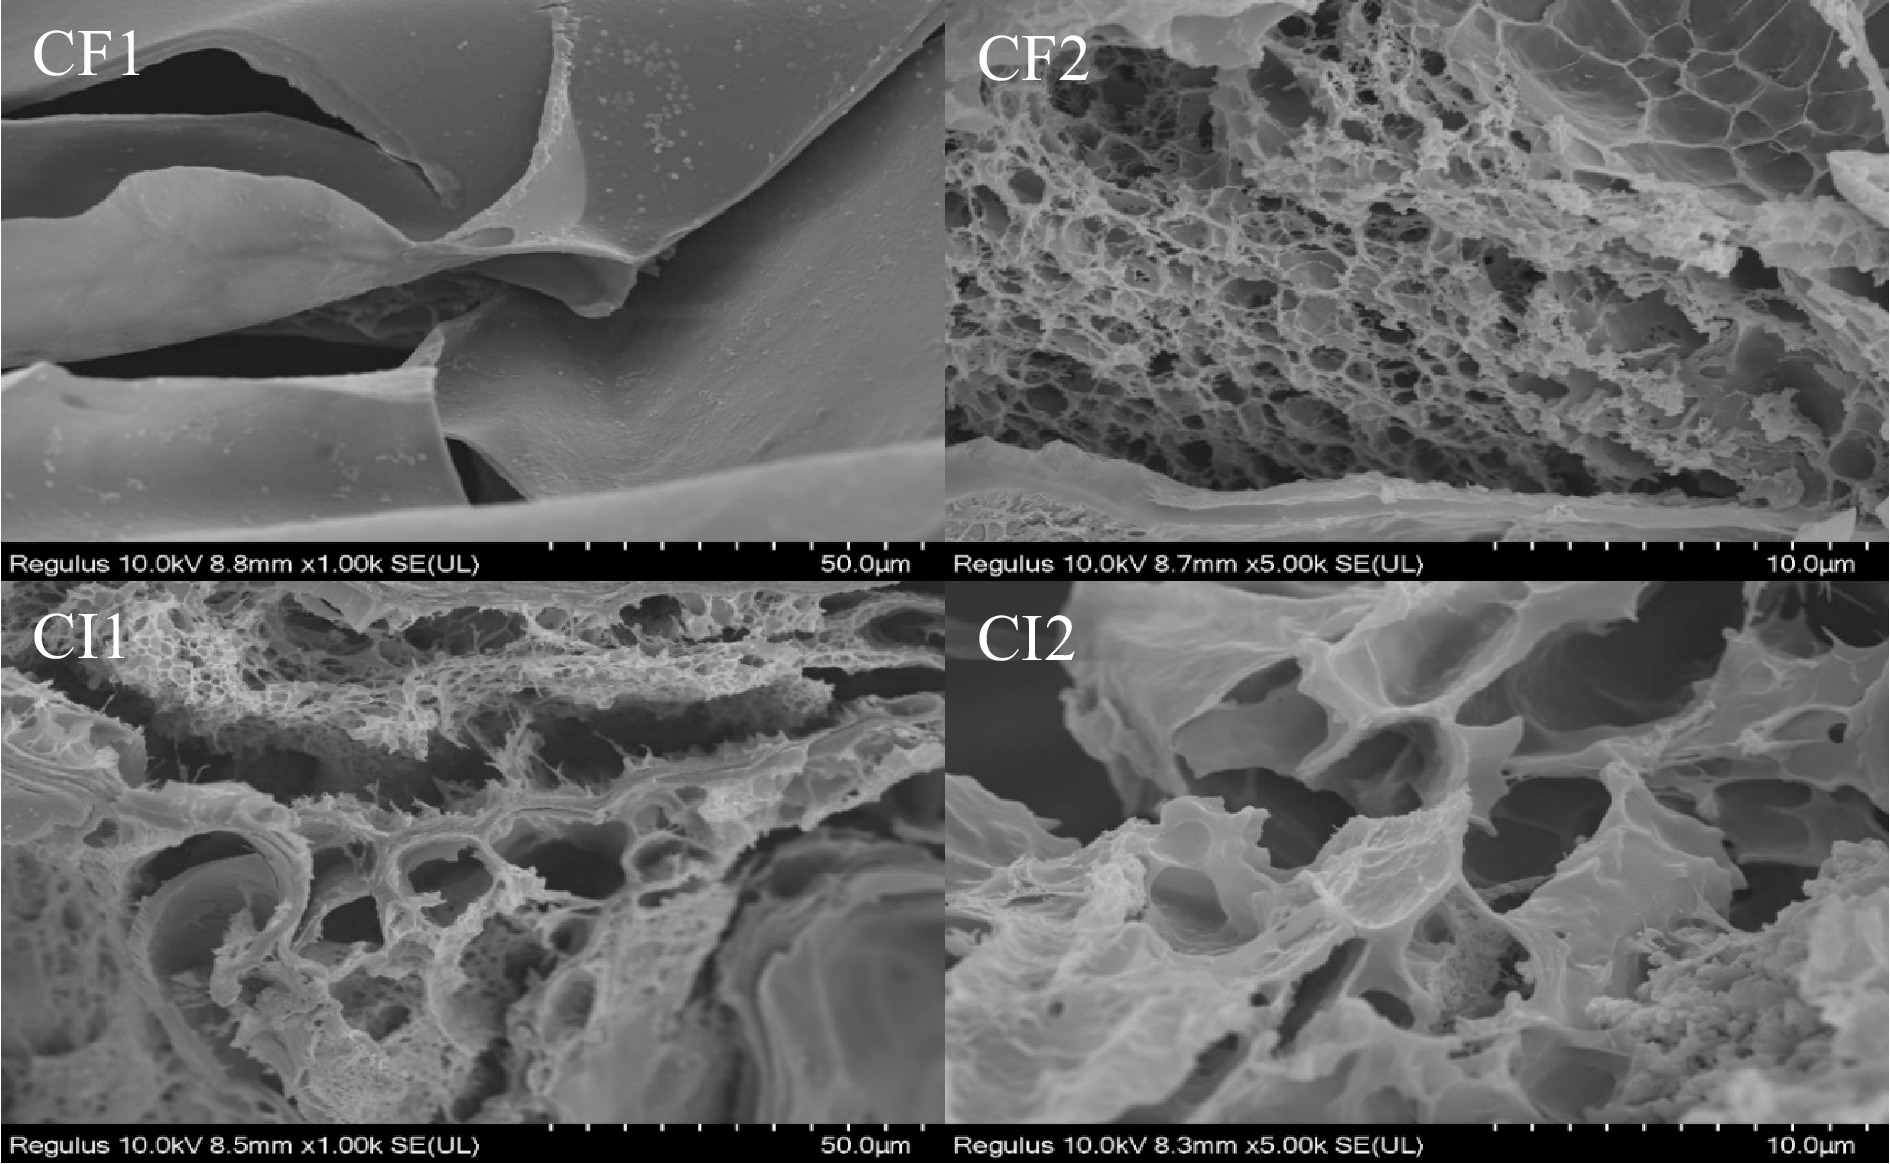
Figure 5.
Micro-images of a cross-section of wet konjac noodles in CF and CI groups. CF1 and CI1 are shown at the scale of 50.0 μm, while the CF2 and CI2 are shown at the scale of 10.0 μm.
-
Group Acid soaking Alkali immersion Pasteurization Vacuum packing CA + − − − CF + − + + CI − + + + CK − − − − Samples were pasteurized at 90 °C for 10 min and the condition for vacuum packaging was −0.07 ~ −0.08 MPa. '+' means to adopt and '−' means not to adopt. Table 1.
Treatments for preserving wet konjac noodles.
-
Level
(lg CFU·g−1)Groups Storage time (w) 0 1 2 4 6 8 10 Total colony CK <1 2.26 ± 0.08d 5.33 ± 0.03c 5.66 ± 0.03a 5.28 ± 0.07b − − CA <1 1.17 ± 0.01f 1.54 ± 0.02e 2.57 ± 0.04d 5.83 ± 0.08a 4.97 ± 0.08c 5.01 ± 0.04b CF <1 <1 <1 <1 <1 <1 <1 CI <1 <1 <1 <1 <1 <1 <1 E. coli CK <1 1.02 ± 0.05c 1.66 ± 0.07b 1.85 ± 0.06a 1.87 ± 0.07a − − CA <1 <1 1.17 ± 0.08b 1.16 ± 0.01b 1.41 ± 0.07a 1.20 ± 0.06b 1.33 ± 0.03a CI <1 <1 <1 <1 <1 <1 <1 CF <1 <1 <1 <1 <1 <1 <1 Mold/Yeast CK <1 1.11 ± 0.28c 2.46 ± 0.37b 3.75 ± 0.04a 2.64 ± 0.02b − − CA <1 1.07 ± 0.11f 2.26 ± 0.20e 3.63 ± 0.16d 4.28 ± 0.15c 4.66 ± 0.06b 4.99 ± 0.03a CI <1 <1 <1 <1 <1 <1 <1 CF <1 <1 <1 <1 <1 <1 <1 Different lowercase letters represent significant differences of the same treatment during the storage time (p < 0.05); < 1 means that no microorganisms were detected in the culture medium; and '−' means that samples are not detected. Table 2.
Microbial level of wet konjac noodles with different treatments.
-
Parameters Groups Storage time (w) 0 1 2 4 6 8 L* CK 56.62 ± 1.33aB 54.66 ± 0.23bC 50.61 ± 1.02cD 47.74 ± 1.78dB 45.12 ± 1.71eC 44.96 ± 0.87eC CI 54.98 ± 0.55aC 54.20 ± 0.84abC 54.77 ± 0.58aC 53.03 ± 0.85abC 52.16 ± 0.95bB 53.43 ± 0.64abB CA 58.03 ± 0.34aB 58.30 ± 0.49aB 57.24 ± 0.95aB 53.62 ± 1.14bC 53.27 ± 1.16bcB 51.91 ± 1.43cB CF 60.02 ± 1.15aA 61.66 ± 0.37aA 60.52 ± 0.70aA 61.13 ± 0.87aA 61.91 ± 1.80aA 61.87 ± 1.89aA a* CK 1.16 ± 0.32cA 0.08 ± 0.14bA 0.75 ± 0.33aA −0.17 ± 0.26bA 0.04 ± 0.64bA −0.48 ± 0.48bA CI −1.03 ± 0.06bA −1.80 ± 0.30cC −1.15 ± 0.39bB −0.47 ± 0.10aAB −1.38 ± 0.22bB −1.07 ± 0.100bB CA −1.28 ± 0.43abcA −1.44 ± 0.38bcC −1.36 ± 0.22abcB −0.88 ± 0.19aC −0.98 ± 0.37abB −1.60 ± 0.26cC CF −1.34 ± 0.22aA −0.79 ± 0.44aB −1.35 ± 0.73aB −0.63 ± 0.31aBC −0.87 ± 0.56aB −0.59 ± 0.40aAB b* CK 4.25 ± 0.10cA 4.65 ± 0.32cA 5.40 ± 0.77bA 5.88 ± 0.34abA 6.41 ± 0.31aA 6.54 ± 0.44aA CI 3.94 ± 0.37abA 3.87 ± 0.52bB 4.43 ± 0.11aB 4.22 ± 0.11abB 4.32 ± 0.18abBC 4.30 ± 0.25abBC CA 4.23 ± 0.39bcA 3.94 ± 0.36cB 3.89 ± 0.53cB 4.18 ± 0.03bcB 4.73 ± 0.16abB 4.87 ± 0.47aB CF 3.97 ± 0.58aA 4.04 ± 0.18aB 4.05 ± 0.17aB 3.87 ± 0.66aB 3.82 ± 0.71aC 3.93 ± 0.42aC Different lowercase letters represent significant differences in data in the same row (p < 0.05); different capital letters represent significant differences in data in the same column (p < 0.05). Table 3.
Relationship between L*, a*, b* value and storage of different treated samples.
Figures
(5)
Tables
(3)