-
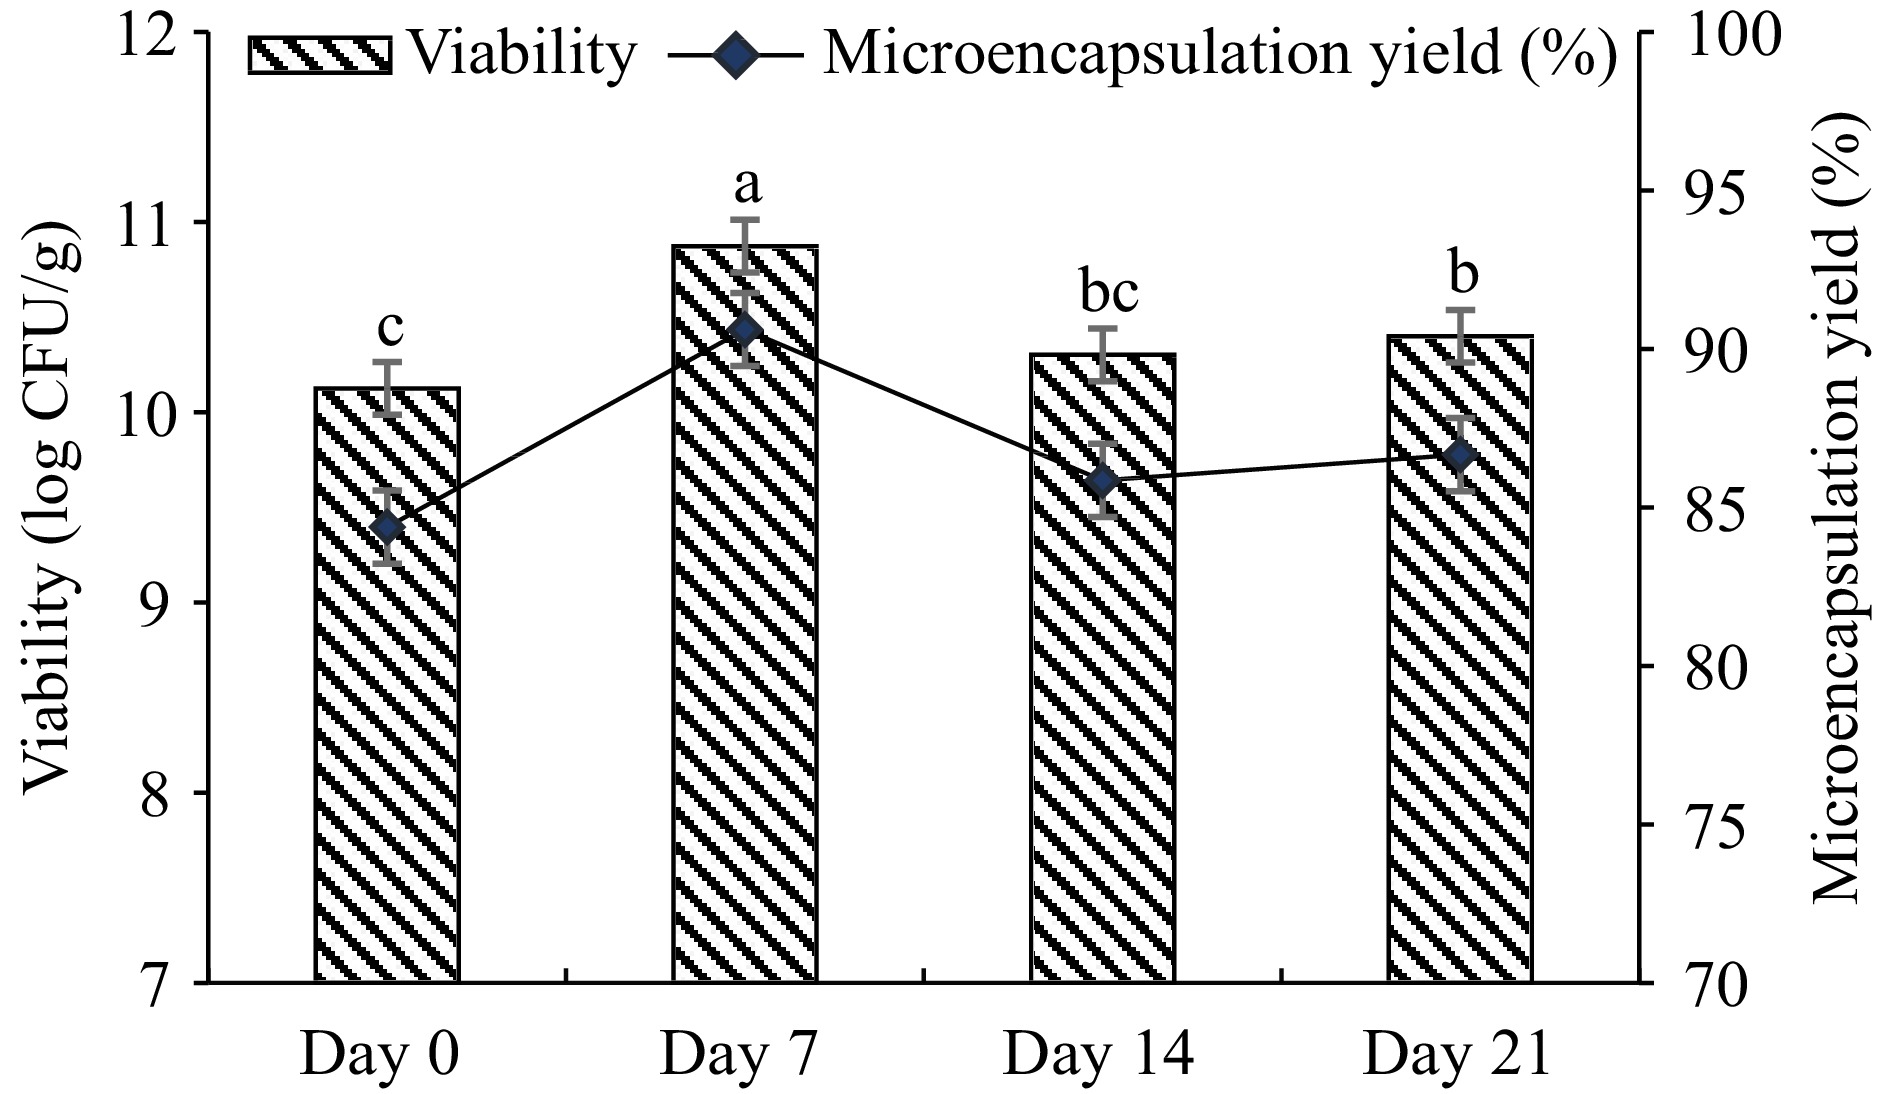
Figure 1.
Viability of microencapsulated L. plantarum (log CFU/g) and microencapsulation efficiency (%). Microcapsules were produced by a water-oil-emulsion technique using gum arabic-WPC complex, stored at 4 °C for 21 d. Results are shown as the means and standard deviations. Data are the average of duplicate samples, obtained in two independent assays.
-
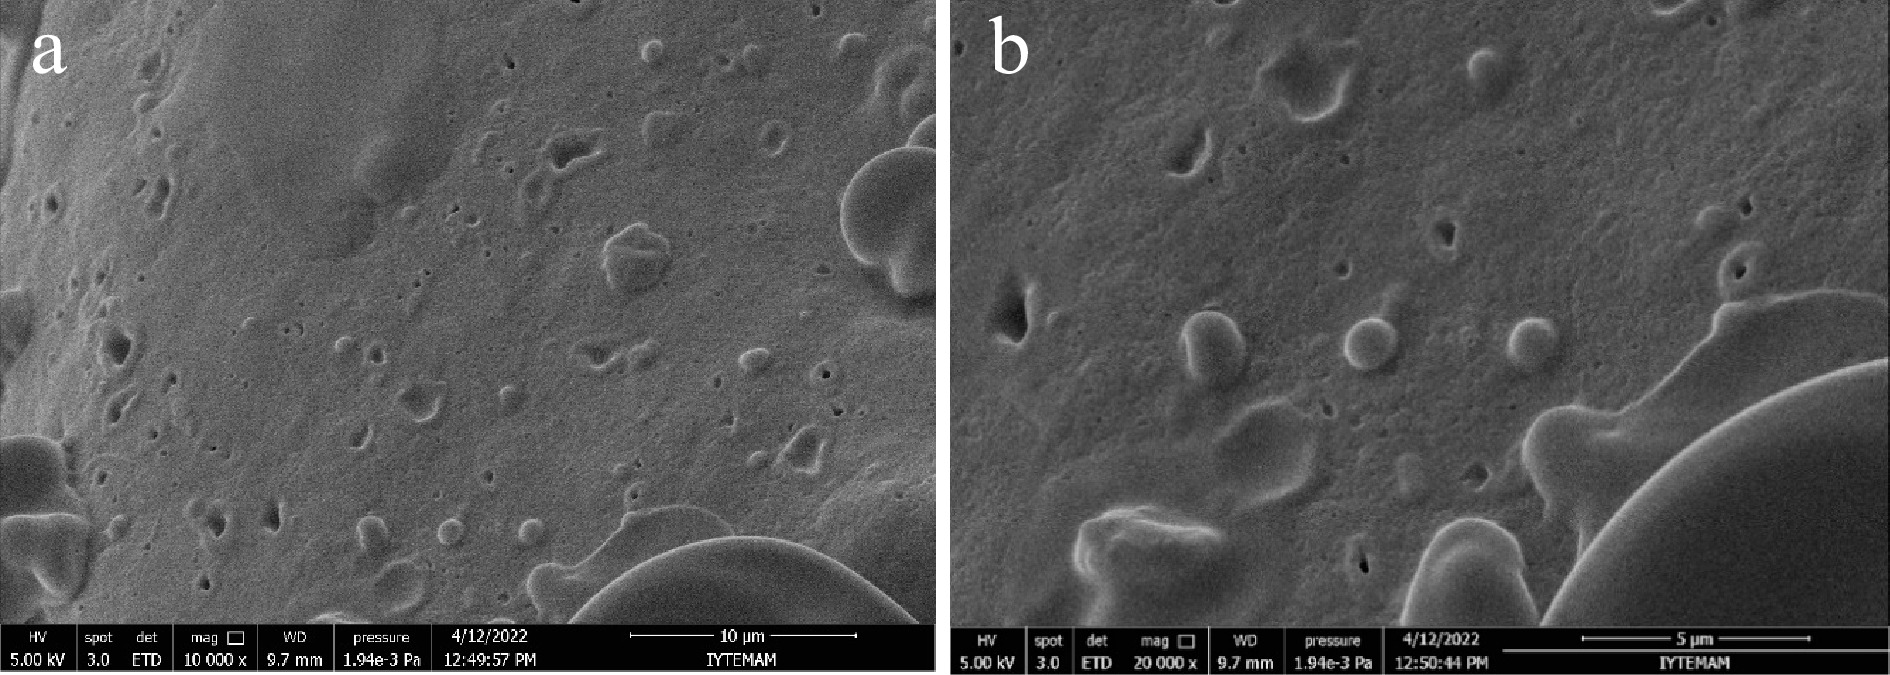
Figure 2.
Scanning electron micrographs of microencapsulated L. plantarum with gum arabic-WPC complex. (a) 10000× magnification, scale bar = 10 μm, (b) 20000× magnification, scale bar = 5 μm.
-
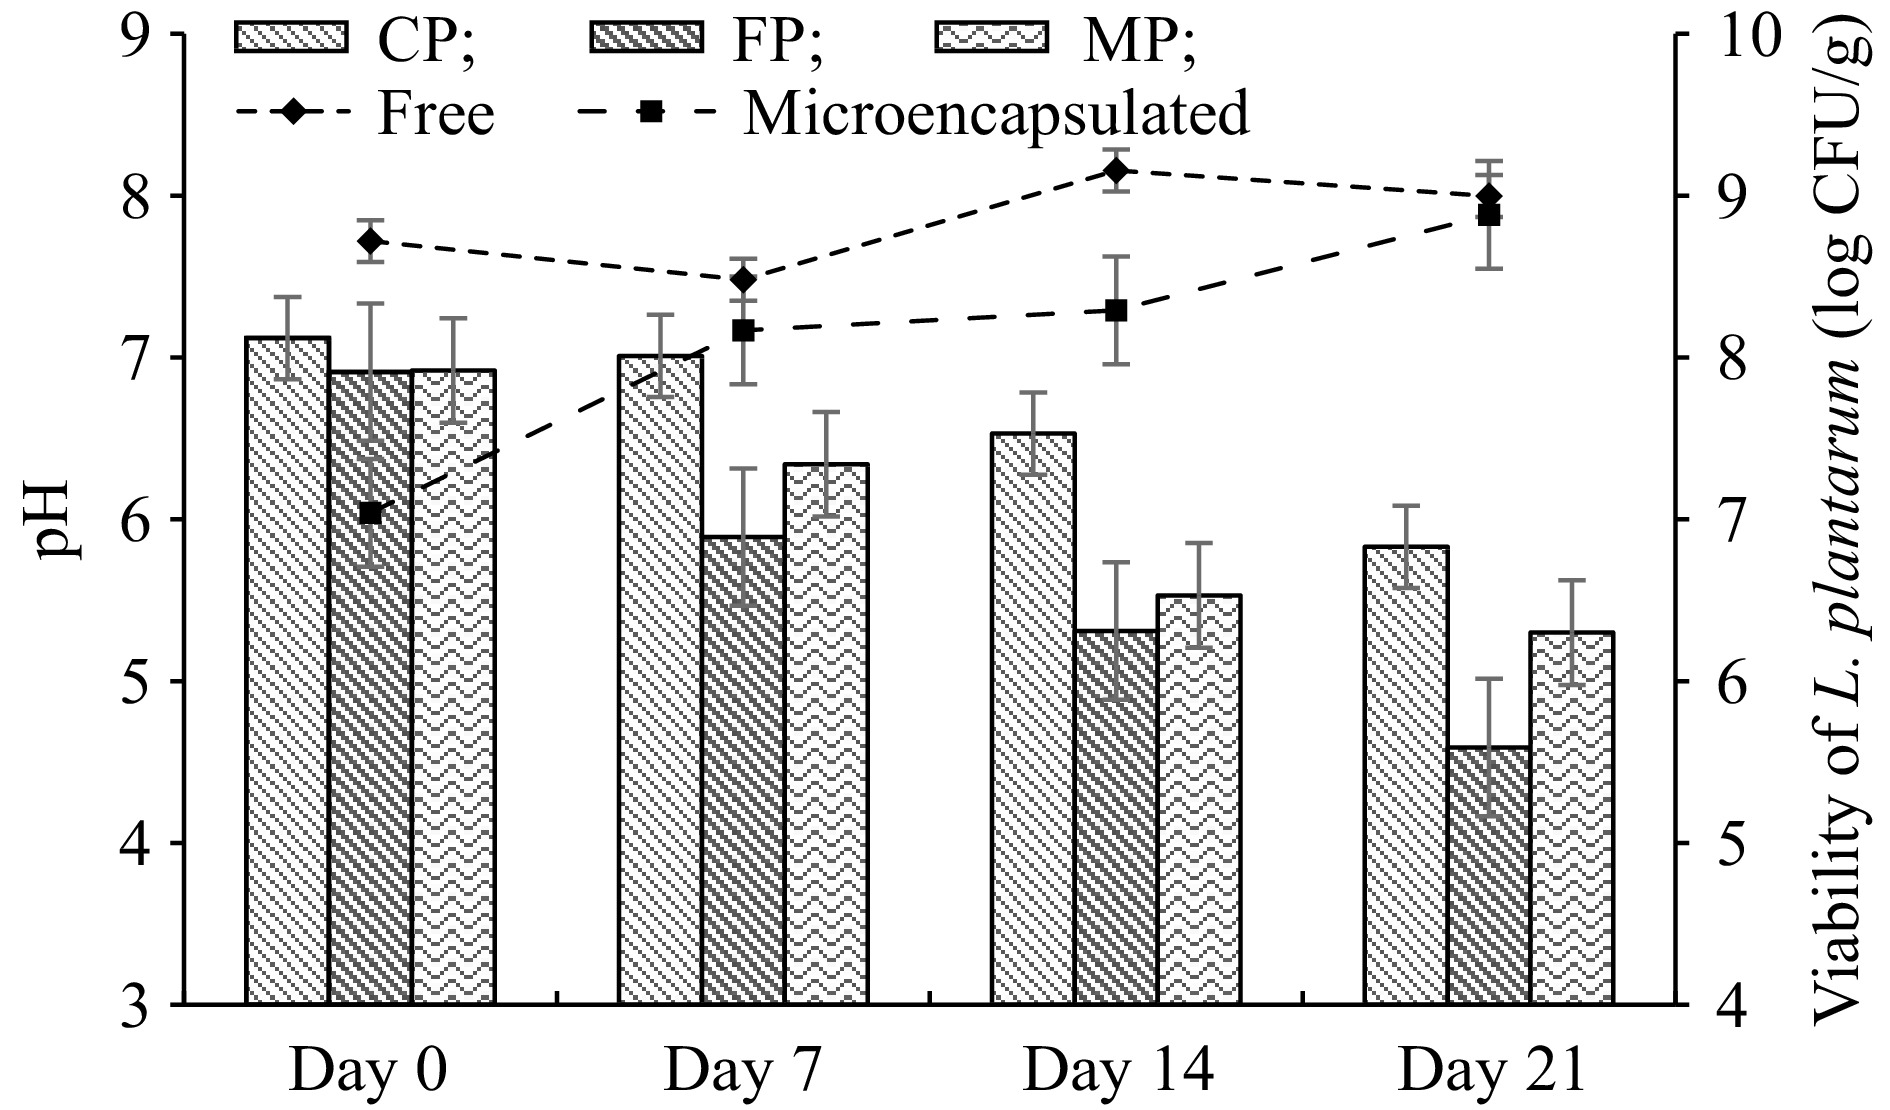
Figure 3.
Changes in pH and viable cell counts of free and microencapsulated L. plantarum in cocoa pudding during the storage at 4 °C. Results are shown as the means and standard deviations. Data are the average of duplicate samples, obtained in two independent assays. MP: Cocoa pudding samples including microencapsulated L. plantarum. FP: Cocoa pudding samples including free cells (non-microencapsulated) of L. plantarum. CP: Control cocoa pudding samples without L. plantarum.
-
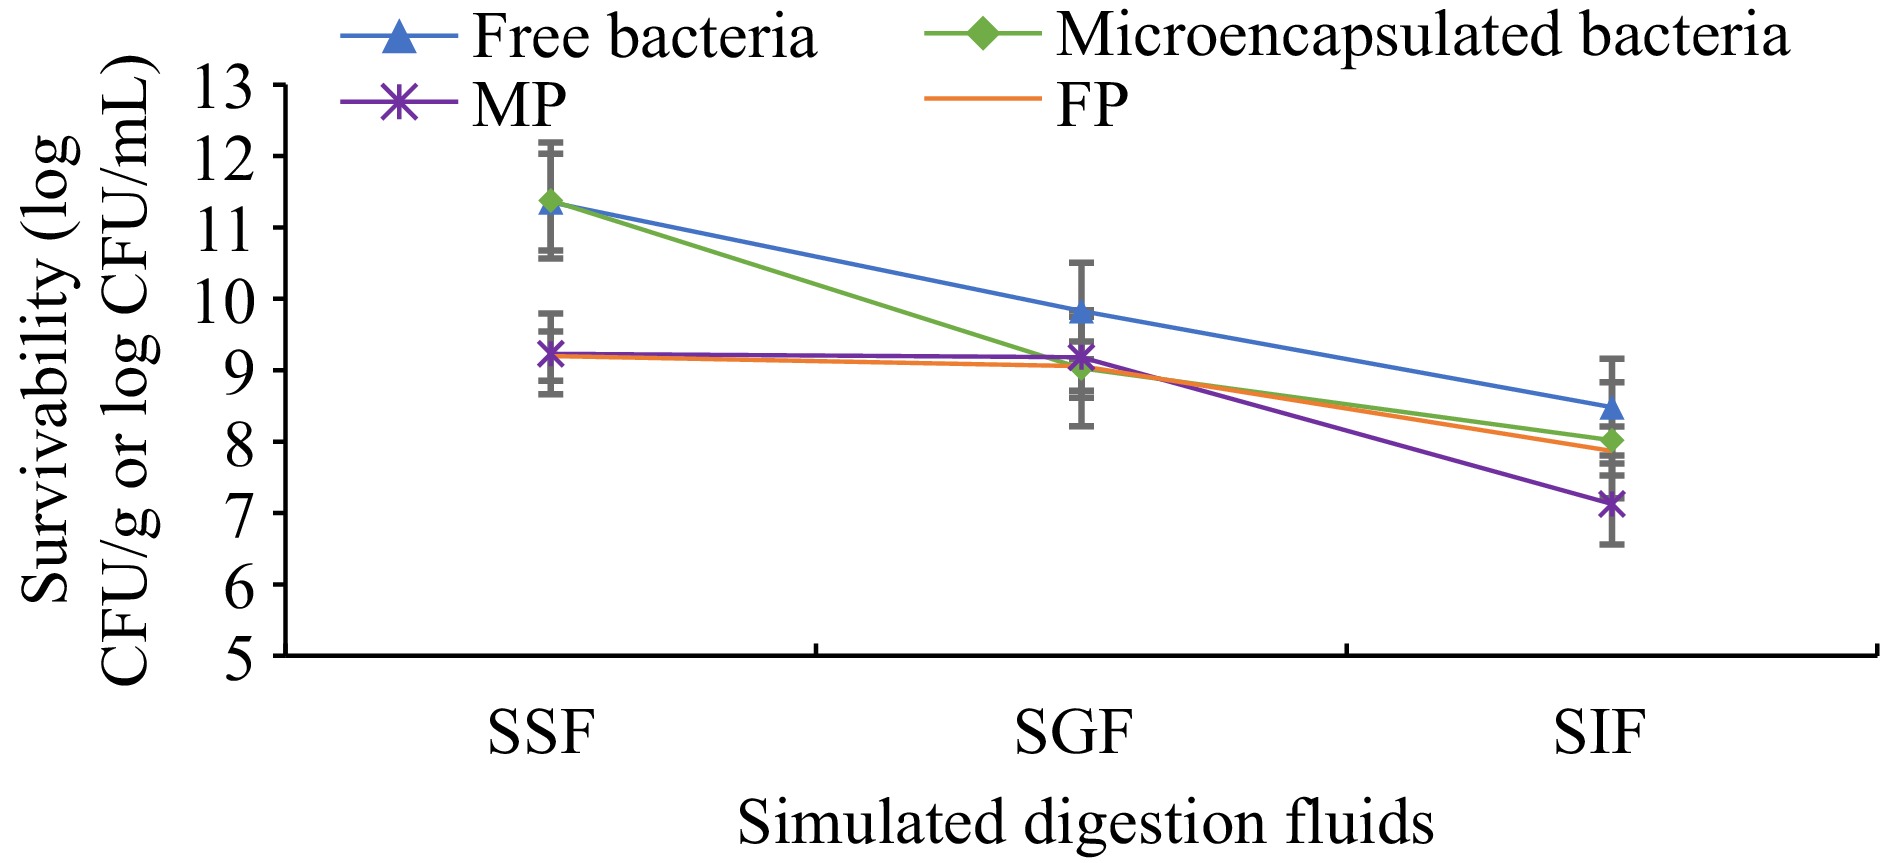
Figure 4.
Survivability of free and microencapsulated L. plantarum. Results are shown as the means and standard deviations. Data are the average of duplicate samples, obtained in two independent assays. SSF: Simulated saliva fluids. SGF: Simulated gastric fluids. SIF: Simulated intestinal fluids. MP: Cocoa pudding samples including microencapsulated L. plantarum. FP: Cocoa pudding samples including free cells (non-microencapsulated) of L. plantarum.
-
Pudding samples Appearance Texture Taste Smell Consistency in mouth General acceptance CP 4.400 ± 0.957A 4.080 ± 0.862A 4.160 ± 0.850A 4.120 ± 0.781A 4.040 ± 1.060A 4.200 ± 0.866A FP 4.280 ± 0.542A 4.200 ± 0.866A 4.200 ± 0.707A 4.040 ± 0.676A 4.160 ± 0.898A 4.160 ± 0.624A MP 4.120 ± 0.781A 4.320 ± 0.945A 4.280 ± 0.843A 3.840 ± 0.800A 4.240 ± 0.970A 4.160 ± 0.800A Results are shown as means ± standard deviation. Different capital letters on the same column show a significant difference by Tukey's test (p < 0.05), n = 25. CP: Control cocoa pudding samples without L. plantarum. MP: Cocoa pudding samples including microencapsulated L. plantarum. FP: Cocoa pudding samples including free cells (non-microencapsulated) of L. plantarum. Table 1.
Sensory evaluation of pudding samples.
Figures
(4)
Tables
(1)