ARTICLE   Open Access    

Cocoa pudding fortified with microencapsulated Lactiplantibacillus plantarum DSM 1954

More Information
  • Probiotic pudding can be served as a functional food with high probiotic viability during production and storage. The aim of this study was to investigate the microencapsulation of Lactiplantibacillus plantarum DSM 1954 with a gum arabic-whey protein concentrate complex using a water-in-oil emulsion technique and to evaluate the stability of microencapsulated and non-microencapsulated L. plantarum in the cocoa pudding and to determine the main quality parameters and sensory characteristics of pudding during storage at 4 °C for 21 d. The efficacy of microencapsulation on the viability over 21 d was determined and an encapsulation efficiency of 86.66% was achieved. Whole milk, cocoa, corn starch, and gum arabic, as well as microencapsulated and non-microencapsulated L. plantarum were used to produce probiotic-fortified cocoa pudding. L. plantarum was added to pudding for 21 d to test their viability and stability. pH values and sensory analysis of pudding were conducted. Microencapsulated and non-microencapsulated L. plantarum cell counts were approximately 9 log CFU/g in pudding samples at the end of 21 d. With storage time, the pH of pudding containing non-microencapsulated bacteria decreased more than that of pudding containing microencapsulated bacteria. The addition of bacteria to the pudding did not have a significant effect on the taste, odor, and texture. Since both microencapsulated and non-microencapsulated bacteria maintain significant viability in pudding during storage, pudding can be considered a potential carrier of probiotics.
  • The Fabaceae family, the third largest family in angiosperms, contains about 24,480 species (WFO, https://wfoplantlist.org), and has been a historically important source of food crops[14]. Peas (formerly Pisum sativa L. renamed to Lathyrus oleraceusPisum spp. will be used hereafter due to historical references to varietal names and subspecies that may not have been fully synonymized), are a member of the Fabaceae family and is among one of the oldest domesticated food crops with ongoing importance in feeding humans and stock. Peas originated in Western Asia and the Mediterranean basin where early finds from Egypt have been dated to ~4500 BCE and further east in Afghanistan from ~2000 BCE[5], and have since been extensively cultivated worldwide[6,7]. Given that peas are rich in protein, dietary fiber, vitamins, and minerals, have become an important part of people's diets globally[810].

    Domesticated peas are the result of long-term human selection and cultivation, and in comparison to wild peas, domesticated peas have undergone significant changes in morphology, growth habits, and yield[1113]. From the long period of domestication starting in and around Mesopotamia many diverse lineages of peas have been cultivated and translocated to other parts of the world[14,15]. The subspecies, Pisum sativum subsp. sativum is the lineage from which most cultivars have been selected and is known for possessing large, round, or oval-shaped seeds[16,17]. In contrast, the subspecies, P. sativum subsp. elatius, is a cultivated pea which more closely resembles wild peas and is mainly found in grasslands and desert areas in Europe, Western Asia, and North Africa. Pisum fulvum is native to the Mediterranean basin and the Balkan Peninsula[15,18], and is resistant to pea rust caused by the fungal pathogen Uromyces pisi. Due to its resistance to pea rust, P. fulvum has been cross-bred with cultivated peas in the development of disease-resistant strains[19]. These examples demonstrate the diverse history of the domesticated pea and why further study of the pea pan-plastome could be employed for crop improvement. While studies based on the nuclear genome have been used to explore the domestication history of pea, these approaches do not account for certain factors, such as maternal inheritance. Maternal lineages, which are inherited through plastomes, play a critical role in understanding the full domestication process. A pan-plastome-based approach will no doubt allow us to investigate the maternal genetic contributions and explore evolutionary patterns that nuclear genome studies may overlook. Besides, pan-plastome analysis enables researchers to systematically compare plastome diversity across wild and cultivated species, identifying specific regions of the plastome that contribute to desirable traits. These plastid traits can then be transferred to cultivated crops through introgression breeding or genetic engineering, leading to varieties with improved resistance to disease, environmental stress, and enhanced agricultural performance.

    Plastids are organelles present in plant cells and are the sites in which several vital biological processes take place, such as photosynthesis in chloroplasts[2024]. Because the origin of plastids is the result of an ancient endosymbiotic event, extant plastids retain a genome (albeit much reduced) from the free-living ancestor[25]. With the advancement of high-throughput DNA sequencing technology, over 13,000 plastid genomes or plastomes have been published in public databases by the autumn of 2023[24]. Large-scale comparison of plastomic data at multiple taxonomic levels has shown that plastomic data can provide valuable insights into evolution, interspecies relationships, and population genetic structure. The plastome, in most cases, displays a conserved quadripartite circular genomic architecture with two inverted repeat (IR) regions and two single copy (SC) regions, referred to as the large single-copy (LSC) and small single-copy (SSC) regions. However, some species have lost one copy of the inverted repeated regions, such as those in Erodium (Geraniaceae family)[26,27] and Medicago (Fabaceae)[28,29]. Compared to previous plastomic studies based on a limited number of plastomes, the construction of pan-plastomes attempts to describe all nucleotide variants present in a lineage through intensive sampling and comparisons. Such datasets can provide detailed insights into the maternal history of a species and help to better understand applied aspects such as domestication history or asymmetries in maternal inheritance, which can help guide future breeding programs. Such pan-plastomes have recently been constructed for several agriculturally important species. A recent study focuses on the genus Gossypium[20], using plastome data at the population level to construct a robust map of plastome variation. It explored plastome diversity and population structure relationships within the genus while uncovering genetic variations and potential molecular marker loci in the plastome. Besides, 65 samples were combined to build the pan-plastome of Hemerocallis citrina[30] , and 322 samples for the Prunus mume pan-plastome[31]. Before these recent efforts, similar pan-plastomes were also completed for Beta vulgaris[32], and Nelumbo nucifera[33]. However, despite the agricultural importance of peas, no such pan-plastome has been completed.

    In this study, 103 complete pea plastomes were assembled and combined another 42 published plastomes to construct the pan-plastome. Using these data, the following analyses were conducted to better understand the evolution and domestication history of pea: (1) genome structural comparisons, (2) codon usage bias, (3) simple sequence repeat patterns, (4) phylogenetic analysis, and (5) nucleotide variation of plastomes in peas.

    One hundred and three complete pea plastomes were de novo assembled from public whole-genome sequencing data[34]. For data quality control, FastQC v0.11.5 (www.bioinformatics.babraham.ac.uk/projects/fastqc/) was utilized to assess the quality of the reads and ensure that the data was suitable for assembly. The clean reads were then mapped to a published pea plastome (MW308610) plastome from the GenBank database (www.ncbi.nlm.nih.gov/genbank) as the reference using BWA v0.7.17[35] and SAMtools v1.9[36] to isolate plastome-specific reads from the resequencing data. Finally, these plastome-specific reads were assembled de novo using SPAdes v3.15.2[37]. The genome annotation was conducted by Geseq online program (https://chlorobox.mpimp-golm.mpg.de/geseq.html). Finally, the OGDRAW v1.3.1[38] program was utilized to visualize the circular plastome maps with default settings. To better resolve the pan-plastome for peas, 42 complete published pea plastomes were also downloaded from NCBI and combined them with the de novo data (Supplementary Table S1).

    To investigate the codon usage in the pan-plastome of pea, we utilized CodonW v.1.4.2 (http://codonw.sourceforge.net) to calculate the Relative Synonymous Codon Usage (RSCU) value of the protein-coding genes (PCGs) longer than 300 bp, excluding stop codons. The RSCU is a calculated metric used to evaluate the relative frequency of usage among synonymous codons encoding the same amino acid. An RSCU value above 1 suggests that the codon is utilized more frequently than the average for a synonymous codon. Conversely, a value below 1 indicates a lower-than-average usage frequency. Besides, the Effective Number of Codons (ENC) and the G + C content at the third position of synonymous codons (GC3s) were also calculated in CodonW v.1.4.2. The ENC value and GC3s value were utilized for generating the ENC-GC3s plot, with the expected ENC values (standard curve), are calculated according to formula: ENC = 2 + GC3s + 29 / [GC3s2 + (1 – GC3s)2][39].

    The MISA program[40] was utilized to detect simple sequence repeats (SSRs), setting the minimum threshold for repeat units at 10 for mono-motifs, 6 for di-motifs, and 5 for tri-, tetra-, penta-, and hexa-motif microsatellites, respectively.

    The 145 complete pea plastomes were aligned using MAFFT v 7.487[41]. Single nucleotide variants (SNVs)-sites were used to derive an SNV only dataset from the entire-plastome alignment[42]. A total of 959 SNVs were analyzed using IQ-TREE v2.1[43] with a TVMe + ASC + R2 substitution model, determined by ModelTest-NG[44] based on BIC, and clade support was assessed with 1,000 bootstrap replicates. Vavilovia formosa (MK604478) was chosen as an outgroup. The principal coordinates analysis (PCA) was conducted in TASSEL 5.0[45].

    DnaSP v6[46] was utilized to identify different haplotypes among the plastomes, with gaps and missing data excluded. Haplotype networks were constructed in Popart v1.7[47] using the median-joining algorithm. Haplotype diversity (Hd) for each group was calculated by DnaSP v6[46], and the evolutionary distances based on the Tamura-Nei distance model were computed based on the population differentiation index (FST) between different groups with the plastomic SNVs.

    In this study, the pan-plastome structure of peas was elucidated (Fig. 1). The length of these plastomes ranged from 120,826 to 122,547 bp. And the overall GC content varied from 34.74% to 34.87%. In contrast to typical plastomes characterized by a tetrad structure, the plastomes of peas contained a single IR copy. The average GC content among all pea plastomes was 34.8%, with the highest amount being 34.84% and the lowest 34.74%, with minimal variation among the pea plastomes.

    Figure 1.  Pea pan-plastome annotation map. Indicated by arrows, genes listed inside and outside the circle are transcribed clockwise and counterclockwise, respectively. Genes are color-coded by their functional classification. The GC content is displayed as black bars in the second inner circle. SNVs, InDels, block substitutions and mixed variants are represented with purple, green, red, and black lines, respectively. Single nucleotide variants (SNVs), block substitutions (BS, two or more consecutive nucleotide variants), nucleotide insertions or deletions (InDels), and mixed sites (which comprise two or more of the preceding three variants at a particular site) are the four categories into which variants are divided.

    A total of 110 unique genes were annotated (Supplementary Table S2), of which 76 genes were PCGs, 30 were transfer RNA (tRNA) genes and four were ribosomal RNA (rRNA) genes. Genes containing a single intron, include nine protein-coding genes (rpl16, rpl2, ndhB, ndhA, petB, petD, rpoC1, clpP, atpF) and six tRNA genes (trnK-UUU, trnV-UAC, trnL-UAA, trnA-UGC, trnI-GAU, trnG-UCC). Additionally, two protein-coding genes ycf3 and rps12 were found to contain two introns.

    The codon usage frequency in pea plastome genes is shown in Fig. 2a. The analysis of codon usage in the pea plastome indicated significant biases for specific codons across various amino acids. Here a nearly average usage in some amino acids was observed, such as Alanine (Ala) and Valine (Val). For most amino acids, the usage of different synonymous codons was not evenly distributed. Regarding stop codons, a nearly even usage was found, with 37.0% for TAA, 32.2% for TAG and 30.8% for TGA.

    Figure 2.  (a) The overall codon usage frequency in 51 CDSs (length > 300 bp) from the pea pan-plastome. (b) The heatmap of RSCU values in 51 CDSs (length > 300 bp) from the pea pan-plastome. The x-axis represents different codons and the y-axis represents different CDSs. The tree at the top was constructed based on a Neighbor-Joining algorithm.

    The RSCU heatmap (Fig. 2b) showed different RSCU values for all codons in plastomic CDSs. In general, a usage bias for A/T in the third position of codons was found among CDSs in the pea pan-plastome. The RSCU values among these CDSs ranged from 0 to 4.8. The highest RSCU value (4.8) was found with the CGT codon in the cemA gene, where six synonymous codons exist for Arg but only CGT (4.8) and AGG (1.2) were used in this gene. This explained in large part the extreme RSCU value for CGT, resulting in an extreme codon usage bias in this amino acid.

    In the ENC-GC3s plot (Fig. 3), 31 PCGs were shown below the standard curve, while 20 PCGs were above. Besides, around 12 PCGs were near the curve, which meant these PCGs were under the average natural selection and mutation pressure. This plot displayed that the codon usage preferences in pea pan-plastomes were mostly influenced by natural selection. Five genes were shown an extreme influence with natural selection for its extreme ΔENC (ENCexpected – ENC) higher than 5, regarding as petB (ΔENC = 5.18), psbA (ΔENC = 8.96), rpl16 (ΔENC = 5.62), rps14 (ΔENC = 14.29), rps18 (ΔENC = 6.46) (Supplementary Table S3).

    Figure 3.  The ENC-GC3s plot for pea pan-plastome, with GC3s as the x-axis and ENC as the y-axis. The expected ENC values (standard curve) are calculated according to formula: ENC = 2 + GC3s + 29 / [GC3s2 + (1 − GC3s)2].

    For SSR detection (Fig. 4), mononucleotide, dinucleotide, and trinucleotide repeats were identified in the pea pan-plastome including A/T, AT/TA, and AAT/ATT. The majority of these SSRs were mononucleotides (A/T), accounting for over 90% of all identified repeats. Additionally, we observed that A/T and AT/TA repeats were present in all pea accessions, whereas only about half of the plastomes contained AAT/ATT repeats. It was also found that the number of A/T repeats exhibited the greatest diversity, while the number of AAT/ATT repeats showed convergence in all plastomes that possessed this repeat.

    Figure 4.  Simple sequence repeats (SSRs) in the pea pan-plastome. The x-axis represents different samples of pea and the y-axis represents the number of repeats in this sample. (a) The number of A/T repeats in the peapan-plastome. (b) The number of AT/TA and AAT/ATT repeats of pea pan-plastomes.

    To better understand the phylogenetic relationships and evolutionary history of peas, a phylogenetic tree was reconstructed using maximum likelihood for 145 pea accessions utilizing the whole plastome sequences (Fig. 5a). The 145 pea accessions were grouped into seven clades with high confidence. These groups were named the 'PF group', 'PSeI-a group', 'PSeI-b group', 'PA group', 'PSeII group', 'PSeIII group', and the 'PS group'. The naming convention for these groups relates to the majority species names for accessions in each group, where P. fulvum makes up the 'PF group', P. sativum subsp. elatius in the 'PSeI-a group', 'PSeI-b group', 'PSeII group', and 'PSeIII group', P. abyssinicum in the 'PA group', and P. sativum in the 'PS group'. From this phylogenetic tree, it was observed that the 'PSeI-a group' and the 'PSeI-b group' had a close phylogenetic relationship and nearly all accessions in these two groups (except DCG0709 accession was P. sativum) were identified as P. sativum subsp. elatius. In addition to the P. sativum subsp. elatius found in PSeI, seven accessions from the PS group were identified as P. sativum subsp. elatius.

    The PCA results (Fig. 5b) also confirmed that domesticated varieties P. abyssinicum were closer to cultivated varieties PSeI and PSeII, while PSeIII was more closely clustered with cultivated varieties of P. sativum. A previous study has indicated that P. sativum subsp. sativum and P. abyssinicum were independently domesticated from different P. sativum subsp. elatius populations[34].

    The complete plastome sequences were utilized for haplotype analysis using TCS and median-joining network methods (Fig. 5c). A total of 76 haplotypes were identified in the analysis. The TCS network resolved a similar pattern as the other analyses in that six genetic clusters were resolved with genetic clusters PS and PSeIII being very closely related. The genetic cluster containing P. fulvum exhibits greater genetic distance from other genetic clusters. The genetic clusters containing P. abyssinicum (PA) and P. sativum (PS) had lower levels of intracluster differentiation. In the TCS network, Hap30 and Hap31 formed distinct clusters from other haplotypes, such as Hap27, which may account for the genetic difference between the 'PSeI-a group' and 'PSeI-b group'. The network analysis results were consistent with the findings of the phylogenetic tree and principal component analyses results in this study.

    Figure 5.  (a) An ML tree resolved from 145 pea plastomes. (b) PCA analysis showing the first two components. (c) Haplotype network of pea plastomes. The size of each circle is proportional to the number of accessions with the same haplotype. (d) Genetic diversity and differentiation of six clades of peas. Pairwise FST between the corresponding genetic clusters is represented by the numbers above the lines joining two bubbles.

    Among the six genetic clusters, the highest haplotype diversity (Hd) was observed in PSeIII (Hd = 0.99, π = 0.22 × 10⁻³), followed by PSeII (Hd = 0.96, π = 0.43 × 10⁻³), PSeI (Hd = 0.96, π = 0.94 × 10⁻³), PF (Hd = 0.94, π = 0.6 × 10⁻⁴), PS (Hd = 0.88, π = 0.3 × 10⁻⁴), and PA (Hd = 0.70, π = 0.2 × 10⁻⁴). Genetic differentiation was evaluated between each genetic cluster by calculating FST values. As shown in Fig. 5d, except for the relatively lower population differentiation between PS and PSeIII (FST = 0.54), and between PSeI and PSeII (FST = 0.59), the FST values between the remaining clades ranged from 0.7 to 0.9. The highest population differentiation was observed between PF and PA (FST = 0.98). The FST values between PSeI and different genetic clusters were relatively low, including PSeI and PF (FST = 0.80), PSeI and PS (FST = 0.77), PSeI and PSeIII (FST = 0.72), PSeI and PSeII (FST = 0.59), and PSeI and PA (FST = 0.72).

    To further determine the nucleotide variations in the pea pan-plastome, 145 plastomes were aligned and nucleotide differences analyzed across the dataset. A total of 1,579 variations were identified from the dataset (Table 1), including 965 SNVs, 24 Block Substitutions, 426 InDels, and 160 mixed variations of these three types. Among the SNVs, transitions were more frequent than transversions, with 710 transitions and 247 transversions. In transitions, T to G and A to C had 148 and 139 occurrences, respectively, while in transversions, G to A and C to T had 91 and 77 occurrences, respectively.

    Table 1.  Nucleotide variation in the pan-plastome of peas.
    Variant Total SNV Substitution InDel Mix
    (InDel, SNV)
    Mix
    (InDel, SUB)
    Total 1,576 965 24 426 156 4
    CDS 734 445 6 176 103 4
    Intron 147 110 8 29 0 0
    tRNA 20 15 1 4 0 0
    rRNA 11 3 0 6 2 0
    IGS 663 392 9 211 51 0
     | Show Table
    DownLoad: CSV

    When analyzing variants by their position to a gene (Fig. 6), there were 731 variations in CDSs, accounting for 46.3% of the total variations, including 443 SNVs (60.6%), six block substitutions (0.83%), 175 InDels (23.94%), and four mixed variations (14.64%). There were 104 variants in introns, accounting for 6.59% of the total variations, including 78 SNVs (75%), seven block substitutions (6.73%), and 19 InDels (18.27%). IGS (Intergenic spacers) contained 660 variations, accounting for 41.8% of the total variations, including 394 SNVs (59.7%), nine block substitutions (1.36%), 207 InDels (31.36%), and 50 mixed variations (7.58%). The tRNA regions contained 63 variants, accounting for 3.99% of the total variations, including 47 SNVs (74.6%) and 14 InDels (22.2%). The highest number of variants were detected in the IGS regions, while the lowest were found in introns. Among CDSs, accD (183) had the highest number of variations. In introns, rpL16 (18) and ndhA (16) had the most variants. In the IGS regions, ndhD-trnI-CAU (73), and trnL-UAA-trnT-UGU (44) possessed the greatest number of variants.

    Figure 6.  Variant locations within the pea pan-plastome categorized by genic position (Introns, CDS, and IGS).

    Finally, examples of some genes with typical variants were provided to better illustrate the sequence differences between clades (Fig. 7). For example, the present analysis revealed that the ycf1 gene exhibited a high number of variant loci, which included unique single nucleotide variants (SNVs) specific to the P. abyssinicum clade. Additionally, a unique InDel variant belonging to P. abyssinicum was identified. Similar unique SNVs and InDels were also found in other genes, such as matK and rpoC2, distinguishing the P. fulvum clade from others. These unique SNVs and InDels could serve as DNA barcodes to distinguish different maternal lineages of peas.

    Figure 7.  Examples of variant sites.

    The present research combined 145 pea plastomes to construct a pan-plastome of peas. Compared to single plastomic studies, pan-plastome analyses across a species or genus provide a higher-resolution understanding of phylogenetic relationships and domestication history. Most plastomes in plants possess a quadripartite circular structure with two inverted repeat (IR) regions and two single copy regions (LSC and SSC)[2024]. However, the complete loss of one of the IR regions in the pea plastome was observed which is well-known among the inverted repeat-lacking clade (IRLC) species in Fabaceae. The loss of IRs has been documented in detail from other genera such as Erodium (Geraniaceae family)[26,27] and Medicago (Fabaceae family)[28,29]. This phenomenon although not commonly observed, constitutes a significant event in the evolutionary trajectories of certain plant lineages[26]. Such large-scale changes in plastome architecture are likely driven in part by a combination of selective pressures and genetic drift[48]. In the pea pan-plastome, it was also found that, compared to some plants with IR regions, the length of the plastomes was much shorter, and the overall GC content was lower. This phenomenon was due to the loss of one IR with high GC content.

    Repetitive sequences are an important part of the evolution of plastomes and can be used to reconstruct genealogical relationships. Mononucleotide SSRs are consistently abundant in plastomes, with many studies identifying them as the most common type of SSR[4952]. Among these, while C/G-type SSRs may dominate in certain species[53,54], A/T types are more frequently observed in land plants. The present research was consistent with these previous conclusions, showing an A/T proportion exceeding 90% (Fig. 4). Due to their high rates of mutation, SSRs are widely used to study phylogenetic relationships and genetic variation[55,56]. Additionally, like other plants, pea plastome genes have a high frequency of A/Ts in the third codon position. This preference is related to the higher AT content common among most plant plastomes and Fabaceae plastomes in particular with their single IRs[57,58]. The AT-rich regions are often associated with easier unwinding of DNA during transcription and potentially more efficient and accurate translation processes[59]. The preference for A/T in third codon positions may also be influenced by tRNA availability, as the abundance of specific tRNAs that recognize these codons can enhance the efficiency of protein synthesis[60,61]. However, not all organisms exhibit this preference for A/T-ending codons. For instance, many bacteria have GC-rich genomes and thus show a preference for G/C-ending codons[6264]. This variation in codon usage bias reflects the differences in genomic composition and the evolutionary pressures unique to different lineages.

    This study also comprehensively examined the variant loci of the pea pan-plastome. Among these variant sites, some could potentially serve as DNA barcode sites for specific lineages of peas, such as ycf1, rpoC2, and matK. Both ycf1 and matK have been widely used as DNA barcodes in many species[6568], as they are hypervariable. Researchers now have a much deeper understanding of the crucial role plastomes have played in plant evolution[6971]. By generating a comprehensive map of variant sites, future researchers can now more effectively trace differences in plastotypes to physiological and metabolic traits for use in breeding elite cultivars.

    The development of a pan-plastome for peas provides new insights into the maternal domestication history of this important food crop. Based on the phylogenetic analysis in this study, we observed a clear differentiation between wild and cultivated peas, with P. fulvum being the earliest diverging lineage, and was consistent with former research[34]. The ML tree (Fig. 5a) indicated that cultivated peas had undergone at least two independent domestications, namely from the PA and PS groups, which is consistent with former research[34]. However, as the present study added several accessions over the previous study and plastomic data was utilized, several differences were also found[34], such as the resolution of the two groups, referred to as PSeI-a group and PSeI-b group which branched between the PA group and PF group. Previous research based on nuclear data[34] only and with fewer accessions showed that the PA group and PF group were closely related in phylogeny, with no PSeI group appearing between them. One possible explanation is that the PSeI-a and PSeI-b lineages represents the capture and retention of a plastome from a now-extinct lineage while backcrossing to modern cultivars has obscured this signal in the nuclear genomic datasets. However, procedural explanations such as incorrectly identified accessions might have also resulted in such patterns. In either case, the presence of these plastomes in the cultivated pea gene pool should be explored for possible associations with traits such as disease resistance and hybrid incompatibility. This finding underscores the complexity of the domestication process and highlights the role of hybridization and selection in shaping the genetic landscape of cultivated peas. As such, future studies integrating data from the nuclear genome, mitogenome, and plastome will undoubtedly provide deeper insights into the phylogeny and domestication of peas. This pan-plastome research, encompassing a variety of cultivated taxa, will also support the development of elite varieties in the future.

    This study newly assembled 103 complete pea plastomes. These plastomes were combined with 42 published pea plastomes to construct the first pan-plastome of peas. The length of pea plastomes ranged from 120,826 to 122,547 bp, with the GC content varying from 34.74% to 34.87%. The codon usage pattern in the pea pan-plastome displayed a strong bias for A/T in the third codon position. Besides, the codon usage of petB, psbA, rpl16, rps14, and rps18 were shown extremely influenced by natural selection. Three types of SSRs were detected in the pea pan-plastome, including A/T, AT/TA, and AAT/ATT. From phylogenetic analysis, seven well-supported clades were resolved from the pea pan-plastome. The genes ycf1, rpoC2, and matK were found to be suitable for DNA barcoding due to their hypervariability. The pea pan-plastome provides a valuable supportive resource in future breeding and selection research considering the central role chloroplasts play in plant metabolism as well as the association of plastotype to important agronomic traits such as disease resistance and interspecific compatibility.

  • The authors confirm contribution to the paper as follows: study conception and design: Wang J; data collection: Kan J; analysis and interpretation of results: Kan J, Wang J; draft manuscript preparation: Kan J, Wang J, Nie L; project organization and supervision: Tiwari R, Wang M, Tembrock L. All authors reviewed the results and approved the final version of the manuscript.

  • The annotation files of newly assembled pea plastomes were uploaded to the Figshare website (https://figshare.com/, doi: 10.6084/m9.figshare.26390824).

  • This study was funded by the Guangdong Pearl River Talent Program (Grant No. 2021QN02N792) and the Shenzhen Fundamental Research Program (Grant No. JCYJ20220818103212025). This work was also funded by the Science Technology and Innovation Commission of Shenzhen Municipality (Grant No. RCYX20200714114538196) and the Innovation Program of Chinese Academy of Agricultural Sciences. We are also particularly grateful for the services of the High-Performance Computing Cluster in the Agricultural Genomics Institute at Shenzhen, Chinese Academy of Agricultural Sciences.

  • The authors declare that they have no conflict of interest.

  • [1]

    Ditu LM, Grigore ME, Camen-Comanescu P, Holban AM. 2018. Introduction in Nutraceutical and Medicinal Foods. In Therapeutic, Probiotic, and Unconventional Foods, eds. Grumezescu AM, Holban AM. US: Academic Press. pp. 1–12. https://doi.org/10.1016/b978-0-12-814625-5.00001-7

    [2]

    Guimarães JT, Balthazar CF, Silva R, Rocha RS, Graça JS, et al. 2020. Impact of probiotics and prebiotics on food texture. Current Opinion in Food Science 33:38−44

    doi: 10.1016/j.cofs.2019.12.002

    CrossRef   Google Scholar

    [3]

    Roškar I, Švigelj K, Štempelj M, Volfand J, Štabuc B, et al. 2017. Effects of a probiotic product containing Bifidobacterium animalis subsp. animalis IM386 and Lactobacillus plantarum MP2026 in lactose intolerant individuals: Randomized, placebo-controlled clinical trial. Journal of Functional Foods 35:1−8

    doi: 10.1016/j.jff.2017.05.020

    CrossRef   Google Scholar

    [4]

    Rostami FM, Mousavi H, Mousavi MRN, Shahsafi M. 2018. Efficacy of probiotics in prevention and treatment of infectious diseases. Clinical Microbiology Newsletter 40:97−103

    doi: 10.1016/j.clinmicnews.2018.06.001

    CrossRef   Google Scholar

    [5]

    Zhang F, Qiu L, Xu X, Liu Z, Zhan H, et al. 2017. Beneficial effects of probiotic cholesterol-lowering strain of Enterococcus faecium WEFA23 from infants on diet-induced metabolic syndrome in rats. Journal of Dairy Science 100:1618−28

    doi: 10.3168/jds.2016-11870

    CrossRef   Google Scholar

    [6]

    Afzaal M, Saeed F, Hussain M, Ismail Z, Siddeeg A, et al. 2022. Influence of encapsulation on the survival of probiotics in food matrix under simulated stress conditions. Saudi Journal of Biological Sciences 29:103394

    doi: 10.1016/j.sjbs.2022.103394

    CrossRef   Google Scholar

    [7]

    Cinar A, Altuntas S, Altuntas V. 2021. The addition of royal jelly to dairy probiotic dessert produced with predictive microbiology: Influence on physicochemical, rheological, microbial and sensorial properties. LWT 146:111444

    doi: 10.1016/j.lwt.2021.111444

    CrossRef   Google Scholar

    [8]

    Grom LC, Coutinho NM, Guimarães JT, Balthazar CF, Silva R, et al. 2020. Probiotic dairy foods and postprandial glycemia: A mini-review. Trends in Food Science & Technology 101:165−71

    doi: 10.1016/j.jpgs.2020.05.012

    CrossRef   Google Scholar

    [9]

    Antunes AEC, Liserre AM, Coelho ALA, Menezes CR, Moreno I, et al. 2013. Acerola nectar with added microencapsulated probiotic. LWT - Food Science and Technology 54:125−31

    doi: 10.1016/j.lwt.2013.04.018

    CrossRef   Google Scholar

    [10]

    Saeed F, Afzaal M, Ahmad A, et al. 2022. Enhanced viability of microencapsulated lyophilized probiotics under in vitro simulated gastrointestinal conditions. Journal of Food Processing and Preservation 46(5):e16543

    doi: 10.1111/jfpp.16543

    CrossRef   Google Scholar

    [11]

    Tontul I, Topuz A. 2013. Mixture Design Approach in Wall Material Selection and Evaluation of Ultrasonic Emulsification in Flaxseed Oil Microencapsulation. Drying Technology 31:1362−73

    doi: 10.1080/07373937.2013.795964

    CrossRef   Google Scholar

    [12]

    Augustin MA, Oliver CM. 2014. Use of Milk Proteins for Encapsulation of Food Ingredients. In Microencapsulation in the Food Industry, eds. Gaonkar AG, Vasisht N, Khare AR, Sobel R. US: Academic Press. pp. 211–26. https://doi.org/10.1016/b978-0-12-404568-2.00019-4

    [13]

    Liu H, Xie M, Nie S. 2020. Recent trends and applications of polysaccharides for microencapsulation of probiotics. Food Frontiers 1:45−59

    doi: 10.1002/fft2.11

    CrossRef   Google Scholar

    [14]

    Fareed F, Saeed F, Afzaal M, Imran A, Ahmad A, et al. 2022. Fabrication of electrospun gum Arabic–polyvinyl alcohol blend nanofibers for improved viability of the probiotic. Journal of Food Science and Technology 59:4812−21

    doi: 10.1007/s13197-022-05567-1

    CrossRef   Google Scholar

    [15]

    Kaddam L, Fdl-Elmula I, Saeed A. 2018. Gum arabic beneficial effects, clinical applications, and future prospective. In Gum Arabic: Structure, Properties, Application and Economics, eds. Mariod AA. US: Academic Press. pp. 211–20. https://doi.org/10.1016/B978-0-12-812002-6.00017-8

    [16]

    Çabuk B, Tellioğlu Harsa Ş. 2015. Protection of Lactobacillus acidophilus NRRL-B 4495 under in vitro gastrointestinal conditions with whey protein/pullulan microcapsules. Journal of Bioscience and Bioengineering 120:650−56

    doi: 10.1016/j.jbiosc.2015.04.014

    CrossRef   Google Scholar

    [17]

    Ozturk B, Elvan M, Ozer M, Tellioglu Harsa S. 2021. Effect of different microencapsulating materials on the viability of S. thermophilus CCM4757 incorporated into dark and milk chocolates. Food Bioscience 44:101413

    doi: 10.1016/j.fbio.2021.101413

    CrossRef   Google Scholar

    [18]

    Rajam R, Karthik P, Parthasarathi S, Joseph GS, Anandharamakrishnan C. 2012. Effect of whey protein – alginate wall systems on survival of microencapsulated Lactobacillus plantarum in simulated gastrointestinal conditions. Journal of Functional Foods 4:891−98

    doi: 10.1016/j.jff.2012.06.006

    CrossRef   Google Scholar

    [19]

    Rajam R, Anandharamakrishnan C. 2015. Microencapsulation of Lactobacillus plantarum (MTCC 5422) with fructooligosaccharide as wall material by spray drying. LWT - Food Science and Technology 60:773−80

    doi: 10.1016/j.lwt.2014.09.062

    CrossRef   Google Scholar

    [20]

    Gurmeric VE, Dogan M, Toker OS, Senyigit E, Ersoz NB. 2013. Application of different multi-criteria decision techniques to determine optimum flavour of prebiotic pudding based on sensory analyses. Food and Bioprocess Technology 6:2844−59

    doi: 10.1007/s11947-012-0972-9

    CrossRef   Google Scholar

    [21]

    Brodkorb A, Egger L, Alminger M, Alvito P, Assunção R, et al. 2019. INFOGEST static in vitro simulation of gastrointestinal food digestion. Nature Protocols 14:991−1014

    doi: 10.1038/s41596-018-0119-1

    CrossRef   Google Scholar

    [22]

    Granato D, Masson ML, de Freitas RJS. 2010. Stability studies and shelf life estimation of a soy-based dessert. Food Science and Technology 30:797−807

    doi: 10.1590/S0101-20612010000300036

    CrossRef   Google Scholar

    [23]

    Fidanza M, Panigrahi P, Kollmann TR. 2021. Lactiplantibacillus plantarum–Nomad and Ideal Probiotic. Frontiers in Microbiology 12:712236

    doi: 10.3389/fmicb.2021.712236

    CrossRef   Google Scholar

    [24]

    Ranadheera CS, Evans CA, Adams MC, Baines SK. 2015. Microencapsulation of Lactobacillus acidophilus LA-5, Bifidobacterium animalis subsp.lactis BB-12 and Propionibacterium jensenii 702 by spray drying in goat's milk. Small Ruminant Research 123:155−59

    doi: 10.1016/j.smallrumres.2014.10.012

    CrossRef   Google Scholar

    [25]

    Elvan M, Baysal AH, Harsa S. 2022. Microencapsulation of a potential probiotic Lactiplantibacillus pentosus and its impregnation onto table olives. LWT 156:112975

    doi: 10.1016/j.lwt.2021.112975

    CrossRef   Google Scholar

    [26]

    Favaro-Trindade CS, Santana AS, Monterrey-Quintero ES, Trindade MA, Netto FM. 2010. The use of spray drying technology to reduce bitter taste of casein hydrolysate. Food Hydrocoll 24:336−40

    doi: 10.1016/j.foodhyd.2009.10.012

    CrossRef   Google Scholar

    [27]

    Tonon R, Brabet C, Hubinger MD. 2010. Anthocyanin stability and antioxidant activity of spray-dried açai (Euterpe oleracea Mart.) juice produced with different carrier agents. Food Research International 43:907−14

    doi: 10.1016/j.foodres.2009.12.013

    CrossRef   Google Scholar

    [28]

    Paula DdeA, Martins EMF, Costa NdeA, de Oliveira PM, de Oliveira EB. 2019. Use of gelatin and gum arabic for microencapsulation of probiotic cells from Lactobacillus plantarum by a dual process combining double emulsification followed by complex coacervation. International Journal of Biological Macromolecules 133:722−31

    doi: 10.1016/j.ijbiomac.2019.04.110

    CrossRef   Google Scholar

    [29]

    Eckert C, Serpa VG, Felipe dos Santos AC, Marinês da Costa S, Dalpubel V, et al. 2017. Microencapsulation of Lactobacillus plantarum ATCC 8014 through spray drying and using dairy whey as wall materials. LWT - Food Science and Technology 82:176−83

    doi: 10.1016/j.lwt.2017.04.045

    CrossRef   Google Scholar

    [30]

    Carneiro HCF, Tonon R v., Grosso CRF, Hubinger MD. 2013. Encapsulation efficiency and oxidative stability of flaxseed oil microencapsulated by spray drying using different combinations of wall materials. Journal of Food Engineering 115:443−51

    doi: 10.1016/j.jfoodeng.2012.03.033

    CrossRef   Google Scholar

    [31]

    Gul O. 2017. Microencapsulation of Lactobacillus casei Shirota by spray drying using different combinations of wall materials and application for probiotic dairy dessert. Journal of Food Processing and Preservation 41:e13198

    doi: 10.1111/jfpp.13198

    CrossRef   Google Scholar

    [32]

    Silva MP, Tulini FL, Martins E, Penning M, Fávaro-Trindade CS, et al. 2018. Comparison of extrusion and co-extrusion encapsulation techniques to protect Lactobacillus acidophilus LA3 in simulated gastrointestinal fluids. LWT 89:392−99

    doi: 10.1016/j.lwt.2017.11.008

    CrossRef   Google Scholar

    [33]

    Guo Q, Li S, Tang J, Chang S, Qiang L, et al. 2022. Microencapsulation of Lactobacillus plantarum by spray drying: Protective effects during simulated food processing, gastrointestinal conditions, and in kefir. International Journal of Biological Macromolecules 194:539−45

    doi: 10.1016/j.ijbiomac.2021.11.096

    CrossRef   Google Scholar

    [34]

    Ozcan T, Yilmaz-Ersan L, Akpinar-Bayizit A. 2010. Viability of Lactobacillus acidophilus LA-5 and Bifidobacterium bifidum BB-12 in rice pudding. Mljekarstvo 60:135−44

    Google Scholar

    [35]

    Ajlouni S, Hossain MN, Tang Z. 2022. Prebiotic functions of konjac root powder in chocolate milk enriched with free and Encapsulated lactic acid bacteria. Microorganisms 10:2433

    doi: 10.3390/microorganisms10122433

    CrossRef   Google Scholar

  • Cite this article

    Silkin B, Onen B, Elvan M, Harsa HS. 2023. Cocoa pudding fortified with microencapsulated Lactiplantibacillus plantarum DSM 1954. Food Materials Research 3:22 doi: 10.48130/FMR-2023-0022
    Silkin B, Onen B, Elvan M, Harsa HS. 2023. Cocoa pudding fortified with microencapsulated Lactiplantibacillus plantarum DSM 1954. Food Materials Research 3:22 doi: 10.48130/FMR-2023-0022

Figures(4)  /  Tables(1)

Article Metrics

Article views(3036) PDF downloads(444)

ARTICLE   Open Access    

Cocoa pudding fortified with microencapsulated Lactiplantibacillus plantarum DSM 1954

Food Materials Research  3 Article number: 22  (2023)  |  Cite this article

Abstract: Probiotic pudding can be served as a functional food with high probiotic viability during production and storage. The aim of this study was to investigate the microencapsulation of Lactiplantibacillus plantarum DSM 1954 with a gum arabic-whey protein concentrate complex using a water-in-oil emulsion technique and to evaluate the stability of microencapsulated and non-microencapsulated L. plantarum in the cocoa pudding and to determine the main quality parameters and sensory characteristics of pudding during storage at 4 °C for 21 d. The efficacy of microencapsulation on the viability over 21 d was determined and an encapsulation efficiency of 86.66% was achieved. Whole milk, cocoa, corn starch, and gum arabic, as well as microencapsulated and non-microencapsulated L. plantarum were used to produce probiotic-fortified cocoa pudding. L. plantarum was added to pudding for 21 d to test their viability and stability. pH values and sensory analysis of pudding were conducted. Microencapsulated and non-microencapsulated L. plantarum cell counts were approximately 9 log CFU/g in pudding samples at the end of 21 d. With storage time, the pH of pudding containing non-microencapsulated bacteria decreased more than that of pudding containing microencapsulated bacteria. The addition of bacteria to the pudding did not have a significant effect on the taste, odor, and texture. Since both microencapsulated and non-microencapsulated bacteria maintain significant viability in pudding during storage, pudding can be considered a potential carrier of probiotics.

    • Functional foods have taken their place in the global market, due to the relationship between health and diet. Probiotics and prebiotics are the most used additives to produce functional foods[1, 2]. Various studies have shown the positive effects of probiotics against different diseases, such as the alleviation of lactose intolerance[3], developed resistance to infectious diseases[4], and a decrease in serum cholesterol concentration[5].

      Dairy products are thought to be good vehicles for delivering probiotics because they have intrinsic features that encourage probiotic growth and keep them viable[6]. Probiotic dairy products constitute the main group in the functional food sector because of their high consumption levels. Furthermore, innovative functional products are expected to be developed in the market as they offer consumers an alternative choice. Functional dairy desserts can be a suitable option for individuals of different ages to receive probiotics in their daily diet[7]. The viability of probiotics must be preserved during the process and storage conditions of foods. Some studies consider 6−9 log CFU/mL or CFU/g as the minimum starting level for probiotics to survive in adverse conditions and reach the gut in sufficient quantities to exert their beneficial effects[8].

      Microencapsulation is a promising strategy for increasing probiotic viability in a range of foods. Proper coating materials and drying procedures should be chosen to enhance the survivability of bacteria during the process, storage, and exposure to the digestive system[9]. Microencapsulation provides higher protection for the probiotics, and a lower decrease in viability is observed in the simulated gastrointestinal system[10]. The entire delivery system for food applications must be made of food-grade materials. Polysaccharides and proteins are common wall materials for microencapsulation[11]. Whey proteins contain a variety of inherent functional features that enable them to function as effective encapsulants, including the capacity to stabilize emulsions and produce gel matrices. They can be used to encapsulate a variety of food substances, both hydrophilic and hydrophobic, as well as probiotic microbes[12]. The different characteristics of polysaccharides can be used to produce microcapsules and protect the microencapsulated probiotics from harsh environments, including electrostatic interaction, ion-induced gelation, enteric dissolution, and so on. Various traditional polysaccharides such as pectin, alginate, inulin, and chitosan are now widely used as wall materials; however, with the increasing demand for new applications for probiotic microcapsules, these limited types of polysaccharides can only satisfy[13]. Gum arabic as a polysaccharide is widely used in the food and pharmaceutical industries as a stabilizer, thickening agent, and emulsifier[14]. According to the American Food and Drug Administration, gum arabic is one of the safest dietary fibers[15].

      This study involves investigating microencapsulation of L. plantarum DSM 1954 by using the water-in-oil emulsion technique with gum arabic-whey protein concentrate complex and an examination of viability levels of microencapsulated and non-microencapsulated L. plantarum in the cocoa pudding and the main quality parameters and sensorial properties during the storage for 21 d at 4 °C. Additionally, the survival of L. plantarum was evaluated under a simulated gastrointestinal tract.

    • The commercial strain of Lactiplantibacillus plantarum DSM 1954 was obtained from the German Collection of Microorganisms and Cell Cultures GmbH (Germany). Whey protein concentrate (WPC) (contains 80% protein) and gum arabic (E 414, food additive) were provided from Alfasol, Turkey. Sucrose, corn starch, pasteurized whole milk, and cocoa were obtained from a local market.

    • L. plantarum stock culture was inoculated 1% (approximately 11−12 log CFU/mL) into 5 mL MRS (de Man, Rogosa and Sharpe, Merck, Germany) broth and incubated at 37 °C for 24 h under anaerobic conditions. The culture was then subcultured into 100 mL of MRS broth and incubated under the same conditions for 18 h. Then, the cells were harvested by centrifugation[16].

    • Microencapsulation of L. plantarum was performed using a water-in-oil emulsion method[16]. Gum arabic (9% w/v) and WPC (9% w/v) were dissolved separately in distilled water for 3 h[17]. Afterward, WPC was denatured in a water bath at 80 °C for 30 min. Then, the denatured WPC was cooled to room temperature. Gum arabic and WPC solutions were mixed. The primary water-in-oil emulsions were formed by emulsifying an inner aqueous phase made up of gum arabic and WPC complex containing L. plantarum into an oil phase containing 1% soy lecithin (Alfasol, Turkey) as an emulsifier. The primary emulsion was homogenized with an Ultra Turrax homogenizer for 5 min (Ultra Turrax T25, Janke and Kunkel, IKA Labortechnik, Germany). The emulsions were then homogenized again in 0.1 M CaCl2 solution (Applichem, Germany) for 2 min. After that, these slurries were shaken with an orbital shaker (IKA Labortechnik KS125 basic, Germany) to harden the microcapsules. The hardened microcapsules were separated from the solution by centrifugation. The microcapsules were then lyophilized by a freeze-dryer (Lablanco Freezone 18, Kansas, USA) at –55 °C under a 0.050 mBar vacuum for 48 h. The microcapsules obtained were preserved at 4 °C for further analysis.

    • Color measurement of microcapsules was evaluated using the Konica Minolta colorimeter (CR 410, Konica Minolta, Tokyo, Japan).

      The water activity of microcapsules after freeze-drying was measured at the temperature of 25 °C by the Hygrolab C1 water activity counter (Rotronic, Bassersdorf, Switzerland).

      The moisture content of microcapsules was determined after drying at 105 °C for 24 h[18]. The moisture content (%) was calculated by using the equation:

      Moisture content (%) = [(Wwet – Wdry)/(Wwet)] × 100

      Where Wwet is wet sample weight and Wdry is dry sample weight.

      The pH value was determined by using a digital pH meter (Hanna Instruments, HI 2211 pH/ORP Meter, USA). Microencapsulated cells were dissolved in distilled water (1:10) for the pH measurement.

      The bulk density was evaluated by adding 2 g of the microencapsulated cells into a 10 mL measuring cylinder and the cylinder was tapped by holding it on a vortex vibrator for 2 min. The tapped bulk density was calculated by using an equation[19].

      Bulk density (kg/m) = m/v

      Where m is the mass of the microencapsulated cells (kg), and v is the volume loaded in the cylinder (m3).

    • The microencapsulated L. plantarum viability was determined after the microencapsulation process on days 0, 7, 14, and 21. Microencapsulated samples (1 g) were dissolved in 9 mL sterile peptone water and shaken vigorously. The homogenized solution was serially diluted with peptone solution and plated by the pour plate technique using MRS agar. Viable cell counts were determined after 48 h incubation under anaerobic conditions using an anaerobic kit (Thermo Scientific, Oxoid AnaeroGen, UK) at 37 °C, and viable cells were expressed as log CFU/g. The encapsulation efficiency was calculated as follows:

      Microencapsulation efficiency (%) = (N/N0) × 100%

      where N0 is the cell count before microencapsulation (log CFU/g), and N is the cell count after the microencapsulation process (log CFU/g).

    • The morphology of microencapsulated cells was observed using a scanning electron microscope (SEM) (FEI QUANTA 250 FEG). Microencapsulated samples were coated with a conductive gold layer, before the observation. The microencapsulated cells were examined at an accelerating voltage of 5 kV and magnification of 10,000 and 20,000 times.

    • For cocoa pudding, 10% sucrose, 4.2% corn starch, 2% cocoa, and 0.2% gum arabic were added slowly to 83.6% pasteurized milk at 40 °C. The mixture was mixed with a magnetic stirrer. It was heated to 85 °C for 20 min and then stirred at the same temperature for 5 min[20]. When the temperature of the pudding dropped to 45 °C, the cocoa pudding was divided into three batches. Probiotic cultures were added and mixed homogeneously with a sterile mixer.

      There are;

      • CP, control cocoa pudding samples without L. plantarum

      • MP, cocoa pudding samples including microencapsulated L. plantarum

      • FP, cocoa pudding samples including free cell (non-microencapsulated) of L. plantarum

      All cocoa pudding samples were packaged in separate plastic containers, refrigerated, and stored at 4 ± 1 °C for up to 21 d.

    • The viability of L. plantarum in pudding samples (MP and FP) were evaluated during the 0, 7, 14, and 21 d. Ten g of the pudding was mixed with 90 mL of sterile peptone water and vigorously shaken. Samples were serially diluted with peptone water and plated using MRS agar to determine the count of L. plantarum, VRB agar (Violet Red Bile Agar, Merck, Germany) to detect the Escherichia coli contamination, and PDA (Potato Dextrose Agar, Merck, Germany) to observe mold and yeast growth. Following 48 h of anaerobic incubation for MRS agar and VRBA, colonies on plates were counted. PDA was incubated in aerobic conditions for 5 d.

    • The pH of all pudding samples (CP, MP, and FP) was measured on the 0, 7, 14, and 21 d. A pH meter (Hanna Instruments HI 2211, USA) was used for pH measurement. The pH value of the samples was determined by dipping the pH probe in the homogenized pudding sample.

    • The experiment was performed on cocoa pudding samples supplemented with microencapsulated and non-microencapsulated L. plantarum, following the INFOGEST protocol with some modifications[21]. Three digestion fluids were prepared: salivary, gastric, and intestinal. Simulated salivary fluid (SSF) was prepared with 15.1 mM KCl, 13.6 mM NaHCO3, 3.7 mM KH2PO4, 0.15 mM MgCl2(H2O)6, 1.5 mM CaCl2, 0.06 mM (NH4)2CO3. The SSF was adjusted to pH 7.0 at 37 °C. Pudding samples were mixed and incubated at 37 °C for 2 min. Microencapsulated and non-microencapsulated cells within the SSF were also used as control. Simulated gastric fluid (SGF) was prepared with 6.9 mM KCl, 25 mM NaHCO3, 0.9 mM KH2PO4, 47.2 mM NaCl, 0.1 mM MgCl2(H2O)6, 0.15 mM CaCl2, 0.5 mM (NH4)2CO3 and 1,600 U/mL pepsin (Sigma-Aldrich, P7000) and adjusted to pH 3.0. After SSF, an oral bolus was added to the SGF. Samples were mixed with an overhead shaker (Heidolph Reax 2, Schwabach, Germany) and incubated at 37 °C for 120 min. Simulated intestinal fluid (SIF) was prepared with 6.8 mM KCl, 85 mM NaHCO3, 0.8 mM KH2PO4, 38.4 mM NaCl, 0.6 mM CaCl2, 0.33 mM MgCl2(H2O)6, 0.02 mM bile salts (Sigma-Aldrich, B8631) and 160 U/mL pancreatin (Sigma-Aldrich, P1750). The gastric chime was mixed with SIF and adjusted pH to 7.0. Samples were mixed with an overhead shaker and incubated at 37 °C for 120 min.

    • Sensory analysis was performed after the production of the cocoa pudding and the panel consisted of 25 untrained individuals. An acceptance test of qualifications (appearance, smell, texture, taste, consistency in mouth, and overall acceptance) using a 5-point hedonic scale (1 = very bad and 5 = excellent) was carried out[22]. Panelists evaluated three different cocoa pudding samples at one time. Each of the pudding samples was encoded with a 3-digit arbitrary number and presented properly to the panelists.

    • All experiments were performed in parallel. Data analysis was carried out using Minitab 19.0 software (Minitab Inc., State College, PA, USA). The results were expressed as mean ± standard deviations. Variance analysis and Tukey’s tests were used to demonstrate the differences between the pudding samples.

    • L. plantarum was microencapsulated with gum arabic and WPC complex by using the water-in-oil emulsion method. Before microencapsulation, the initial cell load was 12 log CFU/mL. During the 21-d storage, 86.66% microencapsulation efficiency and 10.33 log CFU/g of cell viability were observed (Fig. 1). According to the results obtained, it was observed that the viability of the microencapsulated L. plantarum increased on the 7th d during storage and the difference in viability change from the first day to the last day was observed as 0.27 log CFU/g.
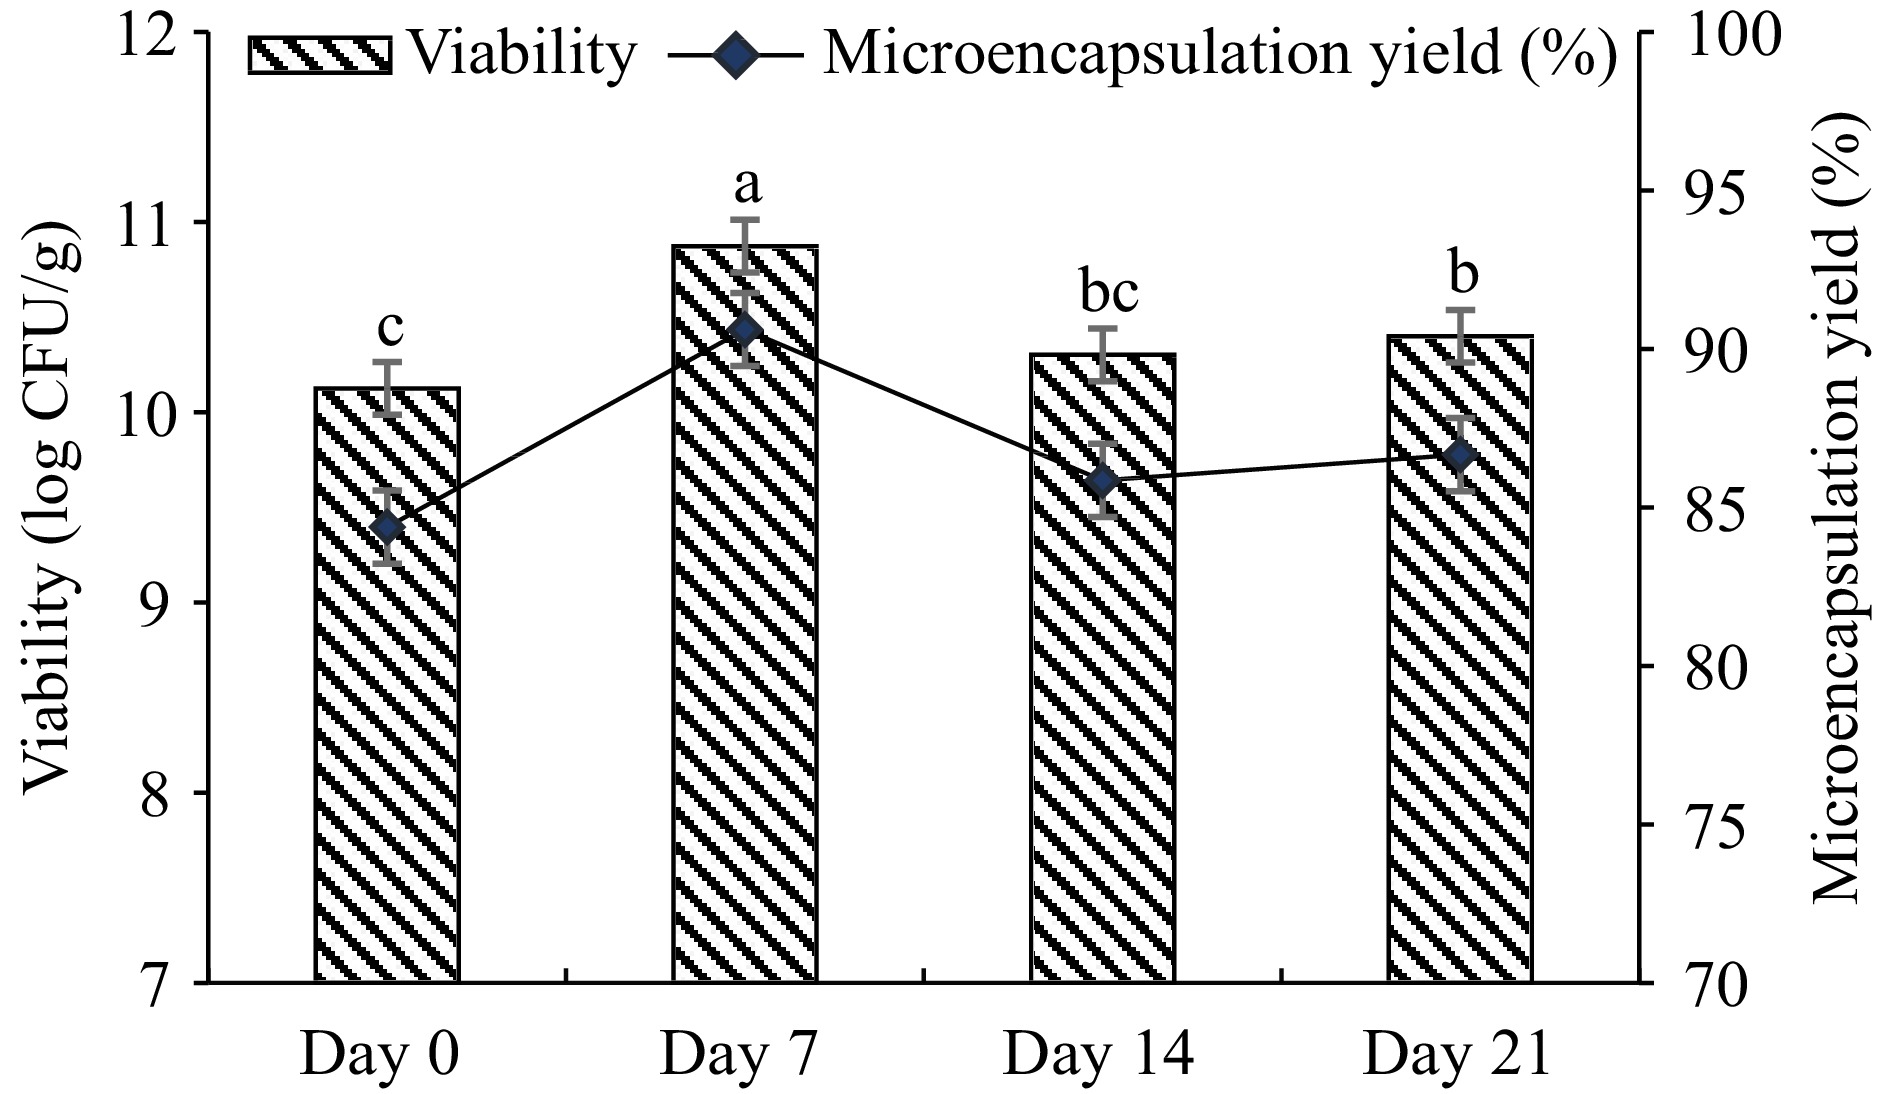
      Figure 1. 

      Viability of microencapsulated L. plantarum (log CFU/g) and microencapsulation efficiency (%). Microcapsules were produced by a water-oil-emulsion technique using gum arabic-WPC complex, stored at 4 °C for 21 d. Results are shown as the means and standard deviations. Data are the average of duplicate samples, obtained in two independent assays.

      %, indicating that still there are free cells present in the medium, e.g. 14%. It can be thought that low amount of free bacteria may utilize the sugar in the pudding and grow and increase in cell number slightly during storage.

    • The physicochemical properties of microencapsulated cells were evaluated. To determine the color of microencapsulated cells, the CIELab parameters; L* (brightness), a* (redness), and b* (yellowness) have been analyzed, and the values were found as 71.41 ± 0.21, 0.936 ± 0.08, and 32.84 ± 0.15, respectively. The pH value of diluted (1:10) samples was found as 5.09 ± 0.008. The water activity of the microencapsulated cells after the microencapsulation process was 0.069 at 26.25 °C. The moisture content of microencapsulated cells was 0.048%. The bulk density of microencapsulated cells was found to be 400 kg/m.

    • The morphology of microencapsulated cells was observed using an SEM. Figure 2 shows the surface views of the microcapsules. All microcapsules were shown to be spherical and regular in shape. Figure 2a shows the distribution of the microcapsules in the pudding, while Fig. 2b shows the spherical structure of the microcapsules and the homogeneity in their size. This observation suggests that the gum arabic – WPC complex has been successfully deposited onto the external surfaces of the L. plantarum cells. The diameter of the microencapsulated cells was recorded by SEM and the data showed that the microcapsules prepared with gum arabic-WPC complex were 1.044 ± 0.211 µm.
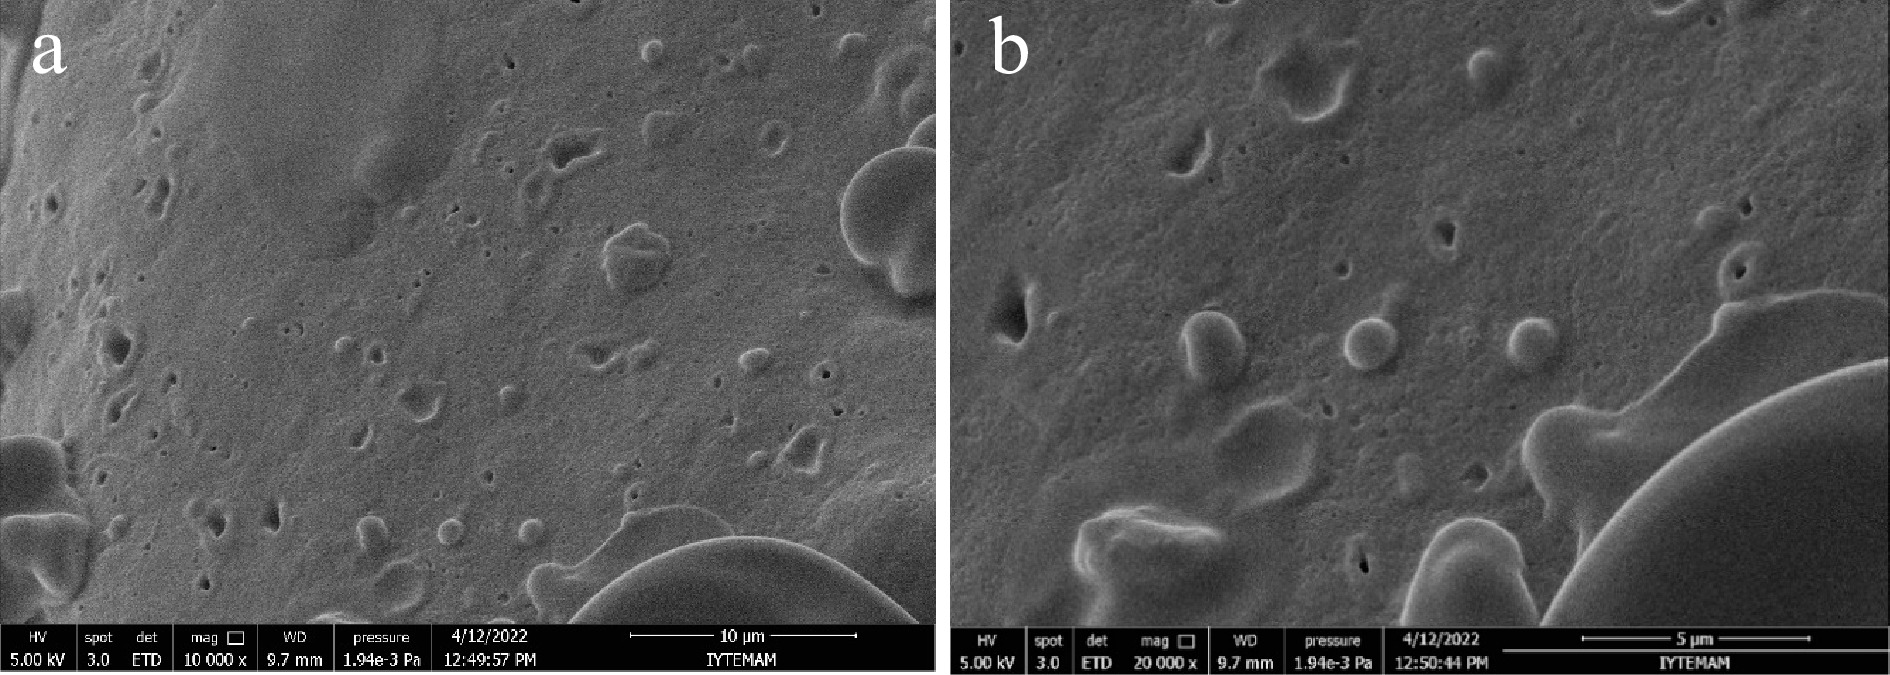
      Figure 2. 

      Scanning electron micrographs of microencapsulated L. plantarum with gum arabic-WPC complex. (a) 10000× magnification, scale bar = 10 μm, (b) 20000× magnification, scale bar = 5 μm.

    • The L. plantarum was microencapsulated with gum arabic - WPC complex and included in the pudding. Microencapsulated and non-microencapsulated L. plantarum viability in pudding samples was evaluated during 21-d storage. Microencapsulated cell numbers increased on day 7 of storage at 4 °C; non-microencapsulated cells showed slow log reduction. The results obtained showed that the number of non-microencapsulated cells did not differ significantly during storage, but the viability of microencapsulated cells increased.

      pH changes were determined to show the storage stability of pudding samples for 21 d. The pH values of all pudding samples are given in Fig. 3. At the beginning of storage, the pH values of all pudding samples were between 6.91 and 7.12, while at the end of the storage pH value of CP and MP decreased to 5.83 and 5.3, respectively. The pH value of the FP sample dropped significantly to 4.59 during storage.
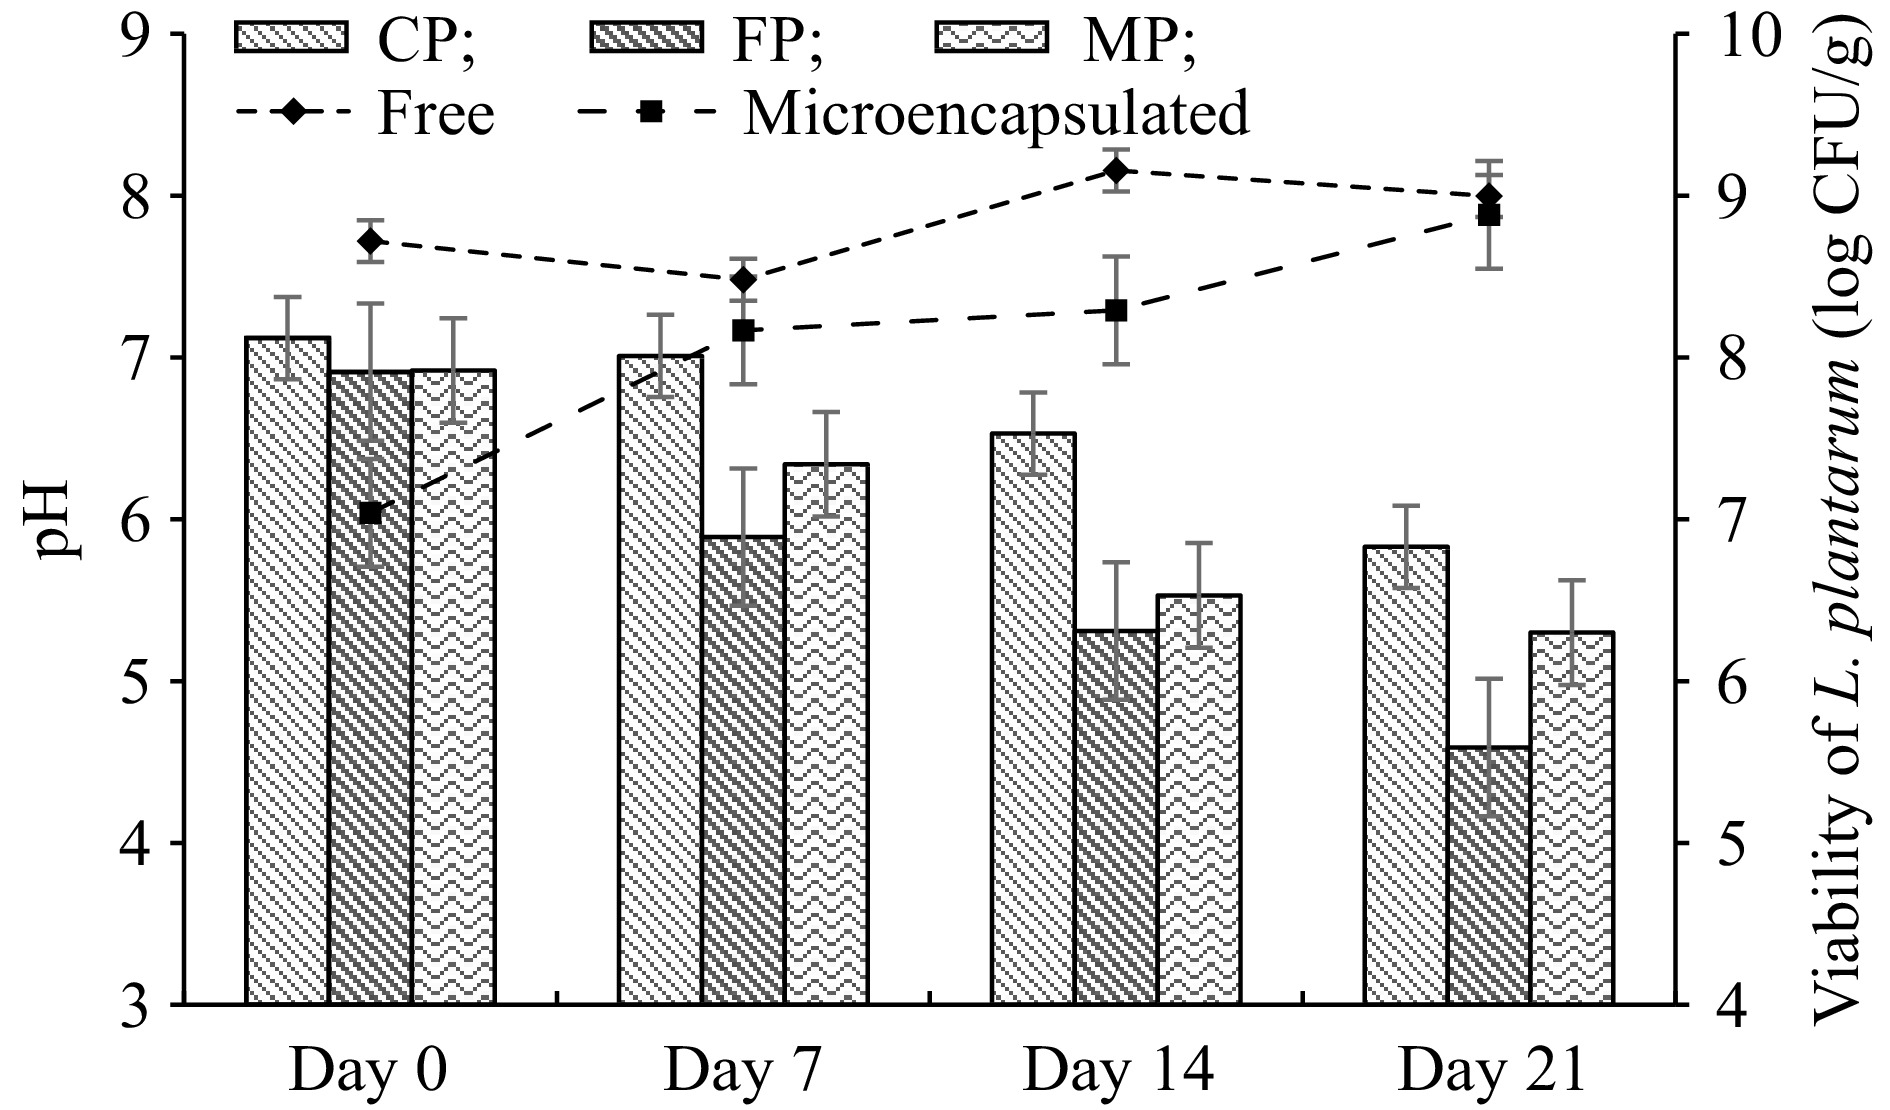
      Figure 3. 

      Changes in pH and viable cell counts of free and microencapsulated L. plantarum in cocoa pudding during the storage at 4 °C. Results are shown as the means and standard deviations. Data are the average of duplicate samples, obtained in two independent assays. MP: Cocoa pudding samples including microencapsulated L. plantarum. FP: Cocoa pudding samples including free cells (non-microencapsulated) of L. plantarum. CP: Control cocoa pudding samples without L. plantarum.

      Total coliform bacteria, yeast, and mold were evaluated during the storage time of cocoa puddings to prove microbiological safety. Based on the findings, no total coliform bacteria, yeasts, and molds were detected in all pudding samples.

    • Microencapsulation processes are used to protect probiotics from harsh environmental conditions such as low pH, bile salts, and enzymes in the gastrointestinal tract. This study determined the influence of gastrointestinal conditions on the survivability of free (non-microencapsulated) and microencapsulated L. plantarum. Additionally, L. plantarum contained pudding samples that were evaluated to show the survival of bacterial cells (Fig. 4). After exposure to SGF for 2 h, there was a 2.34 and 1.52 log CFU/mL decrease in viability of the microencapsulated and free cells, respectively. However, a low viability reduction was observed in MP and FP samples, 0.05 and 0.14 log CFU/mL, respectively. Then digested SGF was passed to SIF for 2 h, in which there was a 1.0 and 1.34 log CFU/mL decrease in the viability of microencapsulated and free cells. A 2.0 and 1.18 log CFU/mL viability reduction was observed in MP and FP samples.
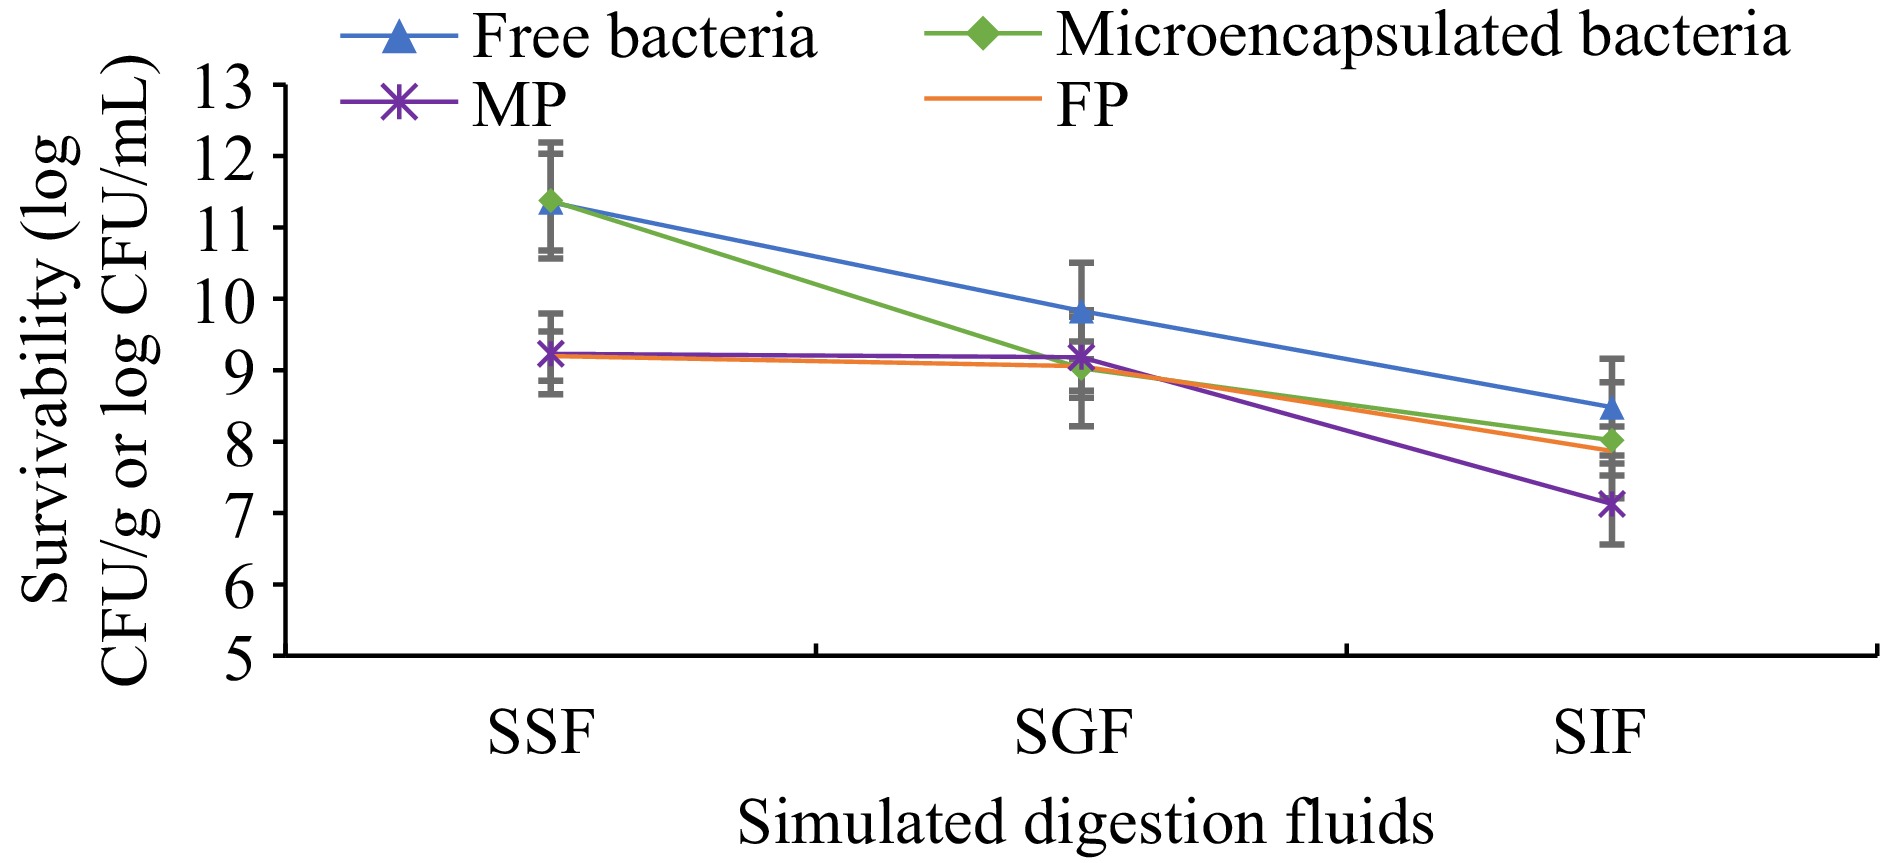
      Figure 4. 

      Survivability of free and microencapsulated L. plantarum. Results are shown as the means and standard deviations. Data are the average of duplicate samples, obtained in two independent assays. SSF: Simulated saliva fluids. SGF: Simulated gastric fluids. SIF: Simulated intestinal fluids. MP: Cocoa pudding samples including microencapsulated L. plantarum. FP: Cocoa pudding samples including free cells (non-microencapsulated) of L. plantarum.

      During the simulated digestion test, a 3-log reduction was observed in both free and microencapsulated L. plantarum cells. In pudding samples (MP and FP) only 2-log reduction was observed, this can be expected due to the pudding materials may show a protective barrier for microorganisms. After the 3-week storage period, the survivability of L. plantarum was between 77% and 85% in pudding samples, while the survivability of L. plantarum (not incorporated in the pudding) was found between 70% and 74%.

    • L. plantarum incorporated pudding samples and controls were evaluated shortly after the production, by 20 untrained panelists about the appearance, texture, taste, smell, consistency in mouth, and general acceptance. The sensory analysis results are reported in Table 1. The sensorial properties of pudding samples received scores between 3.84 and 4.40 on the 5-point hedonic scale. The interaction between cocoa pudding and microencapsulated and free L. plantarum did not demonstrate any significant effect (p > 0.05). This result demonstrated that a concentration of L. plantarum of approximately 7–8 log CFU/g did not influence the pudding characteristics.

      Table 1.  Sensory evaluation of pudding samples.

      Pudding samplesAppearanceTextureTasteSmellConsistency in mouthGeneral acceptance
      CP4.400 ± 0.957A4.080 ± 0.862A4.160 ± 0.850A4.120 ± 0.781A4.040 ± 1.060A4.200 ± 0.866A
      FP4.280 ± 0.542A4.200 ± 0.866A4.200 ± 0.707A4.040 ± 0.676A4.160 ± 0.898A4.160 ± 0.624A
      MP4.120 ± 0.781A4.320 ± 0.945A4.280 ± 0.843A3.840 ± 0.800A4.240 ± 0.970A4.160 ± 0.800A
      Results are shown as means ± standard deviation. Different capital letters on the same column show a significant difference by Tukey's test (p < 0.05), n = 25. CP: Control cocoa pudding samples without L. plantarum. MP: Cocoa pudding samples including microencapsulated L. plantarum. FP: Cocoa pudding samples including free cells (non-microencapsulated) of L. plantarum.
    • L. plantarum was used in this study to produce functional pudding because of its probiotic properties. A recent article highlighted the probiotic properties of L. plantarum, such as resistance to gastrointestinal conditions, adherence to the bowel mucosa, the capacity to promote intestinal integrity, inhibit the growth of pathogens by altering the intestinal flora, modulate immune function, and the ability to treat or cure diseases[23].

      The increase in viability of microencapsulated L. plantarum at the refrigerator temperature during storage was observed (Fig. 1), which can be explained by the absence of toxic waste accumulation due to decreased cell metabolism[24]. The subsequent decrease in viability can be attributed to the oxidation of lipids and protein denaturation during storage. During storage, the protective mechanism of WPC and gum arabic may form a semi-permeable wall around living cells, reducing the water content from the intermediate medium. In a previous study, microencapsulation with xylan-WPC complex of L. plantarum DSM 1954 showed no significant change in the viability, which was kept at 4 °C for 4 weeks[25]. A previous study showed that the viability of Streptococcus thermophilus CCM4757 decreased from 10.26 log CFU/g to 9.94 log during 6 months of storage when gum arabic and WPC complex was used as a coating material in the microencapsulation process[17].

      Recommended water activity is below 0.6 to stabilize microbial growth[26]. In this study, obtained water activity value is lower than recommended to stabilize microencapsulated cells. In addition, a lower water activity value provides longer shelf life because less water is available to catalyze biochemical reactions[27]. Likewise, the lower water activity; low moisture content limited microbial growth and spoilage. In a study, water activity and moisture content of encapsulated L. plantarum were found as 0.34 and 4.5%, respectively[28]. Also, spray-dried L. plantarum microcapsules’ water activity was 0.196, and the moisture level was 3.73%[29]. Bulk density is important to process, packaging, and store the powders. In addition, morphology, particle size distribution, and moisture content can affect the bulk density of powders[19]. The bulk density of spray-dried L. plantarum (MTCC 5422) with fructooligosaccharide as coating material microcapsules ranged from 405.11 to 564.72 kg/m³[19]. The high bulk density of powders is more advantageous because large amounts of powders can be stored in smaller containers than powders with lower bulk densities. Higher bulk density can suggest a lower amount of stored air among particles[30]. Coating materials with high bulk density can exhibit a more protective impact on probiotic cells during storage because of a lower air volume[31].

      There is no ideal particle size, the size depends on the specific application intended and can range from a few micrometers to several millimeters in foods[32]. The particle size of microcapsules of L. plantarum ATCC 8014 obtained by spray-drying with whey was found as 7.0 ± 1.0 μm[29]. The larger particle sizes of encapsulated L. plantarum were obtained around 66.07 ± 3.24 μm and 105.66 ± 3.24 μm[28]. The color parameters of microencapsulated cells showed consistency with a previous study, which carried out a spray-drying process with whey retentate to obtain L. plantarum microcapsules[29].

      During the storage period of pudding samples, fluctuations in the viability of microencapsulated L. plantarum were observed (Fig. 3). The encapsulation efficiency of L. plantarum was 86.66%, indicating that still there are free cells present in the medium, e.g., 14%. It can be thought that a low amount of free bacteria may utilize the sugar in the pudding and grow and increase in cell number slightly while the pH value of samples is reduced during storage. This may be desirable up to some extent since the slight decrease in pH can prevent the product from spoilage microorganisms without influencing the sensory attributes of the product.

      Likewise, the cell viability fluctuations were also seen in a study, in which kefir was produced using free and encapsulated L. plantarum[33]. According to a novel study, the viable cell number of L. plantarum in dairy dessert remained constant for 15 d of storage at 4 °C[7]. According to studies probiotic cell viability must be maintained during the processing and storage of food products, and foods containing probiotic bacteria must have at least 106 CFU/g or CFU/mL at the time of consumption to exhibit beneficial effects[31]. As can be seen in Fig. 3, viable L. plantarum count in FP and MP has been higher than the recommended daily intake. Besides, L. acidophilus viability was detected as higher than 6.5 log CFU/g in rice pudding samples during the shelf life[34].

      The pH value of all pudding samples decreased during storage, but a higher decrease in the pH of FP was found (Fig. 3), the reason is that bacteria in free form break down carbohydrates and produce acid. According to the findings, microencapsulation technology provides the most desirable combination of quality and shelf-life of products. Furthermore, L. plantarum fortified dairy desserts showed a low pH value (5.29) at the end of the 15th-d of shelf life[7]. In a novel study, Konjac root powder added chocolate milk was enriched with 2% of free or microencapsulated lactic acid bacteria. The findings indicated a gradual decrease in all samples' pH values during refrigerated storage[35].

      Probiotics have the ability to maintain viability throughout the gastrointestinal tract. Although there were decreases in viability due to the high acidity of gastric fluid, more than 8 log viability was observed in both microencapsulated and non-microencapsulated L. plantarum at the end of the simulated digestion (Fig. 4). In a novel study, microencapsulated L. plantarum 21,805 showed only a 0.51 log CFU/mL decrease in viability after exposure to SGF[33]. In a study, the encapsulation process combined with double emulsification and complex coacervation was carried out using gum arabic and gelation. After in vitro simulated gastrointestinal conditions, encapsulated L. plantarum viability was found as 80.4%[28].

    • This study demonstrated that L. plantarum was effectively microencapsulated with gum arabic-WPC complex. Microencapsulated L. plantarum, after storage at 4 °C for 21 d, showed higher cell counts than the minimum number of probiotics required for functional food products. Physicochemical properties, survival after exposure to the simulated gastrointestinal tract, and maintenance of viability in pudding indicated that this microencapsulation technique is suitable for preserving probiotics. The viability of microencapsulated and non-microencapsulated L. plantarum was higher than 7 log CFU/g in the cocoa pudding after 21 d of storage at 4 °C. Dairy desserts such as pudding appear to be effective food matrices for the transportation of probiotics without affecting sensory properties. Future studies should be conducted to evaluate the health-beneficial effects of probiotic pudding.

    • We are grateful to the Izmir Institute of Technology Integrated Research Centers for technical support.

      • The authors declare that they have no conflict of interest.

      • Copyright: © 2023 by the author(s). Published by Maximum Academic Press on behalf of Nanjing Agricultural University. This article is an open access article distributed under Creative Commons Attribution License (CC BY 4.0), visit https://creativecommons.org/licenses/by/4.0/.
    Figure (4)  Table (1) References (35)
  • About this article
    Cite this article
    Silkin B, Onen B, Elvan M, Harsa HS. 2023. Cocoa pudding fortified with microencapsulated Lactiplantibacillus plantarum DSM 1954. Food Materials Research 3:22 doi: 10.48130/FMR-2023-0022
    Silkin B, Onen B, Elvan M, Harsa HS. 2023. Cocoa pudding fortified with microencapsulated Lactiplantibacillus plantarum DSM 1954. Food Materials Research 3:22 doi: 10.48130/FMR-2023-0022

Catalog

  • About this article

/

DownLoad:  Full-Size Img  PowerPoint
Return
Return