-
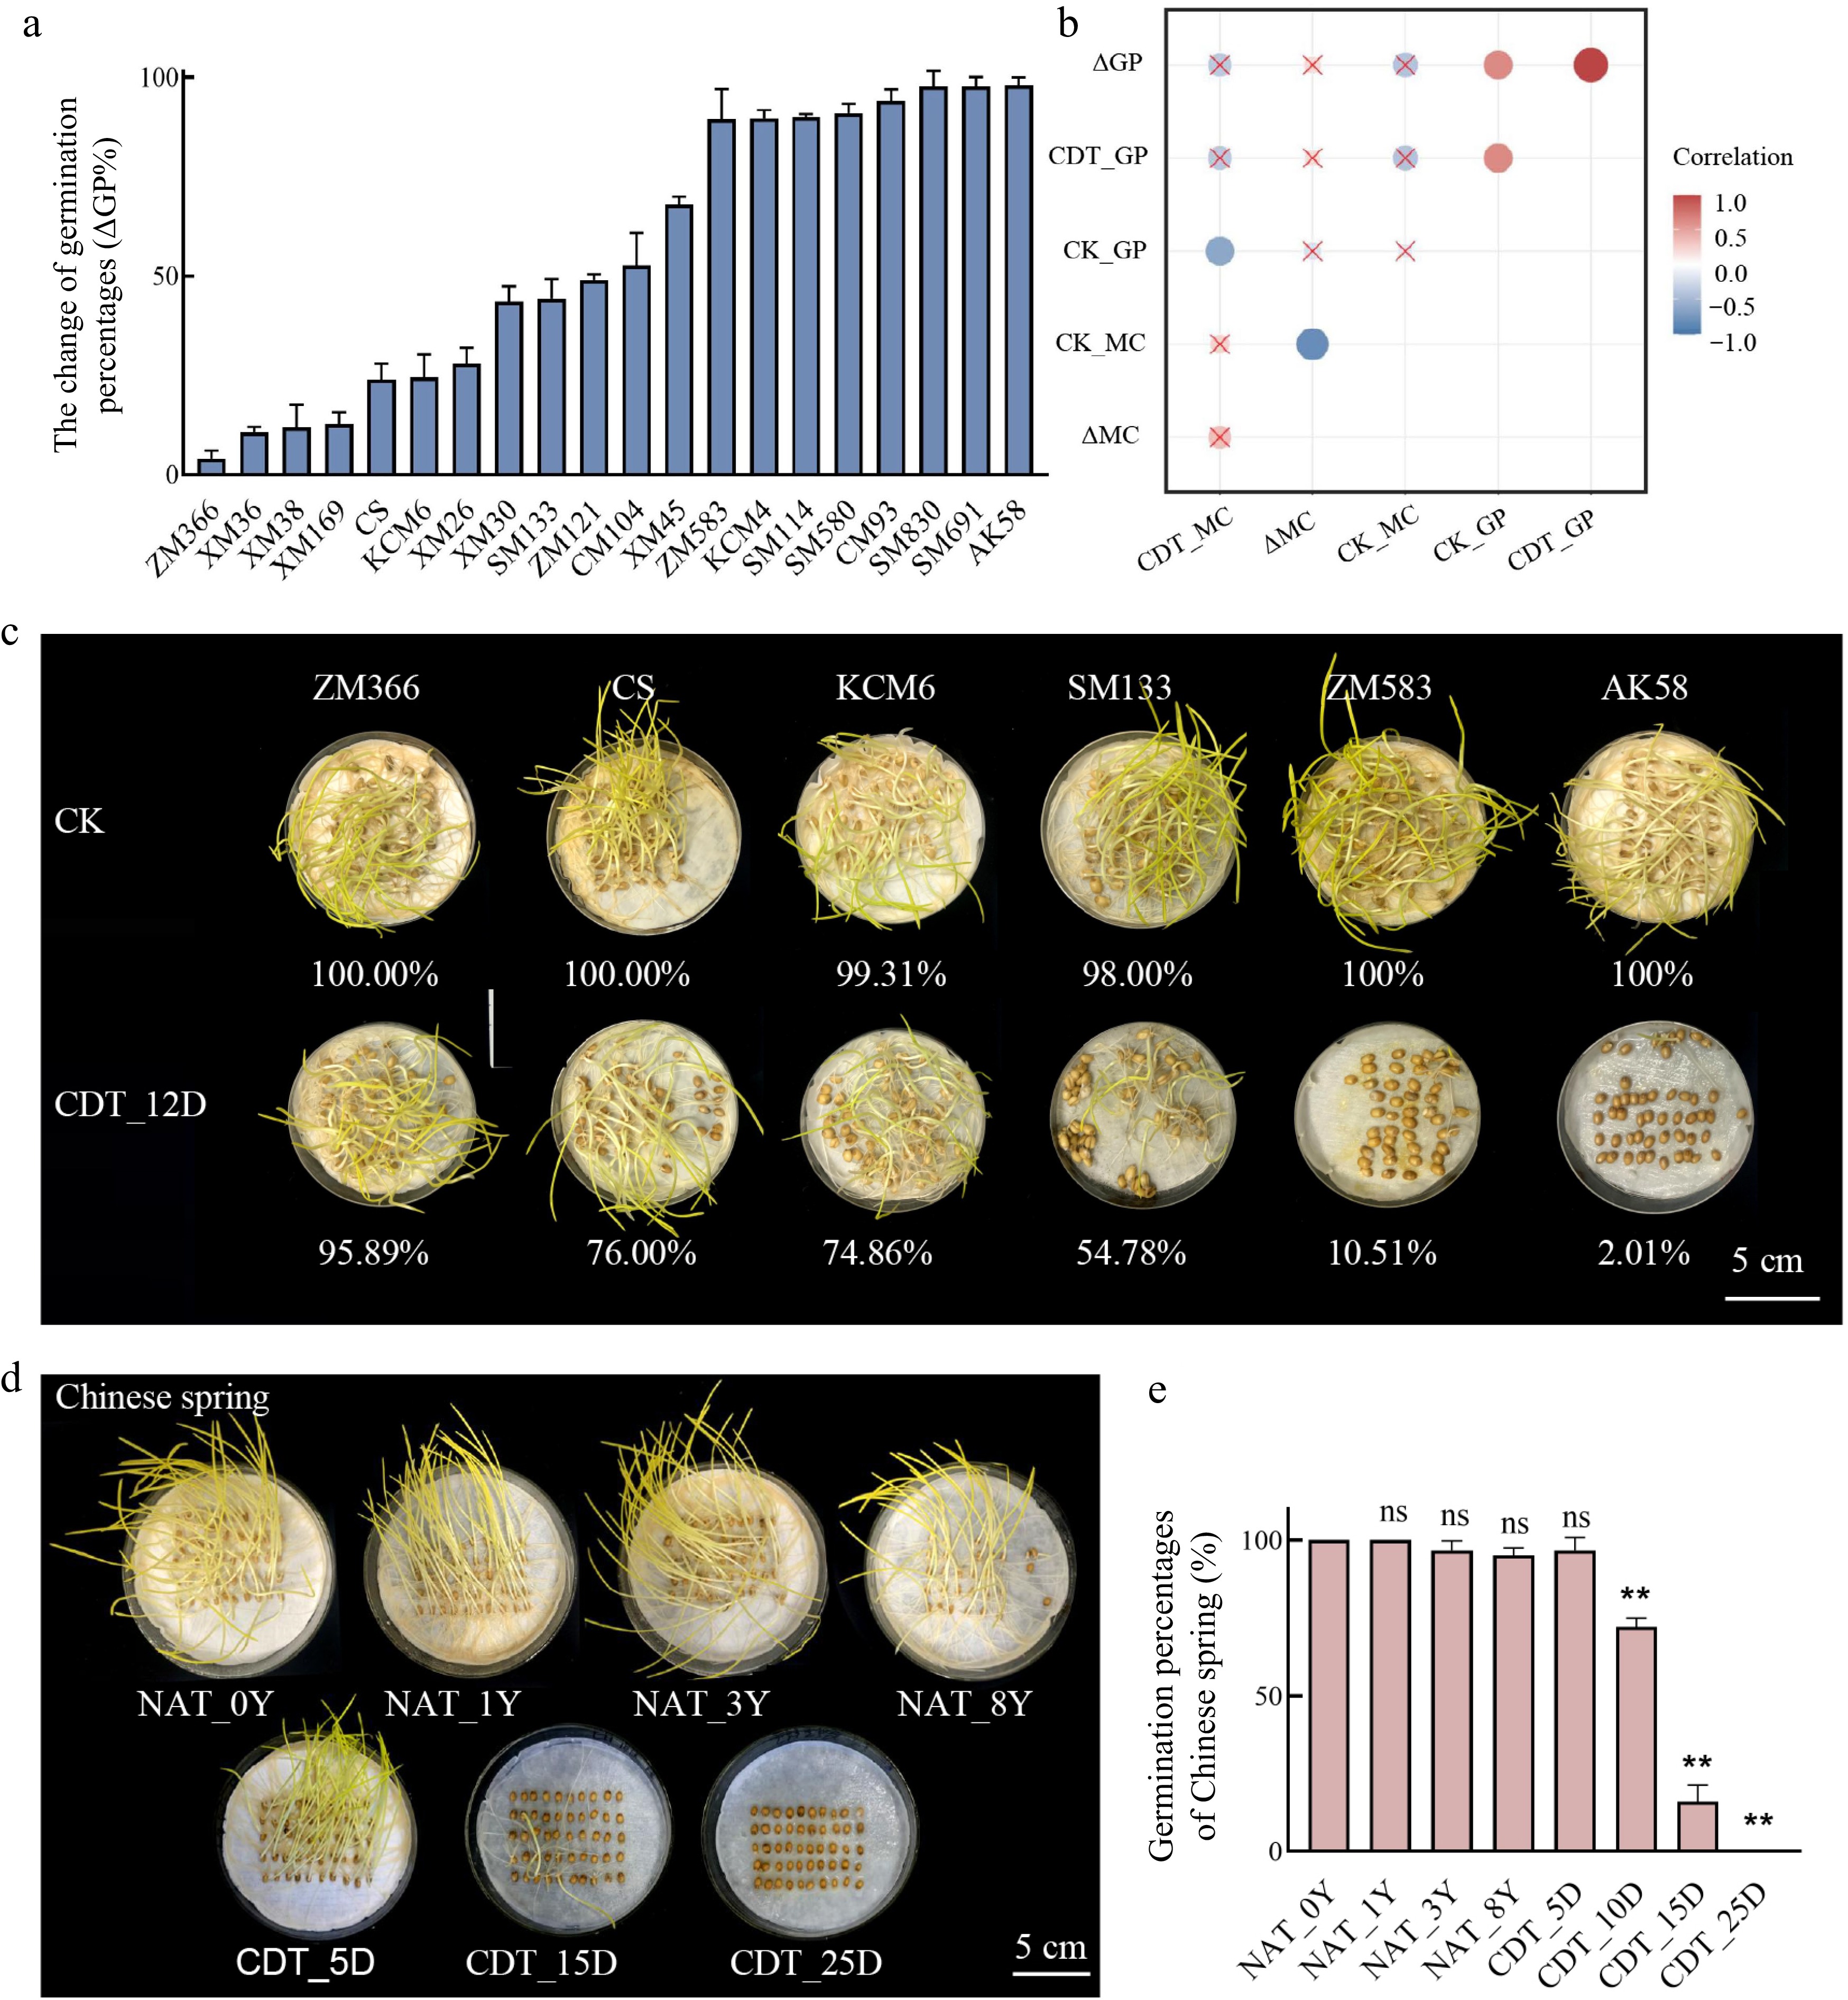
Figure 1.
The germination percentage (GP) of different wheat accessions. (a) The change of germination percentages of 20 wheat varieties after 12 d of controlled deterioration treatment (CDT) (ΔGP%). Data are the means ± standard deviations (SDs) based on three biological replicates. (b) A correlation heatmap between moisture content and GP. CK_GP indicates the GP of non-aged seeds; CDT_GP indicates the GP of seeds that CDT for 12 d; CK_MC indicates the moisture content of seeds before aging; CDT_MC indicates the moisture content of seeds after CDT for 12 d; ΔGP suggests the change of germination during CDT; ΔMC indicates the change in moisture content of seeds during CDT. (c) The GP of six wheat varieties after CDT_12D; bar = 5 cm. (d), (e) The GP of Chinese Spring seeds under NAT and CDT; bar = 5 cm; compared to NAT_0Y seeds; ns, not significant; **, p < 0.01, one-way ANOVA with Tukey's test.
-

Figure 2.
The RNA integrity (RIN) assays of Chinese Spring seeds. (a) RIN of Chinese Spring seeds (embryo and aleurone) under natural aging treatment (NAT) for 1, 3, and 8 years (compared to NAT_0Y) and controlled deterioration treatment (CDT) for 0, 5, 15, and 25 d (compared to CDT_0D). CDT for 0-d seeds was NAT for 3 years seeds. ns, not significant; *, p < 0.05; **, p < 0.01 one-way ANOVA with Tukey's test. (b) Correlation analysis between RIN and germination percentage of Chinese Spring seeds under NAT (0, 1, 3, 8 years) and CDT (0, 5, 15, 25 d) (Pearson's R2).
-
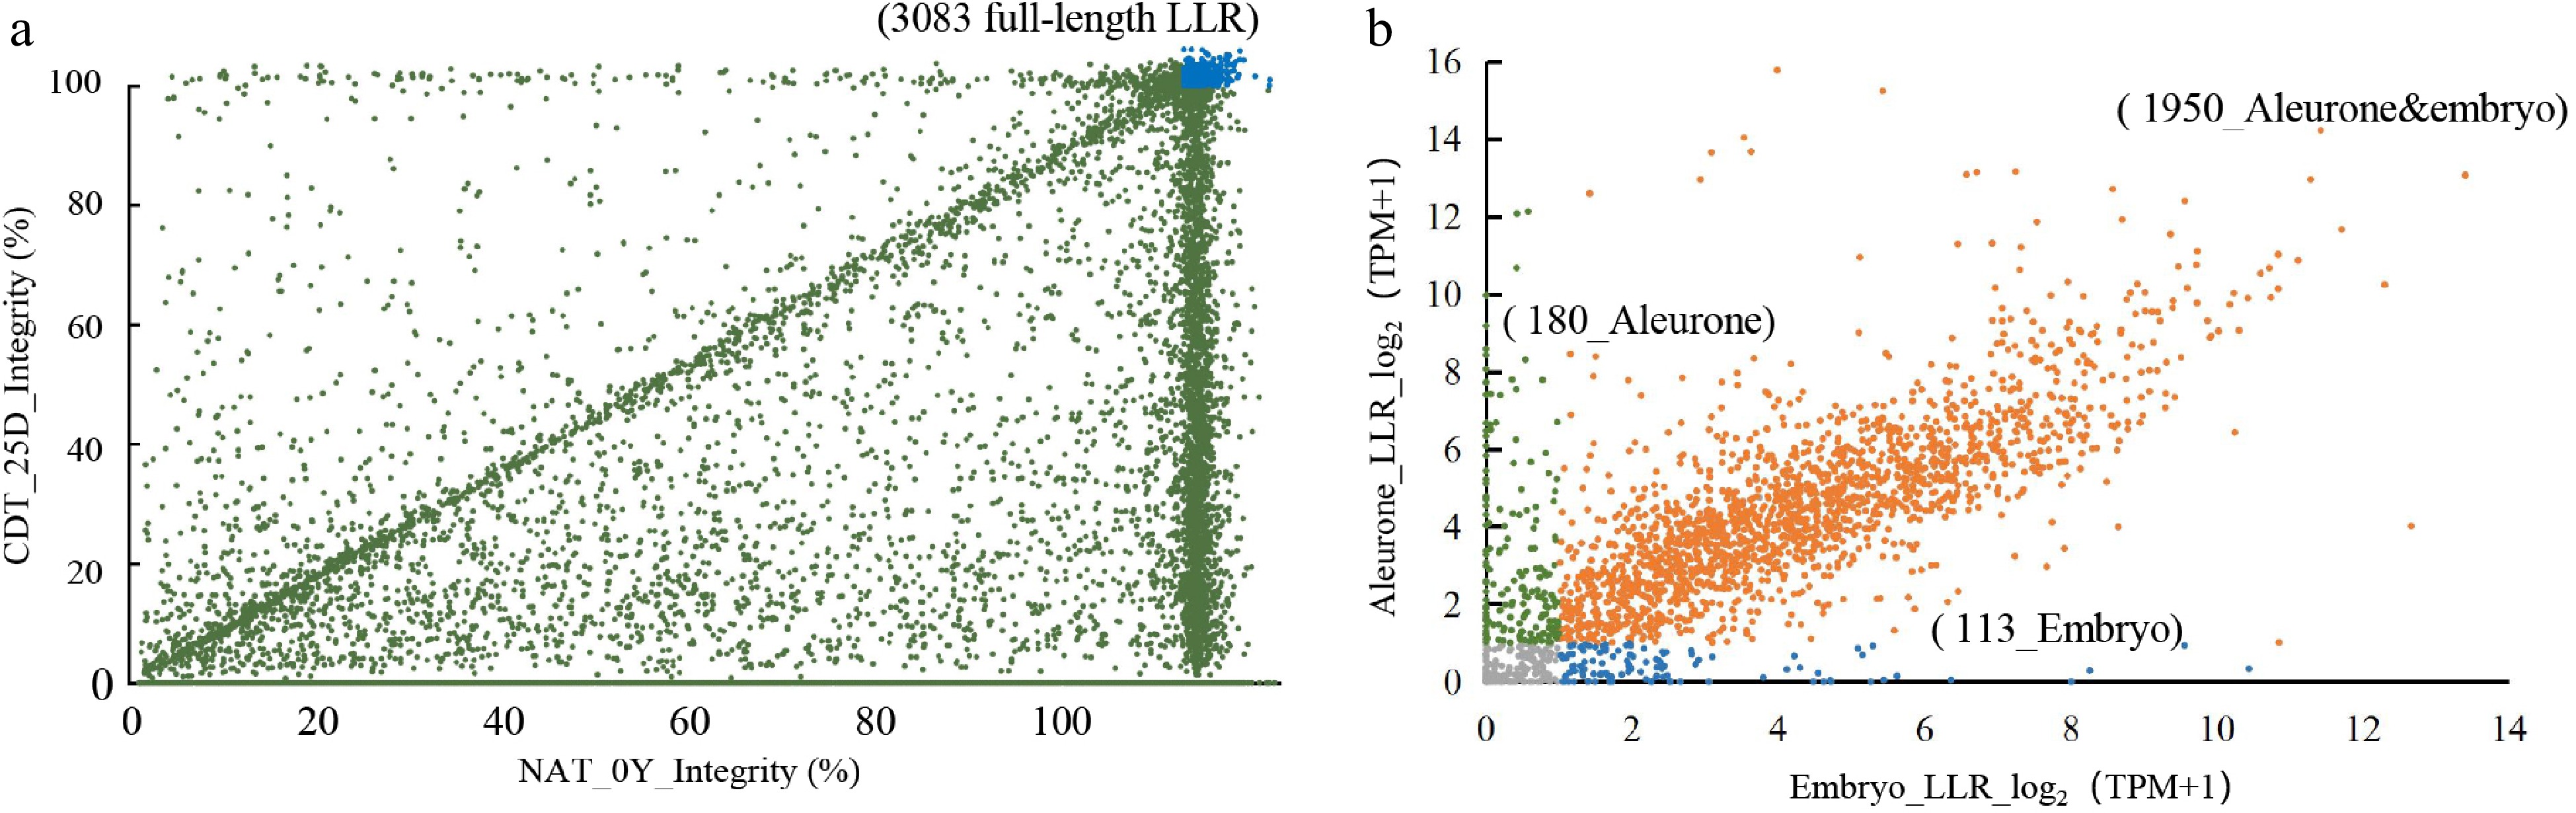
Figure 3.
Identification of full-length long-lived mRNA (LLRs) and validation of transcript levels by Nanopore sequencing and Illumina RNA-seq. (a) Comparative analysis of full-length mRNA in seeds of NAT_0Y and CDT_25D. The blue portion represents 3083 LLRs identified in both samples with at least one full-length transcript. (b) The transcriptomic profile of 3083 full-length LLRs identified by Nanopore sequencing was analyzed. LLRs with a TPM ≥ 1 were considered to have detectable transcript levels. These LLRs were then selected by identifying overlapping genes in all eight aging gradient samples. Aleurone-specific LLRs were annotated with green, embryo-specific LLRs with blue, and LLRs in both tissues were annotated with yellow.
-
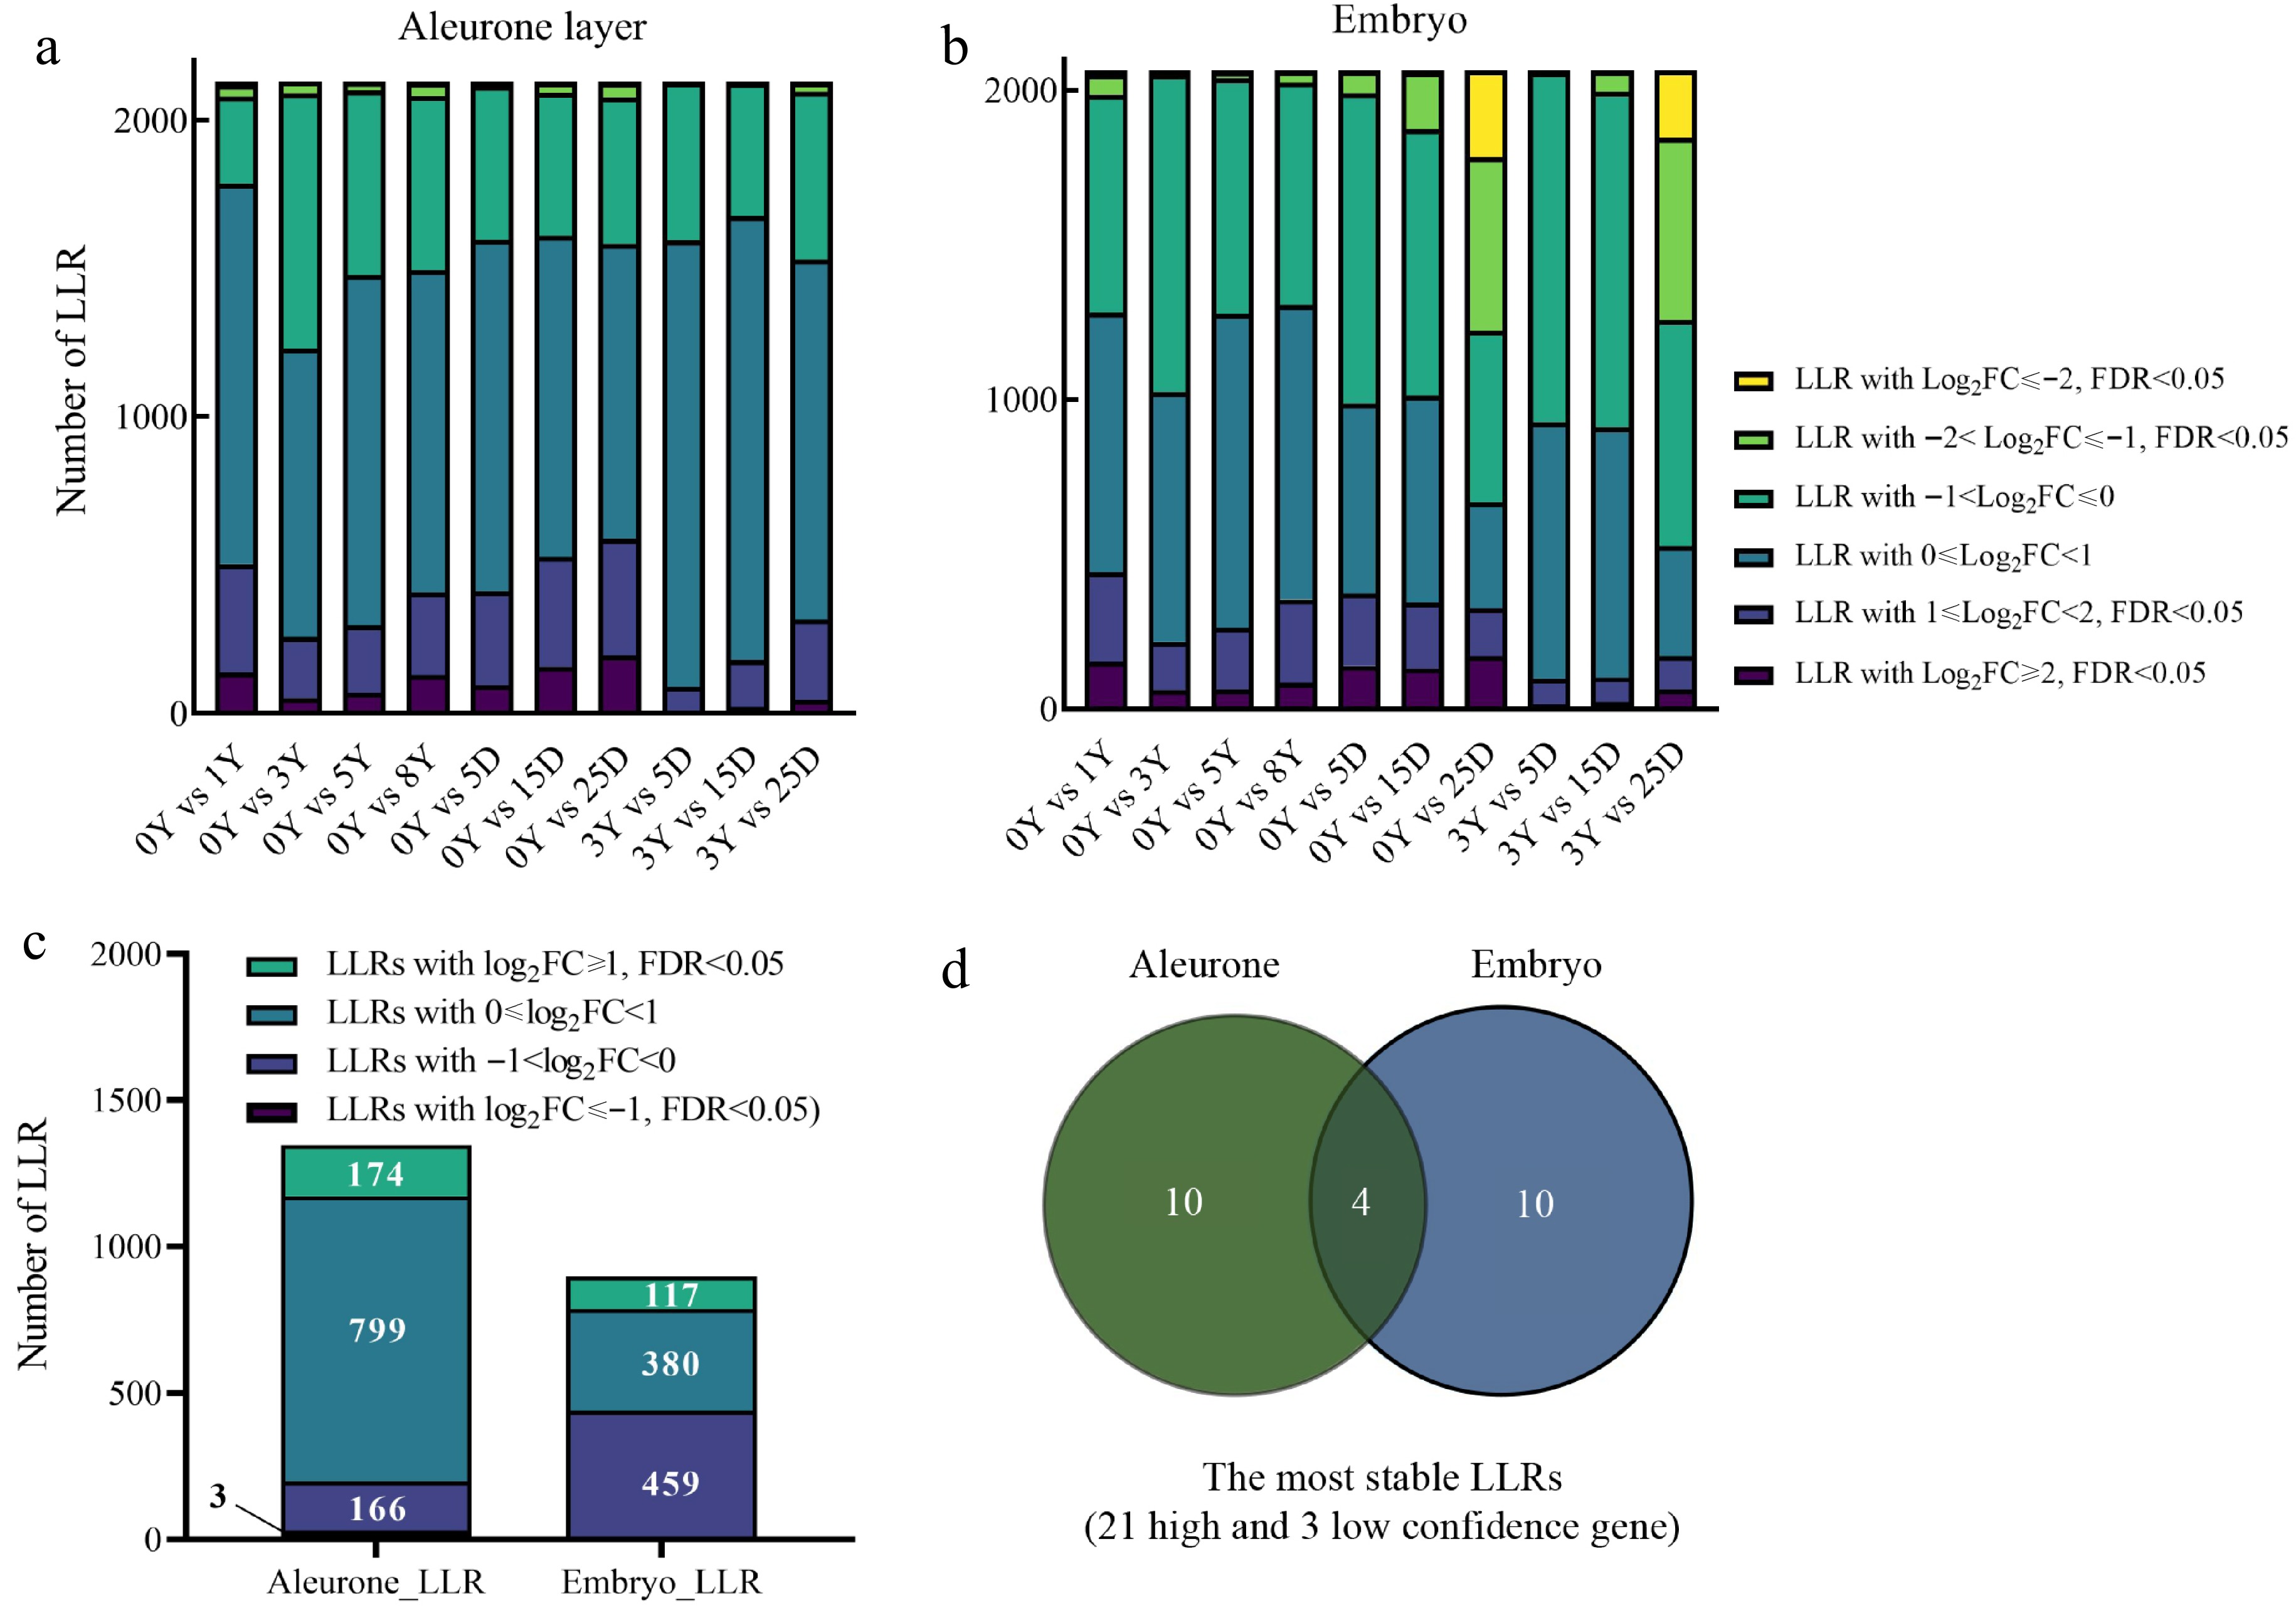
Figure 4.
The degradation pattern of long-lived mRNA (LLRs). (a), (b) LLRs with different fold change (FC) among groups of comparison. (c) This refers to the count of genes that overlap with the same FC across different aging samples from the same tissue. Specifically, the samples include natural aging treatment (NAT) for 0, 1, 3, 5, and 8 years and controlled deterioration treatment (CDT) for 5, 15, and 25 d seeds. (d) Venn diagram comparisons of the most stable LLRs in the embryo and aleurone layer. The most stable LLRs were the overlapping LLRs with log2FC ≥ 1 and FDR < 0.05 between NAT_3Y and CDT (5, 15, and 25 d), which were selected from the overlapping LLRs with log2FC ≥ 1 and FDR < 0.05 (compared to NAT_0Y) as mentioned in Fig. 4c.
-
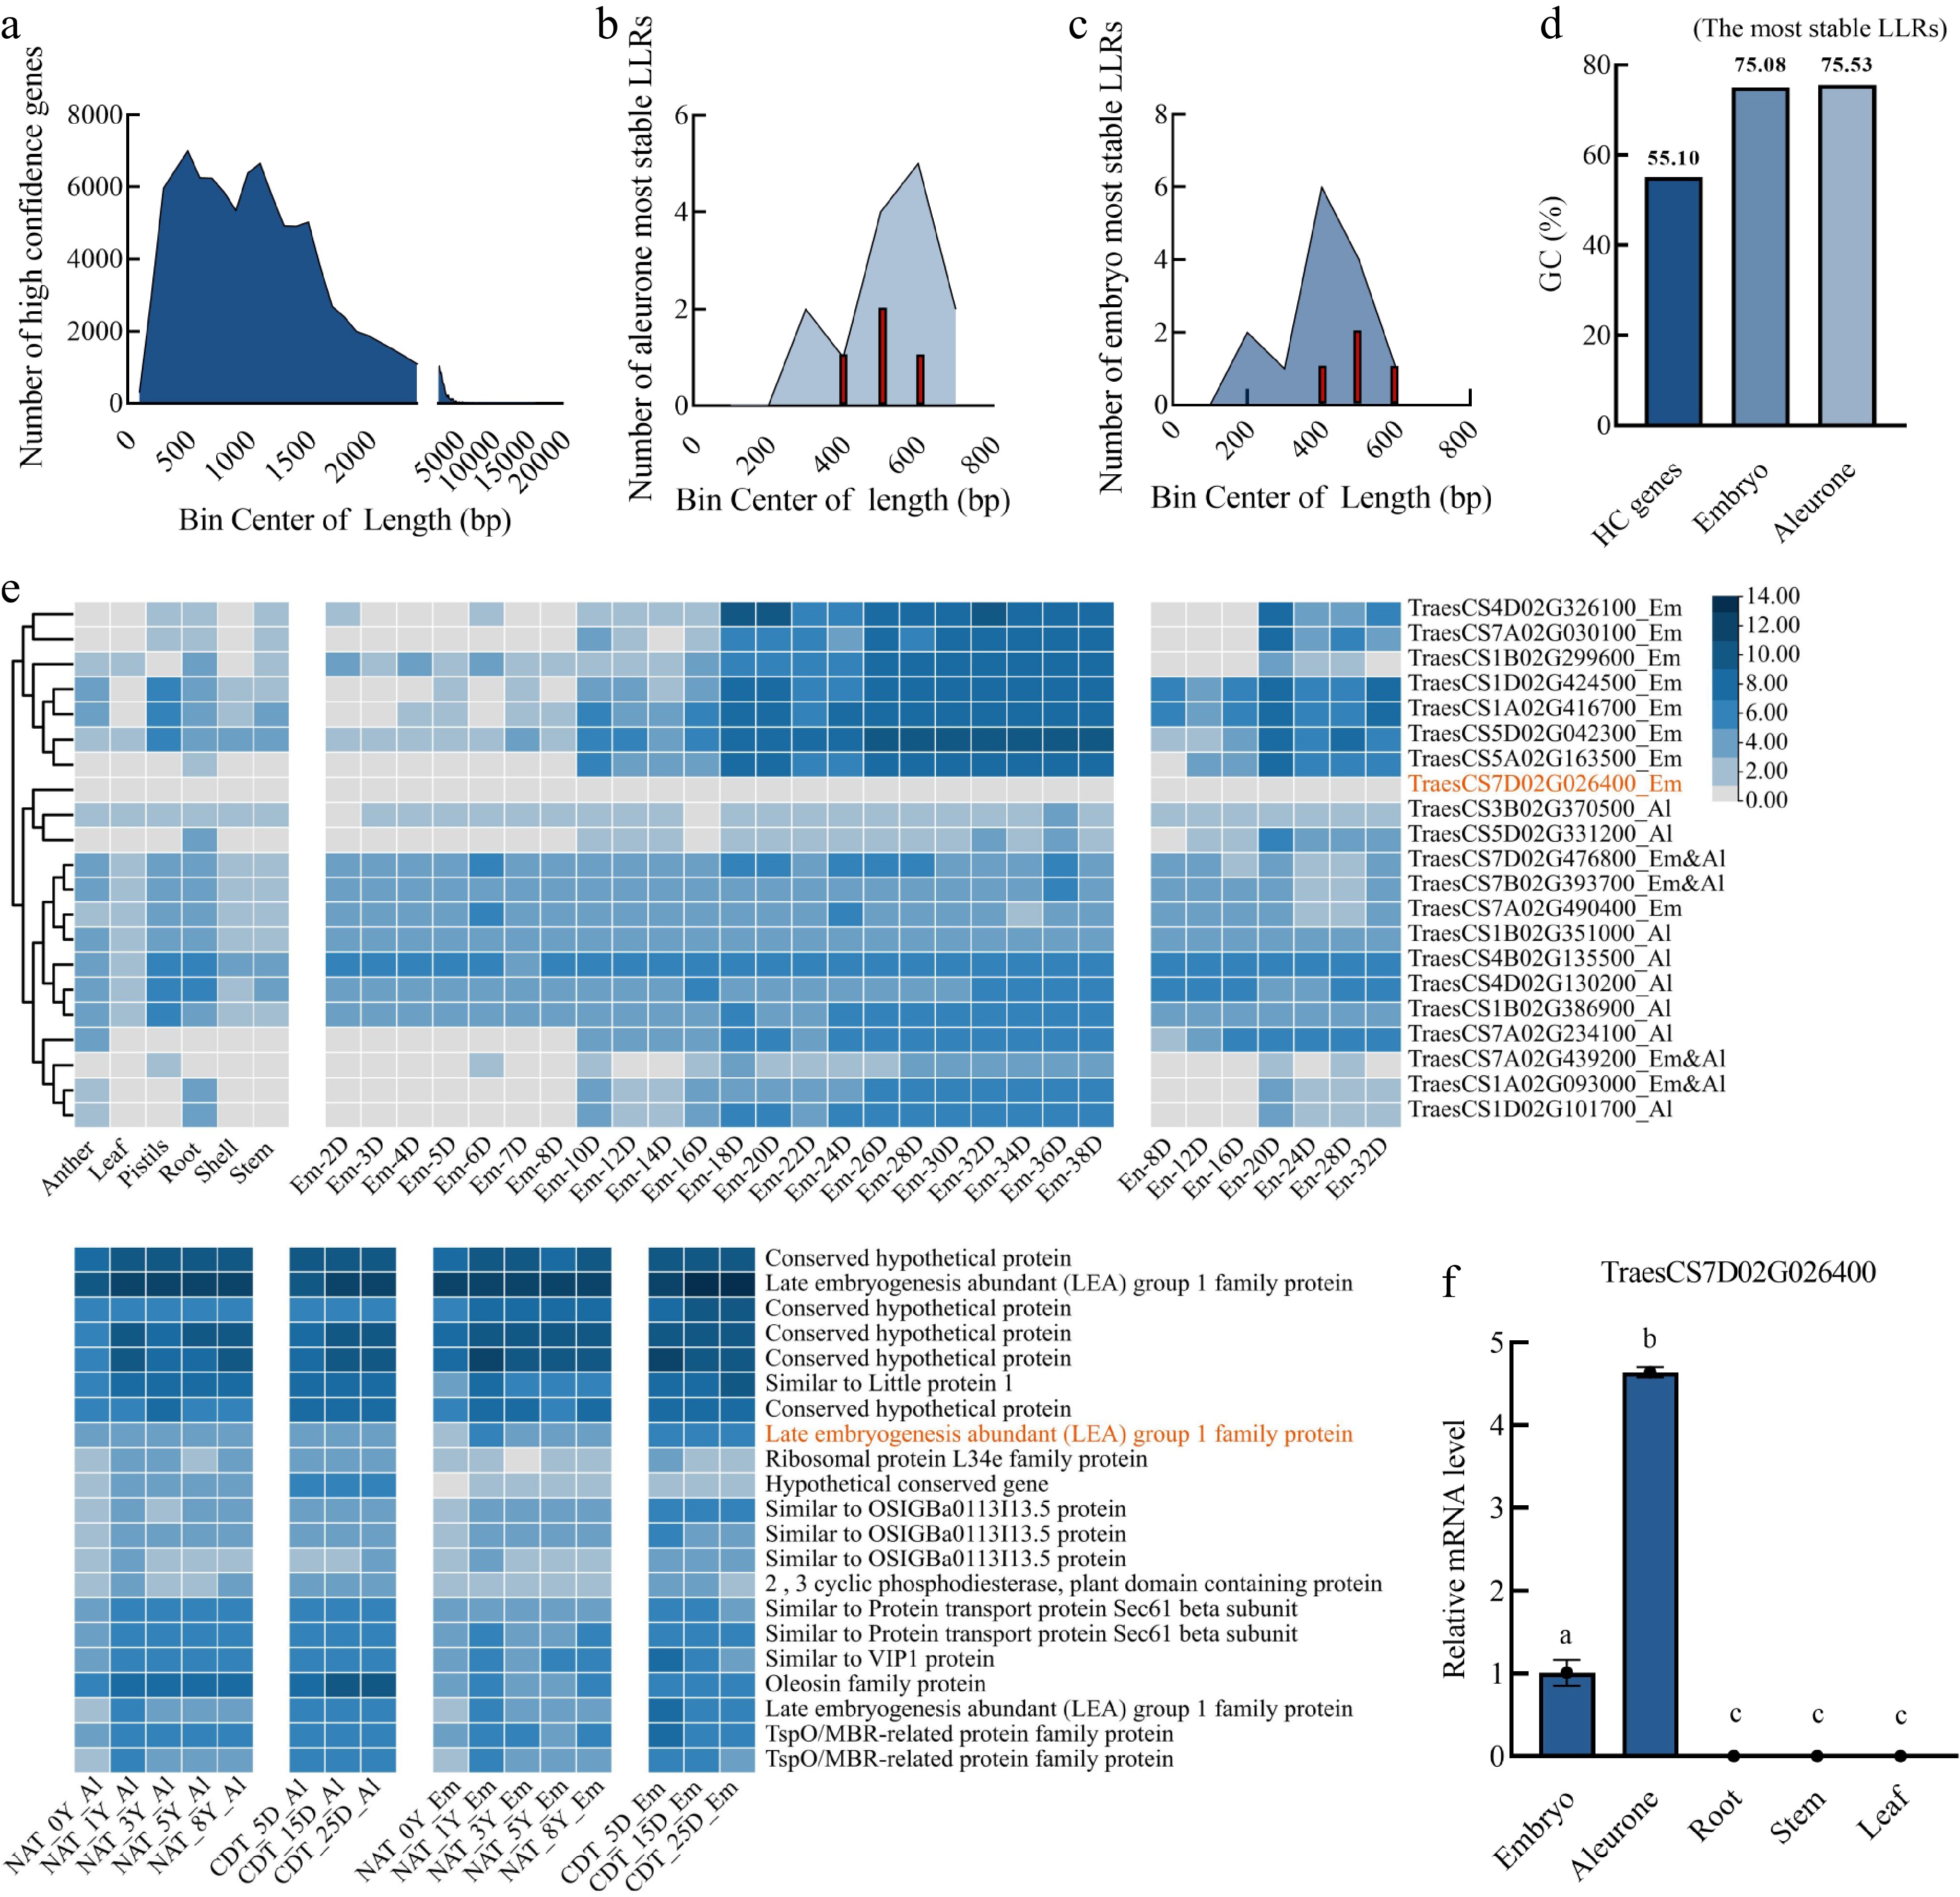
Figure 5.
Characterization of the most stable long-lived mRNAs (LLRs) in the embryo and aleurone layers. (a), (b), (c) Frequency analysis of the coding sequence length (x-axis) and gene numbers (y-axis). (a) Total high confidence genes. (b) The most stable LLRs in the aleurone layer. (c) The most stable LLRs in the embryo. (d) The average GC (%) content of all the high confidence genes in wheat seeds and the most stable LLRs in the wheat embryo and aleurone layer. (e) Heatmap visualization of RNA-seq data (Chinese Spring) from anther, leaf, pistils, root, shell, stem, the developing embryo (2−38 d), developing endosperm (8−32 d), NAT (0, 1, 3, 5, and 8 years) seeds, and CDT (5, 15, and 25 d) seeds. Embryo, EM; Aleurone layer, Al; Endosperm, En. LLRs in both embryo and aleurone layer,m Em&AL. (f) The relative expression levels of TraesCS7D02G026400 in root, stem, and leaf were determined by qPCR using actin as an internal reference gene. Two independent experiments were performed with triplicate samples in each experiment. The relative expression levels were calculated using the TBtools (Simple q-PCR summary) software. Using different lowercase letters to represent significant differences (p < 0.01, one-way ANOVA with Tukey's test).
-
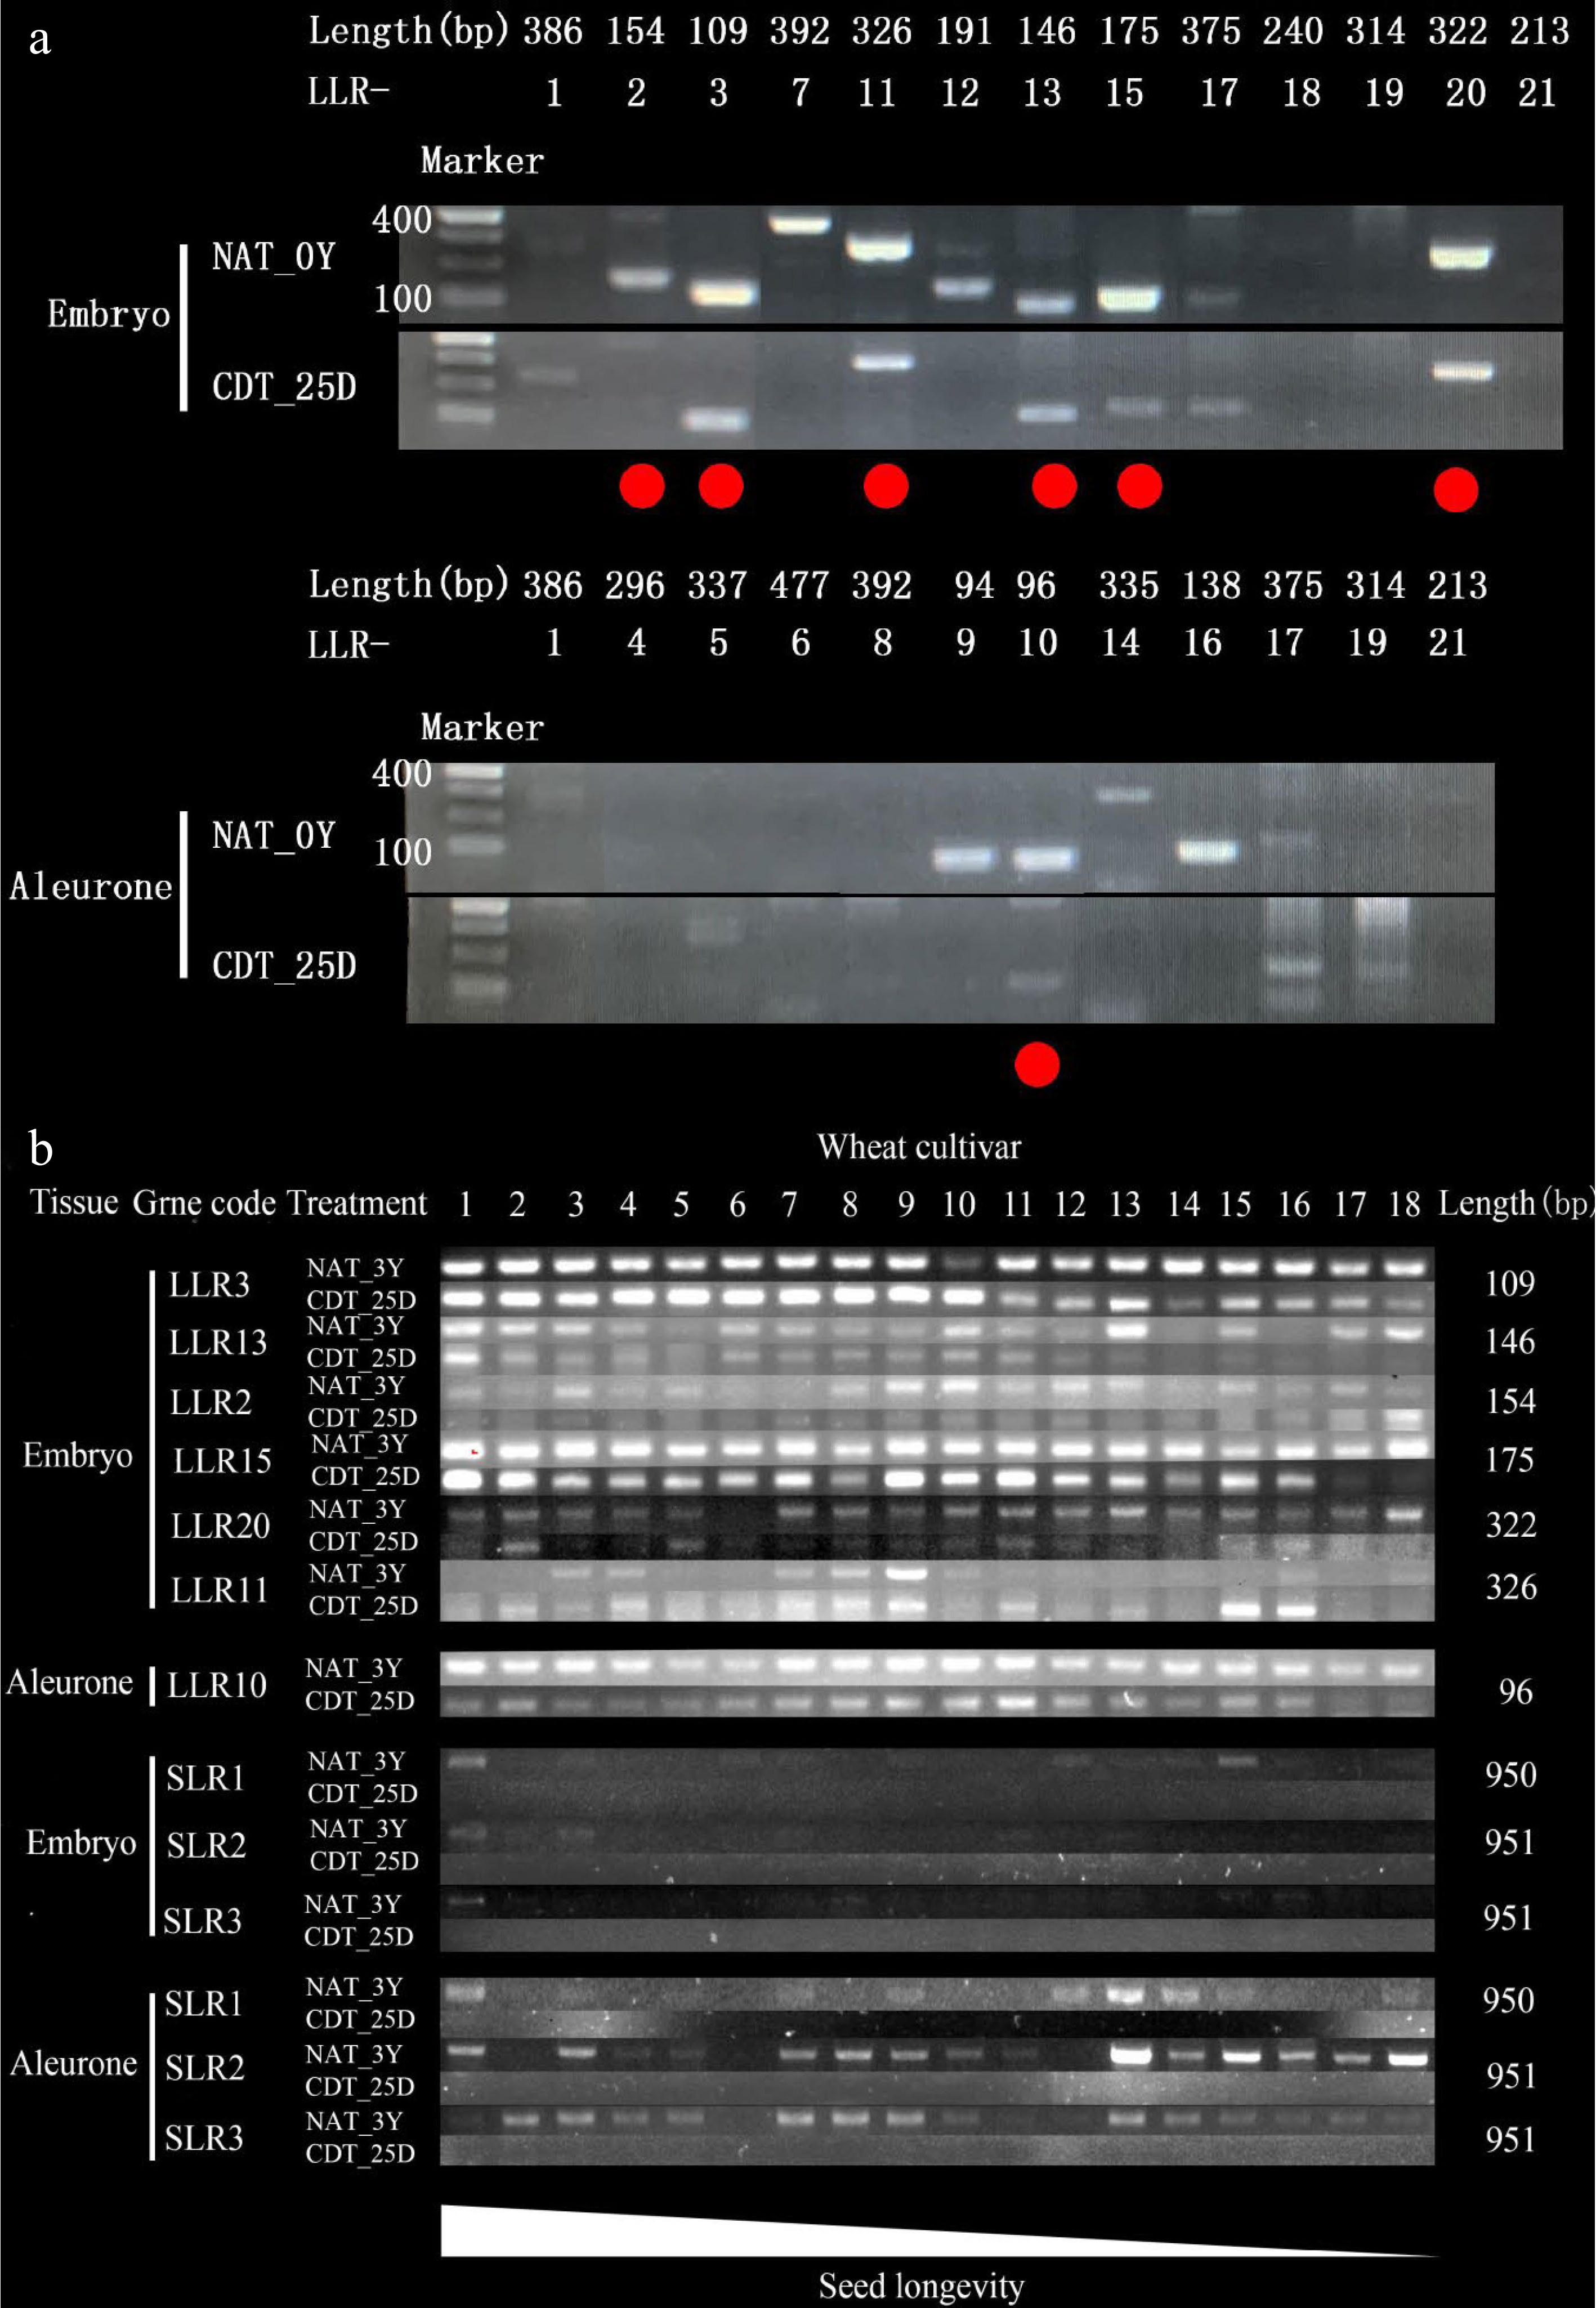
Figure 6.
The transcript levels of the most stable long-lived mRNAs (LLRs) in naturally aged treatment (NAT) and controlled deterioration treatment (CDT) wheat seeds detected by RT-PCR. The number of PCR cycles varied depending on their mRNA abundance in the unaged seeds. PCR products were run in agarose gels. (a) The 21 most stable LLRs in NAT for 0 Y (NAT_0Y) and CDT for 25 d (CDT_25D) Chinese Spring seeds were analyzed, respectively (see Supplemental Table S2 for the gene list). The 10 genes in 18 wheat varieties that NAT for 3 years (NAT_3Y) seeds and CDT_25D seeds were analyzed. (See Supplemental Table S1 for the wheat cultivar code and Supplemental Table S2 for the gene list). The lower wheat cultivar code number indicates higher seed longevity in (b).
Figures
(6)
Tables
(0)