-
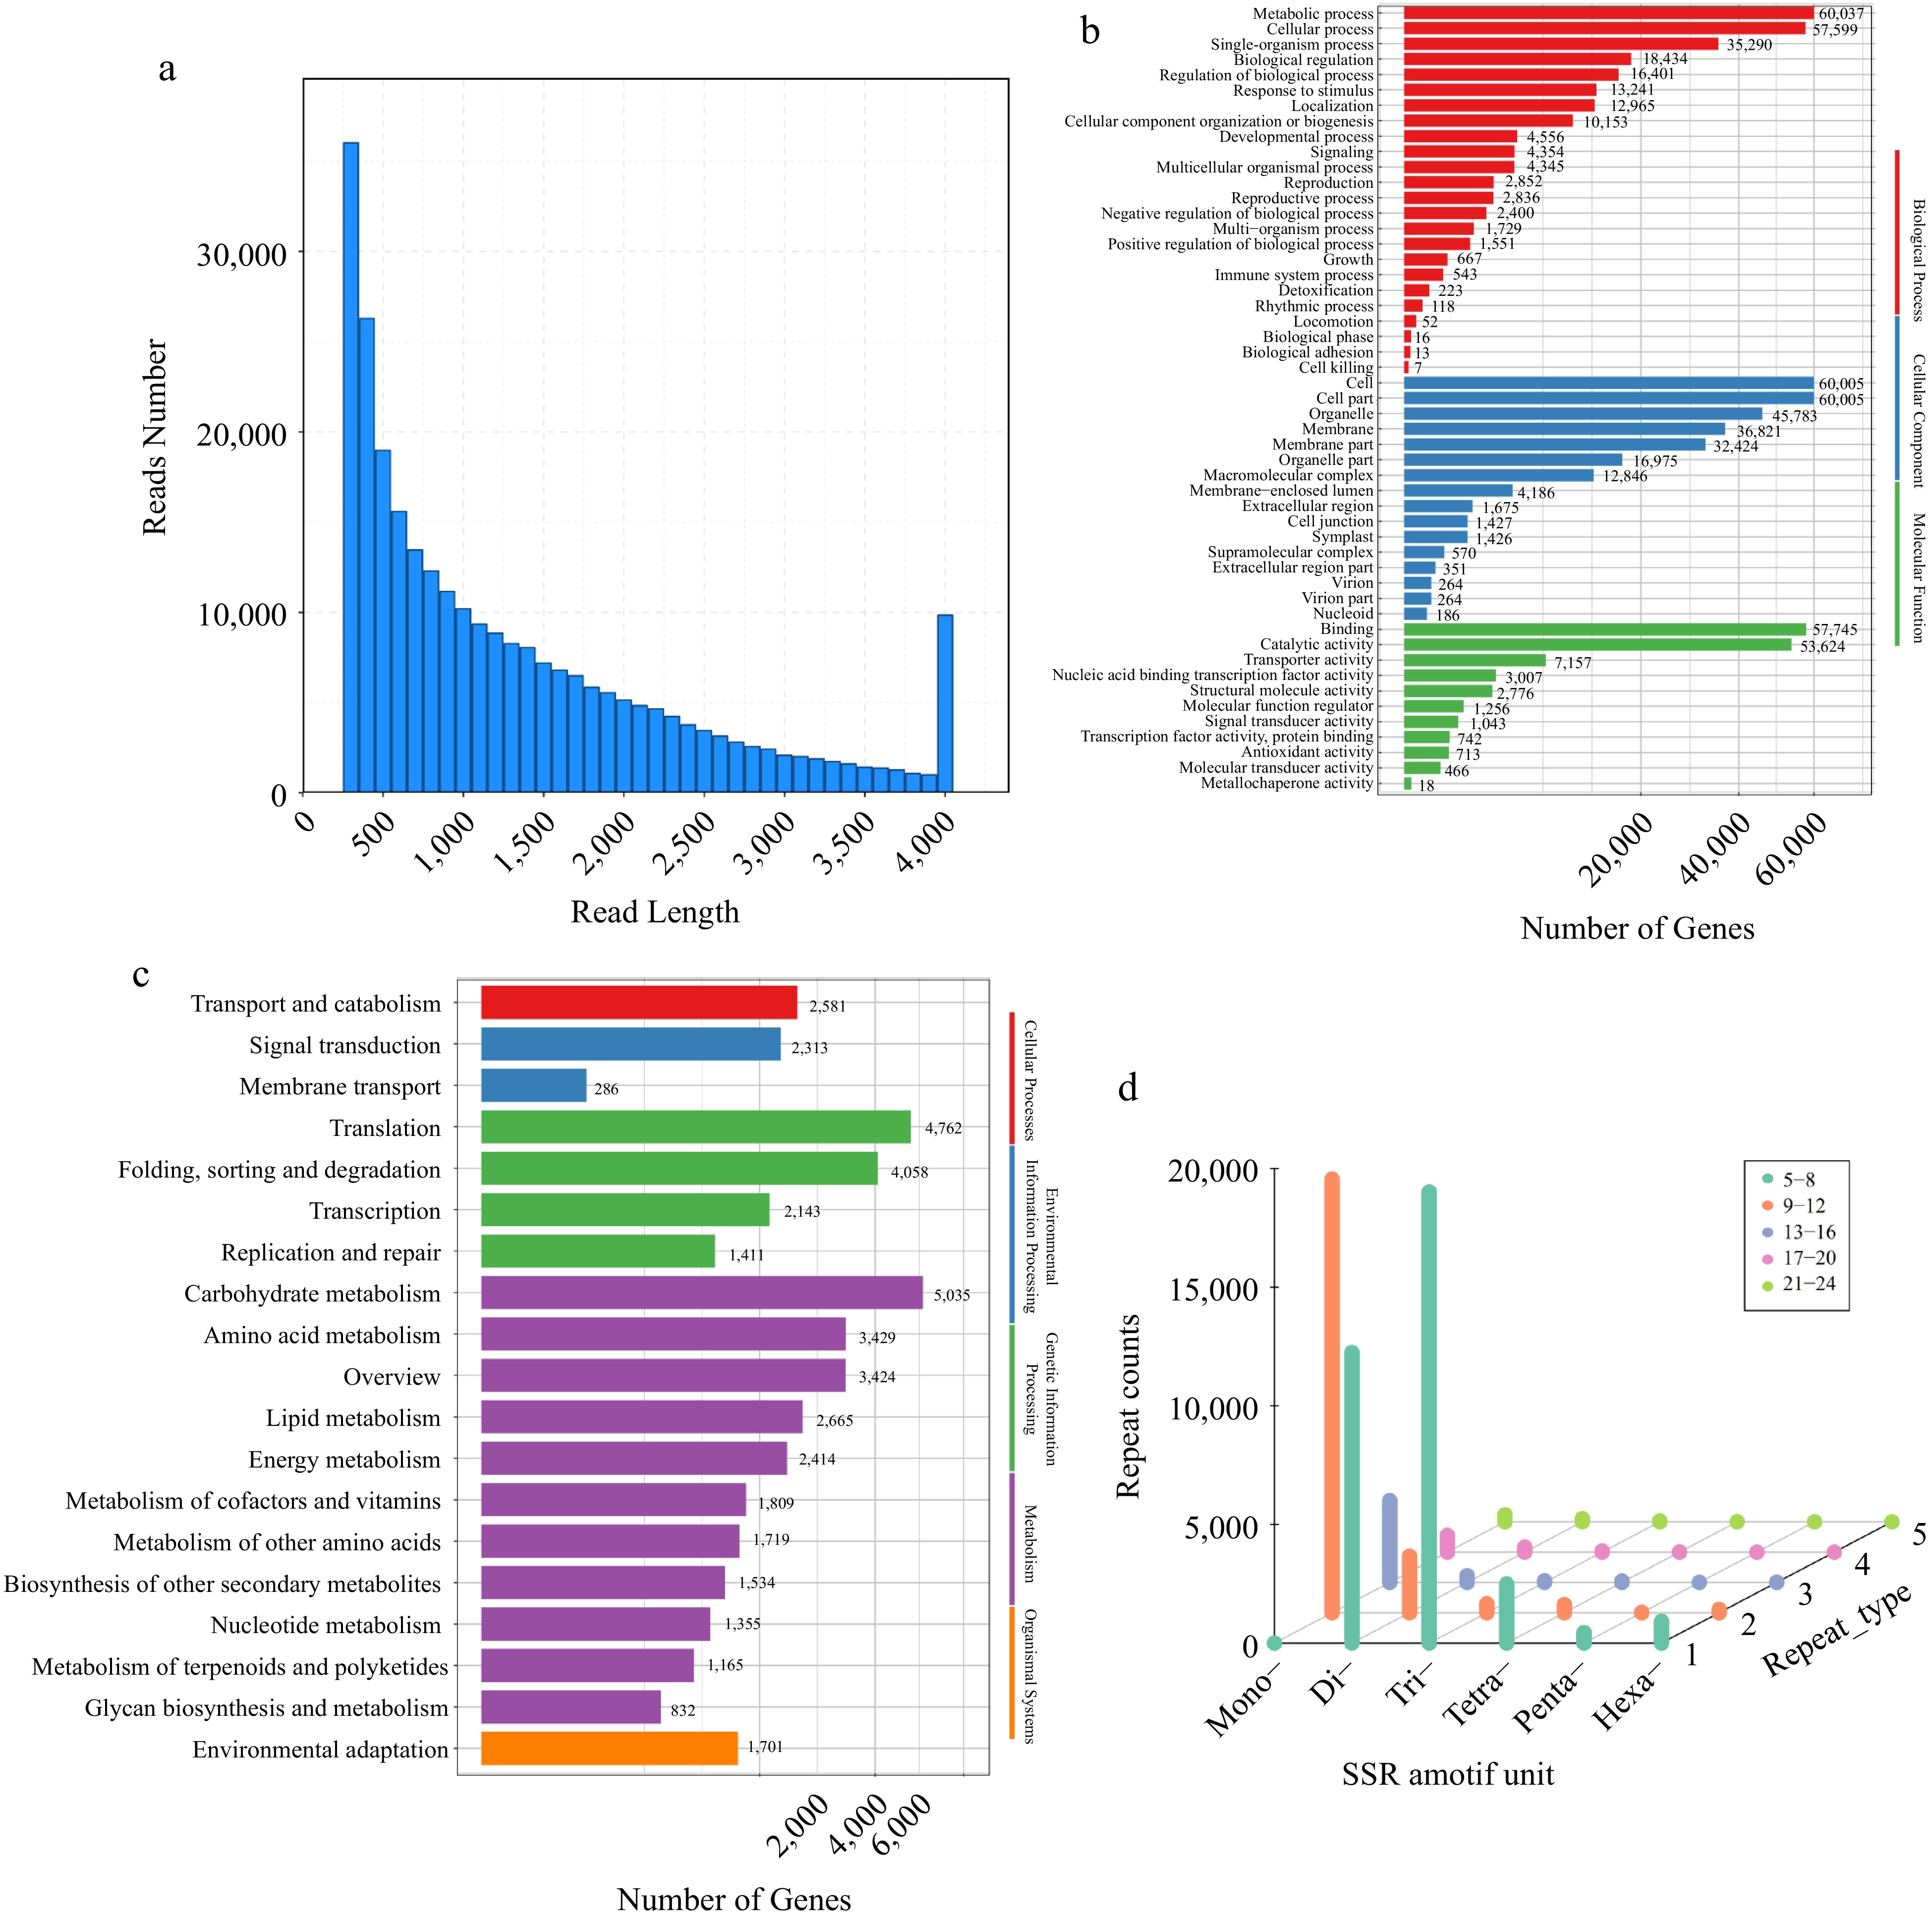
Figure 1.
Characteristics of reed canary grass transcripts. (a) Distribution of transcripts lengths in Phalaris. (b) Functional annotation of transcripts based on Gene Ontology (GO) categorization. (c) Top 19 KEGG pathways containing the most transcripts. (d) Distribution of six SSR repeat types in different genic regions.
-
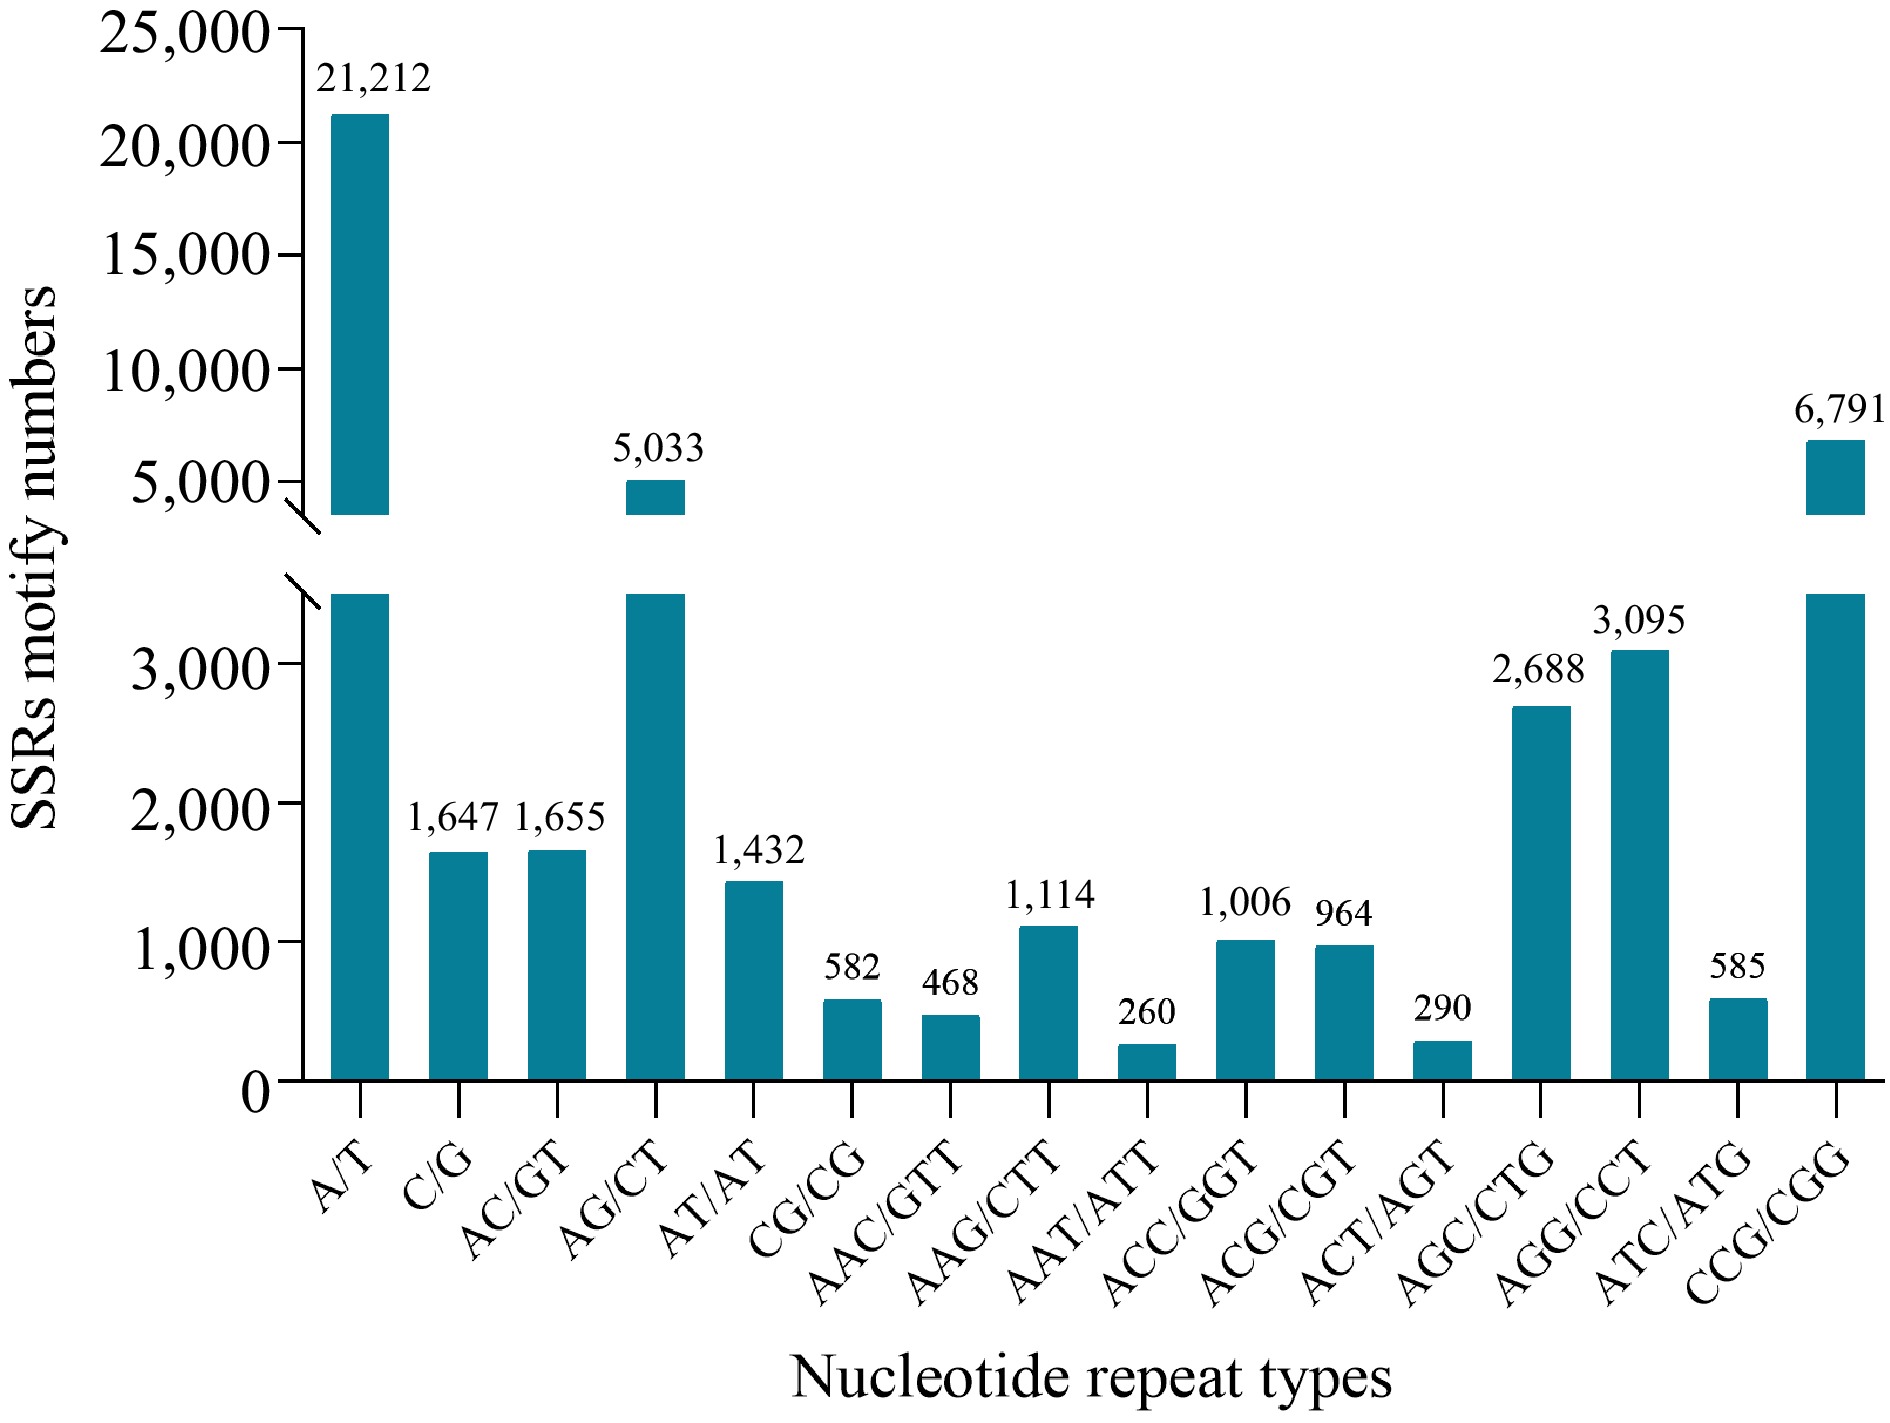
Figure 2.
Simple sequence repeats length distribution across different motif classification in reed canary grass.
-

Figure 3.
Unweighted Pair Group Method with Arithmetic (UPGMA) tree of the 19 accessions (the reliability of the clustering results is indicated by a bootstrap support value of more than 50% for each main branch of the clustering tree map) and genetic relationship among reed canary grass accessions using a Bayesian analysis.
-
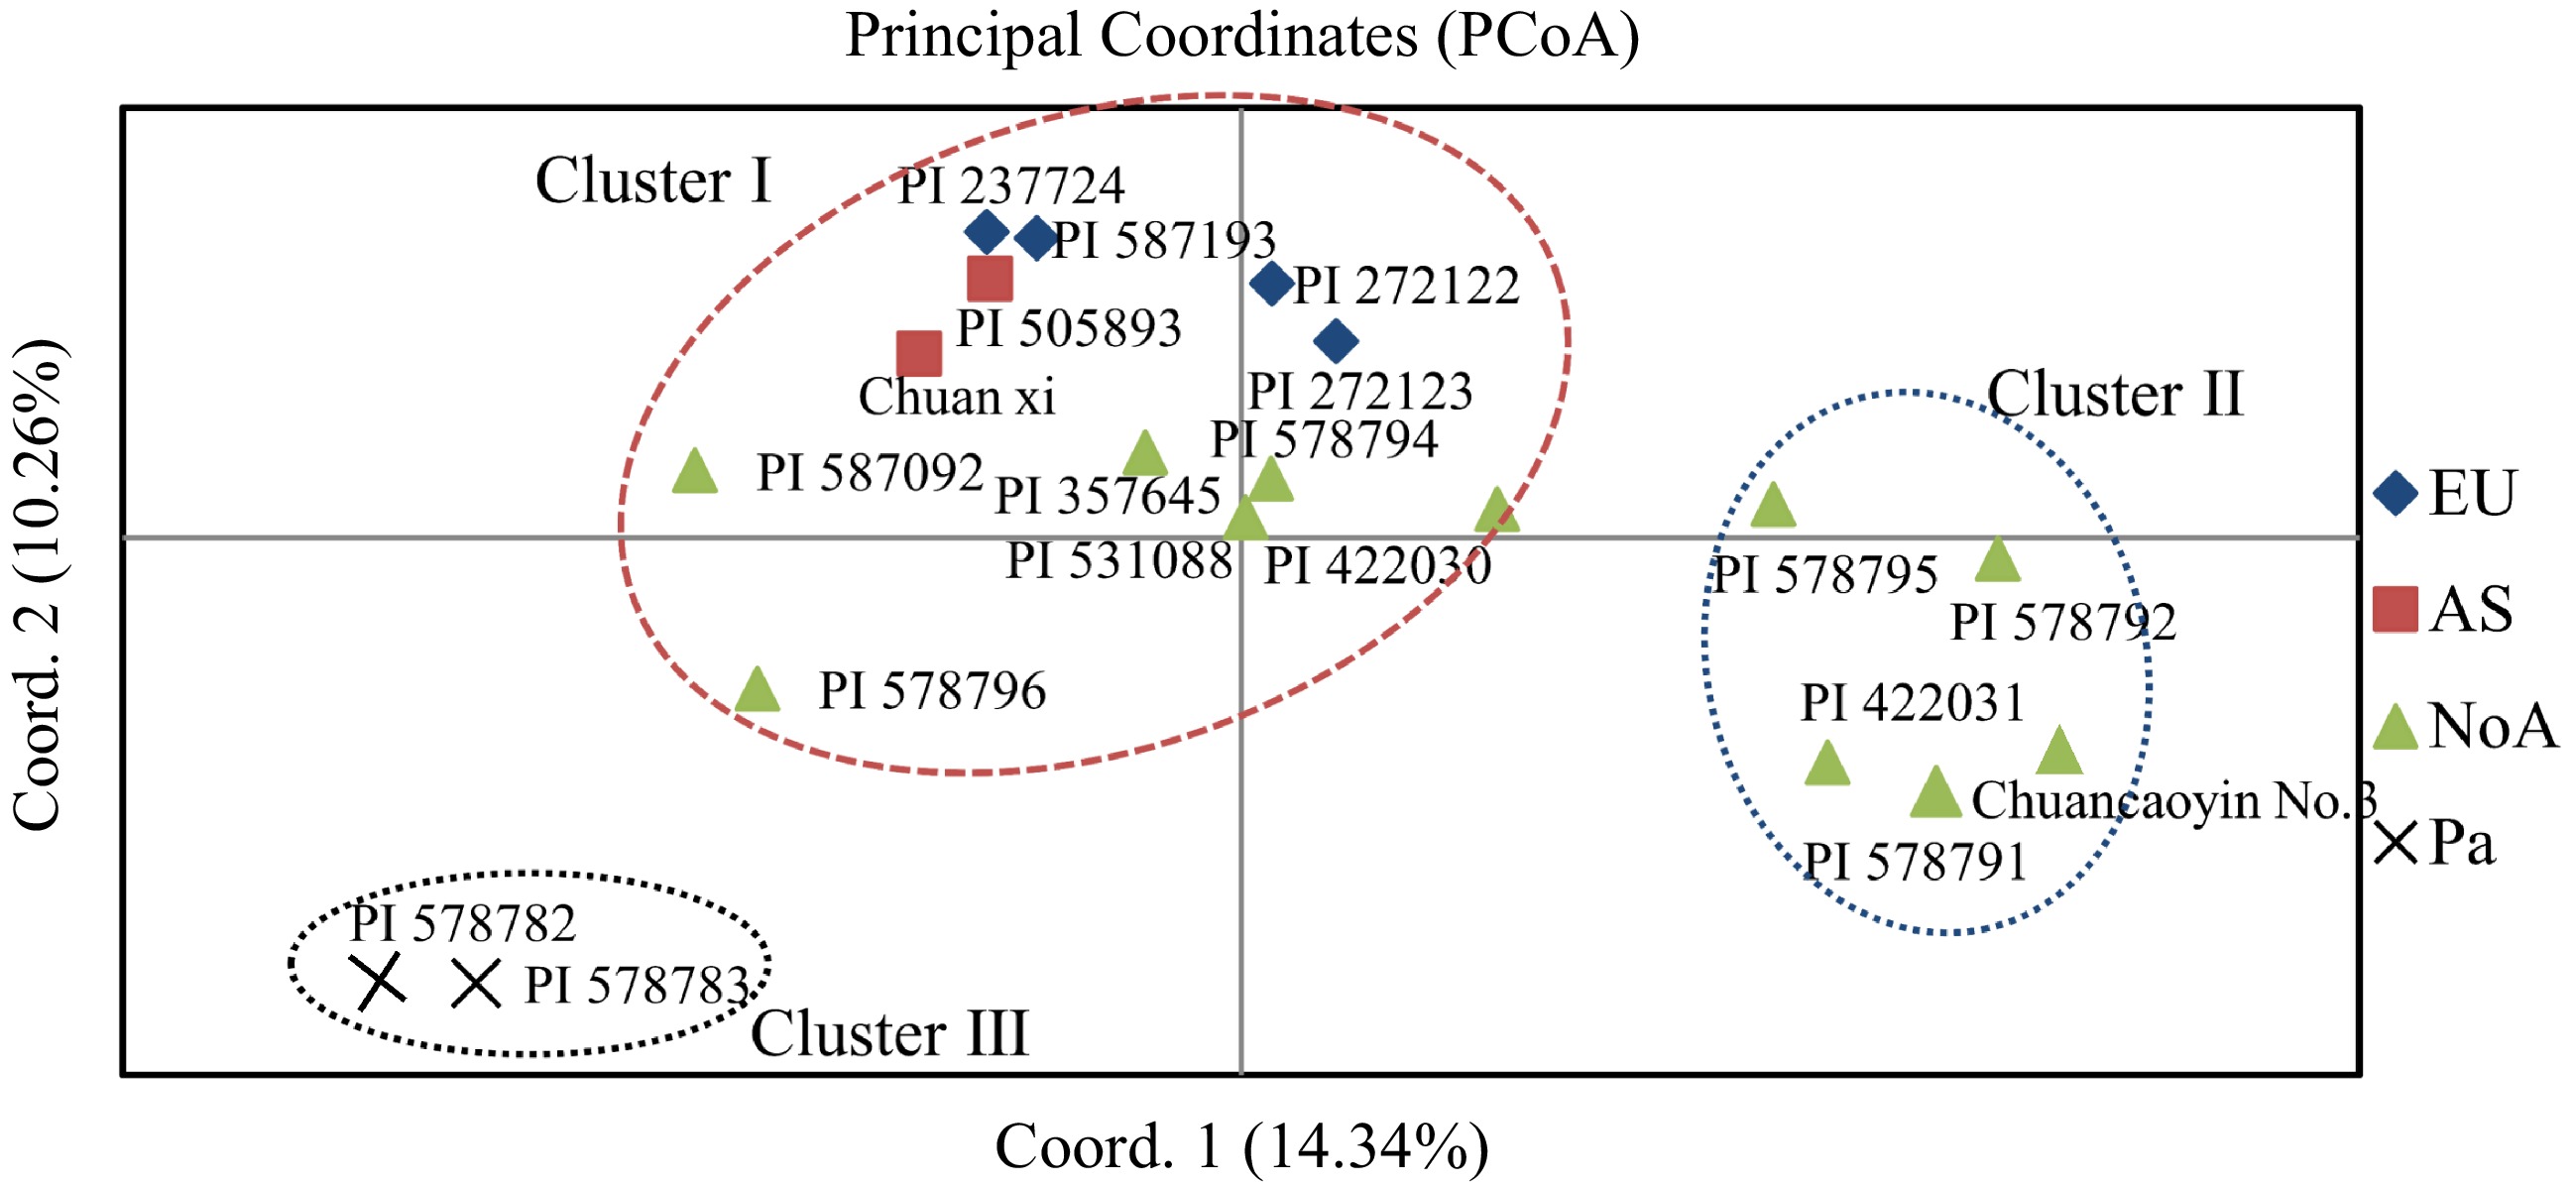
Figure 4.
Principal coordinate analysis (PCoA) showing the relationships of the reed canary grass accessions.
-
Replicates Read Clean Size of clean Q20 (%) Q30 (%) GC (%) Length Reads pairs Base (bp) Sample1 150 24,378,713 7,313,613,900 97 89.45 53.8 Sample2 150 22,716,853 6,815,055,900 97.55 91.1 53.7 Sample3 150 27,431,912 8,229,573,600 97.05 89.7 55.1 Mean 150 24,842,493 7,452,747,800 97.2 90.08 54.2 Table 1.
De novo transcriptome sequencing of reed canary grass.
-
Database Number of transcripts Percentage Total 272,328 100% KOG 46,697 17.15% KEGG 59,324 21.78% NR 158,464 58.19% GO 110,631 40.62% Swiss-Prot 106,768 39.21% Unknown 113,24 41.58% Table 2.
Annotation statistics of reed canary grass transcripts.
-
SSR mining Number Total number of sequences examined 272,328 Total size of examined sequences (bp) 351,691,355 Total number of identified SSRs 50,155 Number of SSR containing sequences 41,925 Number of sequences containing more than 1 SSR 6,779 Number of SSRs present in compound formation 1,936 Distribution of SSRs in different repeat types Mono-nucleotide 22,859(45.58%) Di-nucleotide 8,702(17.35%) Tri-nucleotide 17,261(34.42%) Tetra-nucleotide 824(1.64%) Penta-nucleotide 318(0.63%) Hexa-nucleotide 191(0.38%) Table 3.
Statistics of SSRs identified in reed canary grass transcripts.
-
TNB NPB PPB% PIC MI Rp H I SSR1 10 9 90 0.39 3.47 5.79 0.47 0.59 SSR2 16 16 100 0.38 6.01 9.05 0.49 0.62 SSR3 9 9 100 0.38 3.45 4.42 0.48 0.60 SSR4 6 6 100 0.39 2.31 2.21 0.47 0.49 SSR5 8 8 100 0.37 2.99 4.32 0.50 0.62 SSR6 7 7 100 0.37 2.62 4.00 0.50 0.61 SSR7 6 6 100 0.39 2.36 3.37 0.46 0.59 SSR8 7 7 100 0.39 2.70 3.26 0.47 0.59 SSR9 10 10 100 0.38 3.83 3.89 0.48 0.59 SSR10 7 7 100 0.38 2.63 3.68 0.49 0.63 SSR11 11 11 100 0.37 4.12 6.11 0.50 0.61 SSR12 7 7 100 0.38 2.64 4.21 0.49 0.67 SSR13 7 7 100 0.41 2.86 3.37 0.42 0.66 SSR14 9 9 100 0.38 3.45 4.32 0.48 0.6 SSR15 5 4 80 0.39 1.56 2.63 0.47 0.57 SSR16 6 6 100 0.37 2.24 1.05 0.50 0.56 SSR17 2 2 100 0.37 0.75 0.42 0.50 0.48 SSR18 5 5 100 0.41 2.07 1.16 0.41 0.63 SSR19 2 2 100 0.40 0.79 1.05 0.45 0.61 SSR20 3 3 100 0.39 1.17 1.26 0.47 0.59 SSR21 3 3 100 0.40 1.21 1.16 0.43 0.52 SSR22 3 3 100 0.37 1.12 1.37 0.50 0.62 SSR23 5 5 100 0.39 1.97 2.74 0.45 0.6 SSR24 3 3 100 0.39 1.18 2.11 0.46 0.72 SSR25 2 2 100 0.38 0.77 1.05 0.48 0.64 SSR26 2 2 100 0.38 0.76 0.95 0.49 0.61 SSR27 3 3 100 0.39 1.18 0.74 0.46 0.53 SSR28 2 2 100 0.38 0.76 1.58 0.49 0.66 SSR29 2 2 100 0.40 0.79 1.05 0.45 0.61 SSR30 4 4 100 0.39 1.57 2.11 0.46 0.56 SSR31 3 3 100 0.37 1.12 2.53 0.50 0.66 SSR32 2 2 100 0.41 0.83 1.16 0.41 0.72 SSR33 3 3 100 0.38 1.13 2.84 0.49 0.7 SSR34 2 2 100 0.40 0.79 1.05 0.45 0.56 SSR35 5 5 100 0.39 1.95 3.58 0.47 0.64 SSR36 3 3 100 0.38 1.14 1.58 0.49 0.62 SSR37 2 2 100 0.37 0.75 1.89 0.50 0.7 SSR38 2 2 100 0.38 0.75 1.05 0.49 0.64 SSR39 6 6 100 0.38 2.30 4.63 0.48 0.72 SSR40 5 5 100 0.43 2.13 1.79 0.38 0.52 SSR41 4 4 100 0.39 1.57 2.42 0.46 0.6 SSR42 2 2 100 0.38 0.76 1.58 0.49 0.71 SSR43 2 2 100 0.40 0.79 0.84 0.45 0.5 SSR44 2 2 100 0.38 0.76 1.68 0.49 0.67 SSR45 3 3 100 0.39 1.16 1.58 0.47 0.6 Total 218 216 99.08 0.37 80.74 114.63 0.50 0.61 Mean 4.84 4.80 99.33 0.39 1.85 4.98 0.47 0.61 MI, marker Index; Rp, resolving power; I, Shannon information index; H, heterozygosity. Table 4.
Marker parameters calculated for each SSR primer combination used with reed canary grass accessions.
-
Geographical group N Na Ne I He P NoA 11.000 1.955 1.577 0.512 0.341 96.53% EU 4.000 1.495 1.432 0.358 0.244 62.38% AS 2.000 0.866 1.168 0.144 0.098 23.76% Pa 2.000 0.891 1.175 0.150 0.103 24.75% N, Individual number of populations; Na, No. of different Alleles; Ne, No. of effective alleles; I, Shannon information index; He, Expected heterozygosity; P, Genetic variation. Table 5.
Different genetic diversity estimates for four geographical groups of reed canary grass accessions.
-
Source of variation df SS MS Est. Var. PMV (%) Fst P Among pops 2 4.410 2.205 0.046 2% 0.023 0.143 Within pops 14 28.040 2.003 2.003 98% Total 16 32.450 2.049 100% df, degree of freedom; SS, square deviation; MS, mean square deviation; Est.Var, exist variance; Fst, coefficient of genetic differentiation; PMV, Percentages of molecular variance. Table 6.
Analysis of molecular variance (AMOVA) among and within geographical groups of reed canary grass accessions.
Figures
(4)
Tables
(6)