-
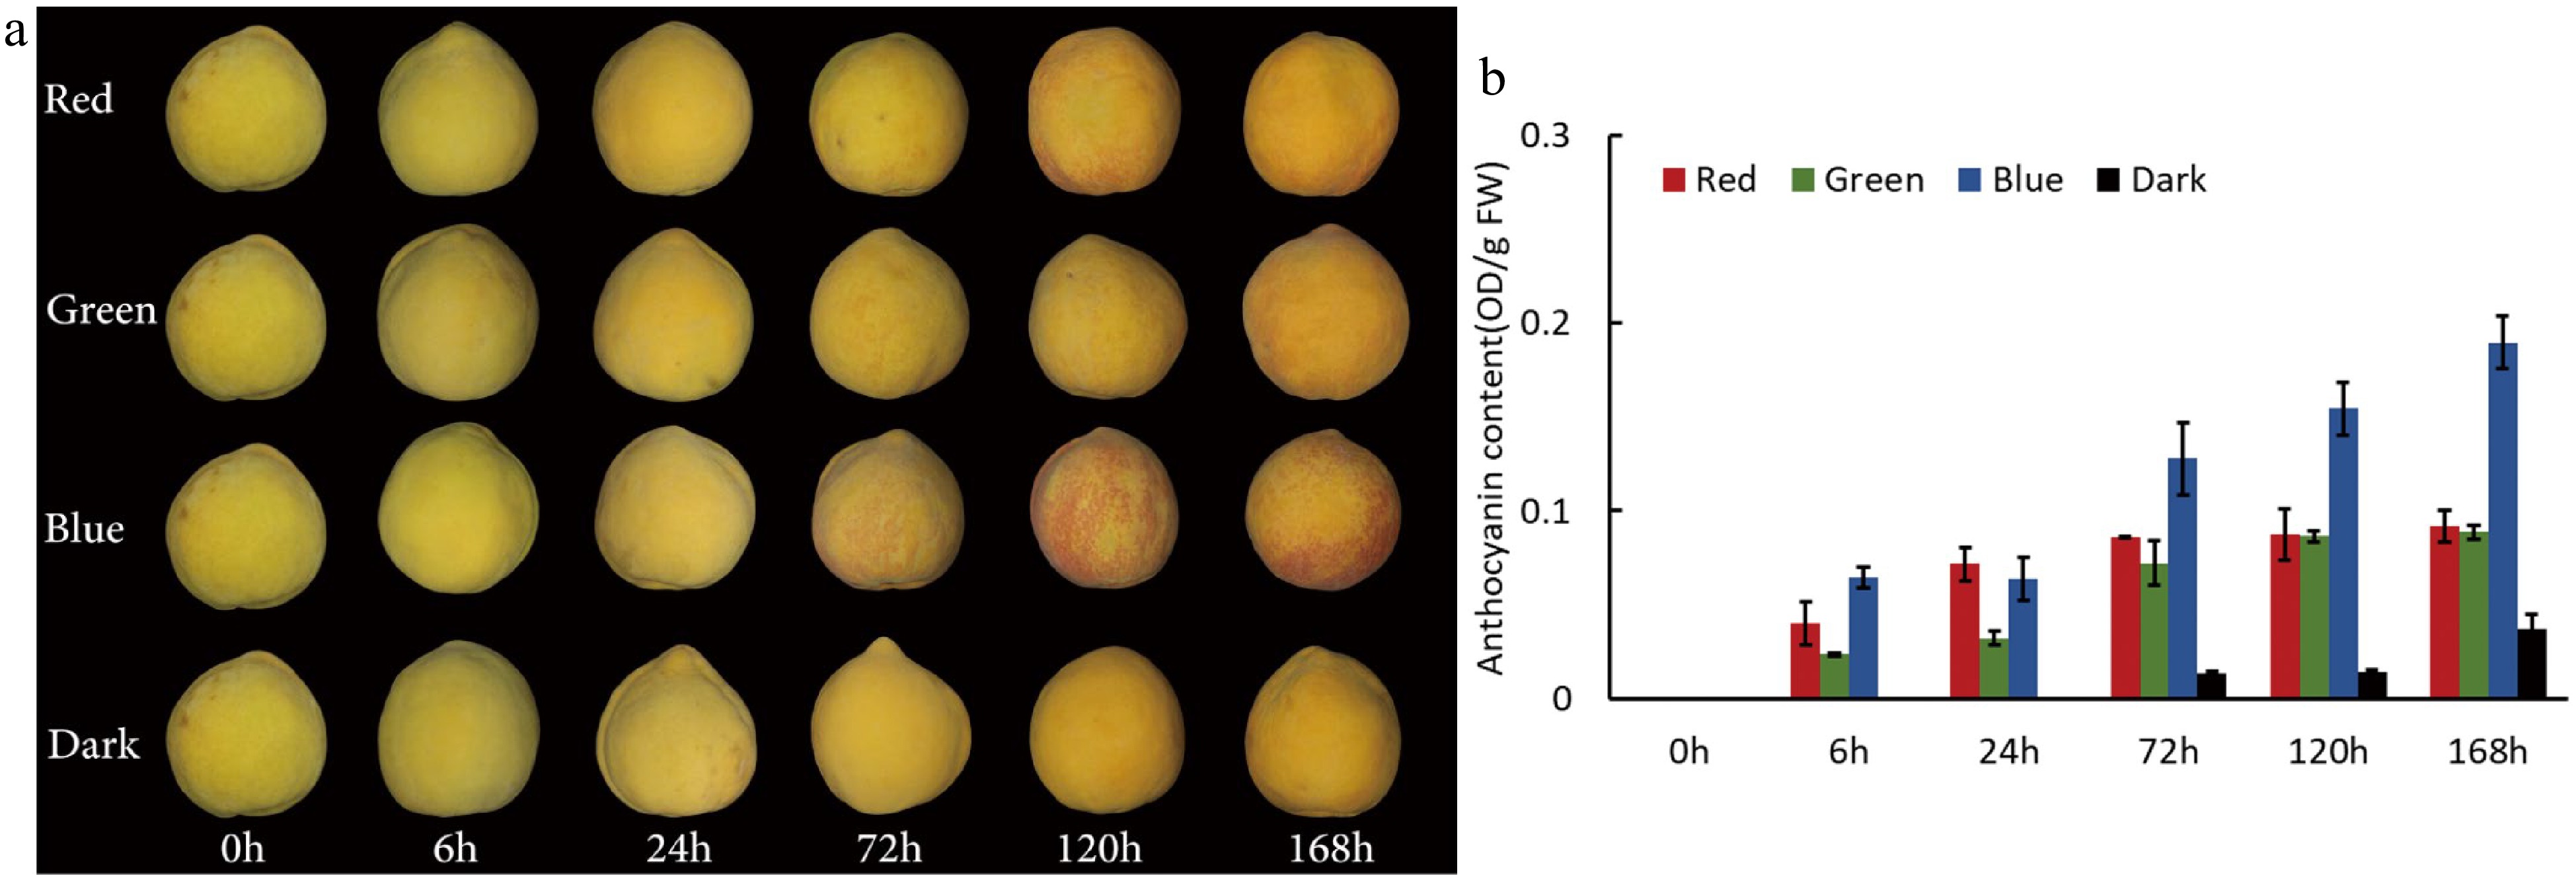
Figure 1.
Effects of visible light with different wavelengths on anthocyanin accumulation in peach peel. (a) The peel coloration of 'Jinxiu' treated with red, green and blue light or under dark conditions. (b) Anthocyanin accumulation of peach peel treated with red, green and blue light or under dark conditions. Error bars in (b) show the standard error (SE) of three biological replicates.
-
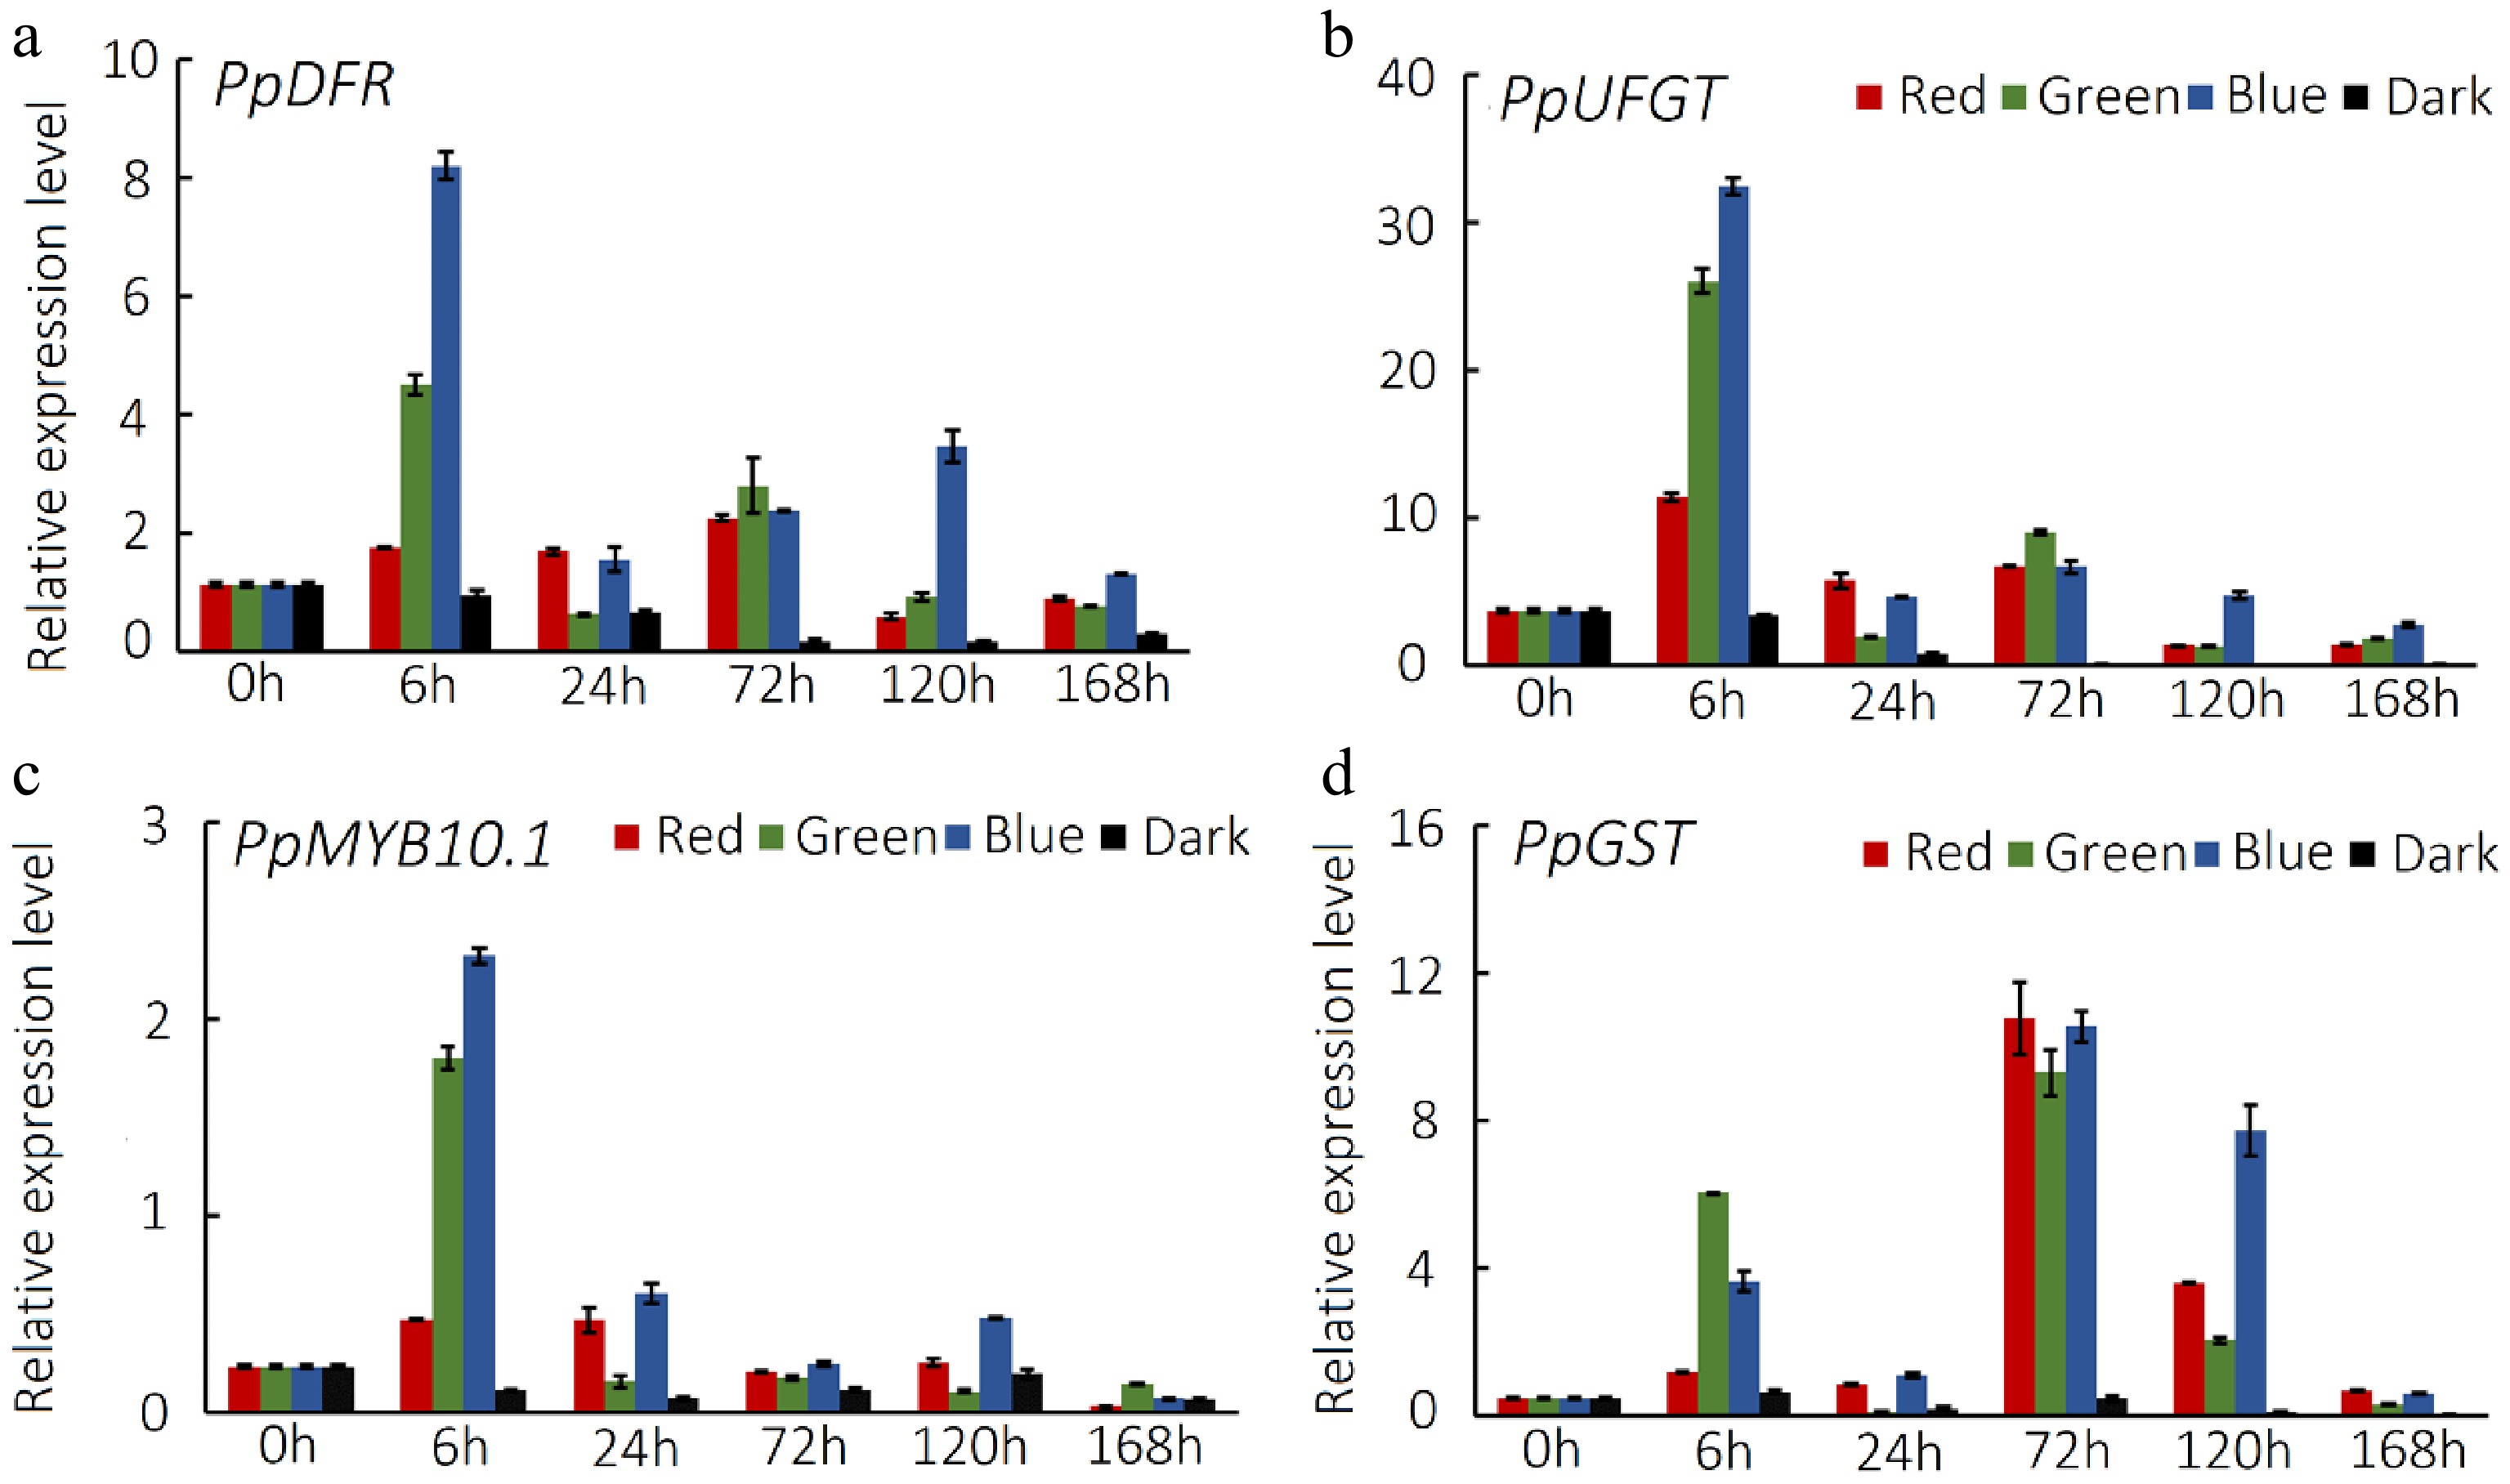
Figure 2.
Expression level of anthocyanin-related genes in peach peel exposed to visible light with different wavelengths. Expression profiles of anthocyanin synthesis genes (a) PpDFR and PpUFGT, (b) regulator gene PpMYB10.1, (c) transporter gene PpGST in peach peel treated with red, green and blue light or under dark conditions. Error bars show the ± SE of three biological replicates.
-
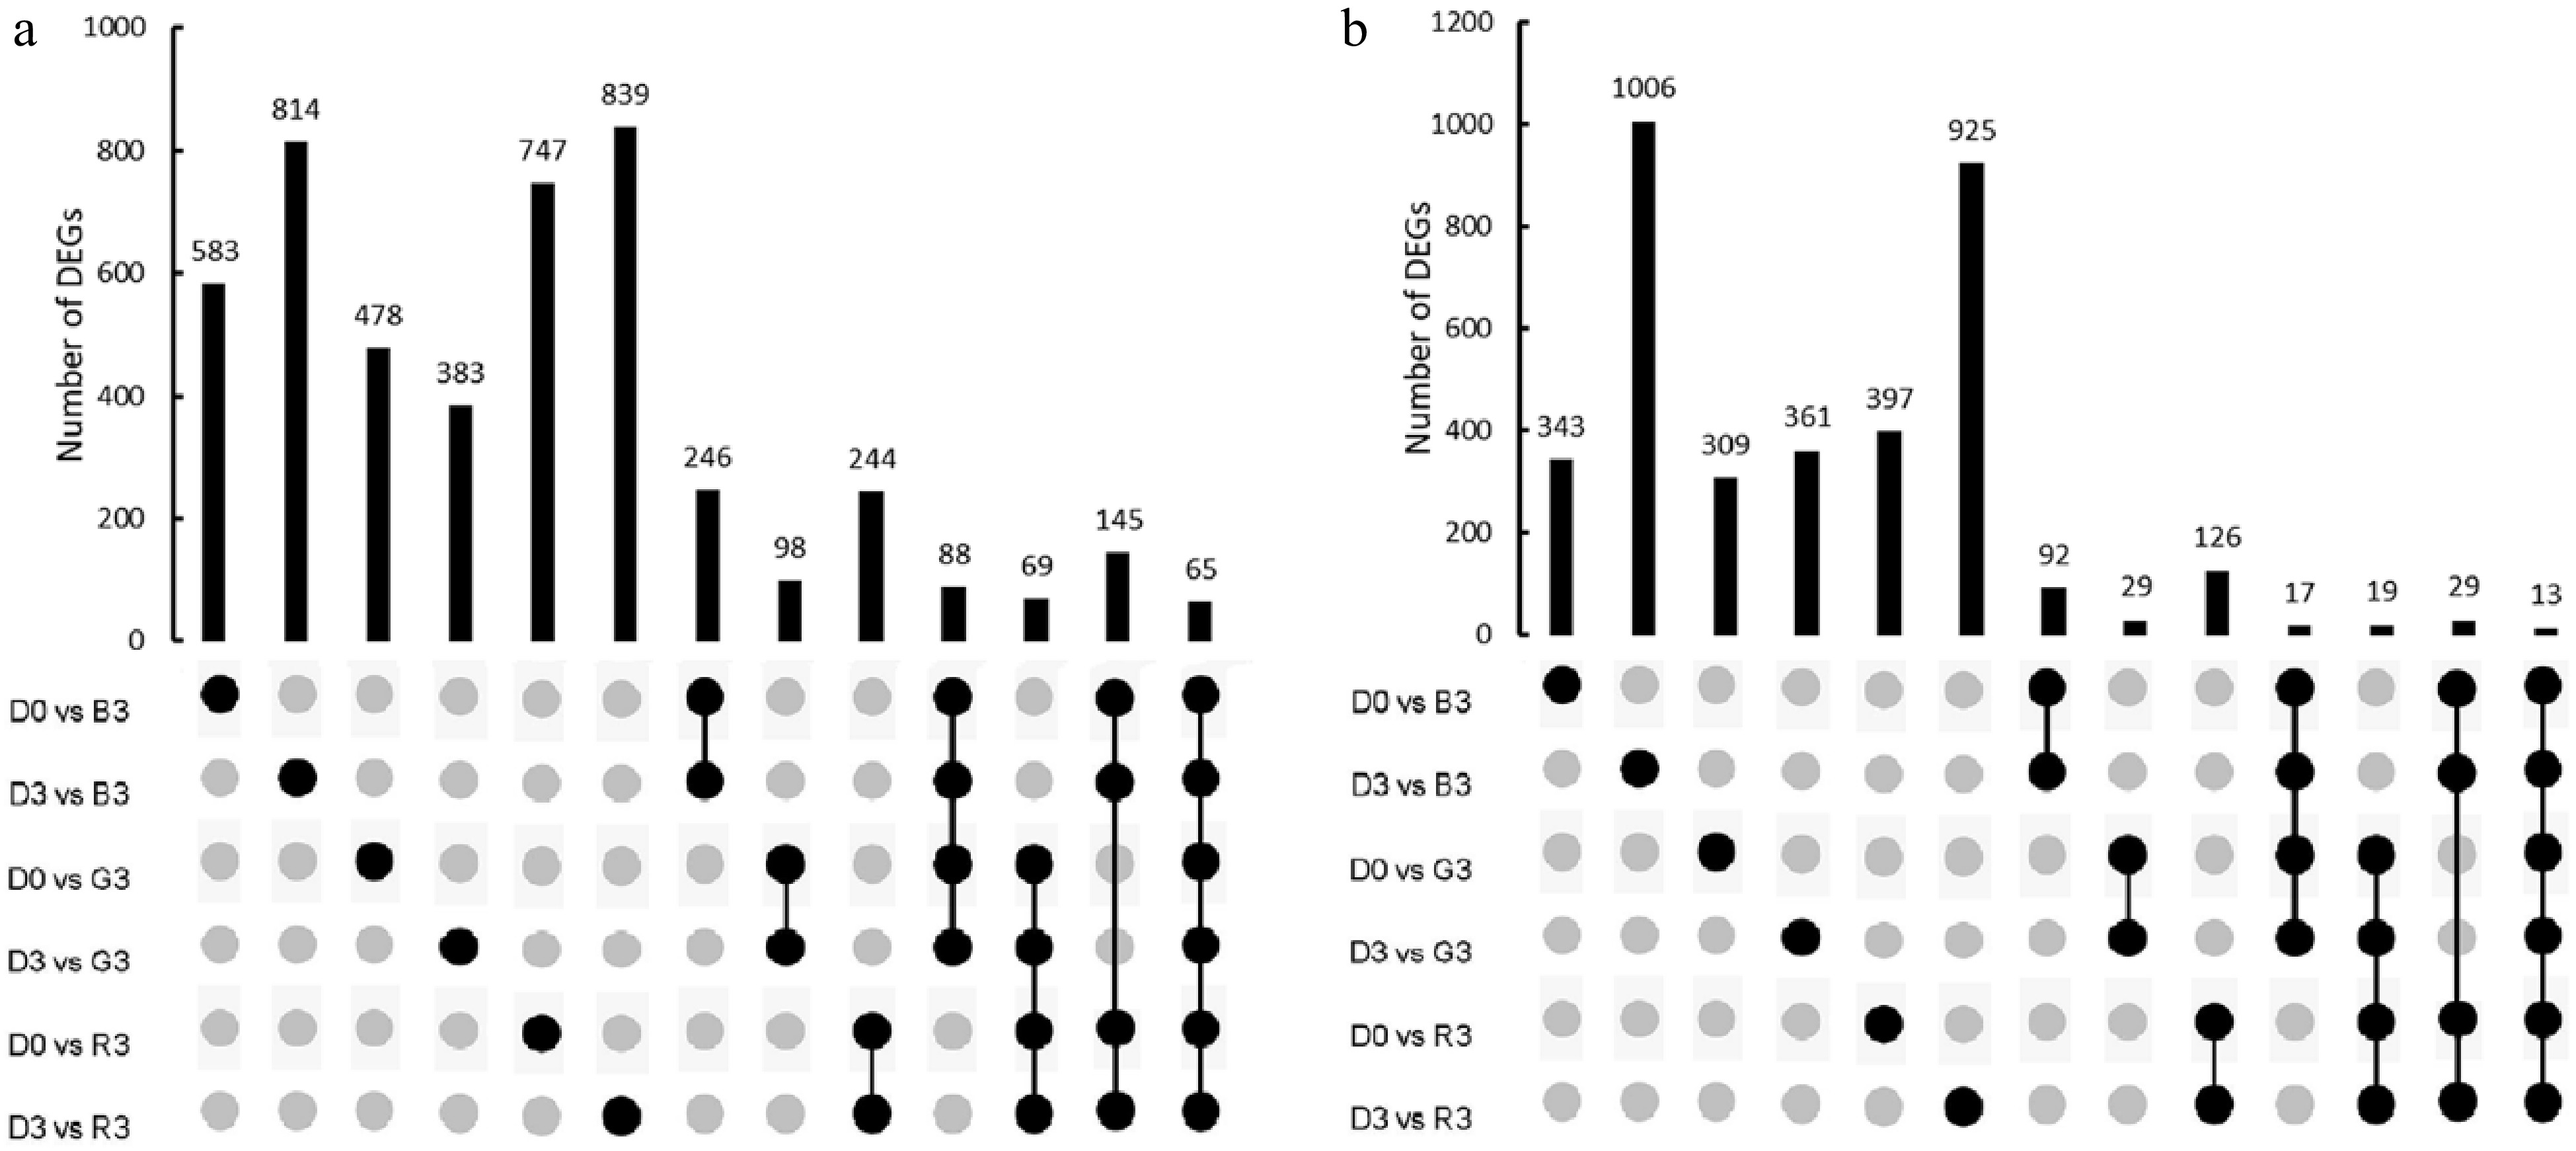
Figure 3.
Analysis of DEGs in peach peel samples treated with red, green and blue light irradiation. (a) The number of up-regulated genes in response to red, green, and blue light. (b) The number of down-regulated genes in response to red, green, and blue light.
-
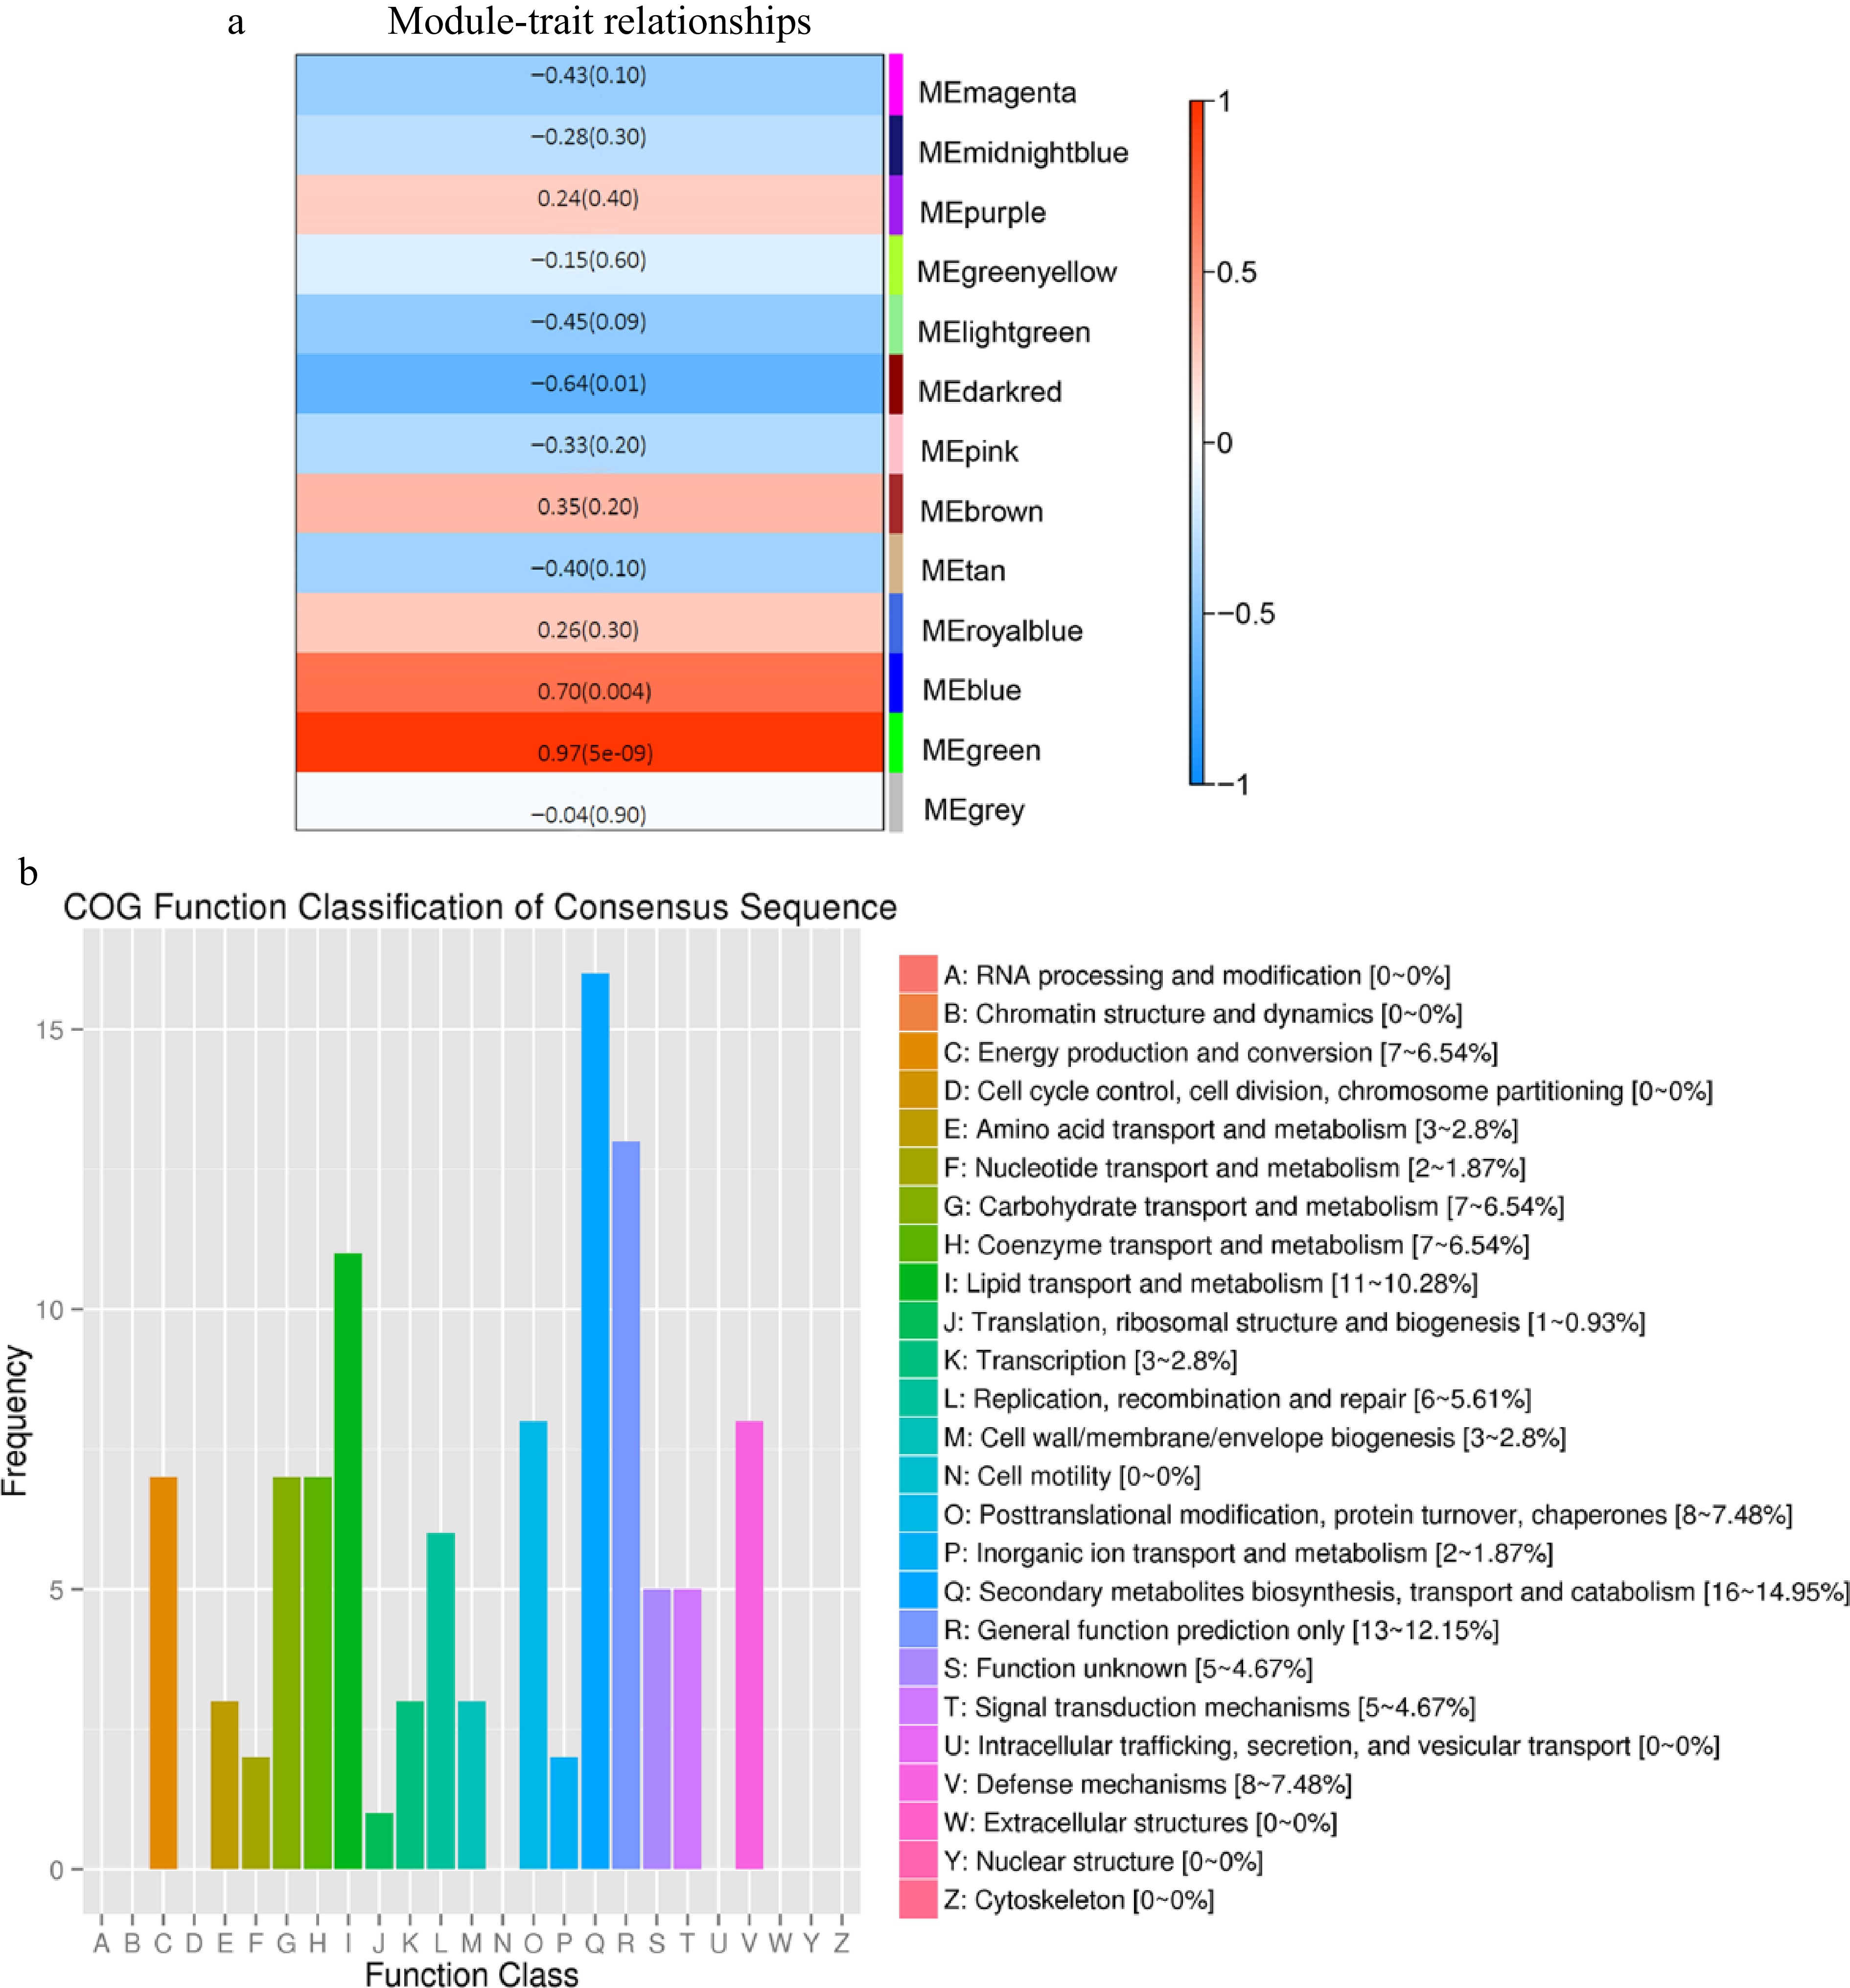
Figure 4.
Analysis of the WGCNA results. (a) Relationships between distinct modules and anthocyanin content. (b) Histogram of COG classification for the genes from MEgreen module.
-
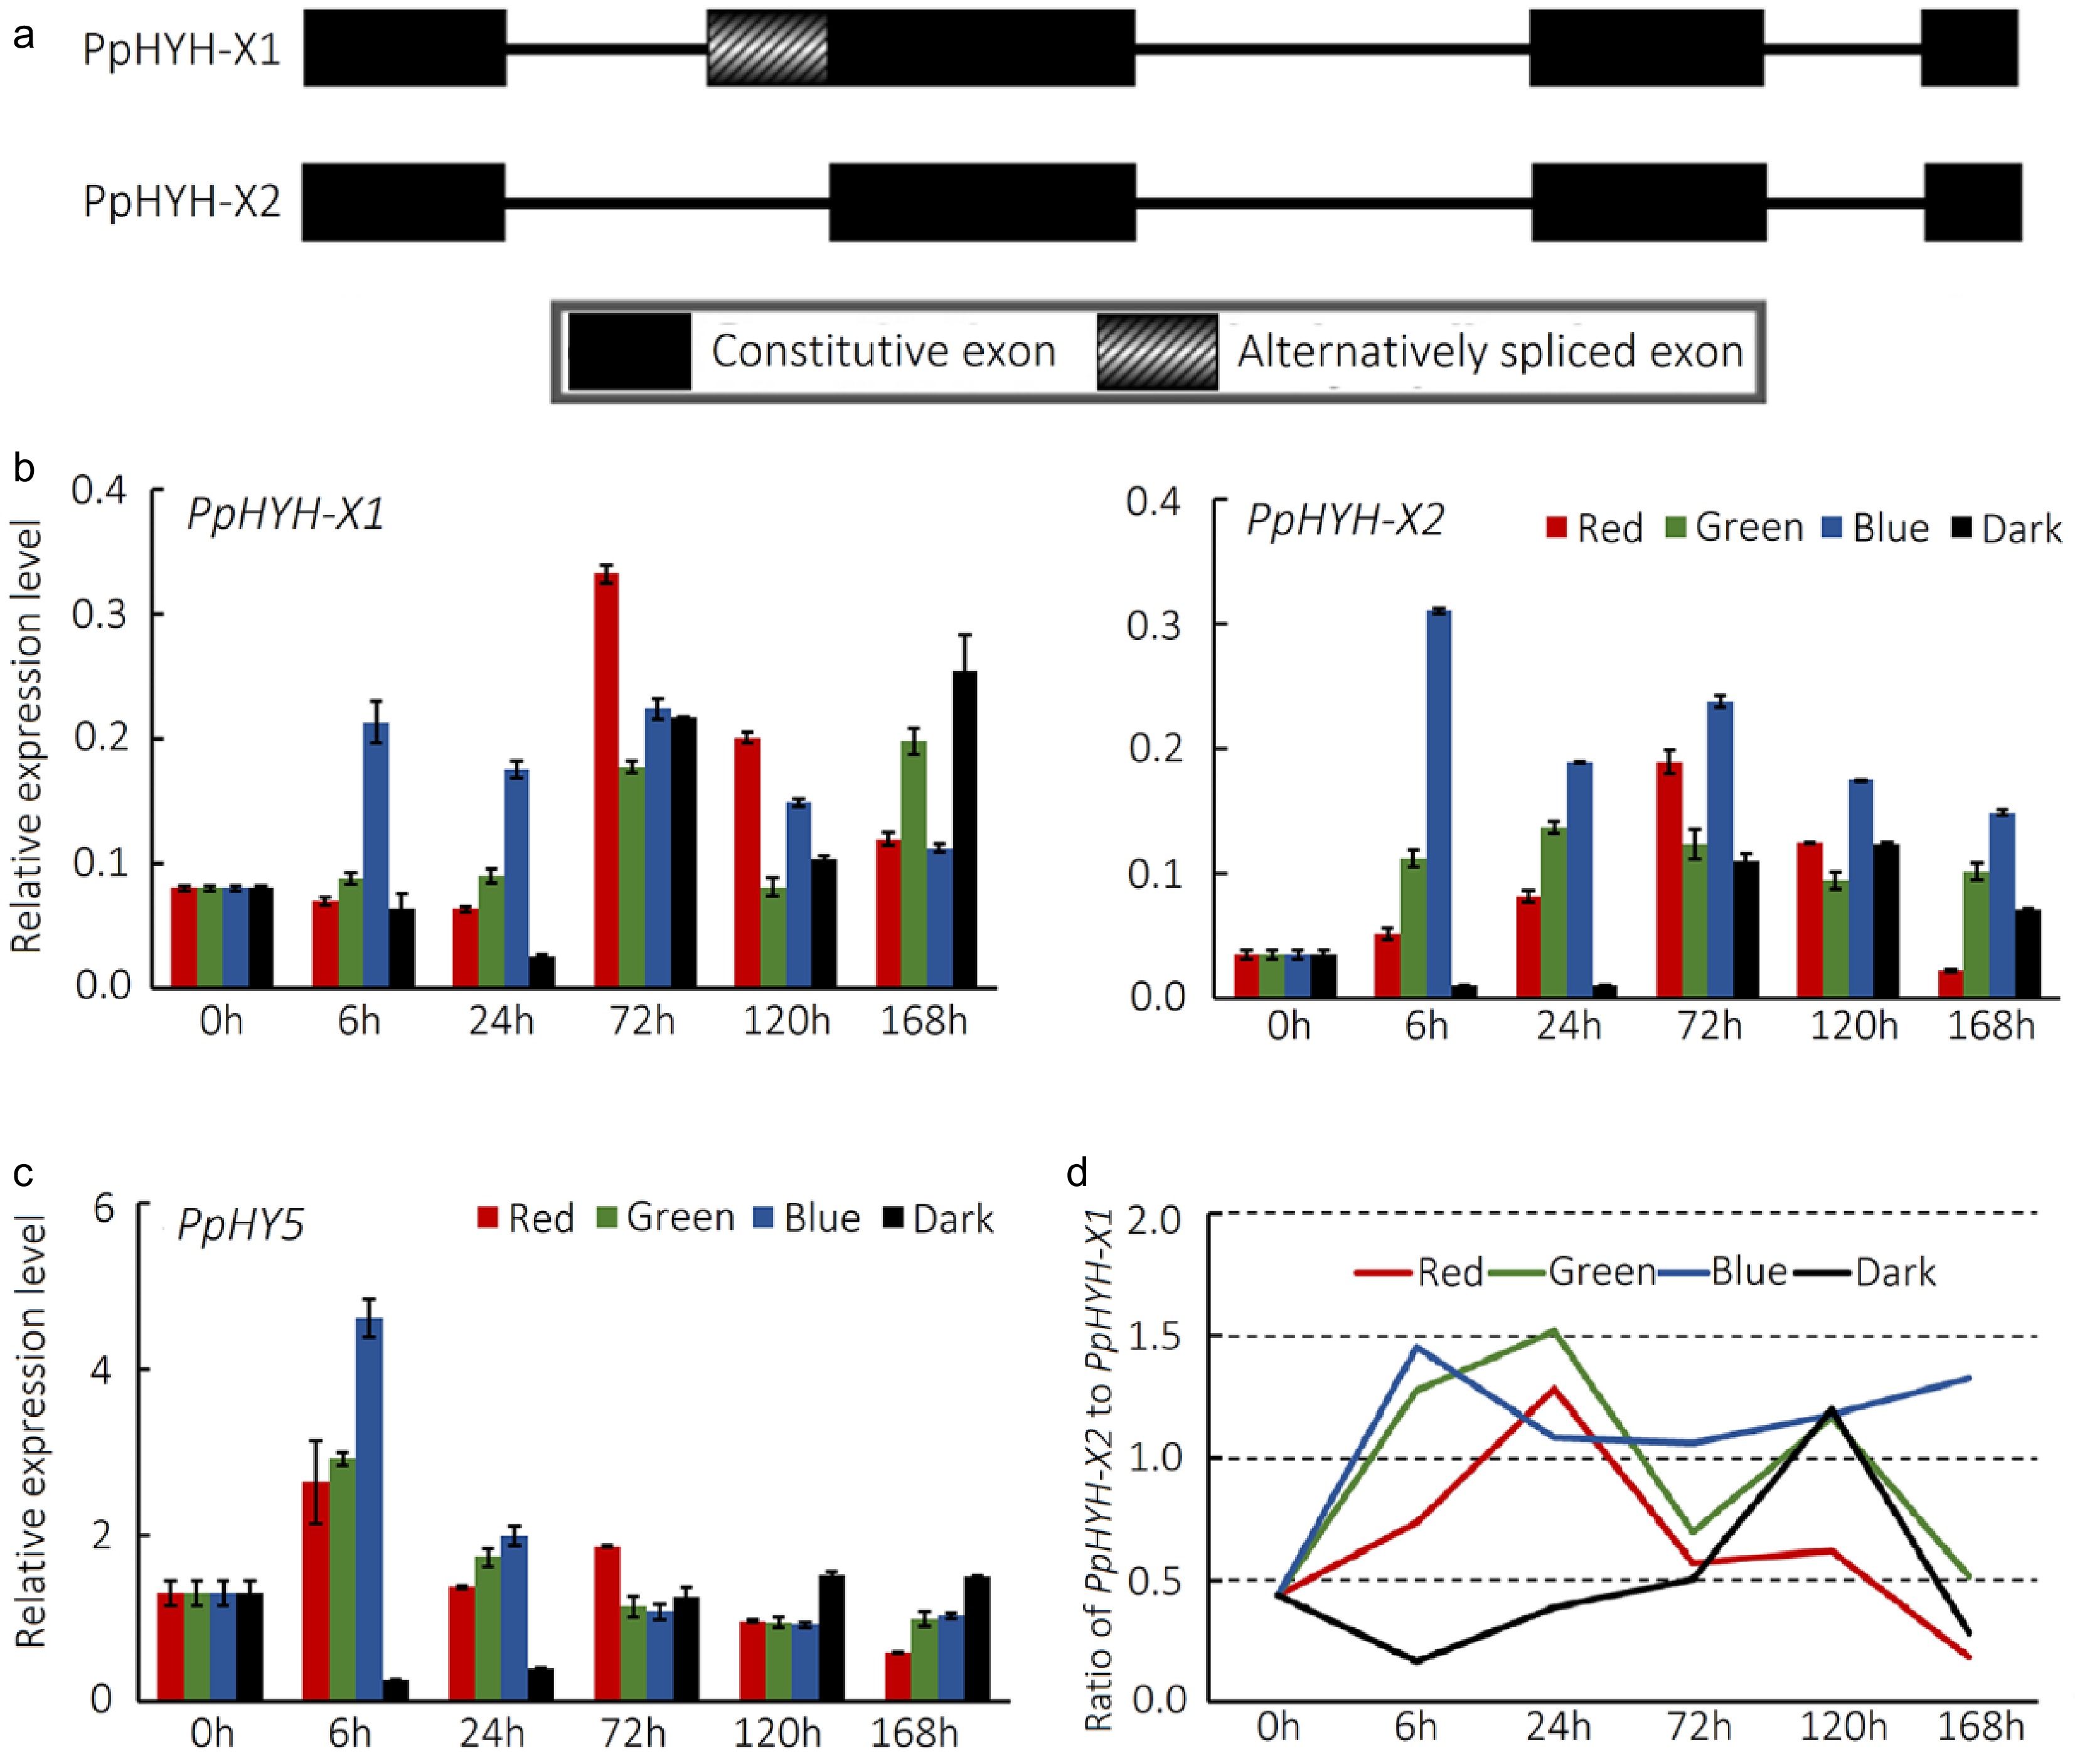
Figure 5.
Expression profiling of PpHYH and PpHY5 genes in peach peel exposed to visible light. (a) Schematic diagram of the PpHYH gene. The solid boxes, striated boxes and solid lines represent constitutive exons, alternatively spliced exons and introns, respectively. (b) Relative expression level of the PpHYH gene treated with red, green and blue light or under dark conditions. (c) Relative expression level of the PpHY5 gene treated with red, green and blue light or under dark conditions. (d) Ratio of PpHYH-X2 to PpHYH-X1 treated with red, green and blue light or under dark conditions. The error bars in (b) and (c) show ± SE of three biological replicates.
-
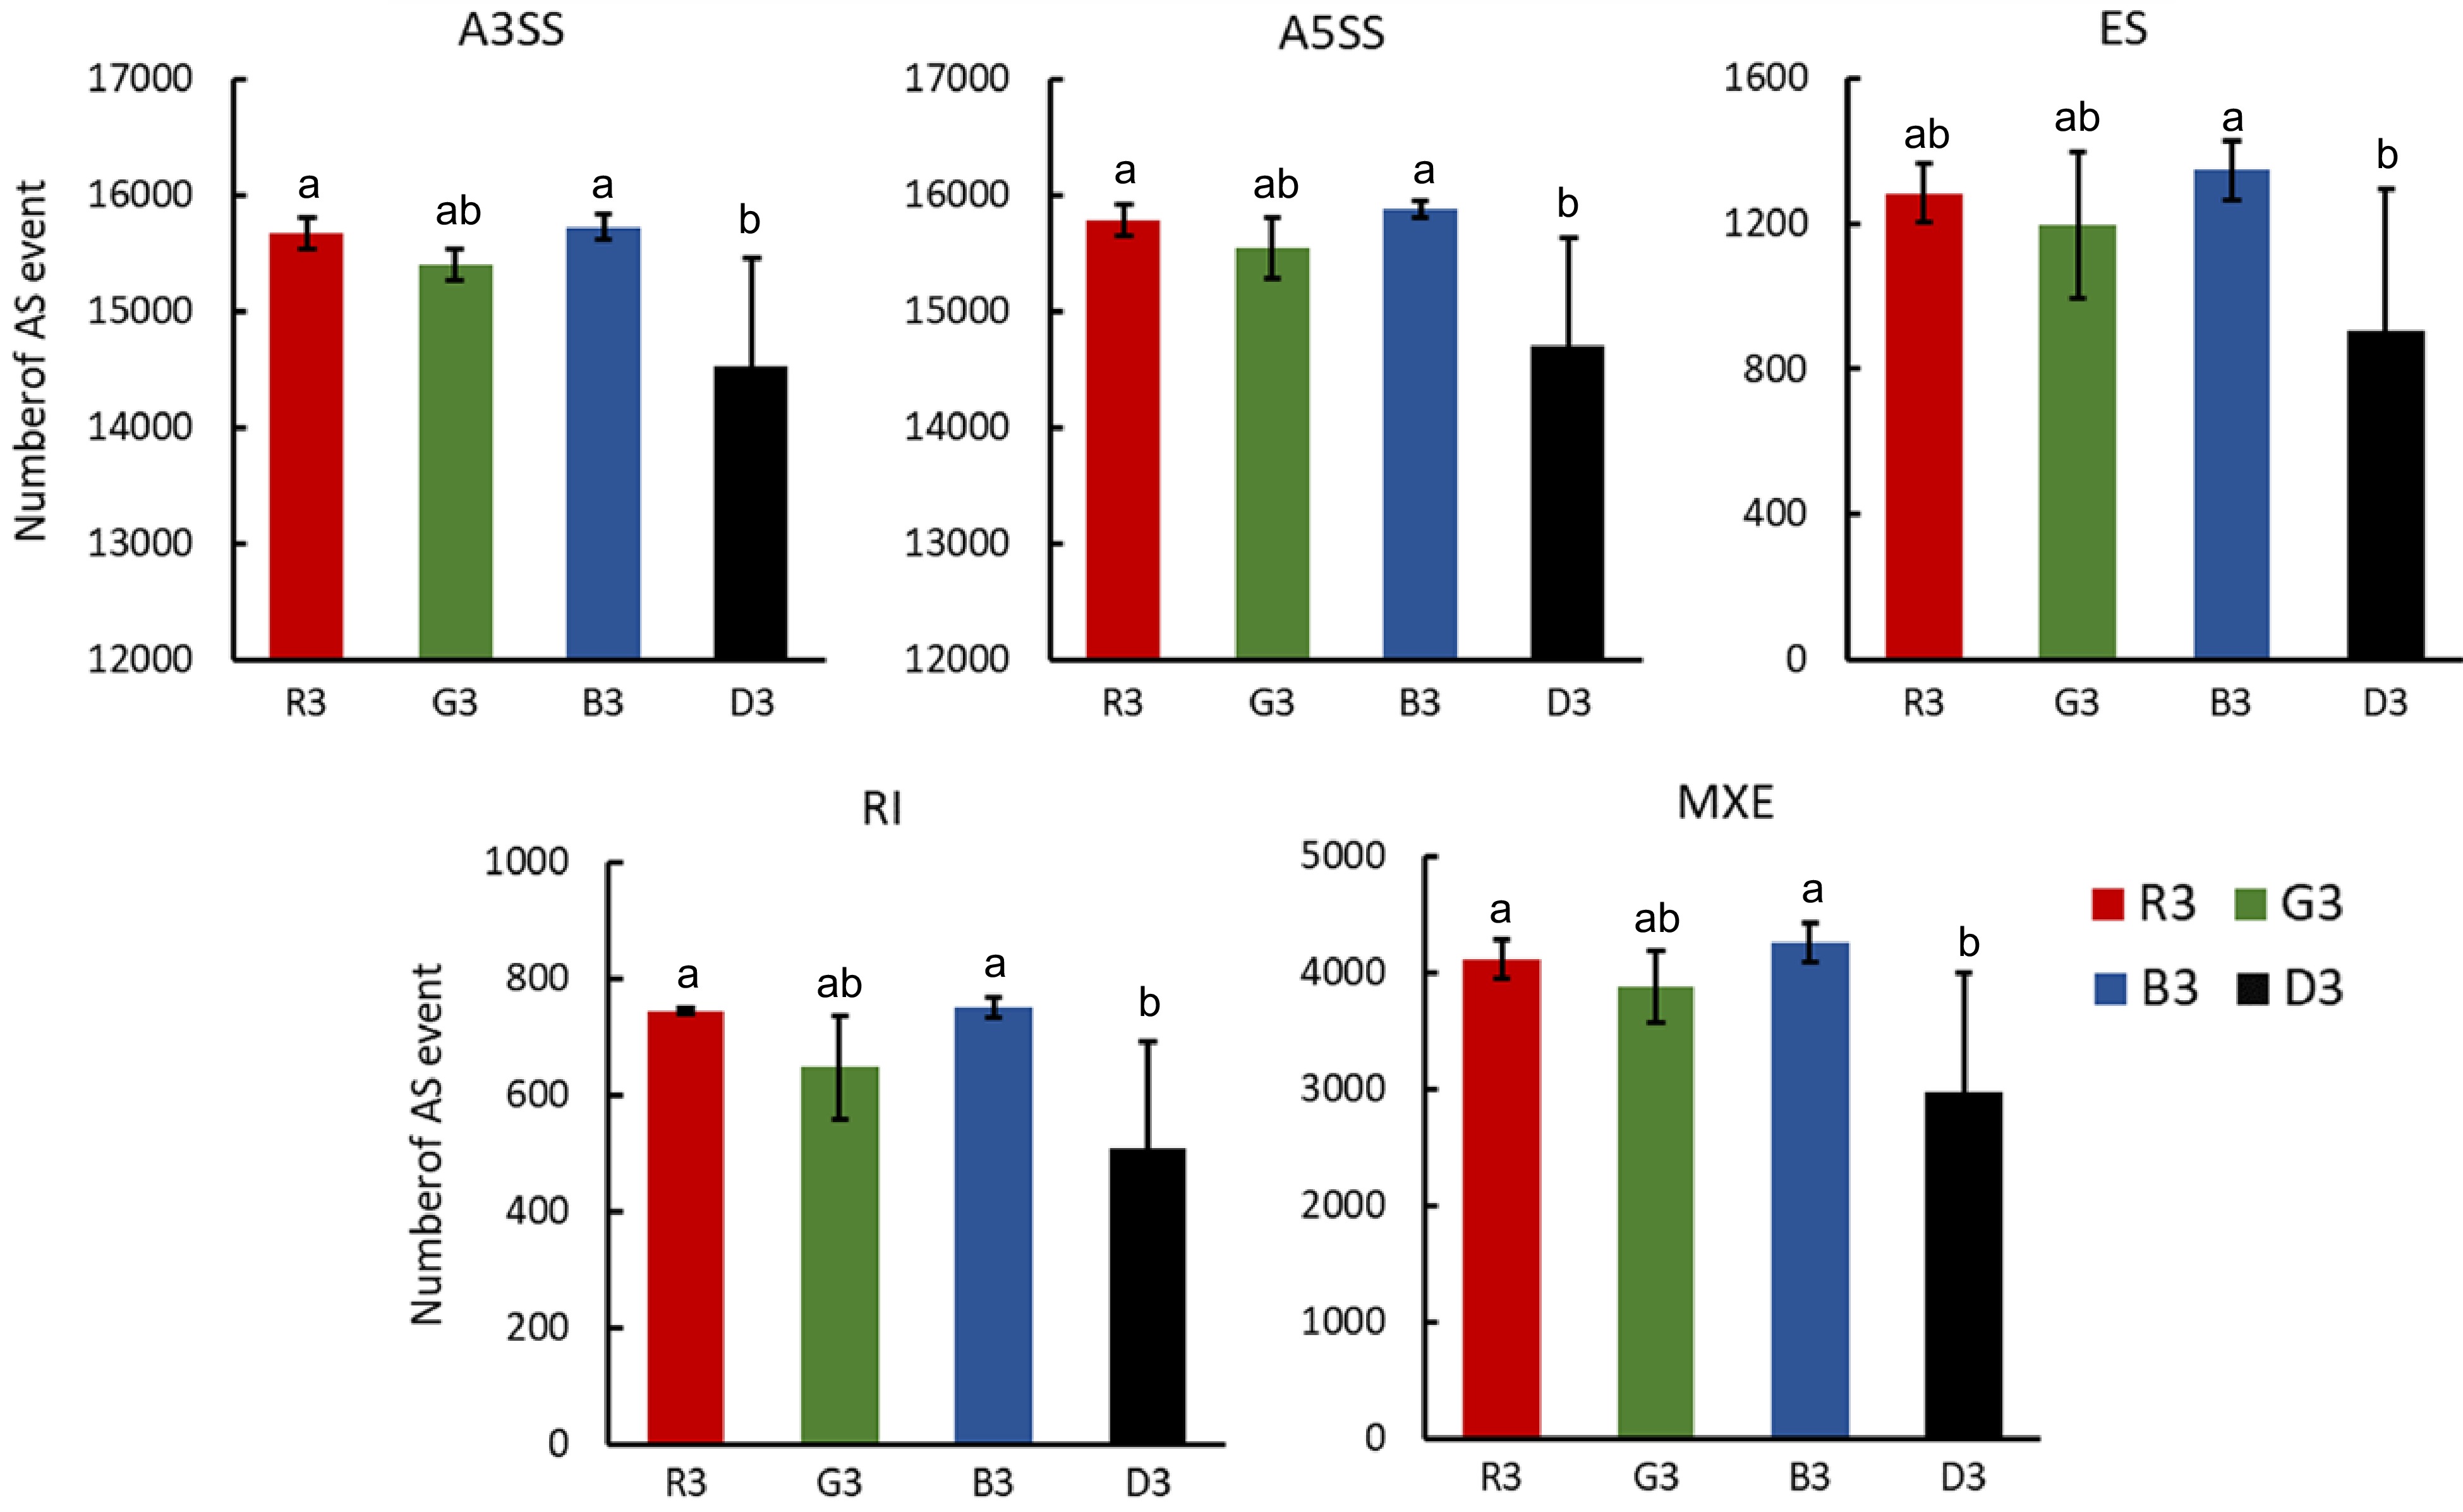
Figure 6.
Analysis of AS events of peel samples treated with red, green and blue light or under dark conditions. A3SS: alternative 3' last exon; A5SS: alternative 5' first exon; ES: exon skipping; RI: retained intron; MXE: mutually exclusive exons. R3, G3, B3 and D3 represent peel samples treated with 72 h of red, green, blue light irradiation and 72 h of treatment in the dark. The error bars show ± SE of three biological replicates, and significant difference at p < 0.05 in is indicted by different lowercase letters based on Fisher's Least Significant Difference (LSD) test.
Figures
(6)
Tables
(0)