


-
Peach (Prunus persica) is one of the economically deciduous fruit trees in the temperate zone. In China, the growing area of peach and its production have increased slightly over the past decade, but the amount of peach consumption and trade has not increased significantly. To promote the sustainable development and growth of the peach industry in China, improvement of fruit quality is an urgent necessity. Skin color is an important trait of peach fruit quality that affects the purchase intention of consumers and the profitability of peach production. Therefore, the management of fruit coloration is an important aspect of the peach production process.
Fruit skin coloration is mainly ascribed to the accumulation of pigments, such as anthocyanin, carotenoid, and chlorophyll[1, 2]. Anthocyanin, a class of flavonoids, has strong antioxidant activity and is involved in preventing a variety of human diseases[3, 4]. The biosynthetic pathway of anthocyanin is conserved in plants. Synthesis of anthocyanin starts from 4-coumaryl COA produced by phenylalanine metabolism and requires a series of enzymes, including chalcone synthase (CHS), chalcone isomerase (CHI), flavanone 3-hydroxylase (F3H), flavonoid 3'-hydroxylase (F3'H), dihydroflavone alcohol-4-reductase (DFR), leucoanthocyanidin dioxygenase (LDOX), and UDP glucose: flavonoid-3-O-glucosyltransferase (UFGT). Anthocyanin is synthesized in the cytoplasm and is then transported into the vacuole with the help of transporters to prevent its degradation. In peach, anthocyanin pathway genes have been excavated[5], GST (Glutathione-S-Transferase) and ABC (ATP Binding Cassette) transporters are involved in vacuolar transport of anthocyanins[6, 7]. The loss-function mutation of PpGST leads to the failure of anthocyanin accumulation in peach fruit[8, 9], while the overexpression of PpABCC1 can increase anthocyanin accumulation in tobacco leaf and peach fruit[10]. The expression of anthocyanin synthesis genes is transcriptionally regulated by the MBW complex formed by MYB, bHLH and WD40 transcription factors (TFs)[11, 12]. Three tandem-arranged R2R3-MYB genes on chromosome 3, PpMYB10.1, PpMYB10.2 and PpMYB10.3, play important roles in regulating anthocyanin synthesis in peach fruit[5, 13]. Several studies indicate that the NAC TF PpBL as well as the bZIP TFs PpHYH and PpHY5 are involved in the regulation of anthocyanin accumulation in peach fruit by activating the expression of the PpMYB10.1 gene[14−16].
Light is an important factor affecting fruit coloration. Numerous studies have found that light is involved in the regulation of anthocyanin accumulation by affecting the expression of MYBs or light-responsive genes. For example, light directly promotes the expression of MdMYB1 gene, resulting in the synthesis of anthocyanin in apple fruit[17]. Light promotes the expression of PyBBX16 that activates the transcription of PyMYB10 to induce anthocyanin accumulation in pear fruit[18]. Upon light induction, FvHY5 and FvbHLH9 are activated to form heterodimer that synergistically promote the expression of FvDFR gene, leading to anthocyanin accumulation in strawberry fruit[19]. In addition, the influence of different light wavelengths on fruit coloration has been reported. Blue light promotes anthocyanin accumulation through both activating the CRY-COP1-HY5 regulation pathway and promoting the expression of Pp4ERF24 and Pp12ERF96 that function as positive regulators of anthocyanin biosynthesis[20, 21]. Ultraviolet B (UVB) promotes the expression of MdBBX22 and MdWRKY72, leading to the accumulation of anthocyanin in apple peel[22, 23]. Although UV light, including UVA, UVB and UVC, is known to promote peach skin coloration[7, 24], the influence of visible light on peach skin coloration remains largely unclear.
In this study, we investigated the impact of red, green and blue light on peach peel coloration. The PpHYH gene, a key regulator involved in light-induced anthocyanin accumulation of peach peel, was variously expressed under different wavelengths of visible light, and its expression was positively correlated with anthocyanin accumulation. Our results provide further evidence that the PpHYH gene, rather than its homolog PpHY5, is the key gene responsible for light-induced anthocyanin pigmentation in the skin of peach fruit.
-
Peach cultivar 'Jinxiu', which accumulates anthocyanins in the peel under the normal light conditions used in this study is maintained in Wuhan Botanical Garden of Chinese Academy of Sciences (Hubei province, China). Bagged fruits were collected at the early ripening stage and divided into four groups. The fruits in each group were treated at ambient temperature (25 °C) with the irradiation of visible light at different wavelengths (700 lux). Fruits incubated in darkness at ambient temperature were used as control. Fruit samples were collected at 0, 6, 24, 72, 120 and 168 h after treatment. The peel tissues were frozen immediately in liquid nitrogen and stored at −80 °C until use. Each treatment contained three biological replicates.
Anthocyanin extraction and measurement
-
The extraction and measurement of anthocyanin was conducted according to our previously reported method[15]. Approximately 100 mg powder sample was added into a 2-mL centrifuge tube and immediately blended with 1 ml of 0.1% hydrochloric acid methanol. The mixture was refrigerated at 4 °C for 24 h and then centrifuged at 13,400 × g for 20 min at room temperature. The supernatants were transferred to a new 2-mL centrifuge tube, and the final volume was adjusted to 2 mL with 0.1% hydrochloric acid methanol. A total of 500 µL of the mixtures was transferred to a 1.5-ml centrifuge tube and then mixed with an equal volume of Buffer A (0.2 M HCl /0.2 M KCl, 67: 25, v/v) or Buffer B (0.2 M NaAc). After incubation in darkness for 4 h, the mixture containing Buffer A or B was subjected to measurement of the absorbance at 510 nm and 700 nm using multifunctional microplate reader (TECAN Infinite M200, Austria). Anthocyanin content was calculated using the following formula: [(A510-A700) Buffer A - (A510-A700) Buffer B]/ g fresh weight (FW). Three biological replicates were performed for each sample.
Total RNA extraction and gene expression analysis
-
Total RNA was extracted using the HiPure HP Plant RNA Mini Kit (Magen, Guangzhou, China). The RNA concentrations of all samples were measured using NanoDrop lite ultraviolet spectrophotometer (ND-LITE-PR, USA) and diluted with sterile double-distilled water (ddH2O) to 500 ng/µl. The cDNA was synthesized using Hifair® III 1st Strand cDNA Synthesis SuperMix for qPCR (Yeasen, Shanghai, China). Gene expression levels were analyzed using quantitative reverse transcriptase real-time PCR (qRT-PCR) with the StepOnePlus™ Real-Time PCR System (7300 Applied Biosystems™, USA). The qRT-PCR reaction system and program were carried out according to our previous report[16]. The PpGADPH gene encoding glyceraldehyde-3-phosphate dehydrogenase was used as an internal reference control[25]. Gene expression levels were calculated using the 2−ΔΔCᴛ method. Each sample contained three biological replicates and the primer sequences for the qRT-PCR are listed in Supplemental Table S1.
Transcriptome sequencing and data analysis
-
Total RNA was extracted from peel tissues of fruit samples with different lighting treatments as mentioned above. Each sample consisted of three biological replicates and each replicate contained three fruits. cDNA libraries and transcriptome sequencing were carried out by the Biomarker Technologies Co, Ltd (Beijing, China) with the Illumina HiSeq™ platform.
Clean data were obtained after removing useless data, including adapter sequence and reads with low quality and then mapped to the peach reference genome[26]. Principal component analysis (PCA) and correlation coefficient for all sequenced samples were analyzed using the BMKCloud platform (www.biocloud.net). Expected number of Fragments Per Kilobase of transcript sequence per Millions base pairs sequenced (FPKM) was used to assess gene expression levels. The program DESeq2 was used to identify differentially expressed genes (DEGs) with the following parameters: false discovery rate (FDR) ≤ 0.01 and fold change (FC) ≤ 0.5 or ≥ 2. The Venn diagrams and Upset plots were performed using the TBtools software[27].
Weighted Gene Co-expression Network Analysis (WGCNA)
-
WGCNA was carried out using the BMKCloud platform (
www.biocloud.net ), and anthocyanin content in peel tissues of fruit samples before light treatment (0 h) and after 72 h treatment with different wavelengths of visible light or without light (darkness) were used as trait data. Gene modules were identified with the following parameters: FPKM ≥ 1 and module similarity threshold ≥ 0.25.Analysis of alternative splicing events
-
Alternative splicing (AS) events for all sequenced samples were analyzed using the rMATS software[28]. Significant differences in AS frequency between different wavelengths of visible light and darkness were evaluated using Student's t-test at p < 0.05.
-
Peach cultivar 'Jinxiu' was selected to investigate the effect of visible light on peach peel coloration. Fruits at the early ripening stage were treated with red, green and blue light or under dark conditions. Patches of pale red pigmentation appeared on the peel of peach fruits at 72 h after irradiation with blue light, and the peel color changed from pale red to dark red after 120 h irradiation with blue light (Fig. 1a). In contrast, no red pigmentation was induced by the irradiation of red and green light although pale red blush occurred on the surface of peach fruits up to 120 h or 168 h of exposure. Moreover, anthocyanin content in fruit peel showed an increase during the light exposure process and blue light had the strongest positive effect on inducing anthocyanin biosynthesis (Fig. 1b). These results demonstrate that blue light, instead of red and green light, could significantly promote anthocyanin accumulation in peach peel.
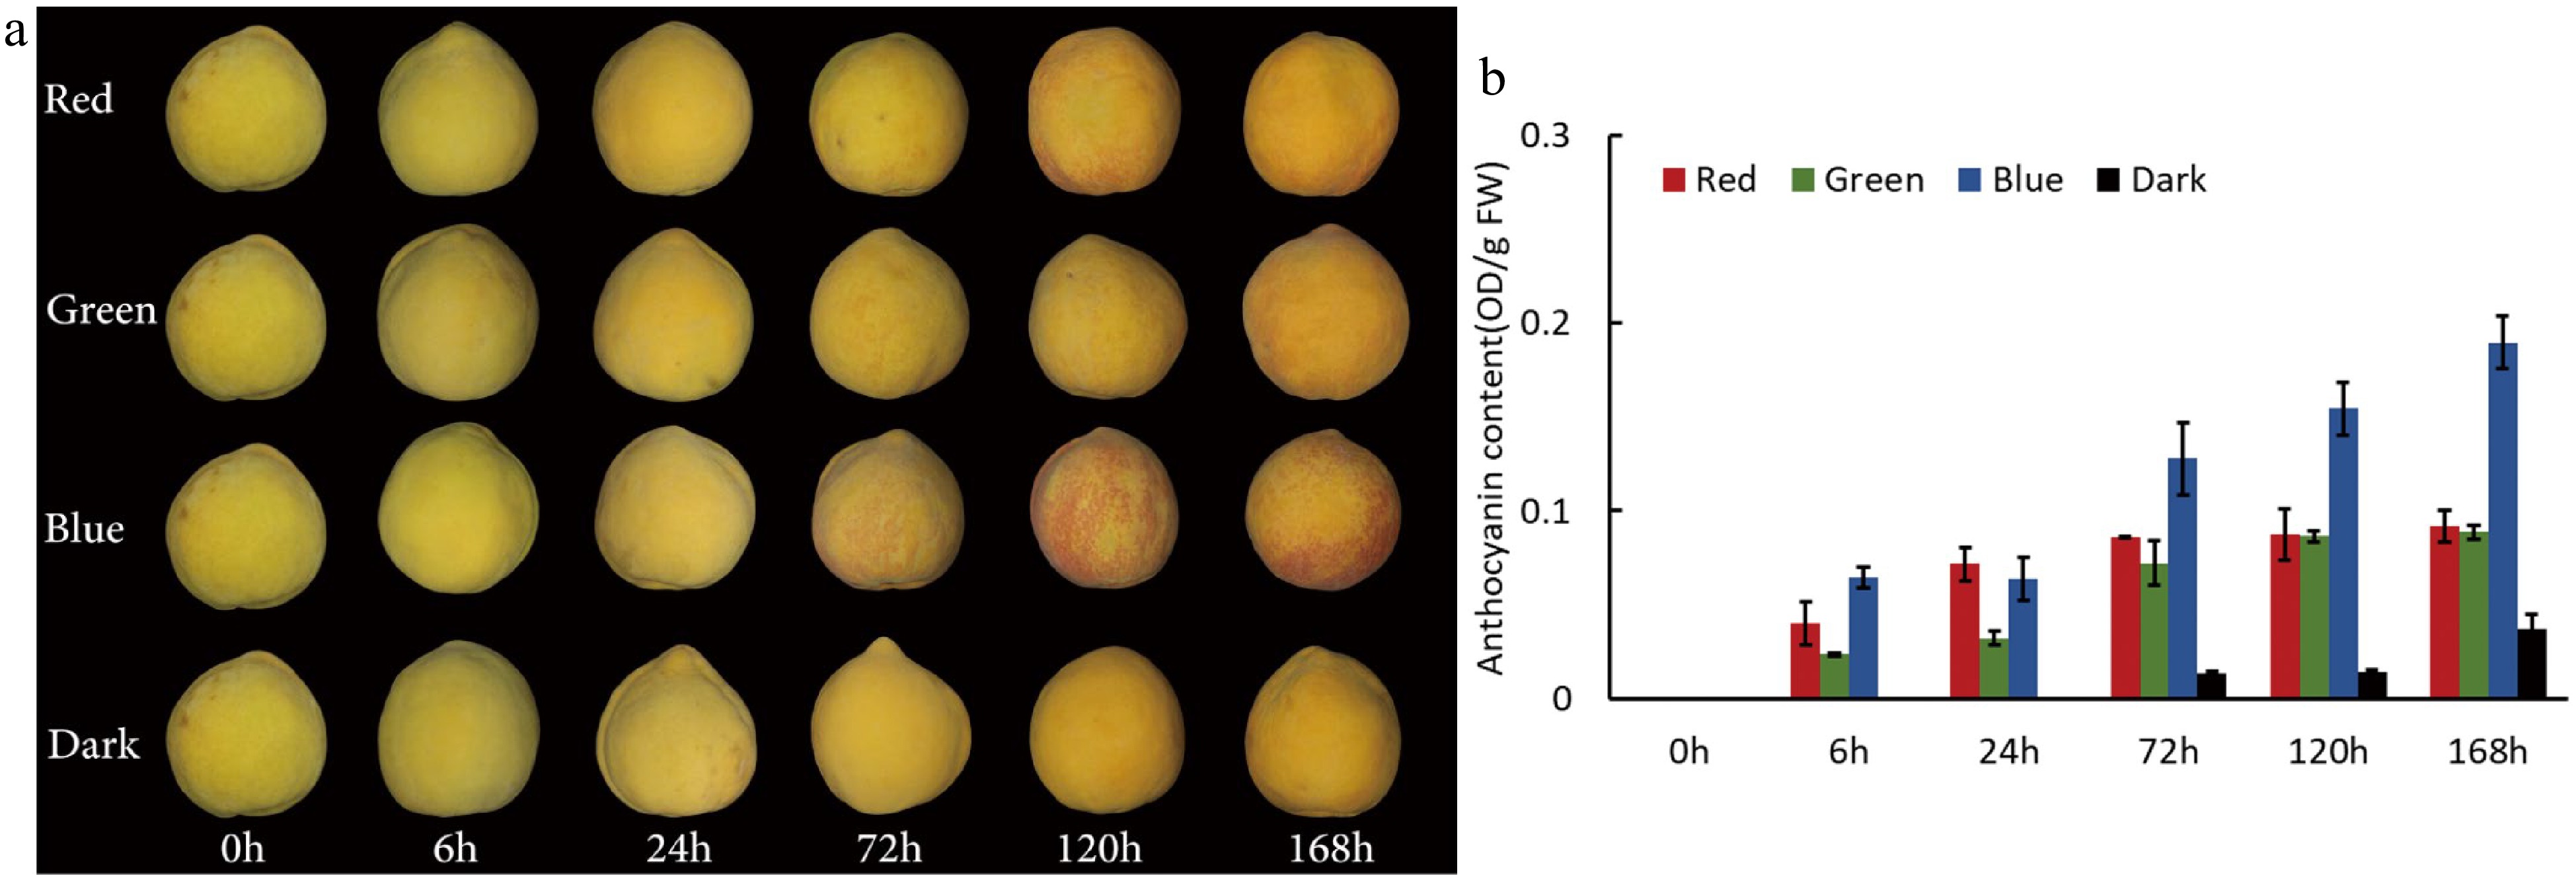
Figure 1.
Effects of visible light with different wavelengths on anthocyanin accumulation in peach peel. (a) The peel coloration of 'Jinxiu' treated with red, green and blue light or under dark conditions. (b) Anthocyanin accumulation of peach peel treated with red, green and blue light or under dark conditions. Error bars in (b) show the standard error (SE) of three biological replicates.
Expression of anthocyanin-related genes in peach peel exposed to visible light with different wavelengths
-
To further clarify the impact of visible light on anthocyanin accumulation in peach peel, we conducted qRT-PCR analysis to investigate the expression of anthocyanin-related genes. The expression of anthocyanin structural genes PpDFR and PpUFGT as well as anthocyanin regulatory gene PpMYB10.1 was significantly up-regulated at 6 h of exposure to red, green or blue light (Fig. 2a & b). However, their expression levels decreased thereafter and reached a plateau. Notably, all three genes exhibited higher activation in fruit peel exposed to blue light than in fruit peel exposed to red or green light. Overall, their expression patterns were in good agreement with the profiles of anthocyanin accumulation in peach peel exposed to visible light. In addition, the expression pattern of PpGST, the pivotal gene responsible for anthocyanin vacuolar transport, exhibited a biphasic curve, with a peak at 6 h of exposure, followed by a decrease and an increase again to a second peak at 72 h of exposure (Fig. 2c). Blue light had the strongest positive effect on the induction of the PpGST expression, with the highest level observed at 72 h of exposure. These findings suggest that anthocyanin accumulation in peach peel exposed to visible light is regulated at the transcriptional level.
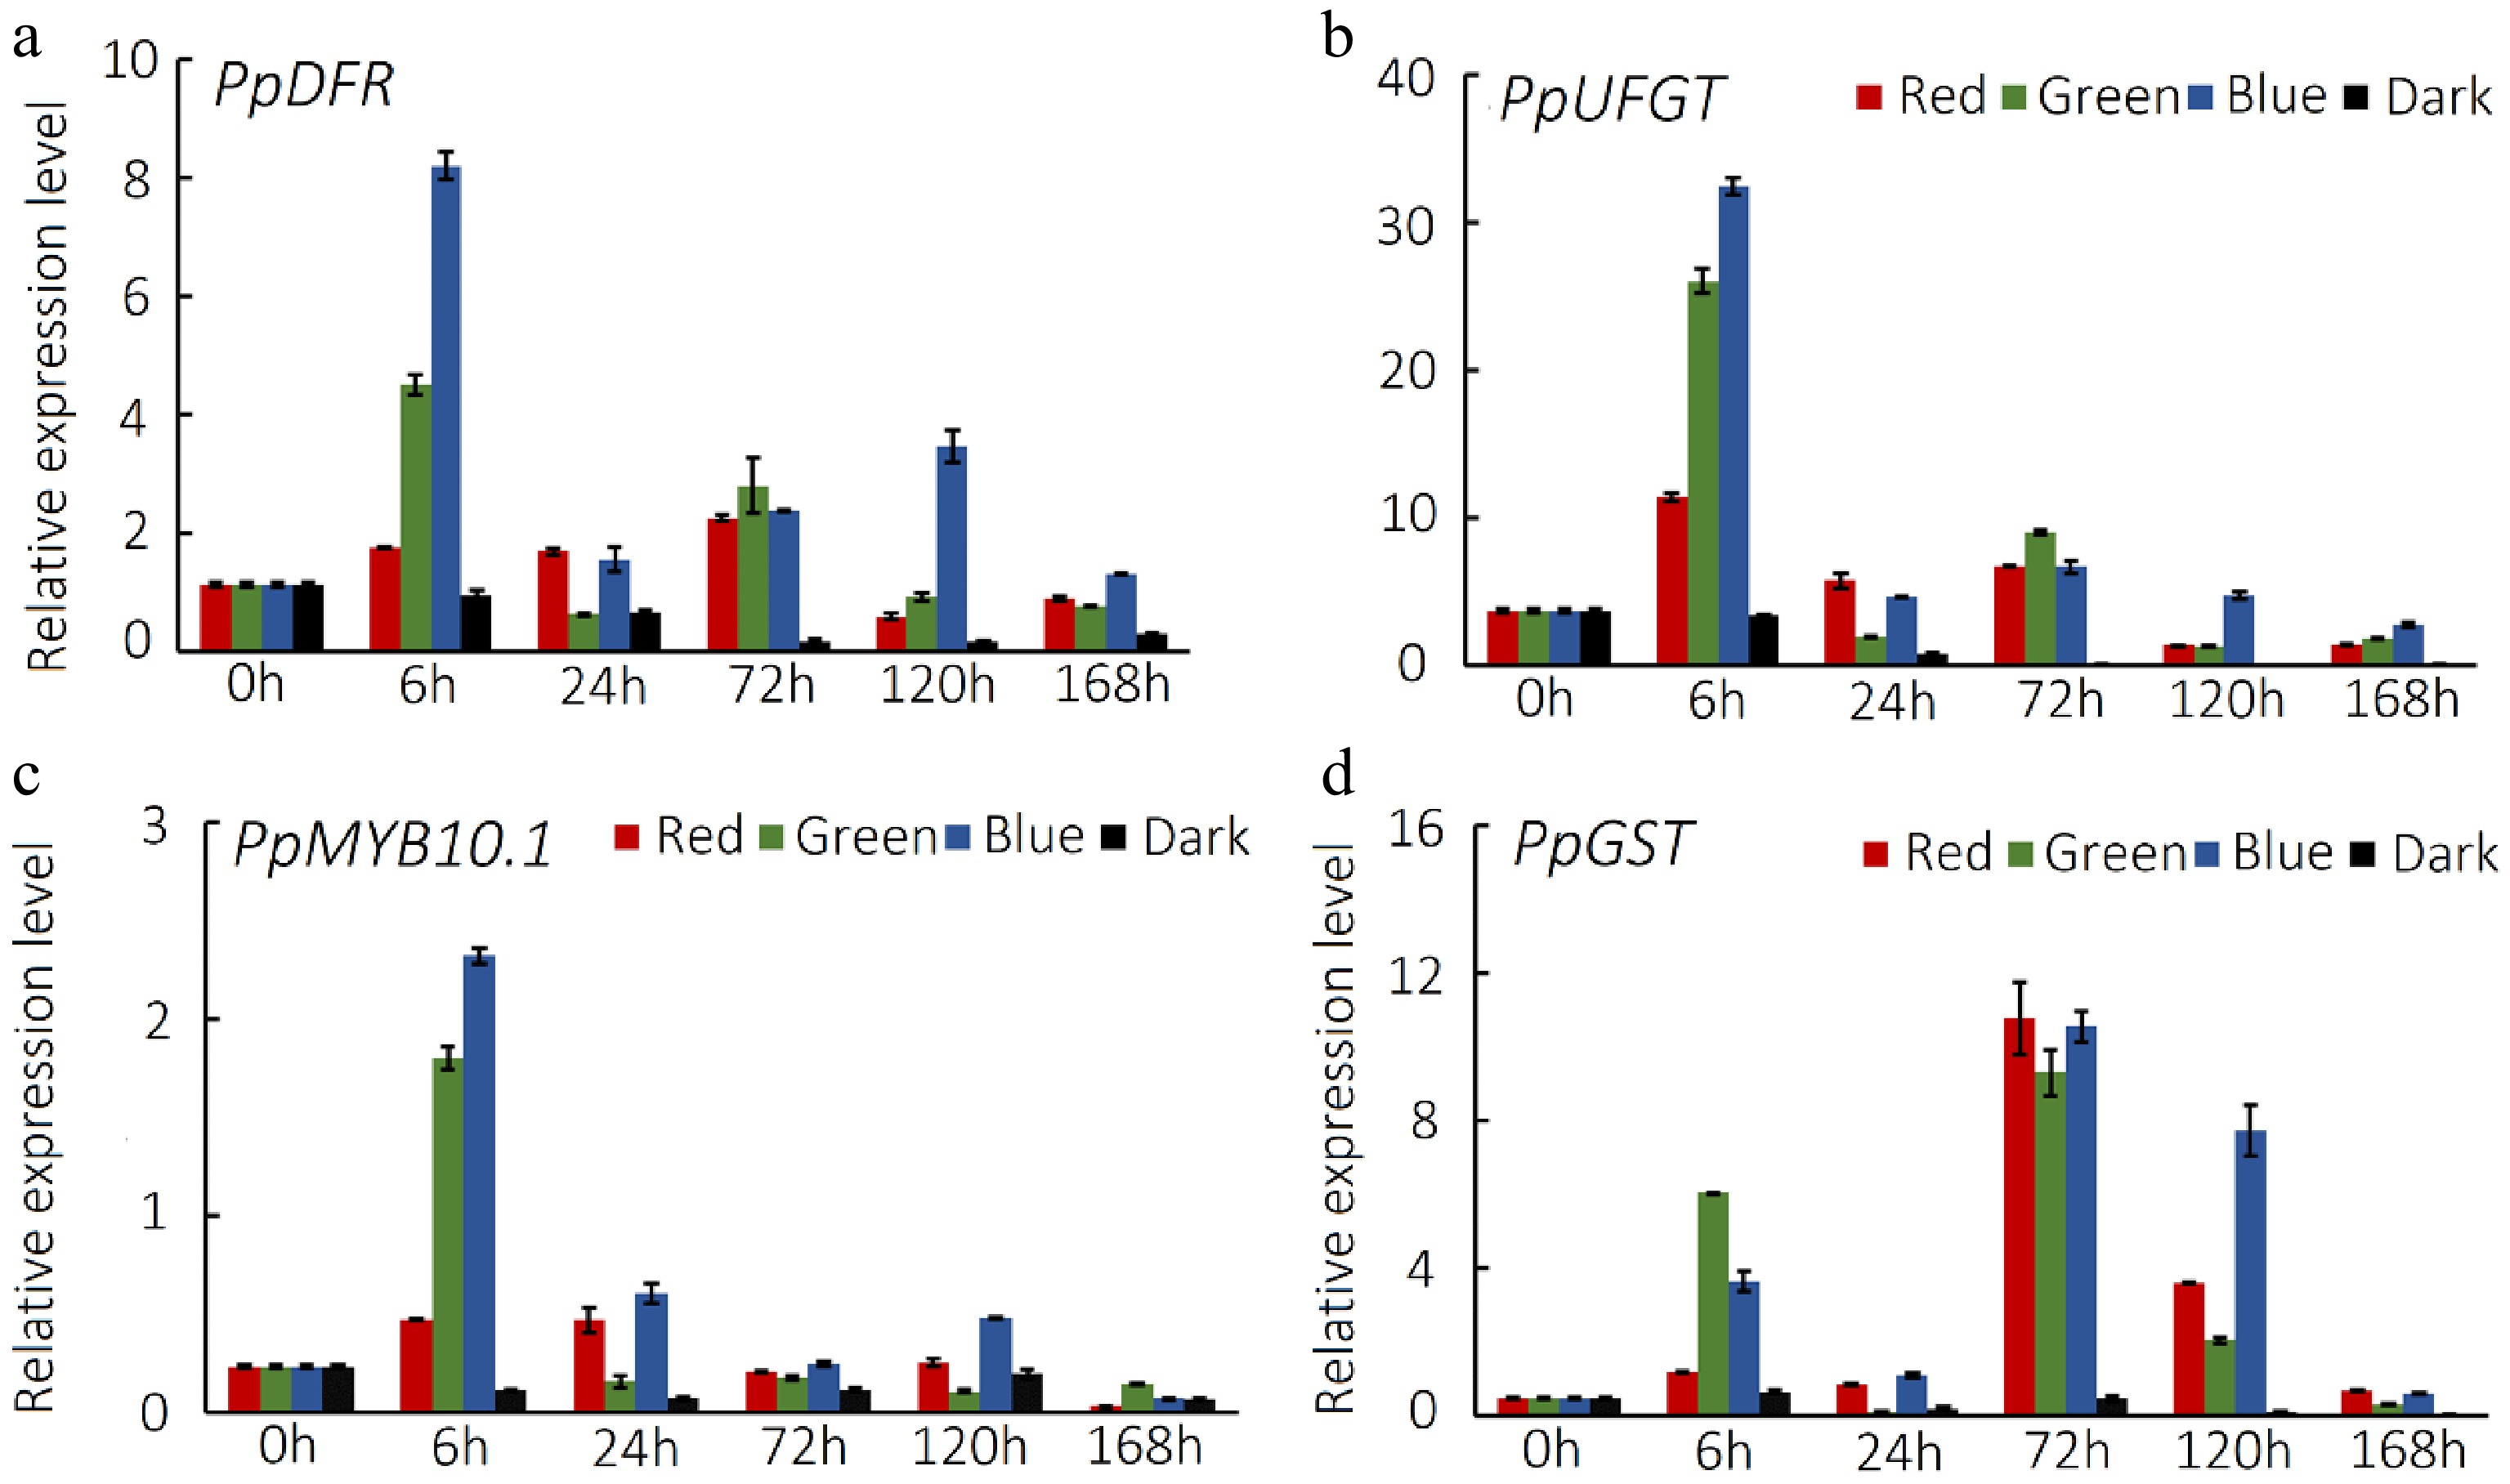
Figure 2.
Expression level of anthocyanin-related genes in peach peel exposed to visible light with different wavelengths. Expression profiles of anthocyanin synthesis genes (a) PpDFR and PpUFGT, (b) regulator gene PpMYB10.1, (c) transporter gene PpGST in peach peel treated with red, green and blue light or under dark conditions. Error bars show the ± SE of three biological replicates.
Identification of candidate gene responsible for visible light-induced anthocyanin accumulation in peach peel
-
To investigate regulatory genes responsible for visible light-induced anthocyanin accumulation in peach peel, we conducted comparative transcriptome analysis between peel samples after 72 h of exposure to visible light and those after 0 and 72 h of treatment in dark. A total of 15 libraries were constructed and sequenced, with Q30 average value of the 15 libraries being more than 91.5% (Supplemental Table S2). The numbers of clean reads for each library ranged from 39.0 to 54.5 million. Over 95.6% of clean reads were mapped to the v2.0 peach genome[26]. Pearson correlation analysis revealed high consistency between biological replicates of samples after 72 h of exposure to red or blue light as well as the sample at 0 h of treatment in dark (Supplemental Fig. S1a). However, relatively low consistency was observed between biological replicates of samples after 72 h of exposure to green light or treatment in the dark. Moreover, principal component analysis (PCA) was conducted and the result was consistent with that of Pearson correlation analysis (Supplemental Fig. S1b).
We initially identified differentially expressed genes (DEGs) between fruit samples treated with 72 h of visible light irradiation and those at 0 and 72 h of treatment in dark. As a result, 744–1,820 DEGs were detected between visible light- and darkness-treated samples (Supplemental Table S3). Since pale red anthocyanin pigmentation occurred in the peel after 72 h of blue light irradiation, we focused on genes differently expressed between fruit samples treated with 72 h of blue light irradiation (B3) and those at 0 (D0) and 72 h (D3) of treatment in the dark. Totally, 583 and 814 DEGs were up-regulated in the D0 versus B3 and D3 versus B3 comparisons, respectively, with 246 commonly up-regulated (Supplemental Fig. S2a). Likewise, 343 and 1,006 DEGs were down-regulated in the D0 versus B3 and D3 versus B3 comparisons, respectively, with 92 commonly up-regulated. The Clusters of Orthologous Groups (COG) analysis revealed that the majority of commonly up- and down-regulated DEGs were enriched in carbohydrate transport and metabolism, as well as energy production and conversion pathways (Supplemental Fig. S2b). Of the 246 commonly up-regulated DEGs (Supplemental Table S4), three, i.e. PpHYH (Prupe.1G208500), PpMYC2 (Prupe.2G195300) and PpMYB29 (Prupe.8G270000), belonged to transcription factors (TFs). Similarly, three TFs, PpERF053 (Prupe.3G157100), PpRAV2 (Prupe.3G240000) and PpJUB (Prupe.4G106100), were included in the 92 commonly down-regulated DEGs.
In addition to blue light, red and green light could also induce anthocyanin accumulation in peach peel. Thus, we used an Upset plot to identify common DEGs in response to red, green, and blue light. As a result, 244 and 126 DEGs were commonly up-regulated and down-regulated, respectively, in the peel tissues treated with 72h of red light irradiation (R3) relative to the D0 and D3 samples (Fig 3a & b). Likewise, 98 and 29 DEGs were commonly up-regulated and down-regulated, respectively, in the peel tissues treated with 72 h of green irradiation (G3) relative to the D0 and D3 samples. Overall, 65 and 13 were commonly up-regulated and down-regulated, respectively, in the B3 versus D0, B3 versus D3, R3 versus D0, R3 versus D3, G3 versus D0, and G3 versus D3 comparisons. Of the 65 commonly up-regulated DEGs, only one TF PpHYH was identified (Supplemental Table S5). However, no TFs were found in the 13 commonly down-regulated DEGs.
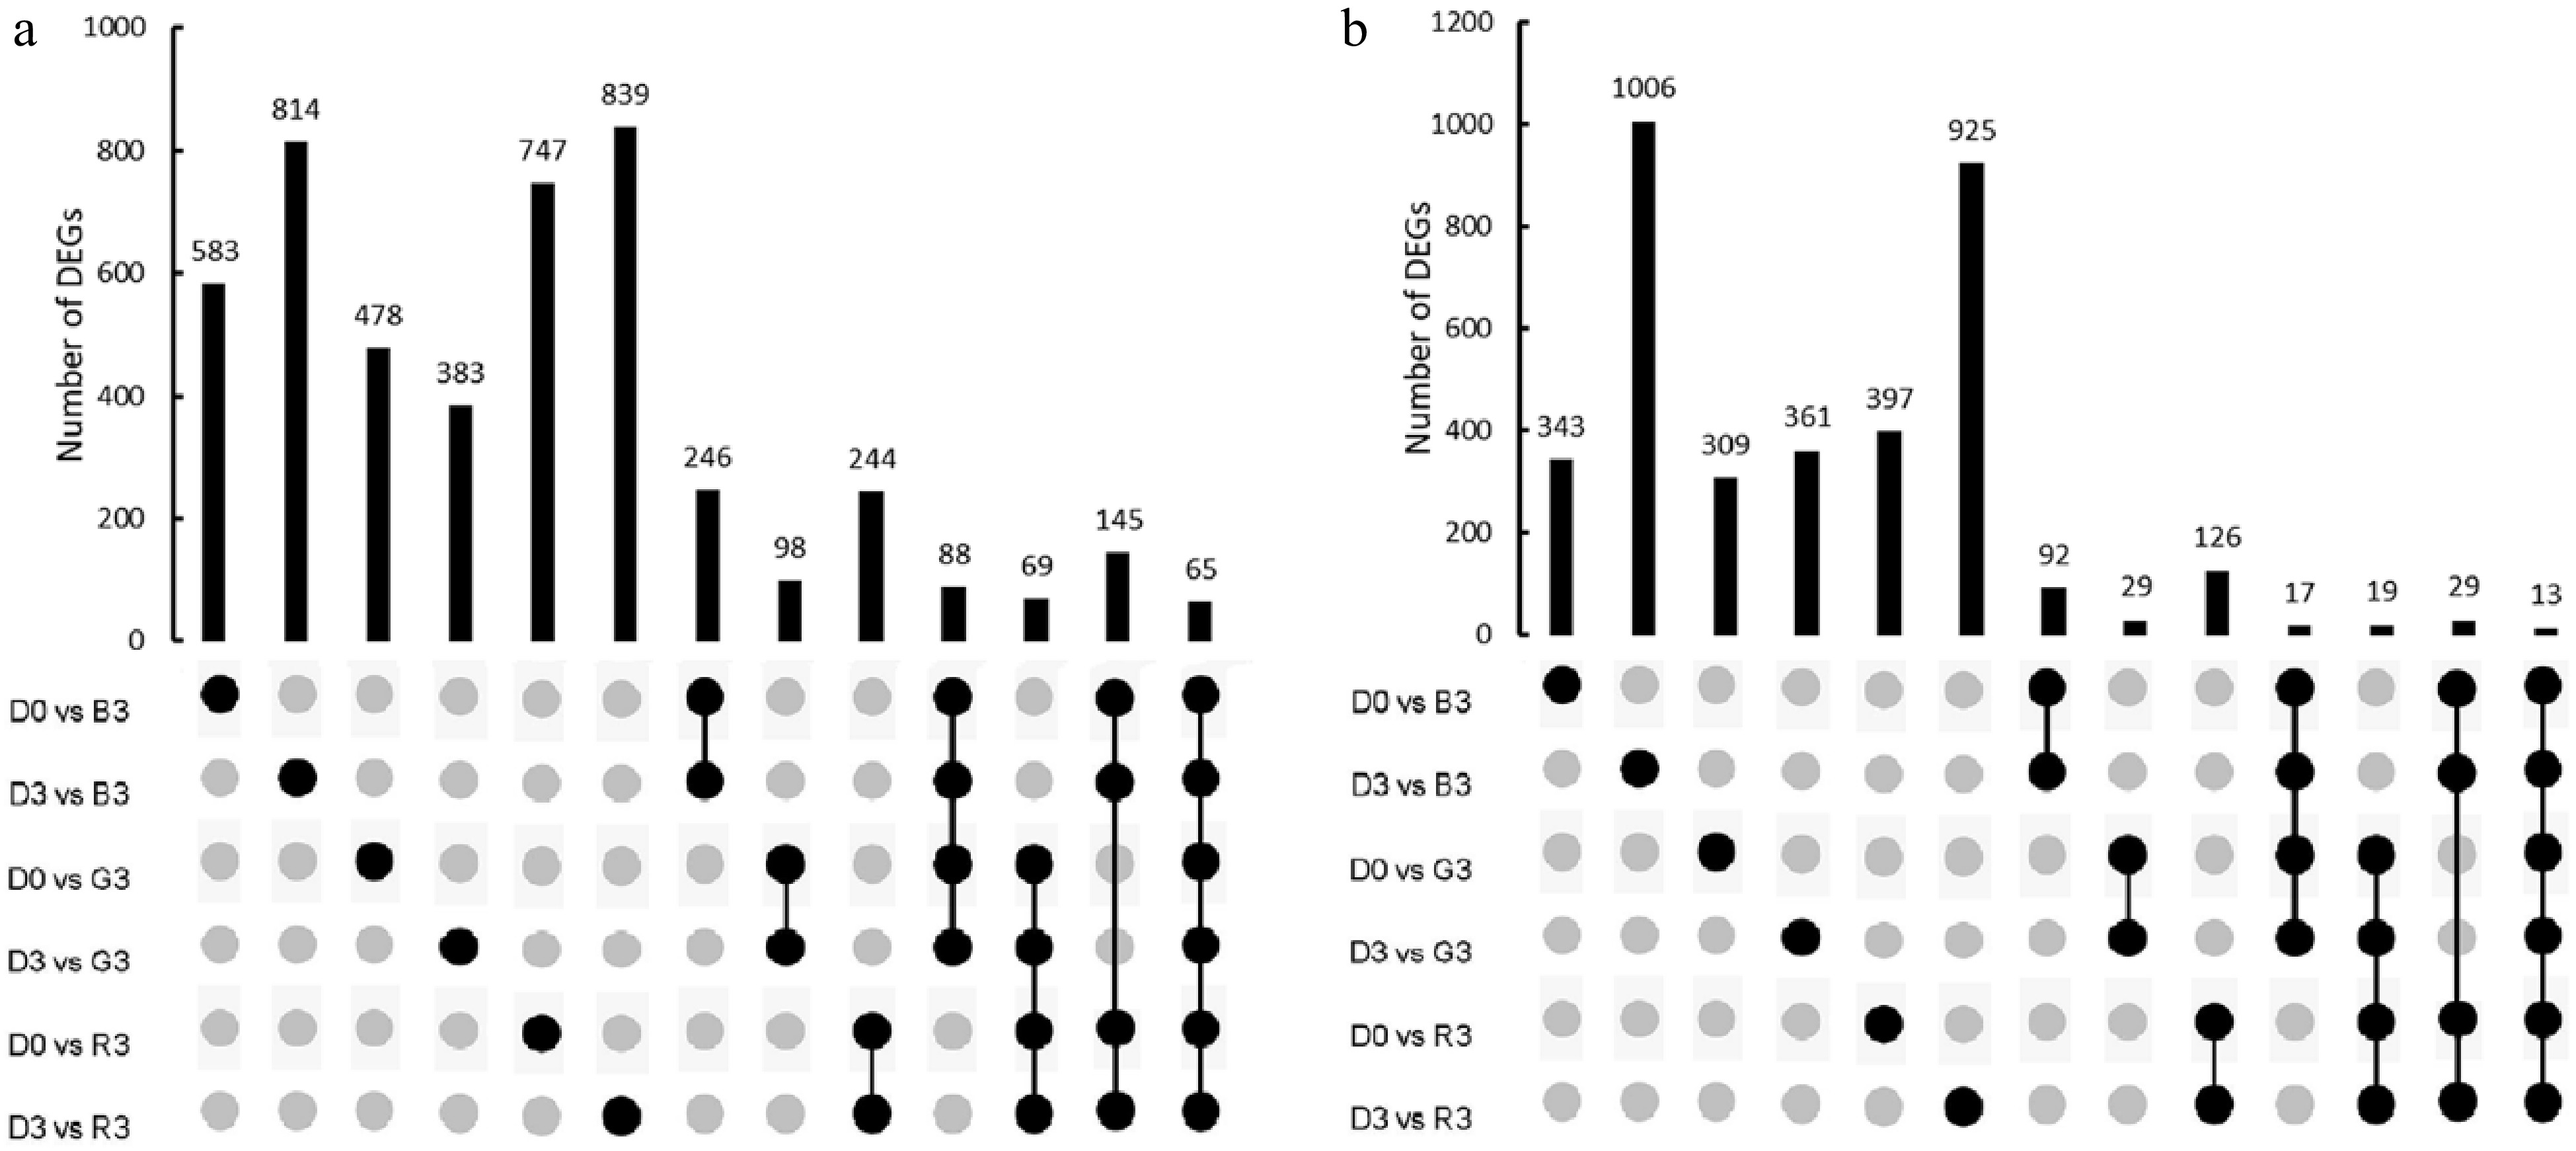
Figure 3.
Analysis of DEGs in peach peel samples treated with red, green and blue light irradiation. (a) The number of up-regulated genes in response to red, green, and blue light. (b) The number of down-regulated genes in response to red, green, and blue light.
Finally, WGCNA analysis was performed by setting anthocyanin content under visible light with different wavelengths as the sole trait data to detect the modules of co-expressed genes. The WGCNA analysis yielded 13 distinct modules, and one termed MEgreen exhibited the highest correlation between gene expression and anthocyanin content (r = 0.97) (Fig. 4a). The MEgreen module consisted of 180 genes, including three TFs, PpHYH, PpPCL1 (Prupe.6G071400), and PpMYC2 (Supplemental Table S6). COG analysis showed that the genes from the MEgreen module were primarily involved in secondary metabolite biosynthesis, lipid transport and metabolism, and defense mechanisms (Fig. 4b).
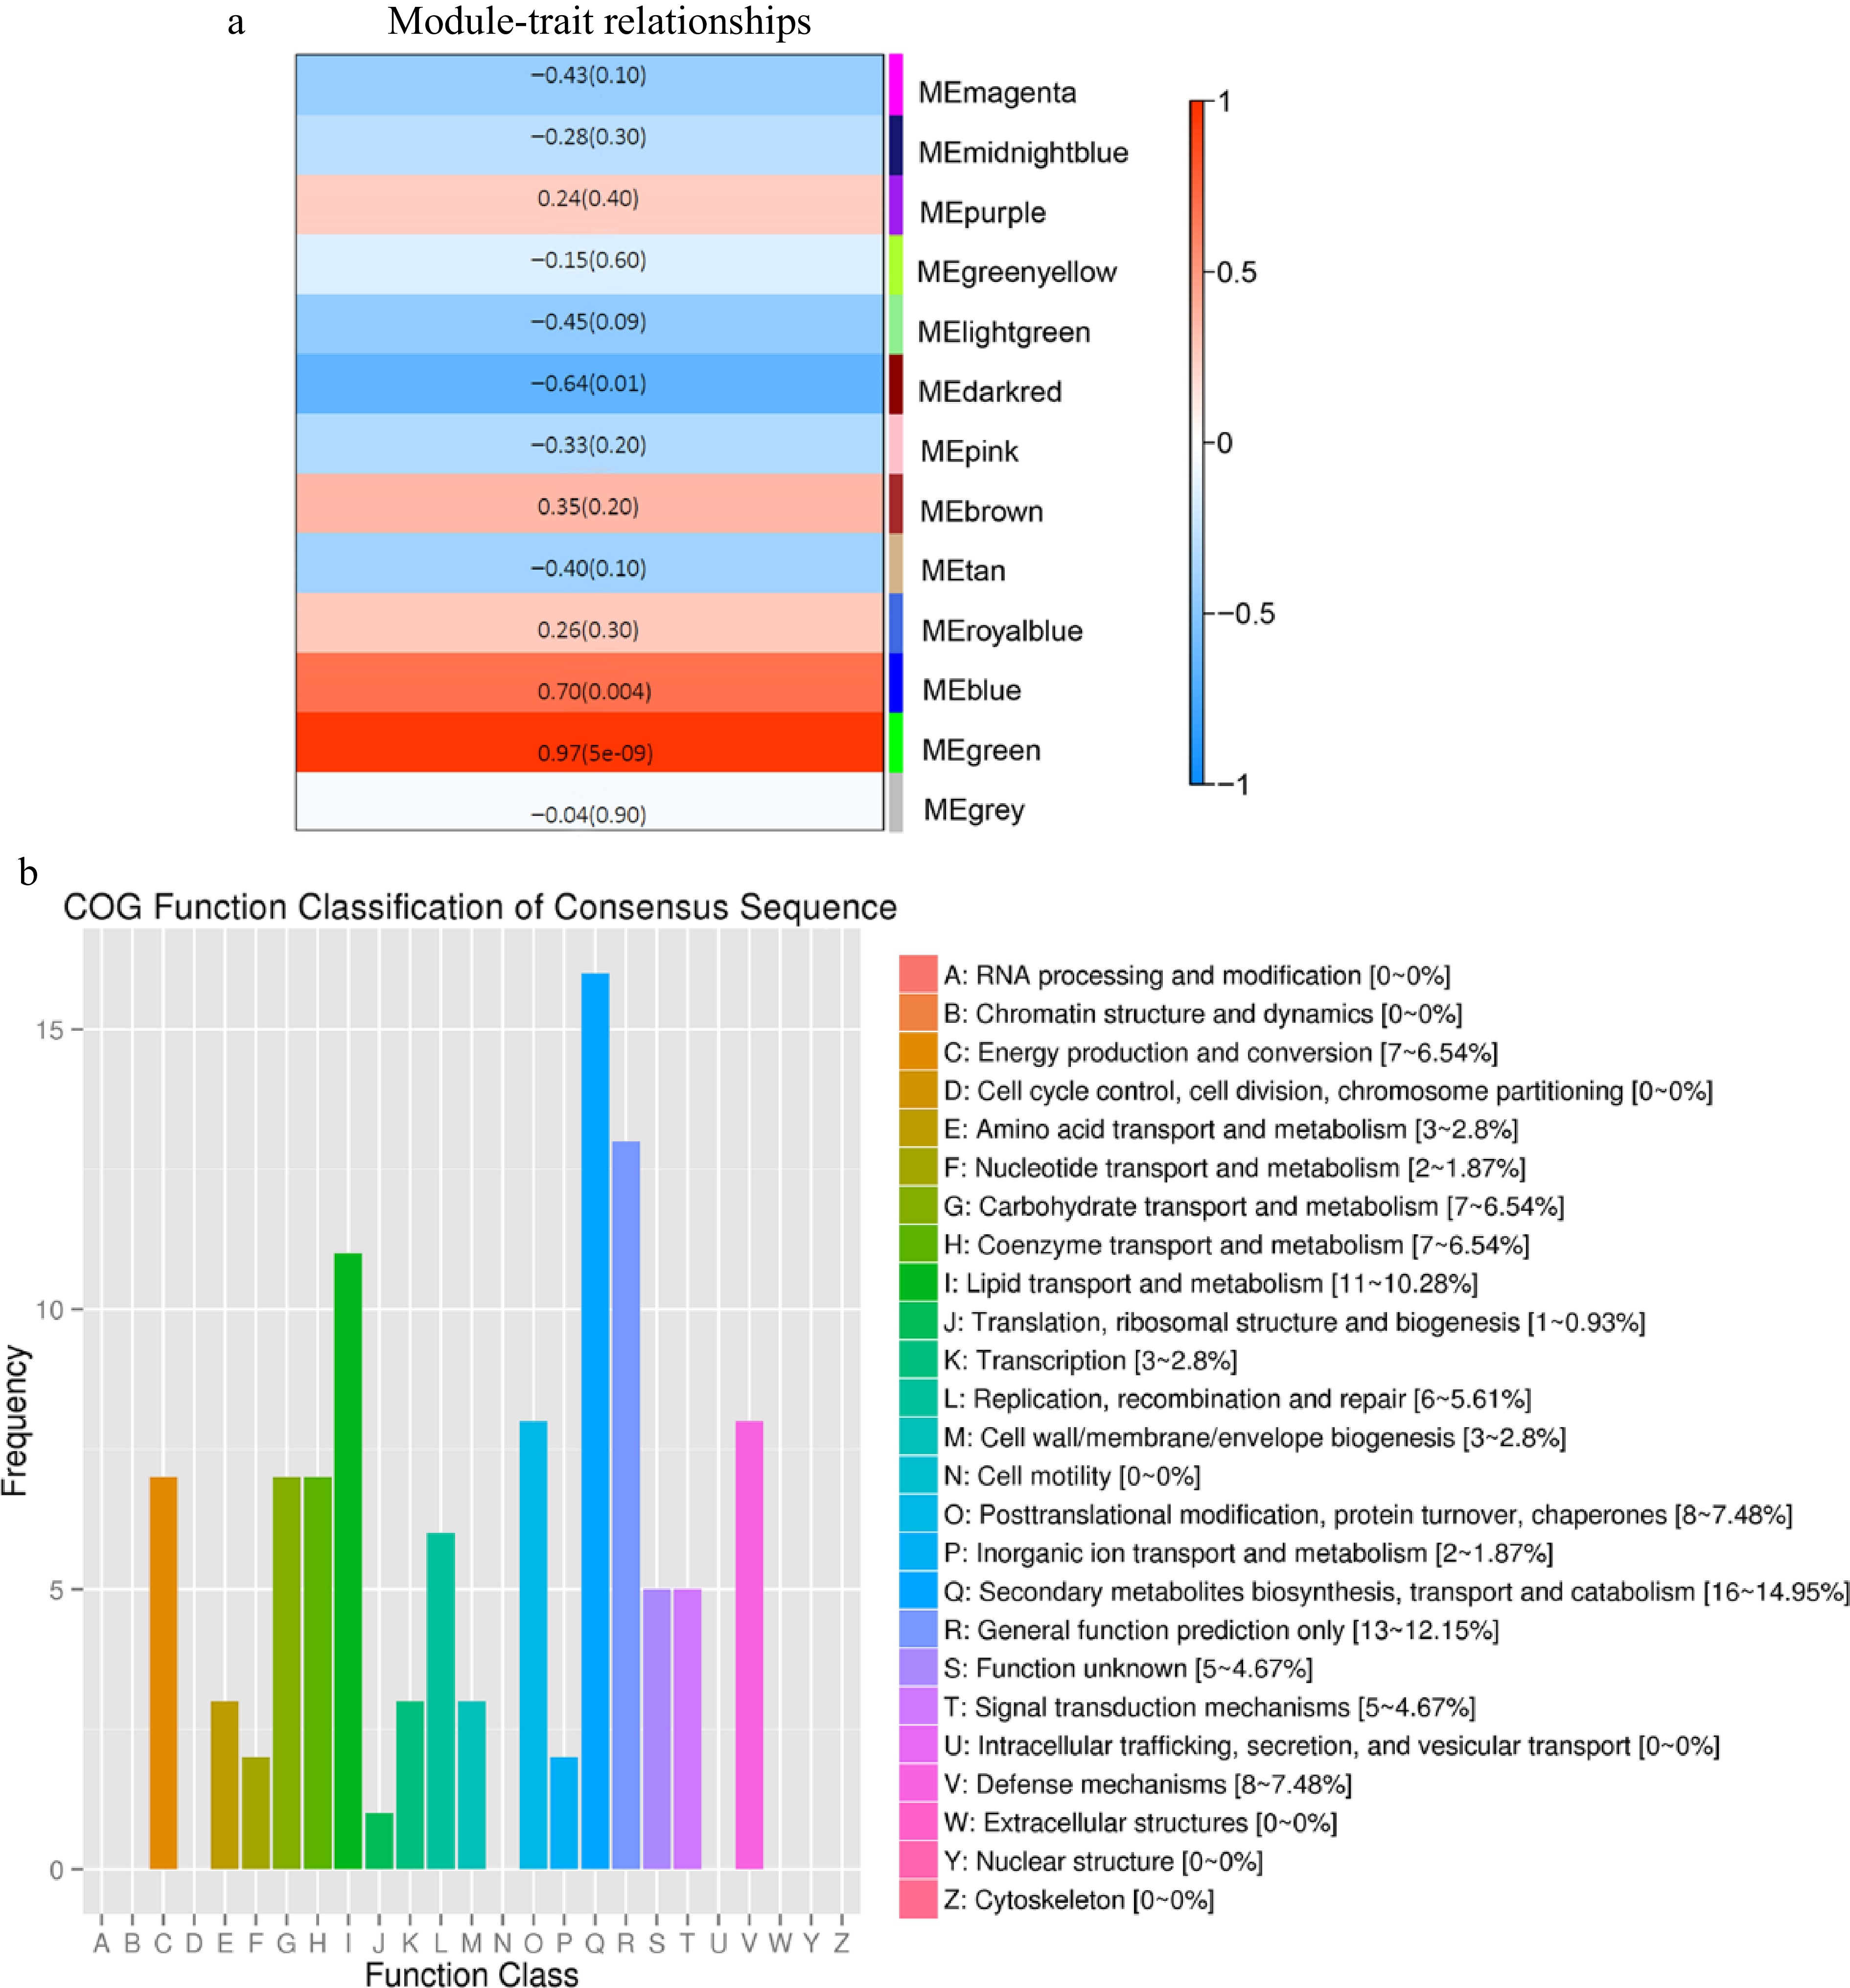
Figure 4.
Analysis of the WGCNA results. (a) Relationships between distinct modules and anthocyanin content. (b) Histogram of COG classification for the genes from MEgreen module.
Taking the results of WGCNA and DEGs analysis together, we proposed that PpHYH is a good candidate responsible for visible light-induced anthocyanin accumulation in peach peel.
Expression profiling of two alternative splicing variants of PpHYH in peach peel exposed to visible light
-
Our recent study reported the important role of PpHYH which has two alternative splicing variants PpHYH-X1 and PpHYH-X2 in light-induced anthocyanin accumulation in peach peel[15]. PpHYH-X2 lacks an 84-bp fragment in the second exon when compared to PpHYH-X1 (Fig. 5a). The transcription of PpHYH-X1 and PpHYH-X2 was highly induced at 6 h of exposure to blue light, and then their expression levels remained relatively high (Fig. 5b). Whereas, the expression levels of PpHYH-X1 and PpHYH-X2 showed an obvious increase at 72 h and 24 h of exposure to red or green light, respectively. To further explore the relationship between the expression of PpHYH-X2 gene and anthocyanin accumulation, we conducted Pearson's correlation analysis. The expression of PpHYH-X2 showed higher correlation with anthocyanin content than that of PpHYH-X1. Moreover, there was a positive correlation between the expression of PpHYH-X2 and anthocyanin-related genes, including PpDFR, PpUFGT, PpGST and PpMYB10.1 (Supplemental Fig. S3).
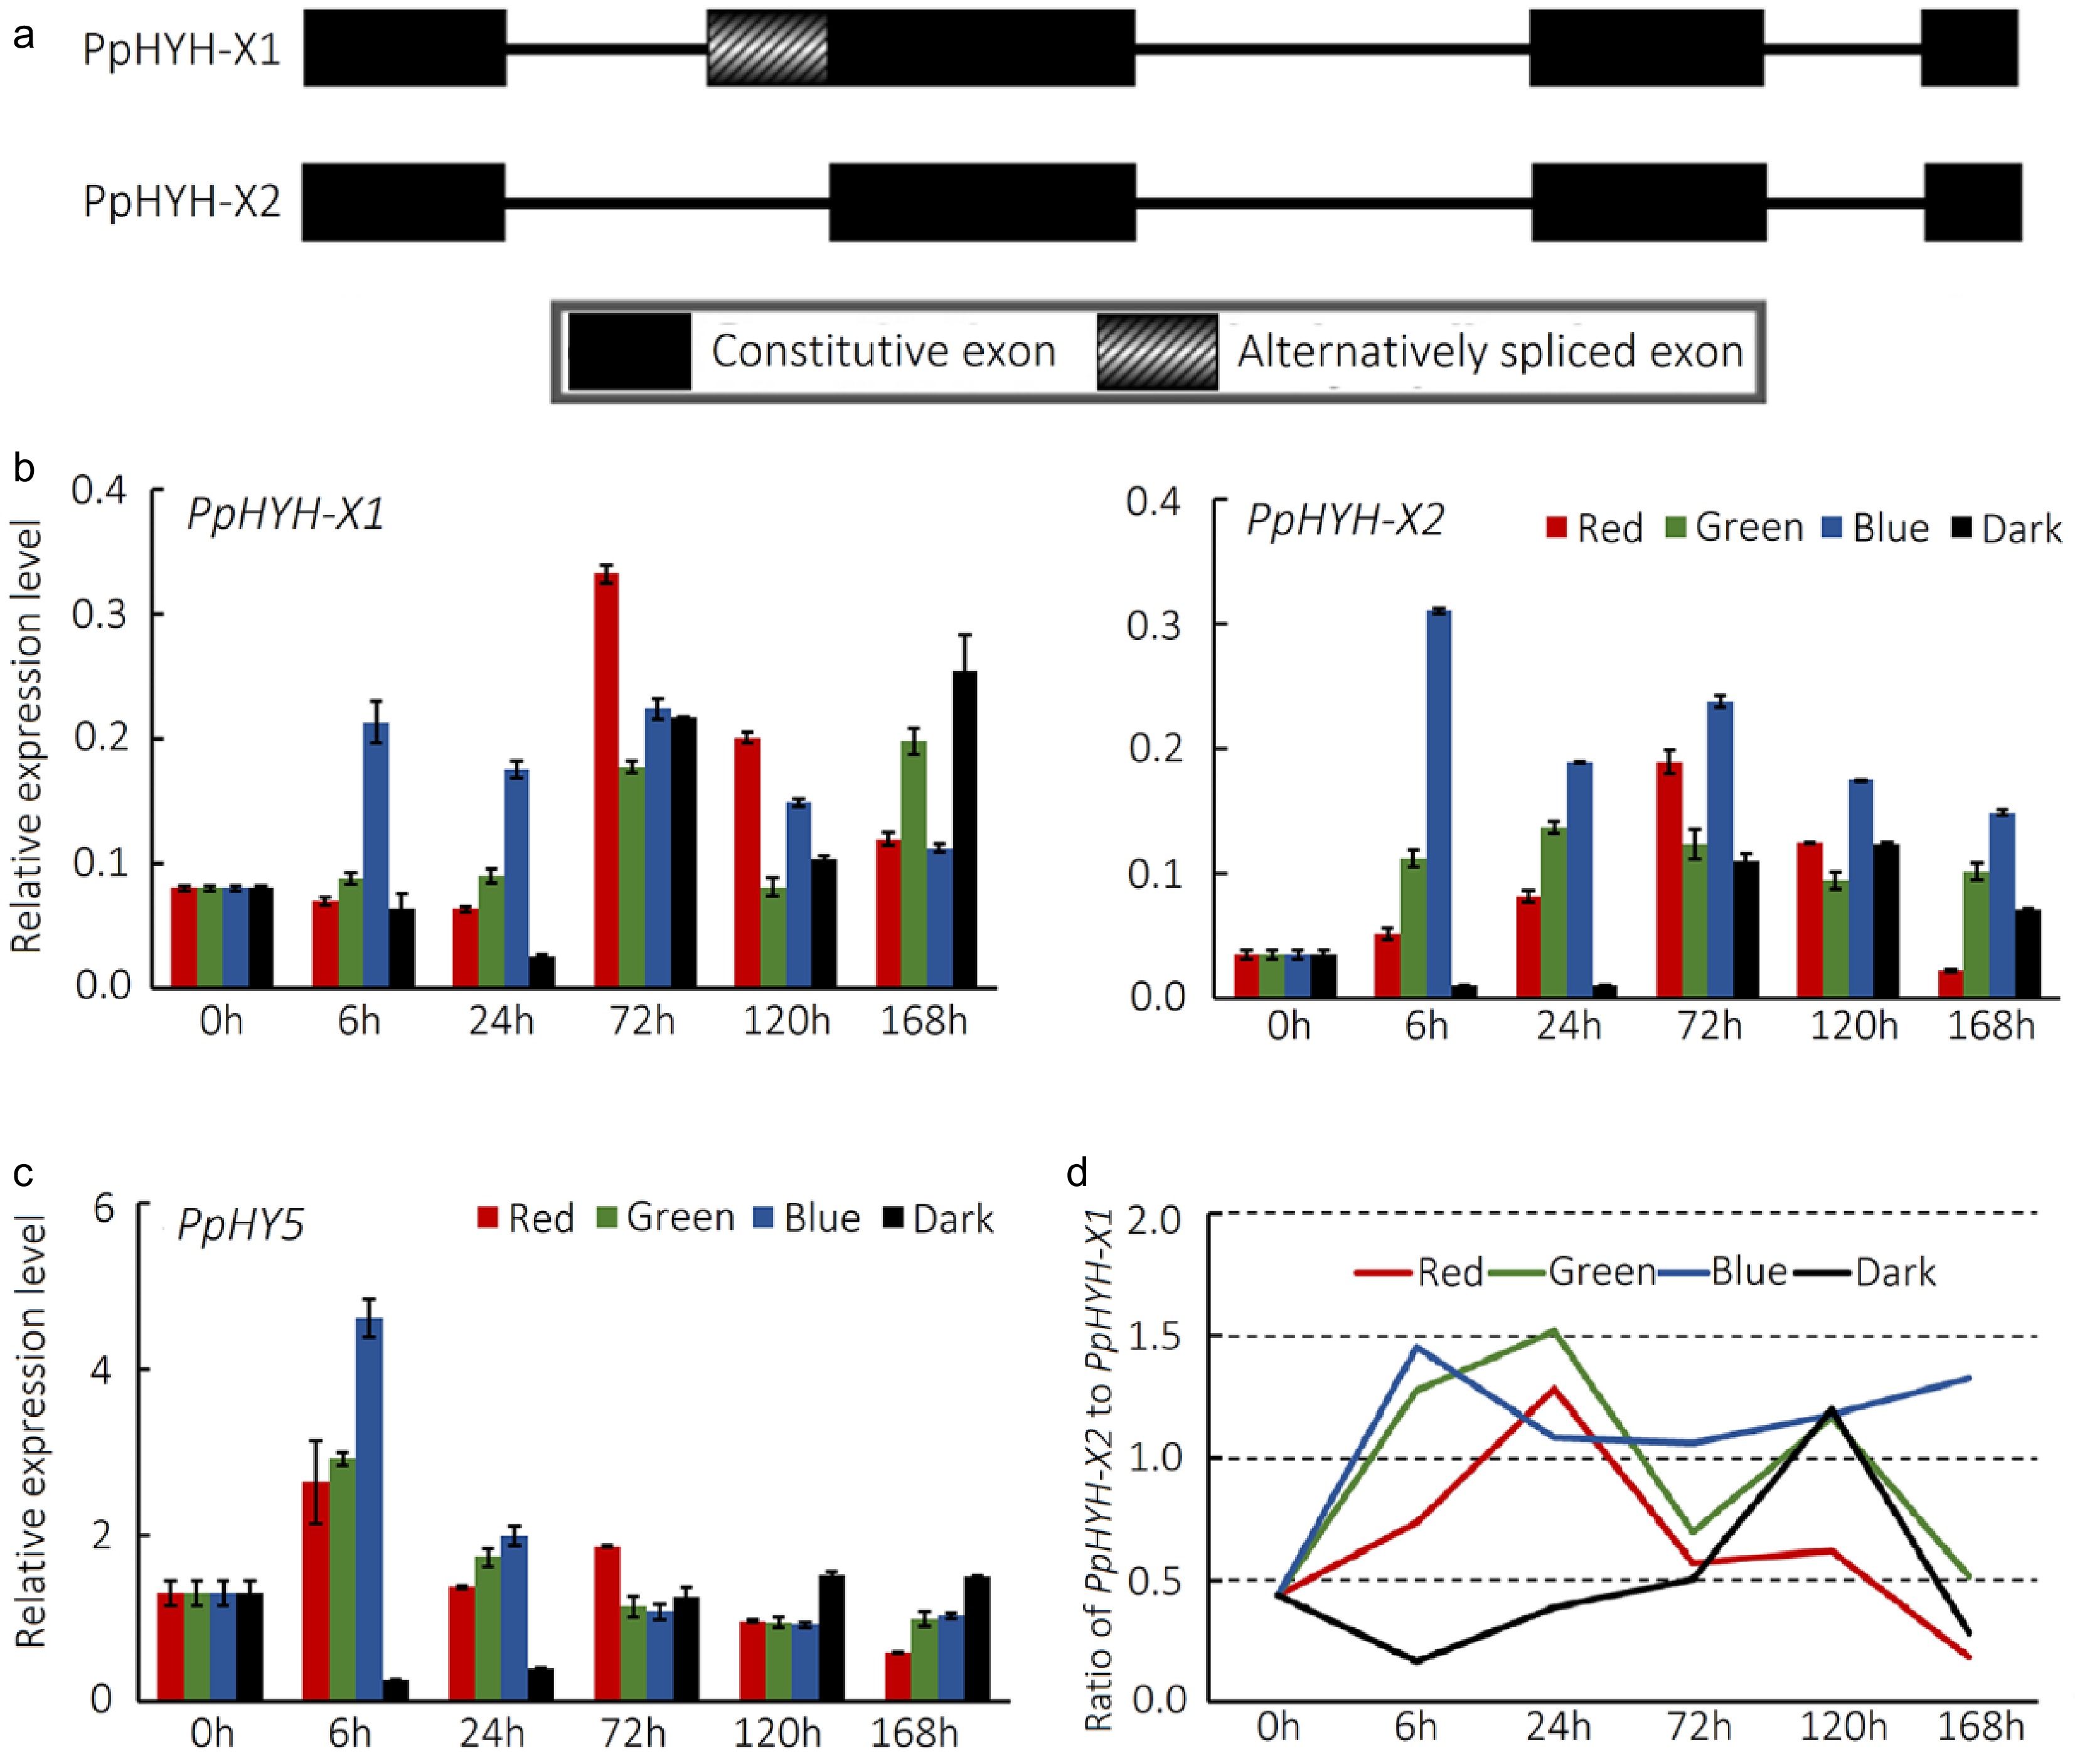
Figure 5.
Expression profiling of PpHYH and PpHY5 genes in peach peel exposed to visible light. (a) Schematic diagram of the PpHYH gene. The solid boxes, striated boxes and solid lines represent constitutive exons, alternatively spliced exons and introns, respectively. (b) Relative expression level of the PpHYH gene treated with red, green and blue light or under dark conditions. (c) Relative expression level of the PpHY5 gene treated with red, green and blue light or under dark conditions. (d) Ratio of PpHYH-X2 to PpHYH-X1 treated with red, green and blue light or under dark conditions. The error bars in (b) and (c) show ± SE of three biological replicates.
In addition, we investigated the expression profile of the PpHYH homologous gene PpHY5 as it has been reported to regulate anthocyanin accumulation in peach peel exposed to UVA and UVB[7]. The expression of PpHY5 was induced at 6 h of exposure to red, green or blue light, and showed a dramatic decrease at 24 h of visible light irradiation (Fig. 5c). Notably, the expression levels of PpHY5 in the peel after 24 h of irradiation were quite similar among red, green and blue light. Therefore, PpHY5 is unlikely the candidate gene responsible for visible light-induced anthocyanin accumulation in peach peel.
It has been reported that the relative abundance of different alternative splicing variants is often associated with phenotypic variation in plants[29]. Therefore, we investigated the relative abundance of PpHYH-X1 and PpHYH-X2 in the peel exposed to visible light. Blue light had a better ability to increase the ratio of PpHYH-X2 to PpHYH-X1 compared to green and red light (Fig. 5d). The PpHYH-X2 variant has stronger activation on the transcription of PpMYB10.1 compared to the PpHYH-X1 variant[15]. Thus, the crucial role of blue light in peach peel anthocyanin pigmentation could be attributed to its ability to activate the transcription of PpHYH and to ensure the relative abundance of the PpHYH-X2 transcript.
Identification and analysis of AS events under different light qualities
-
Since the ratio of PpHYH-X2 to PpHYH-X1 showed a variation between visible light with different wavelengths, we investigated the impact of visible light on alternative splicing (AS) events at the genome-wide level, including alternative 3' last exon (A3SS), alternative 5' first exon (A5SS), exon skipping (ES), retained intron (RI) and mutually exclusive exons (MXE). The frequencies of A5SS, A3SS, ES, RI and MXE in the peel at 72 h of visible light exposure were significantly higher than in the peel at 72 h of treatment in dark (Fig. 6). The frequency of different types of AS events had no significant difference between blue, green and red light. These results suggest that light could promote the occurrence of alternative splicing variants.
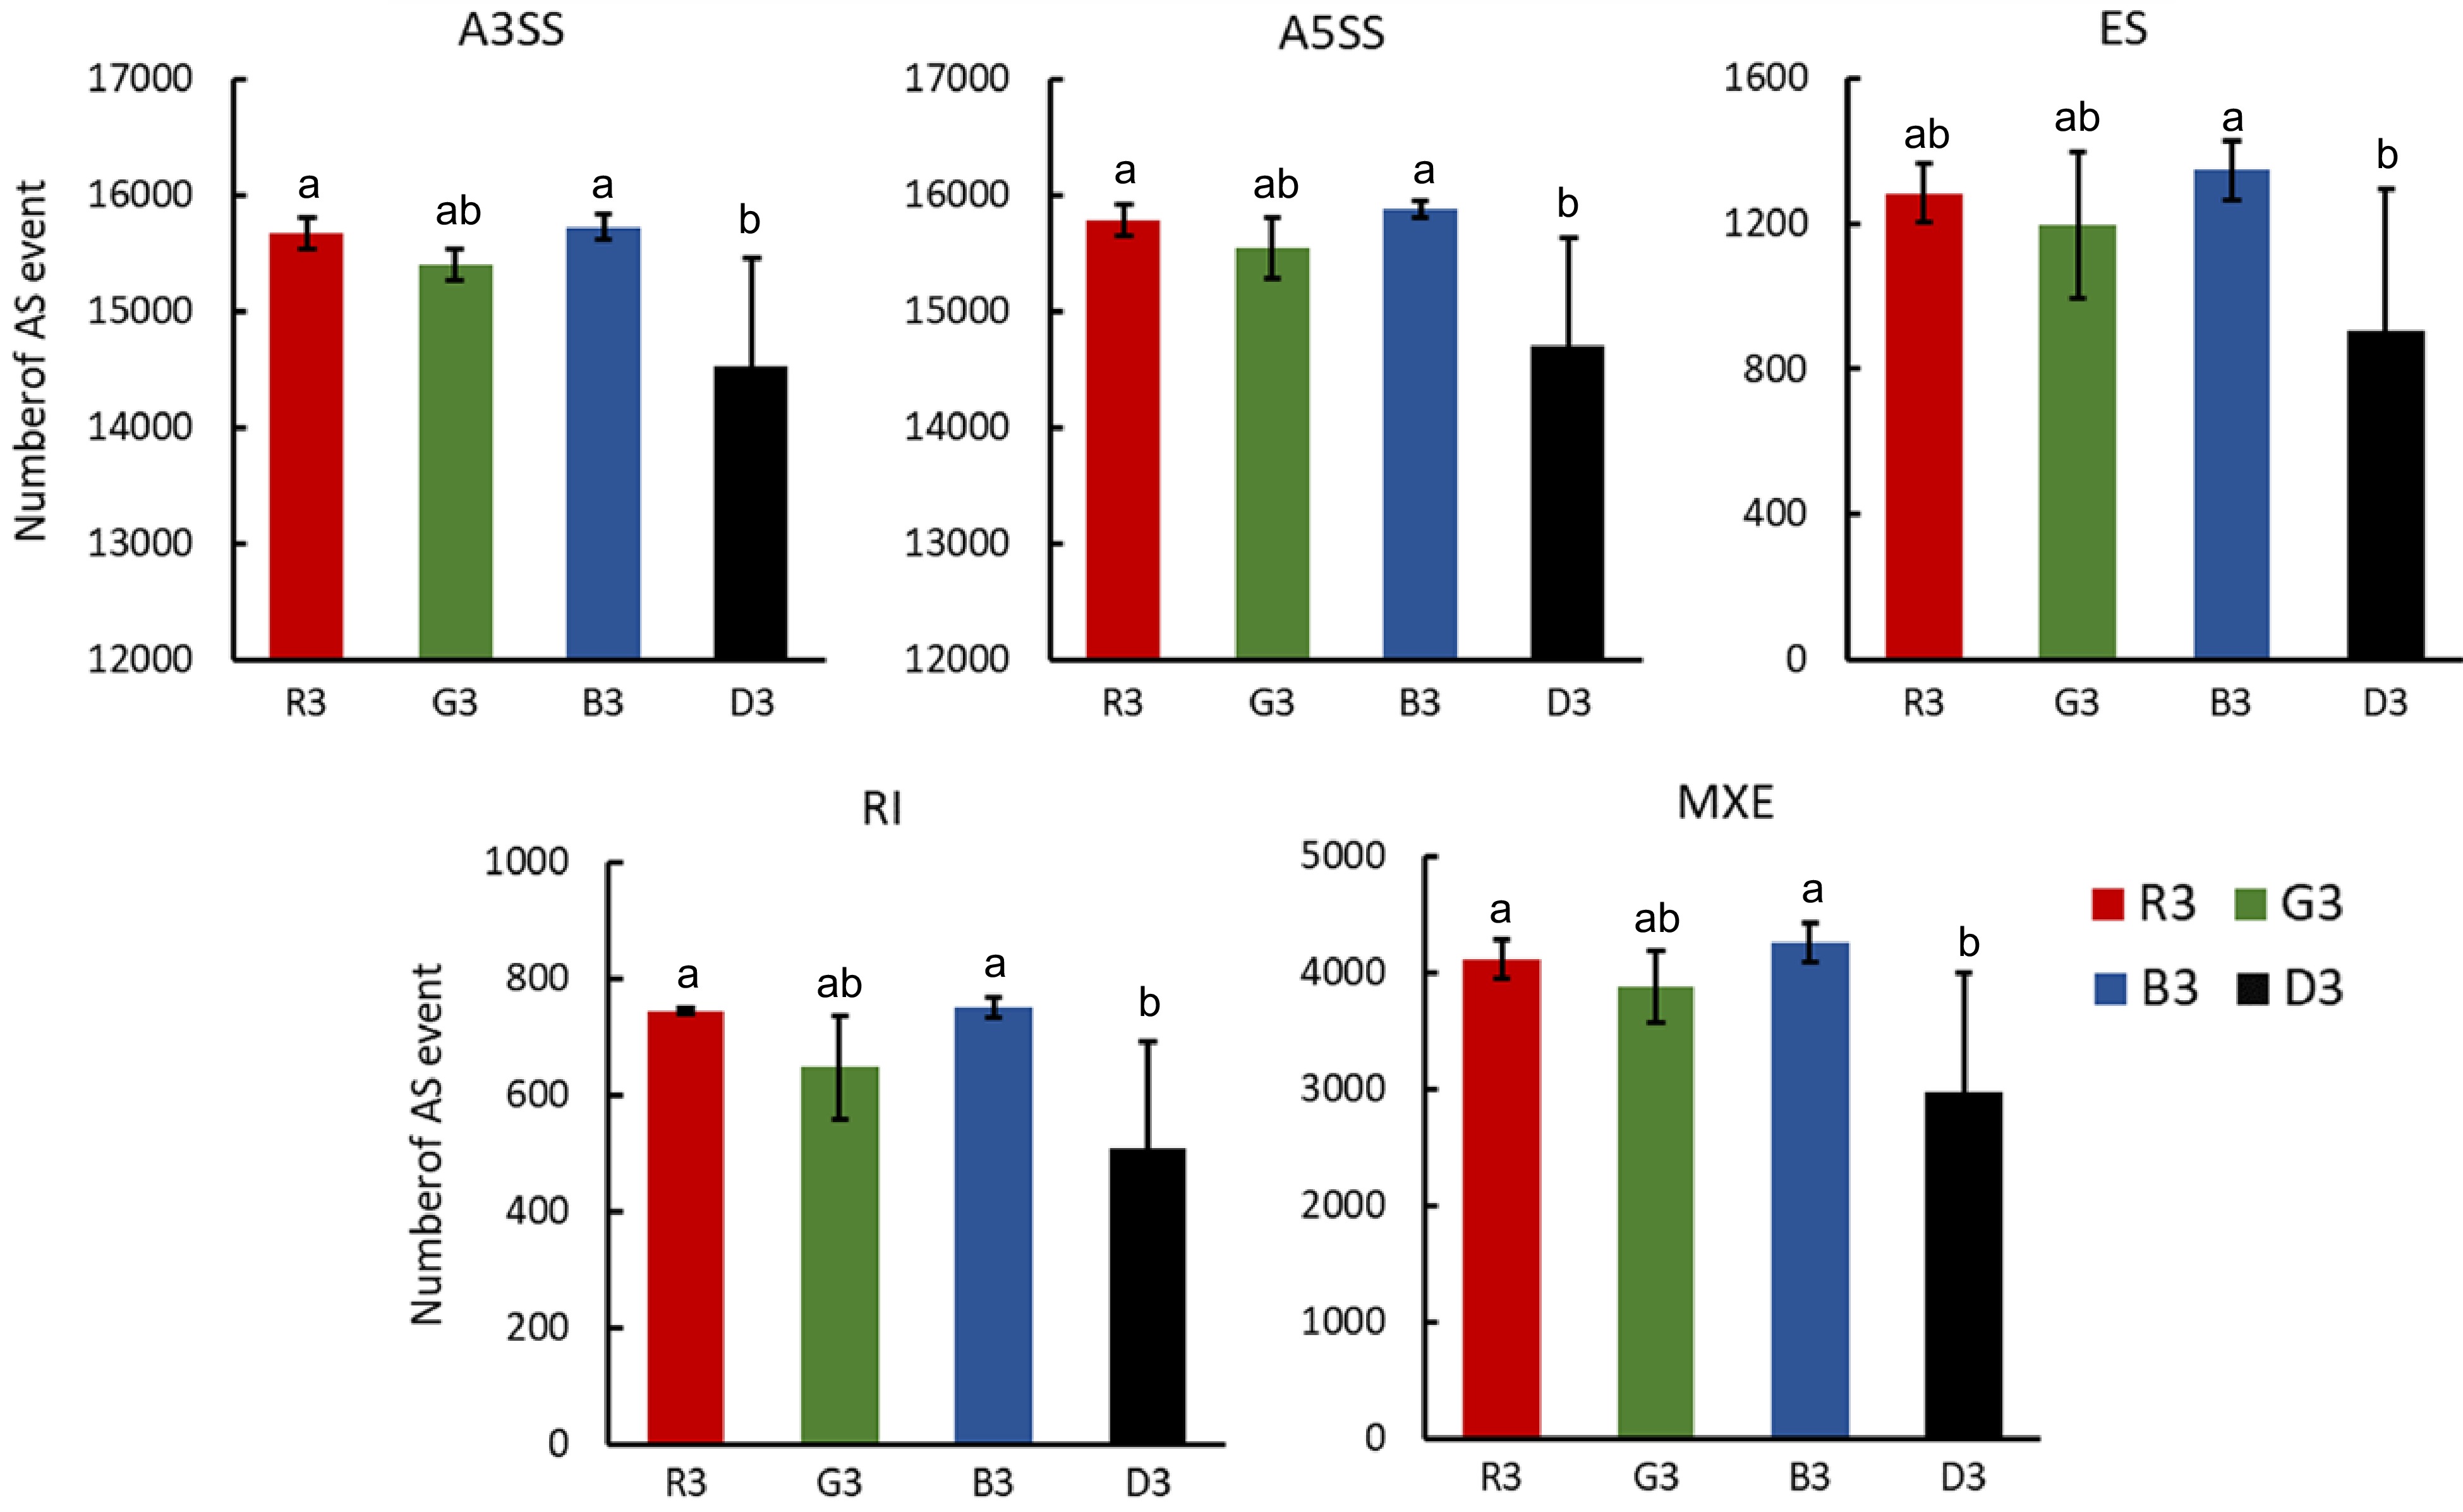
Figure 6.
Analysis of AS events of peel samples treated with red, green and blue light or under dark conditions. A3SS: alternative 3' last exon; A5SS: alternative 5' first exon; ES: exon skipping; RI: retained intron; MXE: mutually exclusive exons. R3, G3, B3 and D3 represent peel samples treated with 72 h of red, green, blue light irradiation and 72 h of treatment in the dark. The error bars show ± SE of three biological replicates, and significant difference at p < 0.05 in is indicted by different lowercase letters based on Fisher's Least Significant Difference (LSD) test.
-
Anthocyanins are a group of red to blue flavonoid pigments that may help plants cope with environmental stresses such as high light and nutrient deprivation[30]. Light is a form of energy that travels as waves, and short-wavelength waves have more energy than long-wavelength waves. Blue (400−500 nm) and ultraviolet (300−400 nm) light with short wavelengths carry a tremendous amount of energy that induces damage to nuclear DNA[31]. Under ultraviolet (UV) and blue light irradiation, plants naturally produce anthocyanins in epidermal cells to protect themselves from the damage of incoming energy[32]. This is probably why UV and blue light have an important influence on the induction of anthocyanin pigmentation in the skin of various fruits, such as tomato[33], pear[20, 21], strawberry[34], grapevine[35], and apple fruit[22, 36, 37]. In peach, a recent study has revealed the positive effect of UV on anthocyanin pigmentation in the peel[7]. In this study, we investigated the effect of visible light with different wavelengths on peach peel coloration and blue light was found to have a great effect on anthocyanin pigmentation. It is worth noting, however, that red and green light had the ability to induce anthocyanin accumulation but could not produce obvious red pigmentation in the skin of debagged fruits (Fig. 1a). This result demonstrated that red and green light treatments were less effective at increasing peach peel anthocyanin accumulation when compared to blue light treatment. In addition, anthocyanin content showed a slight increase in the peel of debagged fruits after 72 h of treatment in dark. Anthocyanin accumulation under dark condition has been observed in the case of anthocyanin coloration in the peach flesh surrounding the stone (Cs). Given that the Cs trait occurs during the ripening process[16], it is reasonable to speculate that anthocyanin accumulation in the peel of debagged fruits under dark conditions in this study could be due to the ripening behavior.
Previous studies have shown that light promotes anthocyanin accumulation in fruits by activating the expression of HY5, a key gene involved in the light signaling pathway, or increasing the HY5 protein stability[38, 39]. In peach, our previous study shows that PpHYH, instead of PpHY5, plays an important role in the regulation of light-induced anthocyanin pigmentation in peach peel[15]. In this study, our results indicated that PpHYH was more highly expressed in peach peel exposed to blue light than in peel exposed to green or red light. This finding further supported the crucial role of PpHYH in light-induced anthocyanin accumulation in peach peel. Moreover, HYH and its homolog HY5 have no transcriptional activation domains and require interacting partners for transcriptional regulation. In pear and strawberry, light-activated genes such as BBX and bHLH can form heterodimeric complexes with HY5 to promote anthocyanin accumulation[18, 19]. In peach, PpBBX4 has been reported to act as an interacting partner of PpHYH[15]. Here, PpBBX4 was highly expressed in peach peel exposed to visual light with different wavelengths (Supplemental Fig. S4a). Thus, it seems that PpHYH forms a heterodimer with PpBBX4 to promote anthocyanin pigmentation in peach peel exposed to visible light. Additionally, a previous study has revealed that PpHY5 is highly activated in peach peel exposed to UVA and UVB[7]. There is a difference between UV and visible light receptors[40, 41]. Thus, the mechanisms underlying anthocyanin accumulation in peach peel may be different between visible light and UV treatments.
Like PpHYH, PpHY5 was highly expressed in peach peel exposed to blue light. Our recent study has domesticated that PpHYH can bind to the G-box element on the promoter of PpMYB10.1 to activate its transcription[15]. There was no G-box element in the PpHY5 promoter, but two ACE-box elements at 79 bp and 1,042 bp upstream of the start codon were identified. The ACE-box element has been reported to be an important cis-element for HY5 protein binding[42, 43]. PpHY5 plays an important role in activating expression of anthocyanin-related structural and regulatory genes[7, 15]. Thus, it is worthy of further studies to address whether the above mentioned PpHYH/PpBBX4 complex could activate the transcription of PpHY5, which promotes anthocyanin accumulation in peach peel exposed to blue light.
The PpHYH gene had two alternative splicing variants, PpHYH-X1 and PpHYH-X2. Compared with the PpHYH-X1 variant, the PpHYH-X2 variant showed higher expression in peach peel exposed to blue light. More importantly, the PpHYH-X2 variant has a stronger effect on promoting transcription of PpMYB10.1 compared with the PpHYH-X1 variant[15]. Therefore, blue light-induced anthocyanin pigmentation in peach peel could be attributed to the strong action of PpHYH-X2. Notably, the PpHYH-X1 protein is located in the nucleus, while the PpHYH-X2 protein is located in the nucleus and cytoplasm[15]. Previous studies have shown that the changes in the relative abundance of alternative splicing variants that show difference in subcellular localization can lead to phenotypic variations, including developmental processes[44], signal transduction[45], and flowering time[29, 46, 47]. The ratio of PpHYH-X2 to PpHYH-X1 in peach peel showed a variation between visible light with different wavelengths. More studies are needed to clarify whether the changes in the PpHYH-X2 to PpHYH-X1 ratio have an impact on the accumulation of anthocyanins and other metabolites in peach peel.
COP1 is well known to target HY5/HYH for ubiquitination and subsequent 26S proteasome-dependent degradation. Under visible light conditions, light receptors, such as phytochromes (PHY), cryptochromes (CRY) and phototropins (PHOT), can interact with COP1 to inhibit its function[48−53]. In this study, our results indicated that a visible light receptor PpCRYD (Prupe.1G462400) was highly expressed in peach peel upon exposure to blue, green or red light (Supplemental Fig. S4b). However, no PHY and PHOT genes were found to show differential expression between visible light and darkness treatments. Moreover, PpCOP1 showed high expression in peach peel exposed to visible light with different wavelengths (Supplemental Fig. S4c). An E3 ubiquitin ligase PpCOP1 has been reported to interact with PpHYH[15]. Therefore, PpCRYD seems to prevent PpCOP1 from interacting with PpHYH, leading to anthocyanin accumulation in peach peel under visible light treatment.
External environmental factors such as temperature and light can promote the occurrence of alternative splicing events to improve the adaptability of plants[54−58]. In this study, we found that red, green and blue light all significantly increased the frequency of alternative splicing events at the genome-wide level. Previous studies have shown that phytochrome and splicing regulators play important roles in light-induced AS events in plants[59−61]. Recent studies have shown that chloroplast signals are involved in the regulation of light-induced AS events in plants by influencing RNA polymerase II elongation[56] and TOR kinase activity[62]. In this study, 32 out of 65 DEGs that were up-regulated in peach peel upon exposure to visible light were chloroplast-related genes (Supplemental Table S5). This suggests that chloroplast signaling may play an important role in light-induced AS events in peach.
-
Our previous study has shown that light promotes peach peel coloration by activating the transcription of the PpHYH gene. In this study, we further demonstrated that visible light, including red, green and blue light, could induce anthocyanin accumulation in peach peel by promoting the expression of the PpHYH gene, instead of the PpHY5 gene. Blue light had the strongest positive effect on inducing the PpHYH-X2 alternative splicing variant, resulting in an increased ratio of PpHYH-X2 variant to PpHYH-X1 variant compared to green and red light. Thus, blue light had a stronger ability to induce peach peel coloration than red and green light. This study revealed the mechanism of visible light-induced anthocyanin accumulation in peach peel, and confirmed the crucial role of the PpHYH gene in peach peel anthocyanin accumulation.
This project was supported by funds received from the National Natural Science Foundation of China (31872087) and the China Agriculture Research System (grant no. CARS-30).
-
The authors declare that they have no conflict of interest.
- Supplemental Fig. S1 Analysis of transcriptome sequencing data. (A) Correlation analysis between biological replicates. (B) Principal component analysis (PCA) of three biological replicates.
- Supplemental Fig. S2 Analysis of DEGs between fruit samples treated with 72h of blue light irradiation (B3) and those at 0 (D0) and 72h (D3) of treatment in dark. (A). The number of differentially up-regulated and down-regulated genes. (B) Histogram of COG function for the up-regulated and down-regulated genes.
- Supplemental Fig. S3 Pearson's correlation analysis was performed to analyze the correlation between the expression level of the PpHYH-X2 gene and anthocyanin content or the expression levels of anthocyanin-related genes.
- Supplemental Fig. S4 FPKM values of PpBBX4 (A), PpCRYD (B) and PpCCOP1 (C) genes of peel samples treated with red, green and blue light or under dark condition. R3, G3, B3 and D3 represent peel samples treated with 72h of red, green, blue light irradiation and 72h of treatment in dark. The error bars show ± SE of three biological replicates.
- Supplemental Table S1 Primers sequences for the qRT-PCR in this study.
- Supplemental Table S2 Summary of RNA-seq data quality.
- Supplemental Table S3 Statistical table of the number of DEGs.
- Supplemental Table S4 DEGs in response to blue light irradiation.
- Supplemental Table S5 Common DEGs in response to red, green, and blue light irradiation
- Supplemental Table S6 Gene lists of the MEgreen module.
- Copyright: © 2023 by the author(s). Published by Maximum Academic Press, Fayetteville, GA. This article is an open access article distributed under Creative Commons Attribution License (CC BY 4.0), visit https://creativecommons.org/licenses/by/4.0/.
-
About this article
Cite this article
Zhao L, Liu Y, Chen X, Zhang X, Liao L, et al. 2023. Visible light induces the PpHYH transcription to promote anthocyanin pigmentation in peach peel. Fruit Research 3:25 doi: 10.48130/FruRes-2023-0025 

Visible light induces the PpHYH transcription to promote anthocyanin pigmentation in peach peel
- Received: 14 June 2023
- Accepted: 17 August 2023
- Published online: 08 October 2023
Abstract: Light is important for fruit coloration, but molecular mechanisms underlying the impact of visible light on anthocyanin pigmentation in peach peel remain elusive. Here, we investigated the influence of visible light, including red, green and blue light, on peel coloration in peach. Blue light had a better ability to induce anthocyanin pigmentation in peach peel than red and green light. A transcription factor, PpHYH, was identified to be responsible for visible light-induced anthocyanin accumulation in peach peel. The PpHYH gene was more highly expressed in peach peel exposed to blue light than in the peel exposed to red and green light. Moreover, PpHYH had two alternative splicing variants, PpHYH-X1 and PpHYH-X2, with the latter having a stronger ability to activate transcription of PpMYB10.1. Blue light had better ability to increase the ratio of PpHYH-X2 to PpHYH-X1 compared to green and red light. Thus, the role of blue light in peach peel anthocyanin pigmentation could be attributed to its ability to activate the transcription of PpHYH and to ensure the relative abundance of the PpHYH-X2 transcript. Additionally, light was able to enhance the occurrence of alternative splicing variants in peach peel. Our results confirmed the important role of PpHYH gene in light-induced anthocyanin pigmentation in peach peel.
-
Key words:
- Anthocyanin /
- Prunus persica /
- Light /
- PpHYH /
- Alternative splicing