-
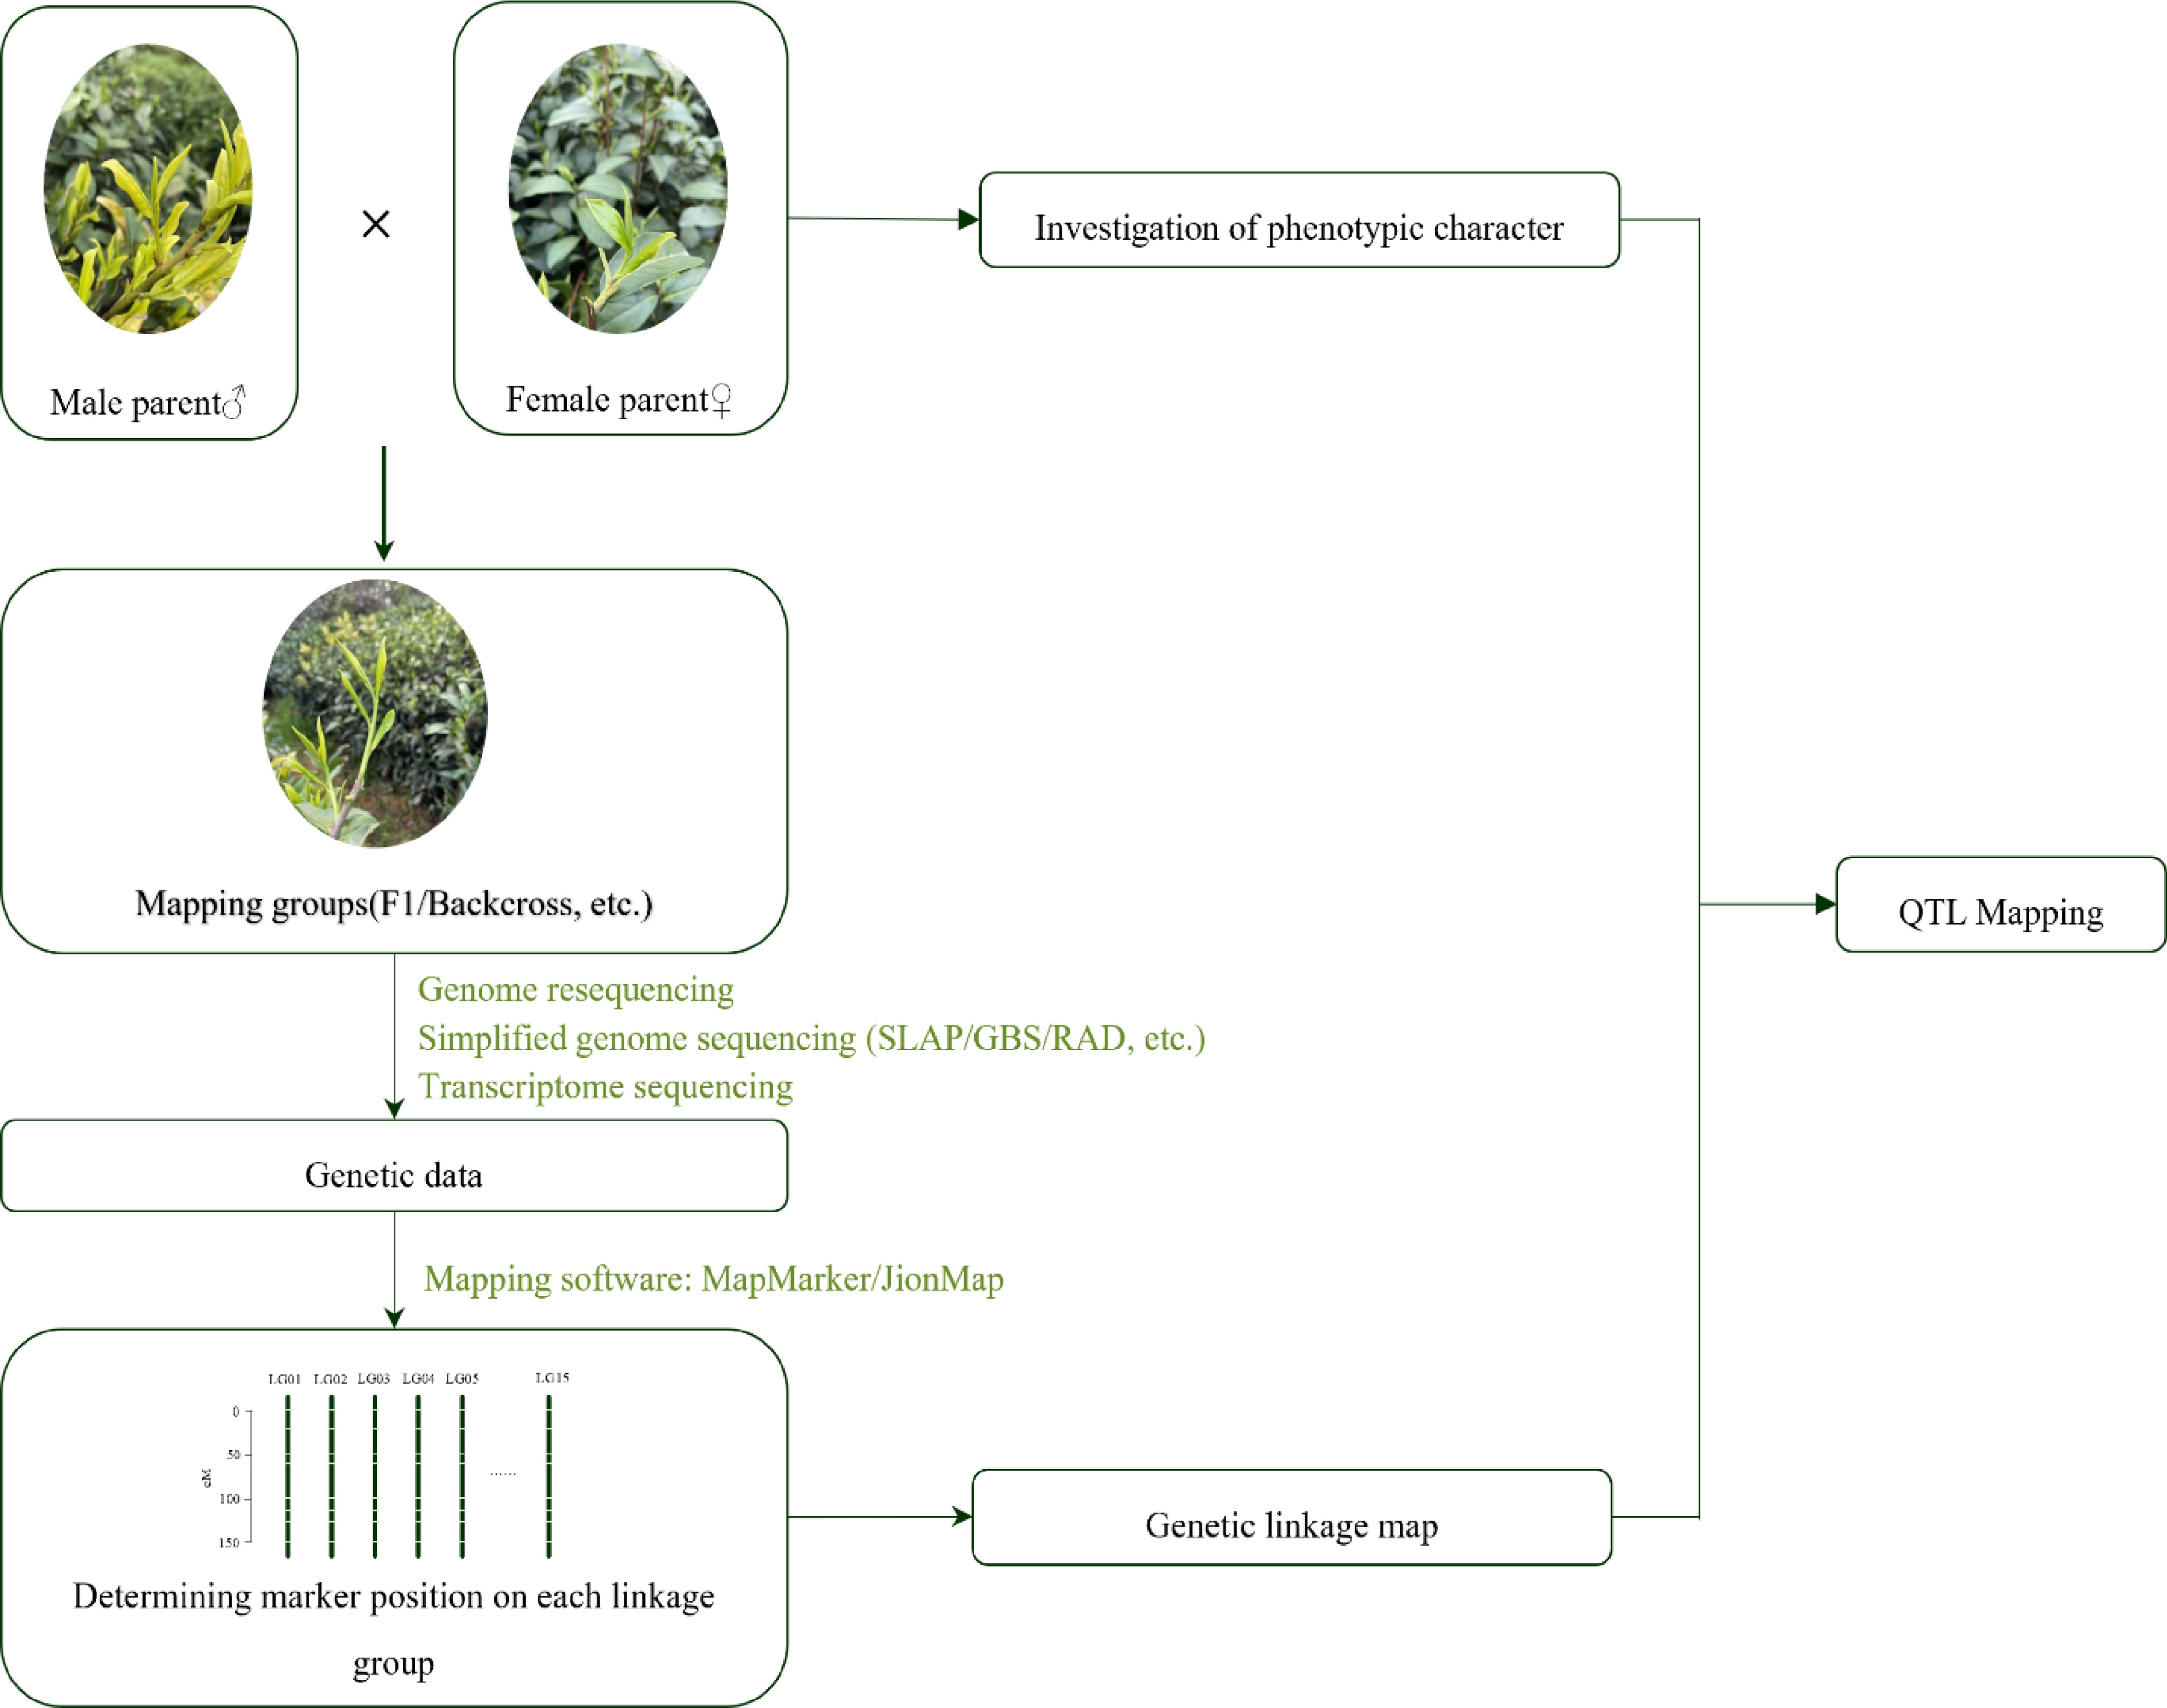
Figure 1.
QTL mapping construction flow chart.
-
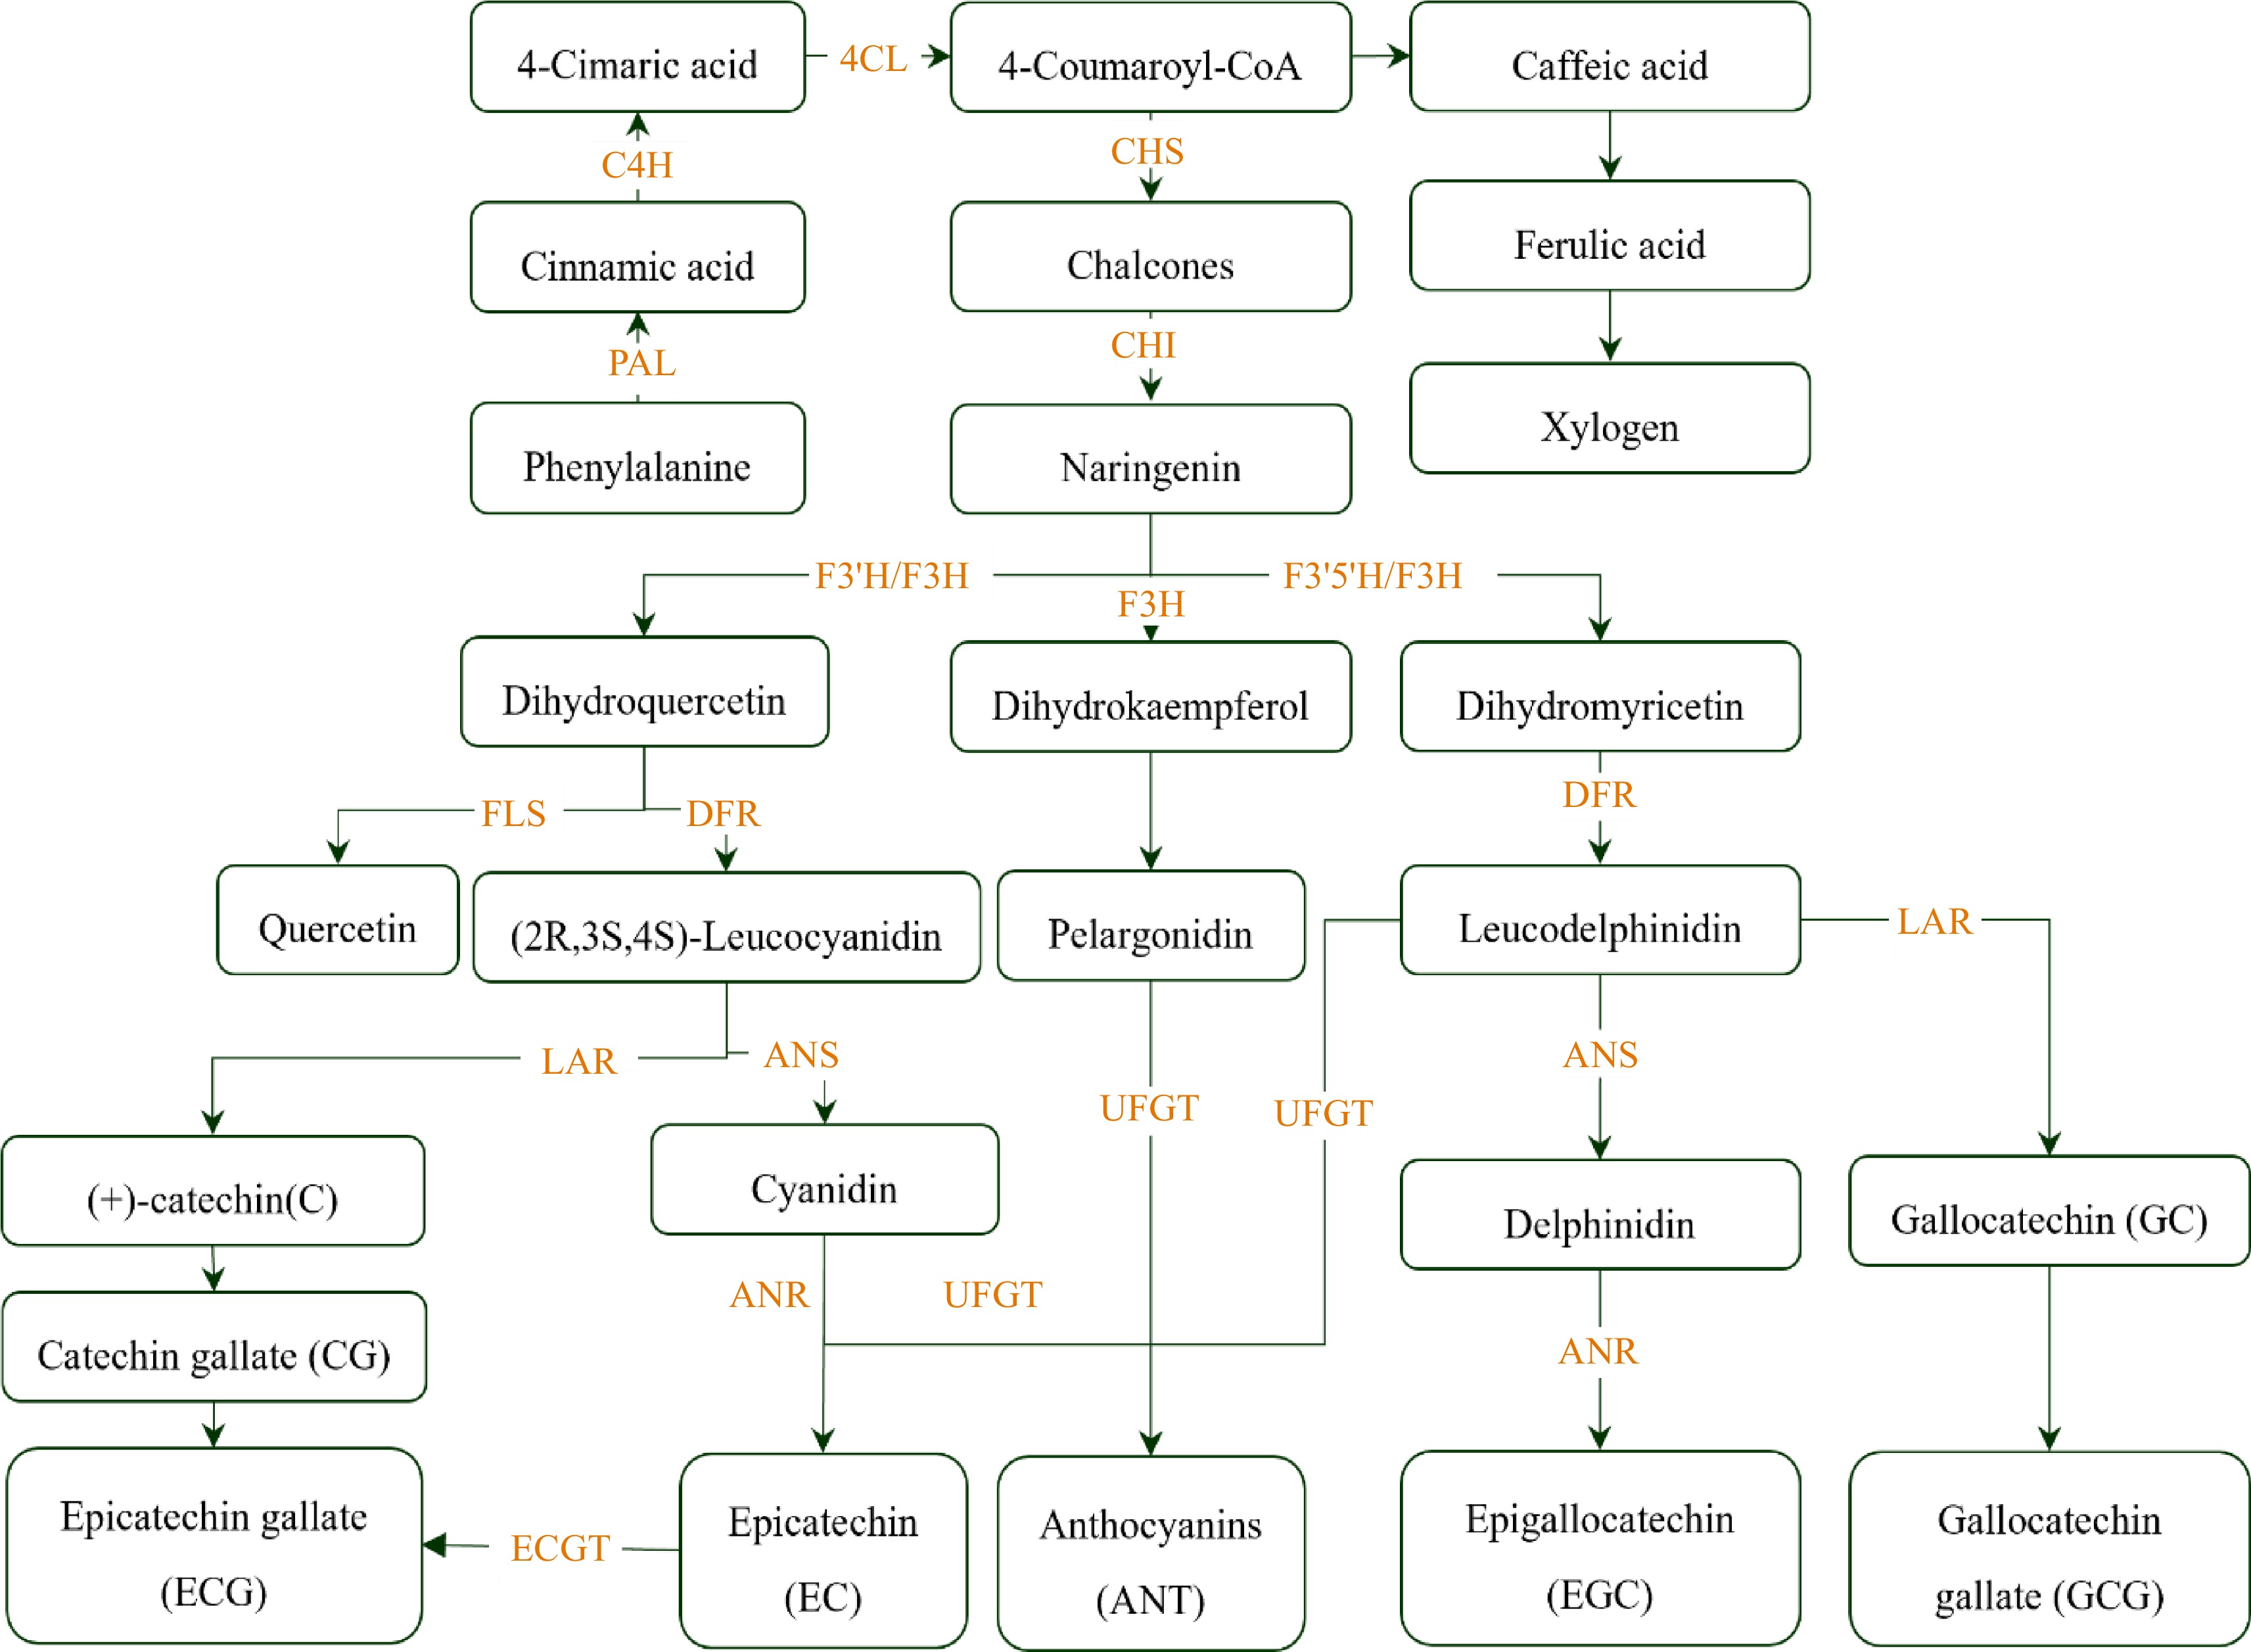
Figure 2.
Schematic presentation of catechin metabolism. PAL, phenylalanine ammonia-lyase; C4H, cinnamate 4-hydroxylase; 4CL, 4-coumarate-CoA ligase; CHS, chalcone synthase; CHI, chalcone isomerase; F3'H, flavonoid 3'-monooxygenase; F3H, flavanone 3-hydroxylase; F3'5'H, flavonoid 3', 5'-hydroxylase; FLS, flavonol synthase; DFR, dihydroflavonol-4-reductase; ANS, anthocyanidin synthase; ANR, anthocyanidin reductase; ECGT, 1-Ogalloyl-b-D-glucose O-galloyltransferase; UFGT, UDP-glucoseflavonoid-3-O-glucosyltransferase; LAR, leucoanthocyanidin reductase; DFR, dihydroflavonol reductase.
-
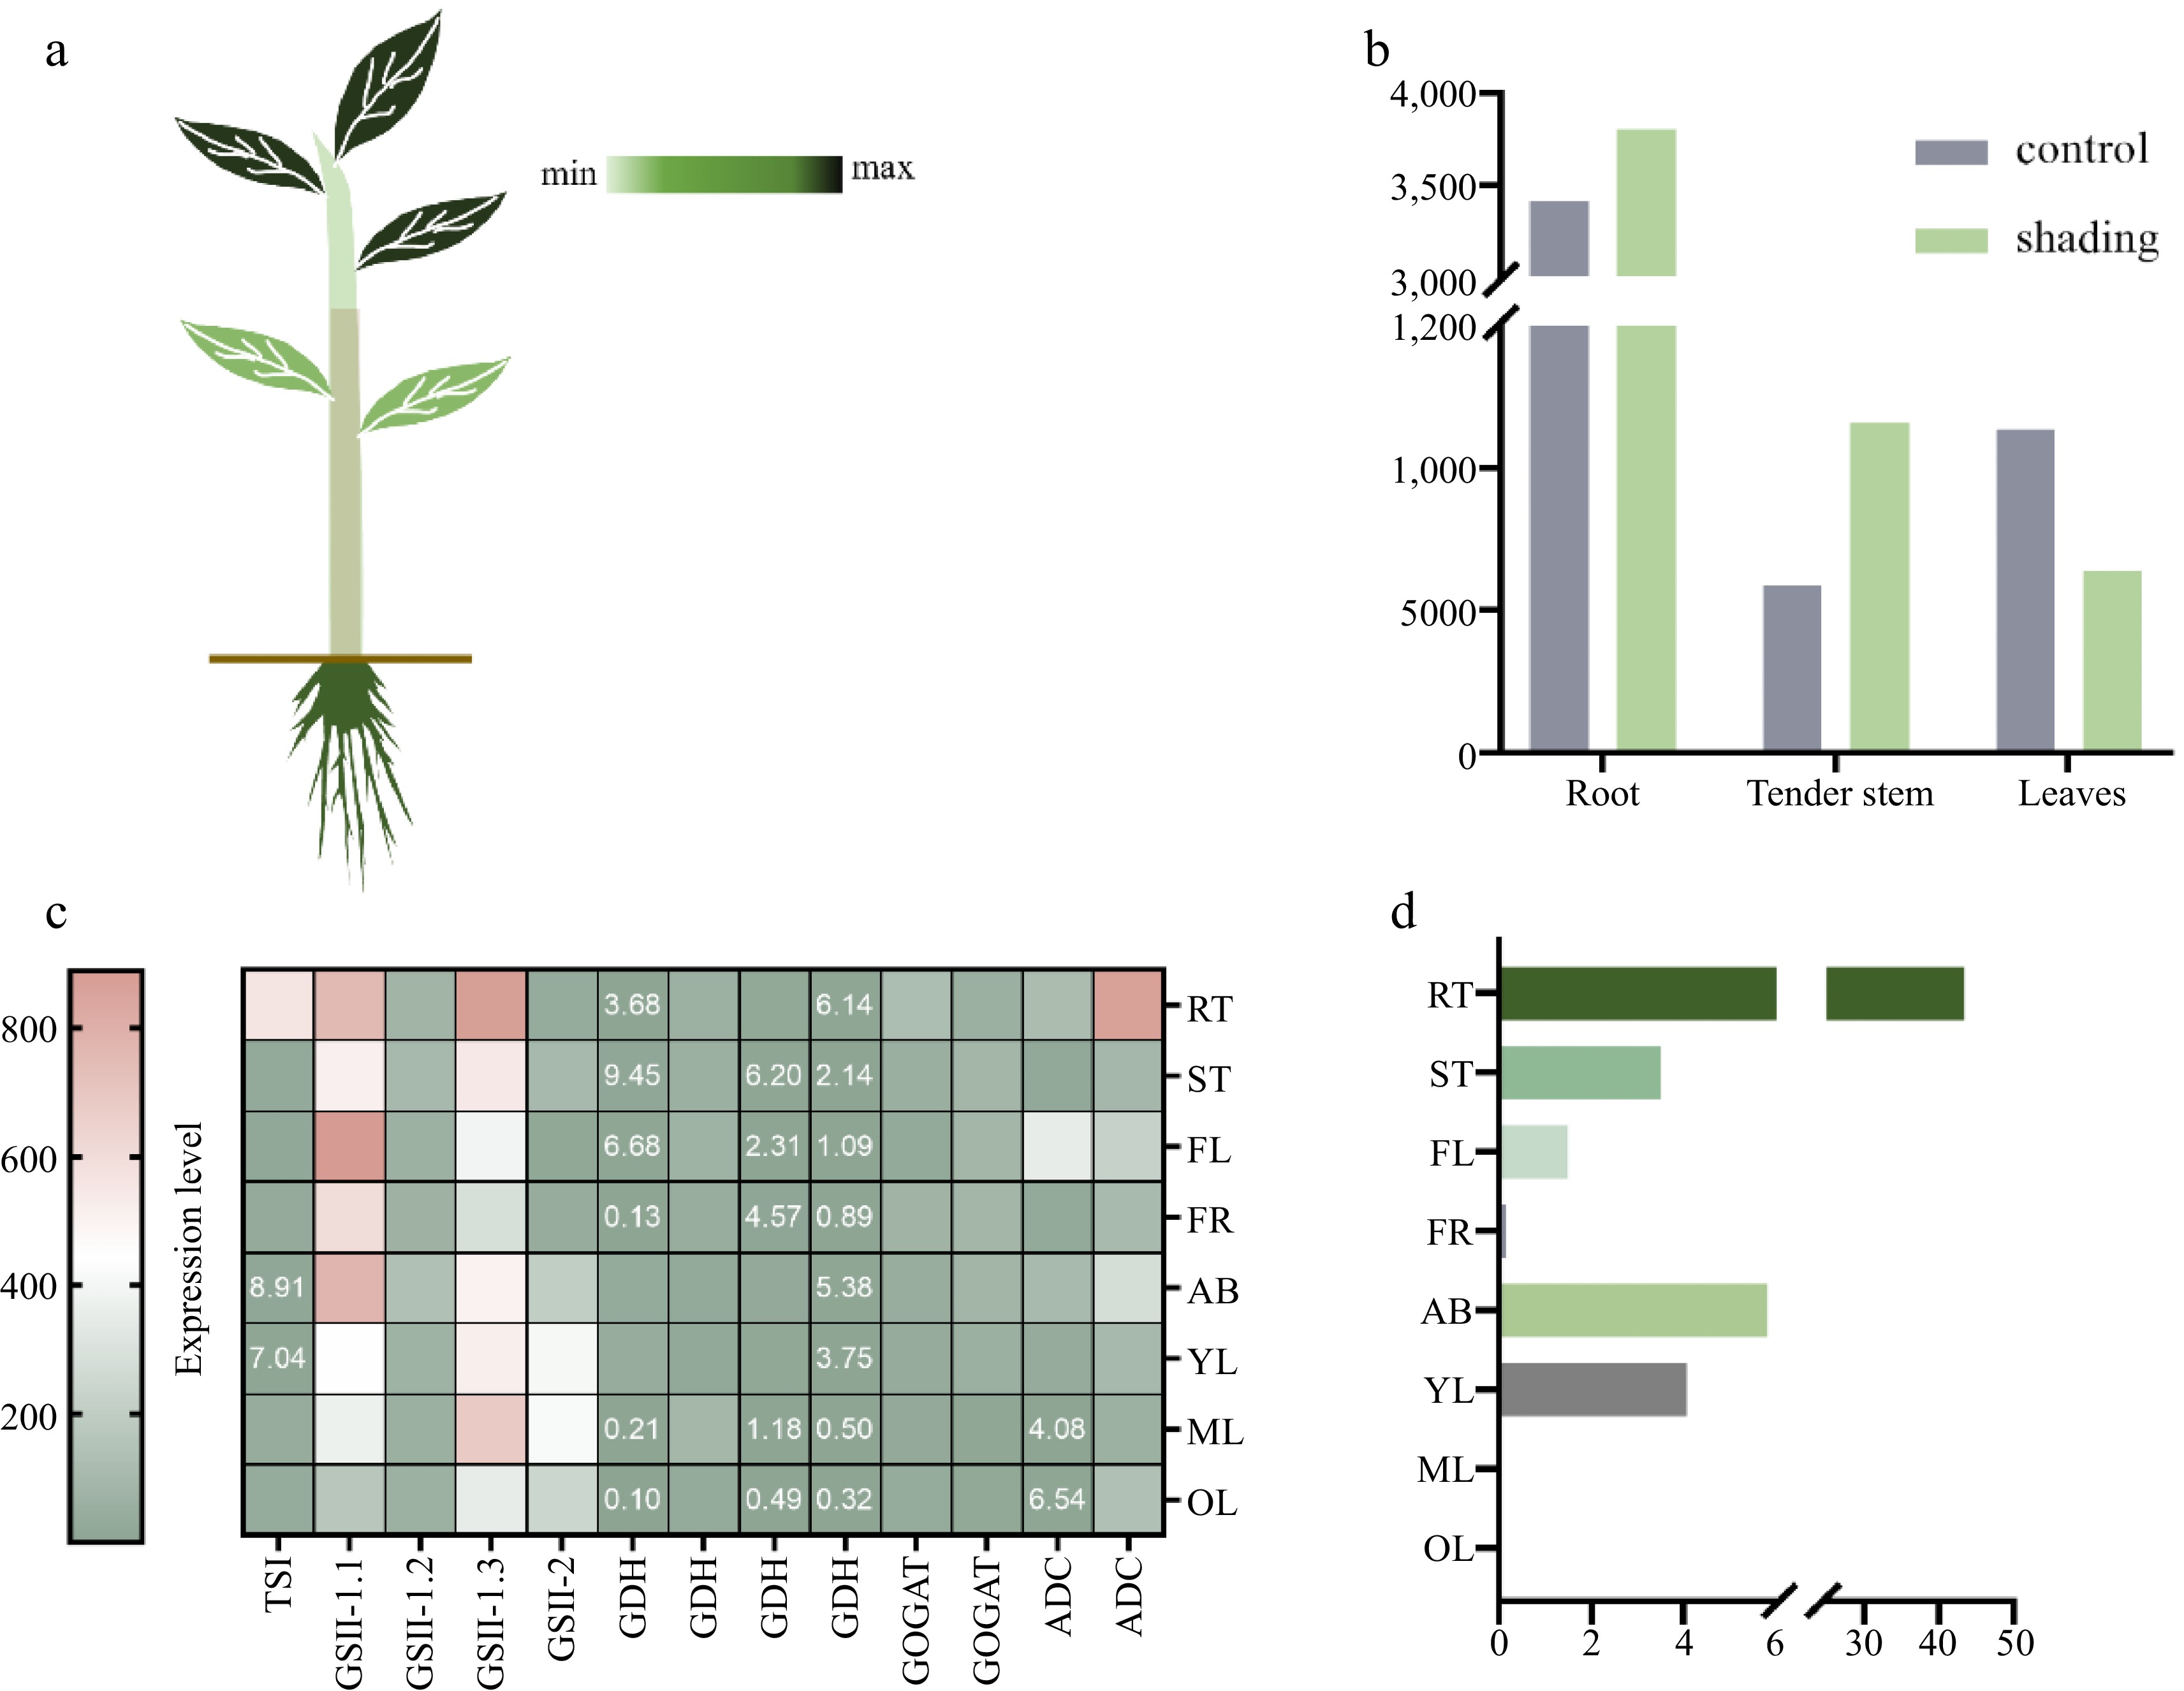
Figure 3.
Effect of different factors on theanine accumulation. (a) Theanine content in different tissues: young leaves > roots > old leaves > stems. (b) Theanine content in different tissues under shading (Data source is from Yang et al.[60]). (c) Expression patterns of candidate genes in different tissues in theanine biosynthesis of cultivar 'Shuchazao': apical buds (AB), young leaves (YL), mature leaves (ML), old leaves (OL), young stems (ST), flowers (FL), young fruits (FR) and tender roots (RT) (Date source is from Wei et al.[1]). (d) The content of theanine in different tissues of tea cultivar 'Shuchazao': The dry weight contents of theanine were detected by HPLC analysis in eight different tissues of tea cultivar 'Shuchazao' (Date source is from Wei et al.[1]).
-
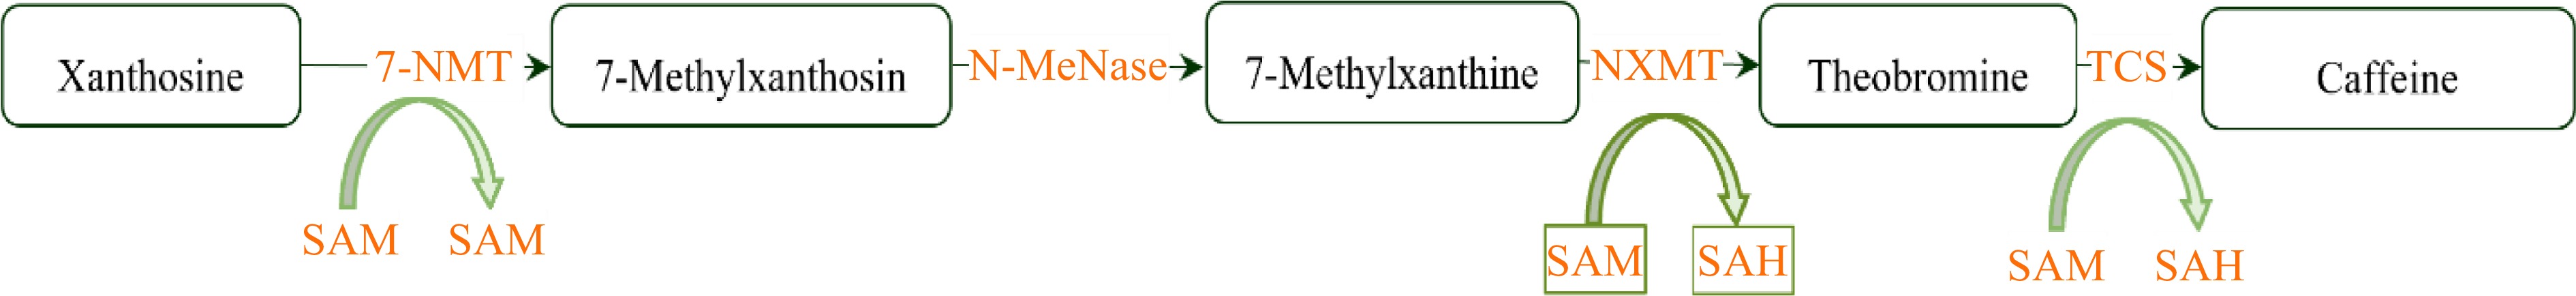
Figure 4.
Schematic representation of caffeine metabolism. 7-NMT, 7-Methylxanthosine synthase; N-MeNase, N-Methylnucleotidase; MXMT, Theobromine synthase; TCS, Tea caffeine synthase; SAM, S-Adenosyl methionine; SAH, S-Adenosyl-L-homocysteine.
-
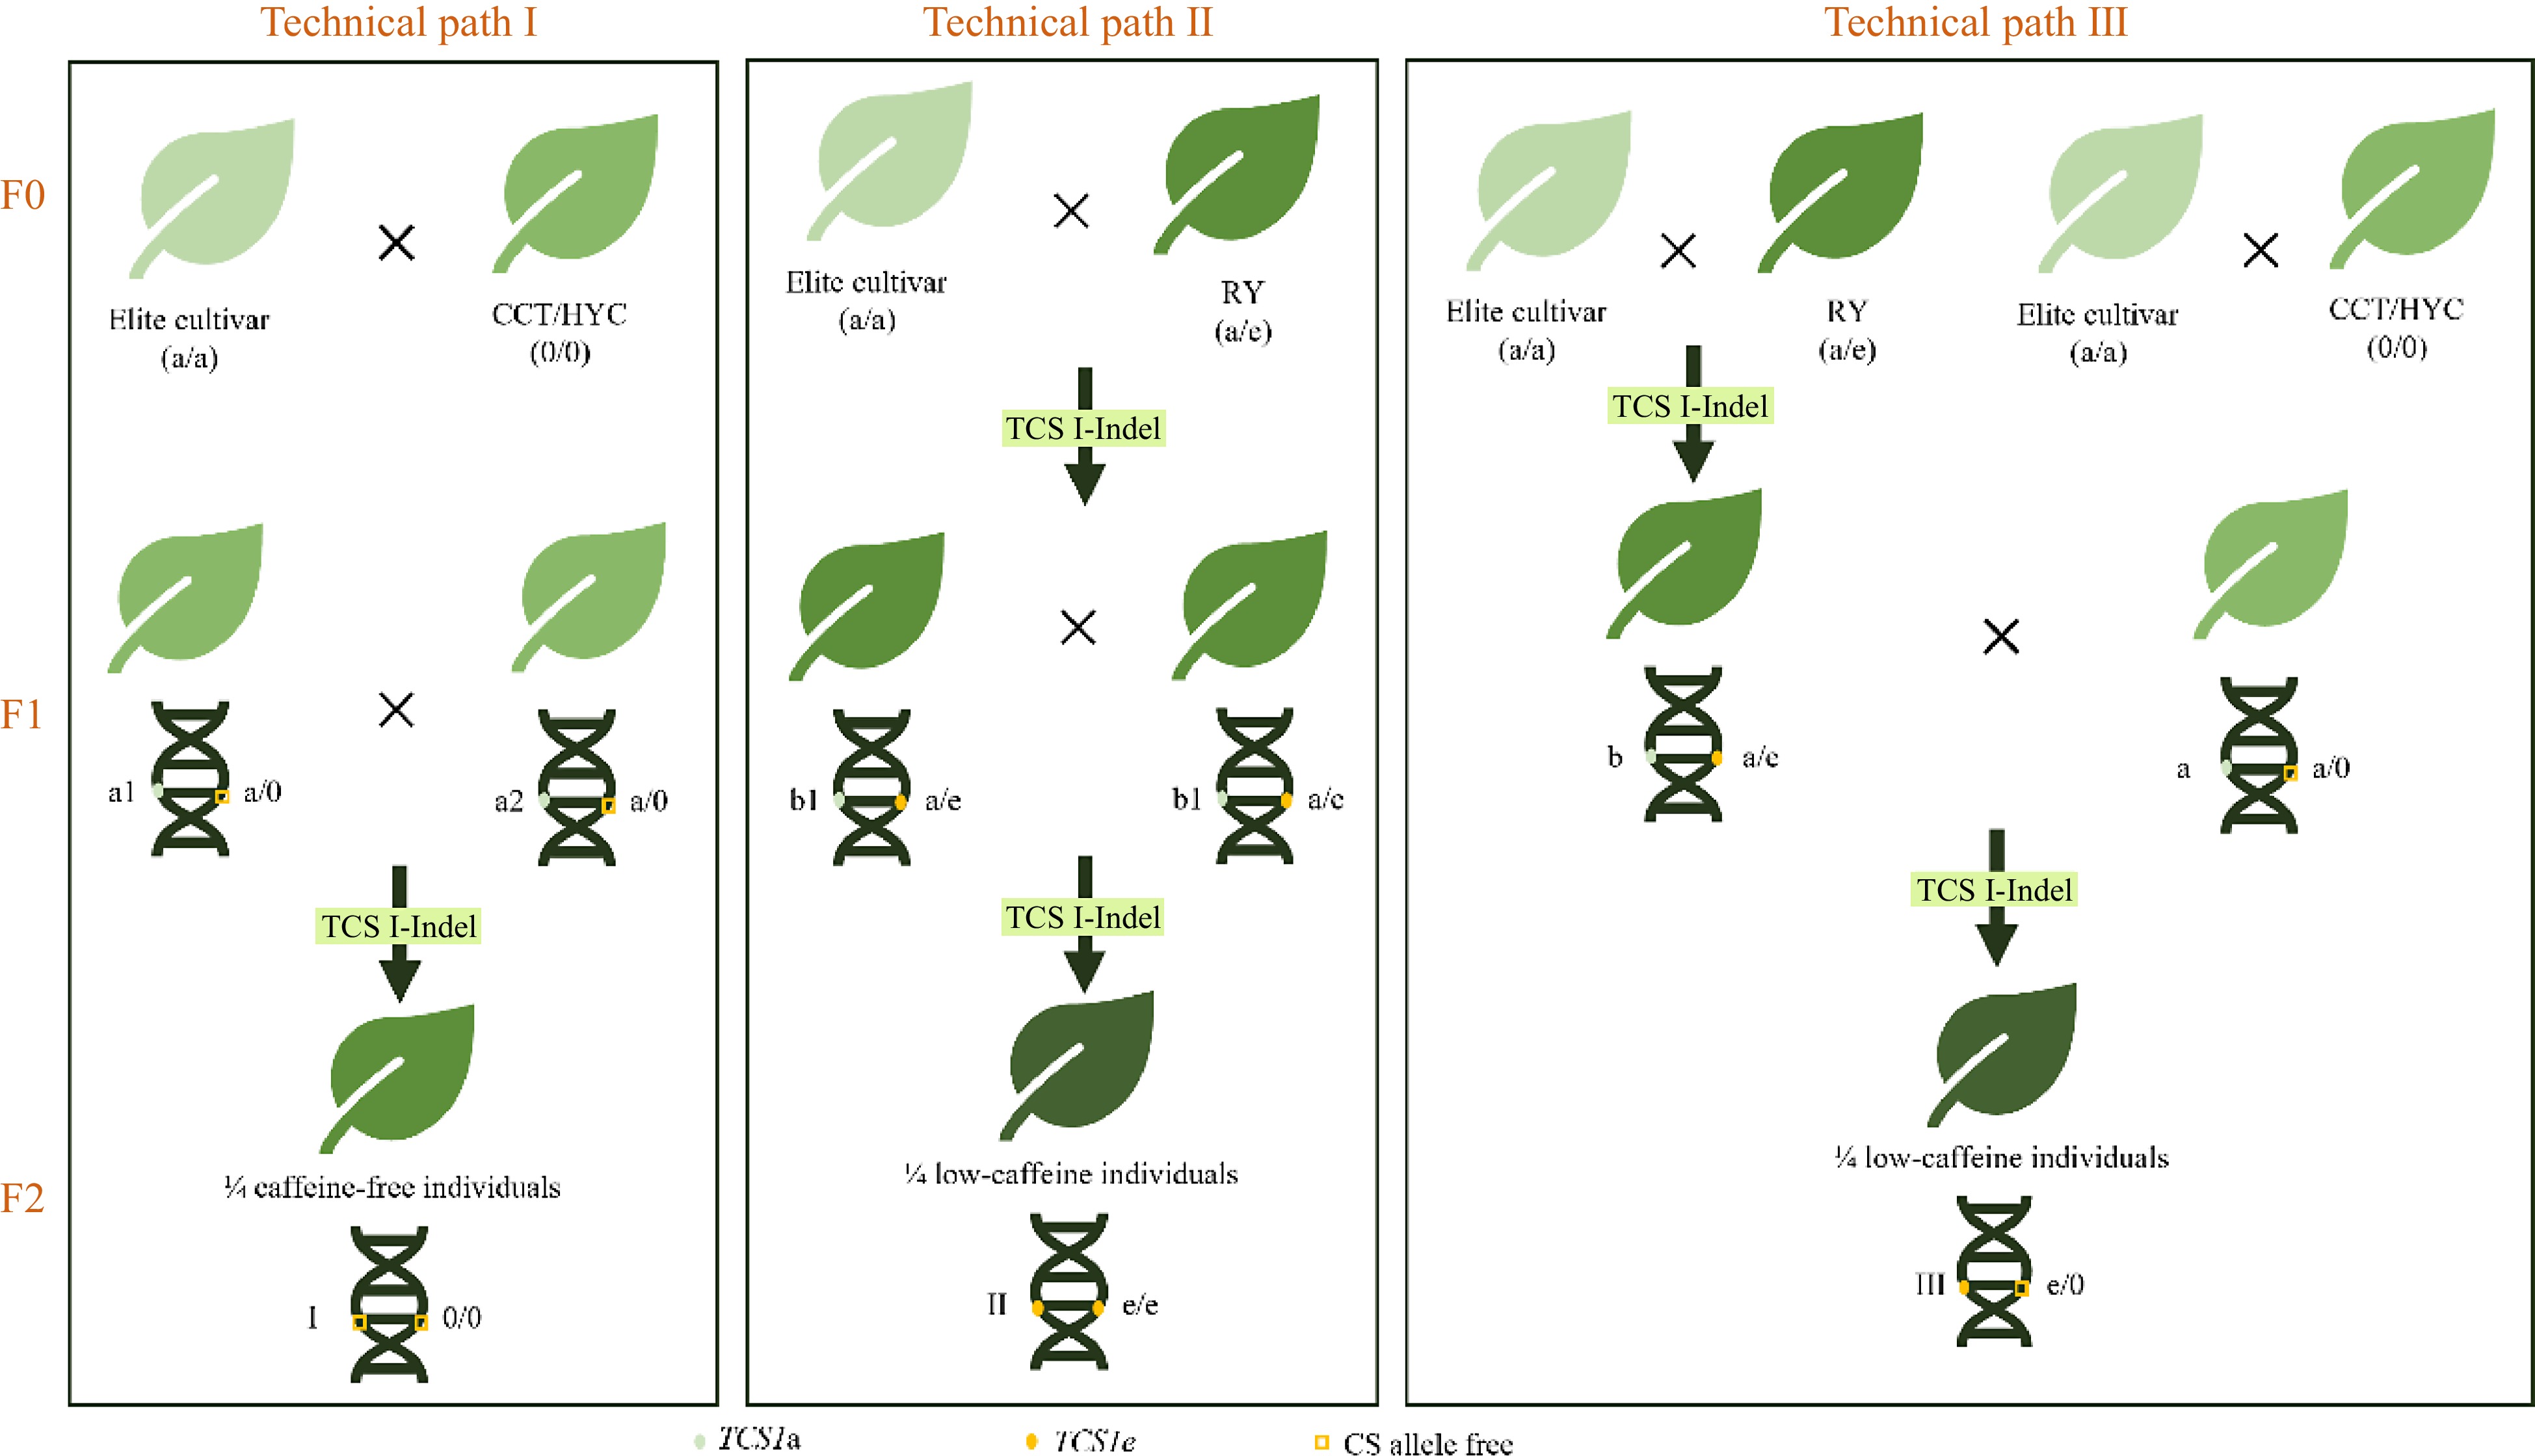
Figure 5.
Route map of three low caffeine tea plant breeding technologies. CCT, 'Cocoa tea', a caffeine-free tea plant from Guangdong, China; HYC, 'Hongyacha', a naturally caffeine-free tea plant from Fujian, China; RY, 'Ruyuan', which contains low caffeine. (Data source is from Wang et al.[81]).
-
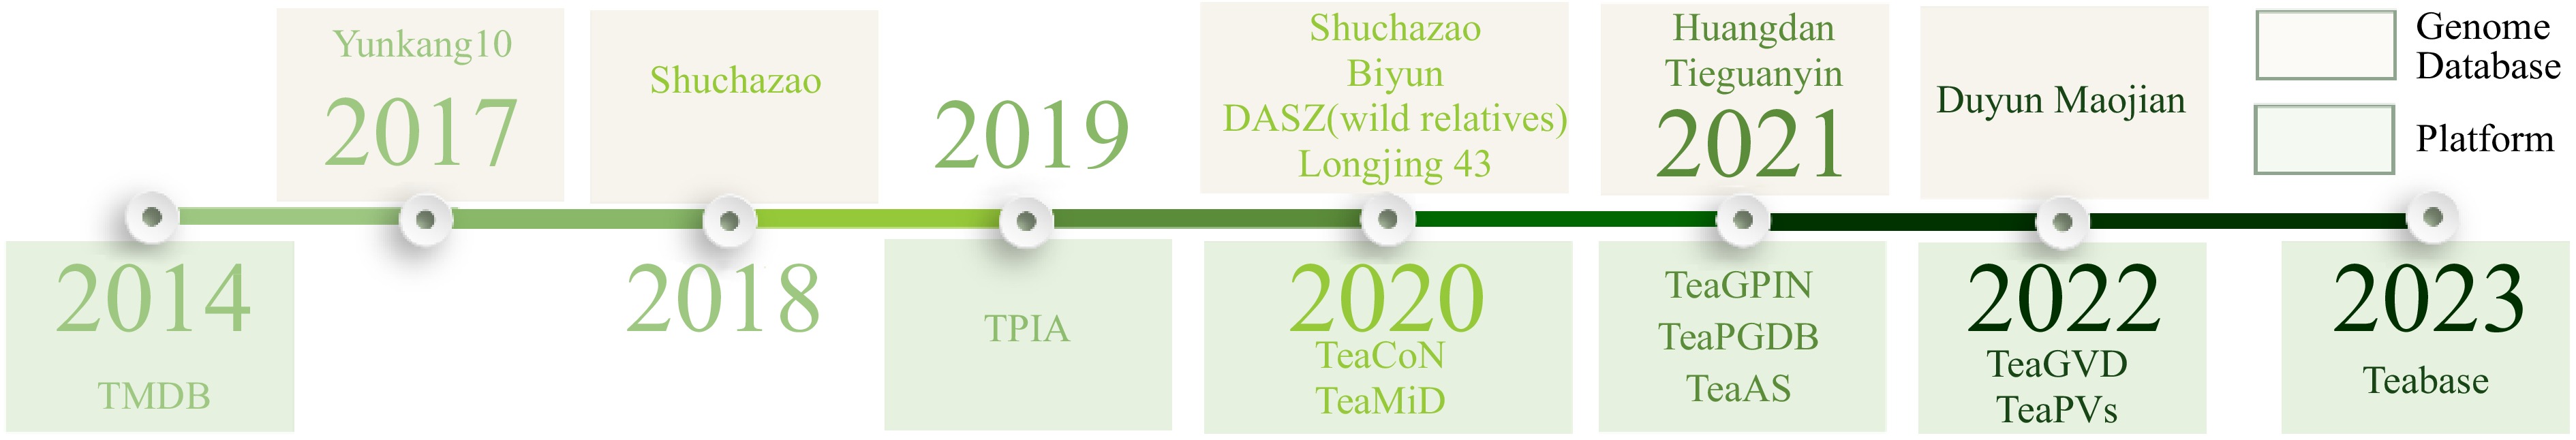
Figure 6.
Timeline of research on tea plant genome databases and platforms.
-
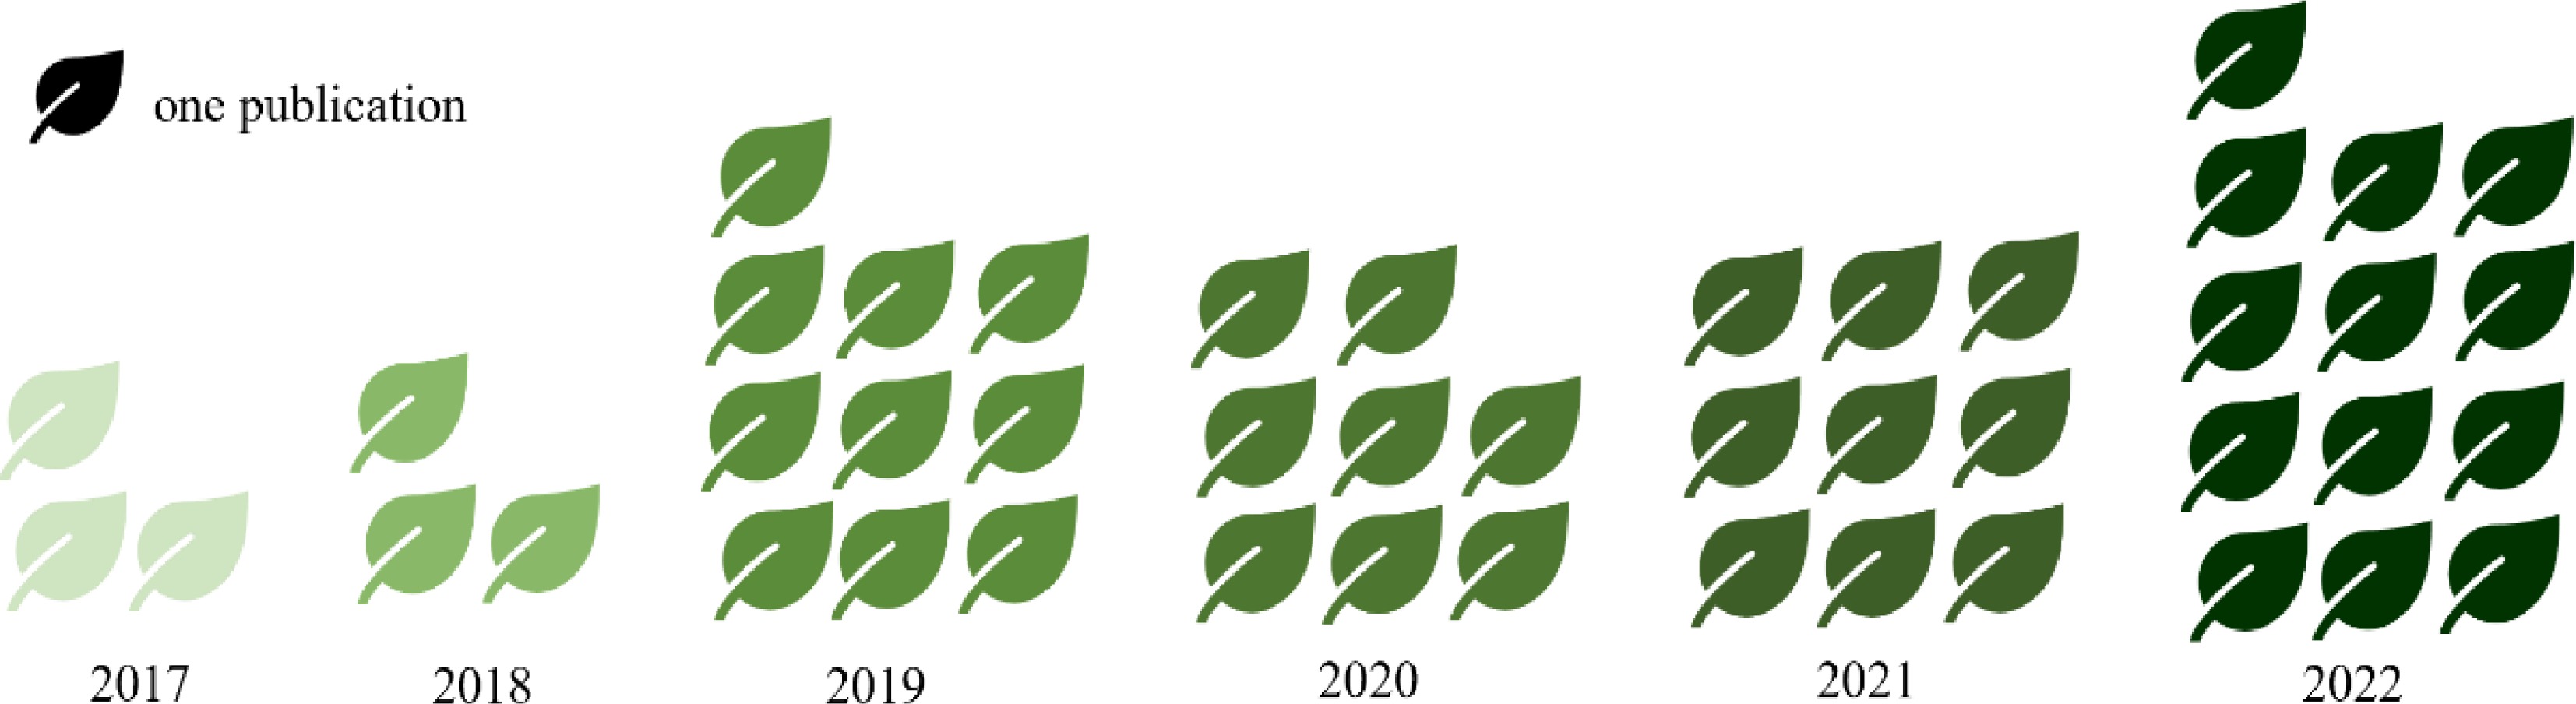
Figure 7.
Growing number of articles on tea plant GWAS. The number of articles is implied by the amount of tea plants. All data were obtained from the web of science (
www.webofscience.com ) by searching the terms 'tea plants' and 'genome-wide association study'. -
No. Mapping population
(♂ × ♀)Population
sizeMarker type Markers Linkage
groupsTotal length
(cM)Average distance
(cM)Ref. 1 Yabukita 46 RAPD 23 6 − − [16] Shizu-Inzaysu131 36 6 − − 2 Sayamakaori 54 RAPD 126 14 1550 11.7 [27] Kana-CK17 140 17 1640 3 SFS150 90 RAPD/AFLP 126 15 1349.7 11.7 [28] TN14/3 − 4 Qimen 4 69 AFLP 208 17 2457.7 11.9 [29] Chaoan Dawuye 200 16 2545.3 5 Fuding Dabaicha 94 RAPD/ISSR 62 6 1180.9 15.7 [30] 6 TRI2043 141 SSR 139 15 1018 2.9 [31] TRI2023 173 15 1192.9 7 Sayamakari 64 SSR/RAPD/CAPS/STS 571 17 3091 1.93 [32] Kana-CK17 632 15 3314 8 TRFCA SFS150 42 RAPD/AFLP/SSR 69 15 1012 14.1 [33] AHP S15/10 31 19 399.5 9 Sayamakaori 54 SSR/RAPD/CAPS/STS 701 15 1305 1.93 [34] Kana-CK17 701 15 1298 10 Longjing43 170 SSR 237 15 1156.9 5.2 [35] Baihaozao 11 Yingshuang 183 SSR 406 15 1143.5 3.0 [17] Beiyue Danzhu 12 Yingshuang 148 SNP/SSR 6448 15 3965 1.0 [36] Beiyue Danzhu 13 Longjing 43 170 SSR 483 15 1226.2 2.5 [22] Baihaozao 14 Wuniuzao 174 SSR 175 16 1156.9 7.4 [37] Longjing 43 15 Fushun 79 RAPD/AFLP/SSR 678 − 1441.6 4.7 [38] Kemsull 16 TRFK 303/577 109 DArT-seq 187 15 1028.1 1.1 [25] GW Ejulu GW Ejulu 152 190 15 1026.6 TRFK 303/577 17 Longjing 43 327 SNP 417 15 1678.52 0.4 [19] Baihaoza 18 Ziyan 176 SNP 131 15 1062.7 9.48 [18] 19 Jinxuan 96 SNP 8956 15 1490.81 0.18 [24] Yuncha1 20 Shuchazao 327 SNP 5325 15 2107.21 0.39 [39] Longjing 43 21 Emei Wenchun 294 SNP 4244 15 1449.19 0.34 [23] 22 Longjing 43 198 SNP 2688 15 1846.32 0.69 [20] Baijiguan 23 Huangdan 148 SNP 3770 15 1754.57 0.47 [21] Jinxuan Table 1.
Summarized papers of genetic map information in tea plants.
-
QTL mapping GWAS mapping Artificial populations with trait separation Natural populations with rich variation Bi-parental crosses de-novo crossing and selfing Less prone to false positives High possibility of false positives Fewer markers required A larger number of individuals is required Limited number of genotypes and
low allele richnessAbundant alleles but low allele frequency Lower resolution based on the number of recombination High possibility of phenotypic variation More robust in heterogeneity but single genetic basis High map density but low heritability Table 2.
The main characteristics of GWAS mapping and QTL mapping.
Figures
(7)
Tables
(2)